Embed Size (px)
Citation preview

Rapid Synthesis
Identifying How Area-based Socio-economic Indicators are Measured in Canada
29 March 2019


McMaster Health Forum
1
Evidence >> Insight >> Action
Rapid Synthesis: Identifying How Area-based Socio-economic Indicators are Measured in Canada
30-day response
29 March 2019

Identifying How Area-based Socio-economic Indicators are Measured in Canada
2 Evidence >> Insight >> Action
McMaster Health Forum and Forum+ The goal of the McMaster Health Forum, and its Forum+ initiative, is to generate action on the pressing health- and social-system issues of our time, based on the best available research evidence and systematically elicited citizen values and stakeholder insights. We aim to strengthen health and social systems – locally, nationally, and internationally – and get the right programs, services and products to the people who need them. In doing so, we are building on McMaster’s expertise in advancing human and societal health and well-being.
Authors
Mathieu J.P. Poirier, PhD, Centre for Health Economics and Policy Analysis, McMaster University Michael G. Wilson, PhD, Assistant Director, McMaster Health Forum, and Associate Professor, McMaster University
Timeline Rapid syntheses can be requested in a three-, 10-, 30-, 60- or 90-business-day timeframe. This synthesis was prepared over a 30-business-day timeframe. An overview of what can be provided and what cannot be provided in each of the different timelines is provided on McMaster Health Forum’s Rapid Response program webpage (www.mcmasterforum.org/find-evidence/rapid-response).
Funding
The rapid-response program through which this synthesis was prepared is funded by the British Columbia Ministry of Health. The McMaster Health Forum receives both financial and in-kind support from McMaster University. The views expressed in the rapid synthesis are the views of the authors and should not be taken to represent the views of the British Columbia Ministry of Health.
Conflict of interest The authors declare that they have no professional or commercial interests relevant to the rapid synthesis. The funder played no role in the identification, selection, assessment, synthesis or presentation of the research evidence profiled in the rapid synthesis.
Merit review
The rapid synthesis was reviewed by a small number of policymakers, stakeholders and researchers in order to ensure its scientific rigour and system relevance.
Acknowledgments
The authors wish to thank Jim Dunn and Emmanuel Guindon for their insightful comments and suggestions.
Citation
Poirier MJP, Wilson MG. Rapid synthesis: Identifying how area-based socio-economic indicators are measured in Canada. Hamilton, Canada: McMaster Health Forum, 29 March 2019.
Product registration numbers ISSN 2292-7999 (online)

McMaster Health Forum
3 Evidence >> Insight >> Action
KEY MESSAGES Questions • How are area-based socio-economic indicators (ABSI) measured in Canada? • What data are used to construct ABSI in Canada? Why the issue is important • Neighbourhood (or area-based) effects on health have been demonstrated to have an independent association with
health and welfare outcomes. • Independent Canadian research teams have created at least 13 different ABSIs using different data and
methodologies. • However, to decide which Canadian ABSI(s) to use, policymakers need an assessment of the data and the methods
needed to measure and construct them. • Given this, the British Columbia Ministry of Health has requested this rapid synthesis to collect and synthesize
evidence about how to measure and construct ABSIs in Canada. What we found • We identified one recent medium-quality systematic review, 20 single studies (16 cross-sectional studies, 2
prospective cohort studies and 2 retrospective cohort studies) and 28 documents (primarily grey literature reports) that provide descriptions of how ABSIs are measured in Canada, including the data needed to construct them.
• The Pampalon index is the most widely cited Canadian ABSI, followed by the Canadian Marginalization Index (CAN-Marg) and Socio-Economic Factor Index (SEFI), with other prominent indices including the Socio-Economic Risk Index (SERI), Ontario Marginalization Index (ON-Marg), Labour Cost Index (LCI), Early Child Development Mapping Project (EC-Map), Overall Regional Socio-Economic Index (ORSEI), Vancouver Area Neighbourhood Deprivation Index (VANDIX), and the Community Well-Being Index (CWB).
• Every major Canadian ABSI draws data from the Canadian census or the National Household Survey except for the ORSEI, which draws from a regional population estimation model compiled by BC Stats.
• Principal components analysis (PCA) is by far the most common way of calculating Canadian ABSIs, and other methods include standardized weighted sums, survey-based, geozones, and rough sets approaches.
• The Pampalon and SEFI indices opt to keep a predetermined number of PCA components, while CAN-Marg, LCI, and EC-Map opt to examine the variance explained by each component before deciding how many components to keep.
• There is debate over whether data on ethnic identity, self-identification as a visible minority, or immigration status should be included in ABSI calculations.
• There is mixed evidence about the extent of correlation between different ABSIs with other measures of socio-economic status (SES) such as household income and education level.
• There is a strong association with all ABSIs and health outcomes, but no one index has been demonstrated to be the strongest predictor of health.
• Indices with more components often explain a greater amount of variance in health outcomes but do so at the expense of simplicity and interpretability.
• The social component of the Pampalon index demonstrated a concerning lack of association with health and welfare outcomes in at least six studies.
• All ABSIs are prone to the modifiable area unit problem (MAUP) given that larger areas become more socio-economically homogenous, which can disguise underlying small-area inequalities.
• ABSIs are focused on exposures in individuals’ residential environments, which means they are unable to account for individual differences in time allocation to their residential environments versus their work or leisure environments, and therefore researchers using ABSIs should be aware of possible confounding effects of spatial autocorrelation.
• For ABSIs that aim to measure well-being of Indigenous communities, it has been strongly suggested that researchers must move towards a “two-eyed seeing approach” in which both Western and Indigenous methods are used as complements where Indigenous communities are involved in the design of future ABSIs.

Identifying How Area-based Socio-economic Indicators are Measured in Canada
4 Evidence >> Insight >> Action
QUESTIONS • How are area-based socio-economic indicators (ABSI)
measured in Canada? • What data are used to construct ABSI in Canada?
WHY THE ISSUE IS IMPORTANT Socio-economic status (SES) is (based on the definition from BC Stats) a measure of the economic and social status of an individual or group of individuals based on education, income, occupation, and other relevant indicators, relative to other members of the population.(1) Given that it is an indicator of several important determinants of health, SES is a crucial variable to consider in developing and evaluating any policies, programs and services designed to enhance the health of individuals or populations. However, many data sources do not have individual SES measures, which require the use of geographical proxy measures. For population-based analyses, area-based socio-economic indicators (ABSIs) are needed given that they allow for the measurement and tracking of area-level effects of SES on health.
While area-level effects on health and welfare have long been recognized as important, the publication of the Black Report and Townsend’s identification of the effects of social and material deprivation on health ushered in a new era of area-based deprivation measurement.(2; 3) Whether conceptualized as deprivation or SES, researchers have begun the work of teasing out the independent effects of area-level SES on health from an individual-level SES. However, despite the widespread use of and interest in using ABSIs, there has been no systematic search and synthesis of the various ways ABSIs have been created in Canada, and how these methodological choices affect their performance. Given this, the British Columbia Ministry of Health has requested this rapid synthesis to collect and synthesize evidence about how to measure and construct ABSIs in Canada.
WHAT WE FOUND We identified one recent medium-quality systematic review,(4) and 20 single studies which included 16 cross-sectional studies,(5-20) two prospective cohort studies,(21; 22) and two retrospective cohort studies.(23; 24) We also included 28 documents (primarily grey literature reports) that provide
Box 1: Background to the rapid synthesis This rapid synthesis mobilizes both global and local research evidence about a question submitted to the McMaster Health Forum’s Rapid Response program. Whenever possible, the rapid synthesis summarizes research evidence drawn from systematic reviews of the research literature and occasionally from single research studies. A systematic review is a summary of studies addressing a clearly formulated question that uses systematic and explicit methods to identify, select and appraise research studies, and to synthesize data from the included studies. The rapid synthesis does not contain recommendations, which would have required the authors to make judgments based on their personal values and preferences. Rapid syntheses can be requested in a three-, 10-, 30-, 60- or 90-business-day timeframe. An overview of what can be provided and what cannot be provided in each of these timelines is provided on the McMaster Health Forum’s Rapid Response program webpage (https://www.mcmasterforum.org/find-evidence/rapid-response) This rapid synthesis was prepared over a 30-business day timeframe and involved four steps: 1) submission of a question from a policymaker
or stakeholder (in this case, the British Columbia Ministry of Health);
2) identifying, selecting, appraising and synthesizing relevant research evidence about the question;
3) drafting the rapid synthesis in such a way as to present concisely and in accessible language the research evidence; and
4) finalizing the rapid synthesis based on the input of at least two merit reviewers.
Box 1: Identification, selection and synthesis of research evidence We identified research evidence (systematic reviews and primary studies) by searching (in February 2019) Medline, EconLit, Social Systems Evidence, and Érudit. In Medline we searched using the filter for reviews and with publication dates between 2004 and February 2019, and with the following sets of terms: 1) (Area-based and socioeconomic).af.; (Area-based and economic); (neighborhood and socioeconomic); and (neighborhood and economic) AND (Area-based and socioeconomic and Canada); (Area-based and economic and Canada); (neighborhood and socioeconomic and Canada); and (neighborhood and economic and Canada). In EconLit we searched (neighborhood and economic and Canada); Area-based AND (socioeconomic status or poverty or low income) AND (review of literature or literature review or meta-analysis or systematic review); neighborhood AND (socioeconomic ) AND (review of literature or literature review or meta-analysis or systematic review ); neighborhood AND (socioeconomic status or poverty or low income) AND (review of literature or literature review or meta-analysis or systematic review); neighborhood AND (socioeconomic ) AND (Canada); and neighborhood AND (socioeconomic status or poverty or low income) AND (Canada) with limit Published Date: 20040101-. No relevant studies were found on Social Systems Evidence. Érudit was searched with (Tous les champs : indice) ET (Tous les champs : défavorisation) ) ET (Publié depuis 2004) ET (Fonds : ['Érudit', 'UNB']) and (Tous les champs : socio-economique) ET (Tous les champs : territoriales) ET (Tous les champs : indice) ET (Publié depuis 2004) ET (Fonds : ['Érudit', 'UNB']). In addition to our searches of electronic databases, we searched the Canadian Institute for Health Information (CIHI), and searches of each province’s Ministry of Health and statistics ministries were conducted for any grey literature that included methodological details related to ABSIs. The results from the searches were assessed by one reviewer for inclusion. A document was included if it fit within the scope of the questions posed for the rapid synthesis. For each systematic review we included in the synthesis, we documented the focus of the review, key findings, last year the literature was searched (as an indicator of how recently it was conducted), methodological quality using the AMSTAR quality appraisal tool (see the Appendix for more detail), and the proportion of the included studies that were conducted in Canada. For primary research (if included), we documented the focus of the study, methods used, a description of the sample, the jurisdiction(s) studied, key features of the intervention, and key findings. We then used this extracted information to develop a synthesis of the key findings from the included reviews and primary studies.

McMaster Health Forum
5 Evidence >> Insight >> Action
descriptions of how ABSI are measured in Canada, including the data needed to construct them.(25-52) We provide details of our searches in Box 1. In reviewing the search results, we included documents: 1) published from January 2004 to present; 2) focused on Canadian populations; 3) written in English or French; and 4) focused on evaluating ABSI methods or on comparing two or more ABSIs (articles that only applied
ABSIs to an empirical question and studies without a geographical dimension were excluded); and 5) focused on measuring ABSIs either at a provincial or national level (city- or neighbourhood-specific
indices were not included). Below, we provide a profile of existing Canadian ABSIs which was primarily generated using grey literature, and a summary of evaluations of ABSIs which was primarily generated from a systematic review and single studies. We provide a detailed overview of each of the 13 Canadian ABSIs that we identified in Table 1. In addition to this, details from each of the included documents are provided in Appendix 1 (for systematic reviews) and Appendix 2 (for single studies). Profile of Canadian ABSIs The Pampalon index (also referred to as the material and social deprivation index - MSDI) is the most widely used and cited ABSI in Canada. First developed for use in Québec by the Institut national de santé publique du Québec (INSPQ) in 1991, the index is based on a two-dimensional model of deprivation proposed by Townsend.(2; 25) The index itself is calculated by conducting a principal components analysis (PCA) (an approach to transform a set of possibly correlated variables into a smaller set of uncorrelated variables called principal components) of six variables, of which the first two components are kept. Because the first component is primarily the function of factor loadings on education level, employment and average income, this component is referred to as a “material index”. The second principal component is referred to as the “social index” and has larger factor loadings on variables that measure persons living alone, persons separated, widowed or divorced, and single-parent families.(26) All variables are first age- and sex-adjusted using the province as the reference population.(37) Areas of relative deprivation are often identified by identifying regions that fall in the bottom quintile (or bottom two quintiles) of both the material and social indices.(46)
The Pampalon index has been incorporated into routine monitoring of health inequalities in Québec and has been re-created nationally for every census conducted since it was created in 1991.(47) This includes the 2011 census, which replaced the long-form census that covered 20% of households that year and the National Household Survey (NHS) which covered a voluntary sample of 30% of households. Despite fears that this would render comparisons over time impossible, the 2011 version of the Pampalon index does not appear to be disproportionately missing information from high- or low-income groups or have limited dissemination area (DA) reordering (DAs are areas of 400-700 people and are the smallest geographic area in which census data are disseminated). In addition, the article from Pampalon et al. indicates that it continues to be able to detect social inequalities in health which they suggest to mean that the changes in census methodology did not adversely affect the index’s performance.(48) Earlier changes in census methodology also allowed for a shift from enumeration areas (EAs) in 1991 and 1996 to smaller DAs in 2001, 2006 and 2011.(26; 37) This shift has resulted in a small increase in the amount of variation predicted over time because smaller DAs are more heterogeneous than the larger EAs.(26) However, it is worth noting that significant concerns have been raised about the NHS data quality, including significant relaxation of data suppression criteria to account for missing data.(53; 54)
One of the primary competing Canadian ABSIs is the Canadian Marginalization Index (CAN-Marg Index), which has also been developed into the Ontario Marginalization Index (ON-Marg index). CAN-Marg was developed to show differences in marginalization between areas to understand inequalities in health and well-being using four dimensions: residential instability, material deprivation, ethnic concentration and dependency.(49) The original 2001 index was created by selecting 42 census-based variables from a literature
Identifying How Area-based Socio-economic Indicators are Measured in Canada
6 Evidence >> Insight >> Action
review, selecting the 18 variables with PCA eigenvalues greater than one (Table 1), and using the factor loadings to construct four separate indices for each dimension. (49) Data are available for 2001, 2006 and 2011 at the DA and census tract (CT) levels. Scores can either be used to stratify populations using the raw factor score (which has no meaningful scale) by using pan-Canadian quintiles, or by creating a summary score from some or all of the four CAN-Marg dimensions.(49) The ON-Marg index is available for 2001, 2006, 2011 and 2016 and was created using the same methods and four dimensions of marginalization as the CAN-Marg index.(50; 51) However, rather than using the voluntary 2011 NHS, the ON-Marg opted to use alternative Ontario-specific data sources, which did not appear to lead to large changes in the indices.(50)
Another long-standing provincial ABSI is Manitoba’s Socio-Economic Factor Index (SEFI) and updated SEFI-2, which are based on the original Socio-economic Risk Index (SERI). The SERI was originally developed for the Population Health Information System by the Manitoba Centre for Health Policy and Evaluation (MCHPE) in 1991. The SERI was calculated at the Regional Health Authority (RHA) level using six dimensions of socio-economic characteristics – dwelling characteristics, educational attainment, employment, income, mobility and social characteristics.(52) Variables within these categories were selected by regressing against an index of five population-health indicators, resulting in six variables within these categories that explain the maximum amount of variation in the health index. The weighted sum of these variables was then divided by the square root of the sum of squares of the correlation coefficients, resulting in a scale in standard deviation units.(27; 28)
Building on the SERI, a new index was constructed using similar variables at the census sub-divisions (CSD) and enumeration area (EA) levels called the SEFI. Unlike the SERI, however, the SEFI was calculated using the first principal component factor from a PCA on the standardized value (mean/variance) values of the six census variables.(29) The most recent iteration of MCHPE-derived indices is the SEFI-2, which was calculated from a reduced set of four variables at the DA, CSD, RHA, RHA district, and CA levels using the same PCA approach.(30) Information from First Nations Communities with no census data available are also inputted into the SEFI-2. The main differences between the two measures include the inclusion of a directly measured income variable (which was previously unavailable due to data issues), the smallest level of geographic aggregation (DA versus EA), and the number of variables used to construct the indices.
Two related ABSIs have been used to measure SES in Alberta – the Living Conditions Index (LCI) and Early Childhood Map (EC-Map) index. The creator of the EC-Map index (34) chose to use PCA rather than competing methods because of the ability to sum information from a more comprehensive set of data sources, and because it avoids problems associated with aggregation, standardization, and non-linear relationships between variables. The EC-Map index is based on 26 variables from the 2006 census aggregated at the DA level that were determined to be commonly used in other ABSIs in a literature search. Variables were transformed using several statistical techniques to ensure linear relationships and within-variable normality (i.e., whether variables fit a normal distribution). The first five factors of the PCA were retained, and the raw index score was standardized to a 0-100 scale.(34) The LCI is a very similar measure that was constructed to measure inter-community disparities in children’s developmental outcomes based on a bio-ecological theory framework.(33) A separate literature search for input data resulted in 18 variables from seven categories that were previously linked with children’s health outcomes, including several indices based on Theil’s T statistics (a statistic primarily used to measure economic inequality). The data was aggregated at the DA level for Alberta using census data. Following a robustness exercise comparing results for range equalization and division by mean methodologies, PCA using the top-five components ultimately resulted in the largest inter-quintile disparity and was chosen as the preferred method.(33)
There have been two primary ABSIs developed for use in British Columbia – the Vancouver Area Neighbourhood Deprivation Index (VANDIX) and the Overall Regional Socio-Economic Index (ORSEI). The ORSEI was developed in 1999 through a consultation between BC Stats and external consultants, resulting in the selection of four dimensions of human and economic hardship, crime, health problems, education concerns, children at risk, and youth at risk at the DA and local health area (LHA) levels. The index is calculated by dividing the difference between the median data observation and the region of study by the

McMaster Health Forum
7 Evidence >> Insight >> Action
inter-quartile range for the variable, after which each of the variables making up the index dimensions are assigned analytical weights resulting in a value ranging from 0 to 1, after which the process is repeated to obtain a composite index summarizing all analytical dimensions.(35; 38; 39) This methodology does not allow for temporal analysis because a drop in index value over time for any given region does not necessarily indicate an actual drop in living standards.(35) Unlike many other indices, the data underlying the index come from a regional population estimation model conducted by BC Stats rather than census data.(35) An updated index using a one- or two-stage PCA approach with bootstrapped standard errors and 2006 census data has also been proposed by the UBC Centre for Health Services and Policy Research.(1)
A competing British Columbian index is the VANDIX, which is based on a 2005 survey of provincial health officers, asking which 2001 census variables they believed best characterized health and socio-economic outcomes within the province.(17) The 21 variables selected through the survey process fell within the categories of material wealth, housing tenure, family demographics, mobility, educational attainment, employment or cultural identity. A standardized proportional weight was then applied to each variable according to the strength of agreement of survey respondents, and the summed data aggregated at the CT and DA level.(17) An update to this original methodology has kept only the variable with the highest importance weight per category to produce an additive index from the standardized (z-score) values.(40)
The Community Well-Being Index (CWB) was developed specifically to measure SES among Indigenous populations by researchers at Indian and Northern Affairs Canada (INAC). The original index was constructed at the CSD level using 2001 census data based on the same categories of education, income, labour force and housing used by the Human Development Index (HDI).(41) The composite index is weighted and rescaled to allow for an additive index to be bounded by 0 and 1.(42) The CWB was updated in 2006 with minor changes in weighting and rescaling methodology, allowing reasonable comparisons to be made over time from 1981 to 2011 and extending analysis to Inuit communities.(43) Although more multifaceted than previous usage of income alone, the CWB is recognized as still being based on a non-Indigenous conception of well-being, and as such represents an imposed and colonial measure of SES among Indigenous populations rather than a truly Indigenous methodology.(10; 41-43)
Three other competing alternatives to national indices have been proposed but not independently evaluated. The first is from Chan et al.,(18) who used a literature search of determinants of health outcomes related to environmental pollution. Data from the 2006 census were used and the first three components of a PCA broadly relating to: 1) social advantage and high material ownership; 2) high material ownership and economic advantage; and 3) social disadvantage and specific cultural identities. Each component was then extracted and averaged at the DA level.(18) The second proposed alternative involves the creation of “geozones”, which are calculated from threshold tables comparing a specific sub-group of an area’s population with the reference population, after which a cut-off point classifying ABSI values can be created.(8) The third proposal involves grouping discrete sets of variable combinations through “rough set” methodology. By grouping these discrete sets of variables for each area unit, problems associated with non-linear associations can be overcome to produce a more unbiased ABSI.(9)

Identifying How Area-based Socio-economic Indicators are Measured in Canada
8 Evidence >> Insight >> Action
Table 1. List of the most commonly used ABSIs in Canada
Full name Abbreviation Creators Details Indicators used
Canadian Marginalization Index
Can-Marg Matheson, Dunn, Smith, Moineddin, & Glazier (7)
Jurisdictions available: All of Canada Years available: 1991, 1996, 2001 and 2006 Geographic level: CT and DA Data source: Census
Residential instability 1) Proportion living alone 2) Proportion of youth population aged 5-15 3) Average number of persons per dwelling 4) Proportion of multi-unit housing 5) Proportion of the population that is married/common-law 6) Proportion of dwellings that are owned 7) Proportion of residential mobility (same house as 5 years ago) Material Deprivation 8) Proportion 25+ without certificate, diploma or degree 9) Proportion of lone-parent families 10) Proportion government transfer payment 11) Proportion unemployment 15+ 12) Proportion below low-income cut-off 13) Proportion of homes needing major repair Dependency 14) Proportion of seniors (65+) 15) Dependency ratio (0-14 + 65+)/(15-64) 16) Labour force participation rate (aged 15 and older) Ethnic concentration 17) Proportion of 5-year recent immigrants 18) Proportion of visible minority
Canadian socio-economic status index for the study of health outcomes related to environmental pollution
Chan index Chan, Serrano, Chen, Stieb, Jerrett, and Osornio-Vargas (University of Alberta) (18)
Jurisdictions available: All of Canada Years available: 2006 Geographic level: DA Data source: Census
High-material ownership 1) Home ownership 2) Car, truck or van for commute Low-material ownership 3) Rent accommodation 4) Public transportation use Socially advantaged 5) Marital status 6) One-family households Economically advantaged 7) Employment rate 8) Median income 9) Certificate, diploma or degree Socially disadvantaged 10) Single, widowed or divorced 11) Multiple family households 12) Lone-parent families Economically disadvantaged 13) Prevalence of low income after taxes 14) No certificate, diploma or degree

McMaster Health Forum
9 Evidence >> Insight >> Action
Full name Abbreviation Creators Details Indicators used
Indication of potential children’s environmental hazard 15) Construction of home ≤1946 to 1970 16) Construction of home 1971–1990 17) Construction of home 1991–2006 Cultural identities 18) Very high-sum HDI 19) High-sum HDI 20) Medium-sum HDI 21) Low-sum HDI 22) Aboriginal status
Community Well-Being Index
CWB Penney, O’Sullivan, & Senécal (Aboriginal Affairs and Northern Development Canada) (43)
Jurisdictions available: First Nations, Inuit and other Canadian communities Years available: 1981, 1991, 1996, 2001, 2006 and 2011 Geographic level: CSD Data source: Census, NHS (2011)
Income 1) Total income per capita Education 2) Proportion with high school certificate 3) Proportion with university degree Housing 4) Ratio of persons to rooms 5) Dwellings needing repair Labour force activity 6) Labour force participation 7) Employment rate
Socio-economic Factor Index
SEFI-2 Manitoba Centre for Health Policy (20)
Jurisdictions available: All of Canada (originally Manitoba) Years available: 2001, 2006 and 2011 Geographic level: DA, CSD, RHA, RHA district and CA Data source: Census, NHS (2011)
1) Average household income 2) Unemployment rate for labour force population aged 15 years and older 3) Proportion of population 15 years and older without high school graduation 4) Proportion of single-parent families
Québec index of material and social deprivation
Pampalon index
Pampalon, Hamel, & Raymond (Institut national de santé publique du Québec) (19)
Jurisdictions available: All of Canada (originally Québec) Years available: 1991, 1996, 2001, 2006, 2011, 2016 Geographic level: EA and DA Data source: Census, NHS (2016)
Material component 1) Proportion of people aged 15 years and older with no high school diploma 2) Population/employment ratio of people aged 15 years and older 3) Average income of people aged 15 years and older Social component 4) Proportion of individuals aged 15 years and older living alone 5) Proportion of individuals aged 15 years and older whose marital status is either
separated, divorced or widowed 6) Proportion of single-parent families

Identifying How Area-based Socio-economic Indicators are Measured in Canada
10 Evidence >> Insight >> Action
Full name Abbreviation Creators Details Indicators used
Overall Regional Socio-Economic Index
ORSEI BC-Stats (35) Jurisdictions available: British Columbia Years available: 1999 and 2012 Geographic level: CD and LHA Data source: BC Stats
Human economic hardship 1) Per cent population age 0 and over on income assistance one year or more 2) Per cent of population age 0 and over on income assistance <one year 3) Per cent seniors receiving maximum Guaranteed Income Supplement (GIS) Crime 4) Serious violent crime rates 5) Serious property crime rates 6) Number of serious crimes per police officer Health problems 7) Potential years of life lost due to natural causes, per 1,000 population 8) Potential years of life lost due to accidental causes, per 1,000 population 9) Potential years of life Lost due to suicide/homicide, per 1,000 population Education concerns 10) Per cent of population age 25-54 without post-secondary credentials, 2006 11) Per cent of 18-year-olds who did not graduate 12) Grade 12 provincial math exam non-completion rate 13) Grade 12 provincial English exam non-completion rate 14) Per cent of students below standard in Grade 4 reading, writing and math Children at risk 15) Per cent of population age 14 and under on income assistance one year or more 16) Per cent of population age 14 and under on income assistance <one year 17) Children in care per 1,000 population age 0-18 18) Infant mortality rate, per 1,000 live births 19) Per cent of students below standard in reading – Grades 4 and 7 20) Serious juvenile crime rates, per 1,000 population age 12-17 Youth at risk 21) Per cent of population age 15-24 on income assistance one year or more 22) Per cent of population age 15-24 on income assistance <one year 23) Per cent of 18-year-olds who did not graduate 24) Total serious crime rate
Alternative approach to measuring ORSEI
ORSEI (alt) Vincent & Sutherland (UBC Centre for Health Services and Policy Research) (1)
Jurisdictions available: British Columbia Years available: 2006 Geographic level: DA and LHA Data source: Census
Education 1) Highest level of educational attainment ages 15-24: below high school 2) Highest level of educational attainment ages 15-24: college (no university degree) 3) Highest level of educational attainment ages 25-64: college (no university degree) 4) Highest level of educational attainment ages 25-64: bachelor’s degree 5) Highest level of educational attainment ages 65+: below high school 6) Highest level of educational attainment ages 25-64: post-bachelor’s degree/diploma; Employment 7) Unemployment rate, all ages and sexes 8) Participation rate, all ages and sexes 9) Participation rate, aged 15-24 and all sexes Income 10) Median income, all ages and sexes Housing

McMaster Health Forum
11 Evidence >> Insight >> Action
Full name Abbreviation Creators Details Indicators used
11) Per cent of occupied dwellings that are tenant-occupied Social 12) Proportion of households with one occupant
Vancouver Area Neighbourhood Deprivation Index
VANDIX Bell & Hayes (40) Jurisdictions available: British Columbia (originally Vancouver) Years available: 2006 Geographic level: DA Data source: Census
Material wealth 1) Average total income Housing 2) Proportion of persons owning their home Demographics 3) Percent of lone-parent families among all census families Education 4) Percent of residents without high school completion 5) Percent of residents with a university degree Employment 6) Unemployment rate of population aged 15 years and over 7) Ratio of those 15 years and over working or seeking work to the total population
Early Child Development Mapping Project
EC-Map Krishnan (University of Alberta) (34)
Jurisdictions available: Alberta Years available: 2006 Geographic level: DA Data source: Census
Economic system 1) Value of owner-occupied private, non-farm, non-reserve dwelling 2) Median income in 2005 of population aged 15 or older 3) Families with less than <$20,000 or those with at least $50,000 annual income 4) Government transfer payments in 2005 for all economic families 5) Population aged 15 or older with no certificate/diploma/degree 6) Population 15 or older in managerial or professional occupations Social system 7) Population aged under 15 or 65+ to total population aged 15-64 8) Population 15 or older divorced/separated 9) Lone-parent families in census families 10) Population aged 65 or older living alone 11) Number of rooms per dwelling 12) Owner-occupied private dwellings 13) Economic families with a low income after tax in 2005 14) In-migration rate Cultural system 15) Recent immigrants in the population 16) Population with British or French ethnic background 17) Population born outside of Canada 18) Employed persons aged 15 or older using public transit Vulnerable group membership 19) Couples married with three or more children 20) Owner-occupied private dwellings in need of major repair 21) Population 15 or older unemployed 22) Population identified as Indian/Métis/Inuit 23) Population 15 or older doing 60+ hours unpaid work weekly Child care 24) Population aged 0-4 in the total population

Identifying How Area-based Socio-economic Indicators are Measured in Canada
12 Evidence >> Insight >> Action
Full name Abbreviation Creators Details Indicators used
25) Females 15 or older in the labour force 26) Population 15 or older doing 60+ hours unpaid childcare weekly
Living Conditions Index
LCI Krishnan, Betts, & Wang (University of Alberta) (33)
Jurisdictions available: Alberta Years available: 2006 Geographic level: DA Data source: Census
Economic diversity 1) Female after-tax Theil's T1 2) Female employment Theil's 3) Male after-tax Theil's T 4) Male employment Theil's T Housing 5) Household size 6) Per cent one-family households 7) Per cent divorced/separated 8) Per cent family five plus persons 9) Per cent walk/bike/motorbike to work Education 10) Per cent 15-64 illiteracy 11) Per cent 25-64 post-secondary education 12) Per cent aboriginal population Minority population 13) Per cent visible minority 14) Per cent third generation 15) Per cent immigrated before age 14 Dependent population (wording taken directly from original source) 16) Children under age 5 out of population 15 plus with no income 17) Children under 14 years at home of all children home 18) Population 15 plus providing unpaid care to seniors
Socio-economic Factor Index
SEFI Manitoba Centre for Health Policy (29)
Jurisdictions available: Manitoba Years available: 1996 Geographic level: EA and CSD Data source: Census
1) Age Dependency Ratio 2) Proportion of female single-parent families 3) Proportion of population with High School Graduation Composite 4) Unemployment Rate Composite 5) Proportion of single-parent families 6) Female Labour Force Participation Rate
Socio-economic Risk Index
SERI Manitoba Centre for Health Policy (52)
Jurisdictions available: Manitoba Years available: 1986 and 1991 Geographic level: RHA Data source: Census
1) Per cent of labour force unemployed aged 15-24 2) Per cent unemployed aged 45-54 3) Per cent single-parent households 4) Per cent aged 25-34 having graduated high school 5) Per cent female labour force participation 6) Value of owner-occupied dwellings
1 Theil’s T is an entropy-based measure of inequality that can easily be decomposed into sub-group.

McMaster Health Forum
13 Evidence >> Insight >> Action
Full name Abbreviation Creators Details Indicators used
ON-Marg ON-Marg Matheson & van Ingen (Ontario Agency for Health Protection and Promotion) (50)
Jurisdictions available: Ontario Years available: 2001, 2006, 2011 and 2016 Geographic level: DA, CT, CD, CSD, LHIN, LHIN sub-region, public-health units, and consolidated municipal service areas Data source: Census, NHS (2011)
Residential instability 1) Proportion of the population living alone 2) Proportion of the population who are not youth (age 5-15) 3) Average number of persons per dwelling 4) Proportion of dwellings that are apartment buildings 5) Proportion of the population who are single/divorced/widowed 6) Proportion of dwellings that are not owned 7) Proportion of the population who moved during the past five years Material deprivation 8) Proportion of the population aged 20+ without a high-school diploma 9) Proportion of families who are lone-parent families 10) Proportion of the income from government transfer payments 11) Proportion of the population aged 15+ who are unemployed 12) Proportion of the population considered low income 13) Proportion of households living in dwellings that are in need of major repair Dependency 14) Proportion of the population who are aged 65 and older; 15) Dependency ratio (total population 0-14 and 65+/total population 15 to 64 ) 16) Proportion of the population not participating in labour force (aged 15+) Ethnic concentration 17) Proportion of the population who are recent immigrants (arrived in the past five
years) 18) Proportion of the population who self-identify as a visible minority

Identifying How Area-based Socio-economic Indicators are Measured in Canada
14 Evidence >> Insight >> Action
Evaluations of Canadian ABSIs As noted earlier, key findings from evaluations of Canadian ABSIs were derived from the recent medium-quality systematic review and the 21 single studies that we identified. While primary studies were not formally assessed for quality using a checklist or tool they were critically evaluated for concordance between quantitative results and authors’ conclusions, and then synthesized thematically. The various ways that Canadian ABSIs are constructed can have a large influence on how these indices perform. By far the most common way of calculating ABSIs is with PCA. The first general approach is to set a pre-specified number of PCA components to keep in the analysis, whether it is only the first component as in the SEFI, or the first two components as in the Pampalon index.(19; 29) The other approach is to examine the variance explained by different numbers of components and decide how many to keep based on a screen plot (i.e., a line plot of the eigenvalues of factors or principal components in an analysis) or other statistical judgment.(7; 33; 34) If more than one component is retained, a qualitative description of the largest factor loadings comprising the component are usually assigned (e.g., as a “material component” or “housing/family structure”).(19) Two competing methods of calculating indices differ for similar reasons, which is to overcome assumptions of data normality and the use of linear regression techniques with nonlinear data. These alternative methods claim advantages of producing more nuanced distributional results,(8) and overcoming assumptions of linear functional form of cross-dimensional associations.(9) One debate surrounds the question of whether to include ethnic identity or immigration status in the ABSI variable list. Chan et al. argue, for example, that rather than generic categories of self-identifying as a visible minority or recent immigrant, specific ethnic identities allow for a more disaggregated analysis.(18) Other authors agree, citing findings relating to both native language and recent immigration’s independent effects on future educational outcomes as an important nuanced finding.(16) Pampalon et al. (19) acknowledge that this can be seen as a weakness of their index, which does not allow analysts to form an explanatory social framework around ethnicity and other social determinants of health. Others caution that overly simplistic conceptions of cultural identity and social deprivation may result in ABSIs that are not generalizable from one population to another.(4) Once constructed, Canadian ABSIs can be compared to other measures of SES, whether individual or area-based. Zandy et al. (5) found that the Pampalon index was associated with lower inequality levels of age-standardized mortality rates than both area-based employment rates and mean household income. MacWilliam et al. (23)on the other hand found that using the SEFI-2 in a multilevel model for predicting academic performance results in more variation explained than using area-based household income. Yet another study found very poor agreement between quintiles ranked by DA-level income and individual-level income, which may explain some of the mixed findings linking ABSIs to household income.(14) The SEFI-2 and Pampalon index were very similarly associated with self-rated health in Manitoba.(20) The VANDIX is unique in that it is one of the few ABSIs to be entirely based on survey responses from health professionals about which variables to include. Despite this local input, both the Pampalon index and the SEFI appear to have at least as high of an association with self-rated health and more accurately identify areas of known deprivation in Vancouver.(17) Health outcomes are also commonly used as dependent variables by which to compare ABSIs. One systematic comparison of the predictive power of the Pampalon index, CAN-Marg, SEFI-2, and EC-Map with early childhood development indicators found that ABSIs with more variables and sub-indices explained more inter-regional variation in outcomes, although this came at the expense of simplicity and interpretability.(13) Once composite indices were calculated for each alternative, the EC-Map index remained the highest performing index, while the Pampalon index performed almost as well while minimizing complexity of interpretation. Matheson et al. (44) cite multiple dimensions as a strength of the CAN-Marg index, demonstrating that some health outcomes are linked to distinct dimensions. Another systematic comparison of the ability of several Canadian ABSIs to predict premature mortality rate (PMR), life expectancy, and potential years of life lost (PYLL) found the SEFI, SEFI-2, and Pampalon index to be

McMaster Health Forum
15 Evidence >> Insight >> Action
associated with ill health in the expected direction, with the SEFI and SEFI-2 indices resulting in the strongest correlations.(30) Despite these associations between ABSIs and health, and the technical feasibility of linking ABSIs to electronic medical records,(11) a team that attempted to create a predictive model of preterm birth using an ABSI composed of both income and the Pampalon index was unable to reduce false positive rates enough to produce a clinically useful tool.(22) It should be noted that a recurring finding among studies using the Pampalon index was that the material component was found to be more predictive than the social component for health outcomes, and in many cases the social component has little to no association with outcomes of interest.(5; 11; 19; 20; 25; 30) The results are not consistent across studies that a re-evaluation of the utility of the social component of the Pampalon index should be considered. At the very least, analysts using the Pampalon index should be aware of questions surrounding the performance of the Pampalon social component before deciding to use the index. Moving beyond comparing ABSIs, there are many reasons to consider the theoretical implications of choices made in constructing these measures. One clear decision that must be made with ABSIs relates to the geographic level of aggregation and considering the potential effects of the modifiable area unit problem (MAUP). There is inconsistent evidence on whether individual- or ABSI-based health inequalities are larger, but it is clear that both levels (individual and area) have independent causal links with many health and social outcomes.(6; 12; 16; 22; 23; 45) Depending on the research question and methods used, differences between individual and area-level SES indicators may be due to ecological fallacy from cross-level inference, or else may be informative data to be used in multi-level models.(53) As for the MAUP, authors routinely caution against a bias of underestimating inequalities in rural areas due to the larger census divisions in these regions,(9; 19; 25) and that whether large or small, the areas demarcated by census tracts may not be representative of lived communities.(15; 45) Despite these warnings, evidence from Montreal demonstrates that lived communities are considered when demarcating census tracts and, as a result, “naturally defined” neighbourhoods and official census tracts have remarkably similar associations with health.(54) Researchers using ABSIs should be aware that there may be spatial autocorrelation (how close objects are in comparison with other close objects), where areas near other low-SES areas are significantly more deprived than would be expected.(12) A separate issue is that most ABSIs operate under the assumption that residential postal code is an accurate representation of the areas in which a person spends most of their time, while in fact, much of the time we spend at work and in social life may be in an entirely different area. The only Canadian study of this effect on ABSIs found that populations residing in the most deprived areas and with the least education also spent the most time in other deprived areas, while those residing in higher-SES areas spent more time in a diversity of deprivation levels.(21) The importance of non-residential neighbourhood effects depends on whether ABSIs are used to measure area-level effects, or whether they are used as proxies for individual SES. Finally, the use of ABSIs in Indigenous communities and among Indigenous peoples across Canada poses a very important challenge. Not only have infant mortality rates among Indigenous communities been found to be double the rate of non-Indigenous communities, these disparities have been shown to be modified by area-based education and income levels.(24) While there are ways in which ABSIs could lead to improved decision-making and supports for populations that have been colonized and oppressed for generations, there are many potential issues with the way Canadian ABSIs have been used in the past. Drawson et al. (10) present a very clear example of omitted variable bias at the area level, demonstrating that researchers could easily link greater traditional language use to poor community well-being in Indigenous communities with a simple regression. However, once controlling for the highly correlated variable of community remoteness, the association becomes non-significant. This effect may partially explain why both Chan et al. and Chokie et al. found no association between Indigenous identity and deprivation after accounting for a series of control variables.(12; 18) In addition to these potential biases, there has been a general indifference towards incorporating Indigenous methodologies and epistemologies into ABSI measurement in the past.(4) Incorporating a “two-eyed seeing approach” in which both Western and Indigenous methods are used as complementary methods and involving Indigenous communities themselves in the development of Canadian ABSIs are two necessary steps in moving towards reconciliation.(10)

Identifying How Area-based Socio-economic Indicators are Measured in Canada
16 Evidence >> Insight >> Action
REFERENCES
1. Vincent K, Sutherland J. A review of methods for deriving an index for socioeconomic status in British Columbia. Vancouver; 2013.
2. Townsend P. Deprivation. Journal of Social Policy 1987;16(02): 125.
3. McCartney G, Collins C, Mackenzie M. What (or who) causes health inequalities: Theories, evidence and implications? Health Policy 2013;113(3): 221-7.
4. Fu M, Exeter D, Anderson A. “So, is that your ‘relative’ or mine?” A political ecological critique of census-based area deprivation indices. Social Science Medicine 2015;142: 27-36.
5. Zandy M, Li, Zhang R, Kao D, Fahra R, Turcotte K. Area-based socioeconomic disparities in mortality due to unintentional injeury and youth suicide in British Columbia, 2009-2013. Policy and Practice 2019;39(2): 2009-13.
6. Allin S, Pichora E, Perumal N, Jin J, Catley C, Polsky J. Comparing individual and area-based income measures: Impact on analysis of inequality in smoking, obesity, and diabetes rates in Canadian 2003-2013. Canadian Journal of Public Health 2018;109(3): 410-8.
7. Matheson F, Dunn J, Smith K, Moineddin R, Glazier R. Development of the Canadian Marginalization Index: A new tool for the study of inequality. Canadian Journal of Public Health 2012;103(2): S12-6.
8. Peters P, Oliver L, Carriere G. Geozones: An area-based method for analysis of health outcomes. Health Reports 2012;23(1): 55-64.
9. Dumedah G, Schuunerman N, Yang W. Minimizing the effects of scale distortion for spatially grouped census data using rough sets. Journal of Geographic Systems 2008;10(1): 47-69.
10. Drawson A, Mushquash A, Mushquash C. First Nations community well-being research and large data sets: A respectful caution. International Journal of Indigenous Health 2017;12(2): 15.
11. Biro S, Williamson T, Leggett J, Barber D, Morkem R, Moore K. Utility of linking primary care electronic medical records with Canadian census data to study the determinants of chronic disease: An example based on socioeconomic status and obeisity. BMC Medical Informatics and Decision Making 2016;16(1): 1-8.
12. Chokie M, Partridge M. Low-income dynamics in Canadian communities: A place-based approach. Growth and Change 2009;2008(39): 2.
13. Webb S, Janus M, Duku E, Raos R, Brownell M, Forer B. Neighbourhood socioeconomic status indices and early childhood development. Population Health 2017;3: 48-56.
14. Hanley G, Morgan S. On the validity of area-based income measures to proxy household income. BMC Health Services Research 2008;8: 1-7.
15. Schuunerman N, Bell N, Dunn J, Oliver L. Deprivation indices, population health and geography: An evaluation of the spatial effectiveness of indices at multiple scales. Journal of Urban Health 2007;84(4): 591-603.
16. Oliver L, Dunn J, Kohen D, Hertzman C. Do neighbourhoods influence the readiness to learn of kindergarten children in Vancouver? A multilevel analysis of neighbourhood effects. Environment and Planning 2007;39(4): 848-68.
17. Bell N, Schuunerman N, Oliver L, Hayes M. Towards the construction of place-specific measures of deprivation: A case study from the Vancouver metropolitan area. Canadian Geographer 2007;51(4): 444-61.

McMaster Health Forum
17 Evidence >> Insight >> Action
18. Chan E, Serrano J, Chen L, Steib D, Jerrett M, Osornio-Vargas A. Development of a Canadian socioeconomic status index for the study of health outcomes related to environmental pollution. BMC Public Health 2015;15(1): 1-8.
19. Pampalon R, Hamel D, Gamache P, Philibert M, Raymond G, Simpson A. An area-based material and social deprivation index for public health in Quebec and Canada. Canadian Journal of Public Health 2012;103(8 Supplemental 2): S17-22.
20. Chateau D, Metge C, Prior H, Soodeen R. Learning from the census: The socio-economic factor index (SEFI) and health outcomes in Manitoba. Canadian Journal of Public Health 2012;103(Supplemental 2): 23-7.
21. Shareck M, Kestens Y, Frohlich K. Moving beyond the residential neighbourhood to explore social inequalities in exposure to area-level disadvantage: Results from the interdisiplinary study on inequalities in smoking. Social Science Medicine 2014;108: 106-14.
22. Adhikari K, Pattern S, Williamson T, Patel A, Premji S, Tough S. Does neighbourhood socioeconomic status preduct the risk of preterm birth? A community-based Canadian cohort study. British Medical Journal Open 2019;9(2).
23. MacWilliam L, Walld R, Edgerton J, Roos L, Hiebert B, de Rockquigny J. What is most important: Social factors, health selection, and adolescent educational achievement. Social Indicators Research 2011;110(1): 385-414.
24. Martens P, Wu Y, Luo Z, Wassimi S, Simonet F, Heaman M. Neighbourhood socioeconomic characteristics, birth outcomes and infant mortality among First Nations and non-First Nations in Manitoba, Canada. Open Journal of Women’s Health 2010;4(2): 55-61.
25. Pampalon R, Hamel D, Gamache P. A comparison of individual and area-based socio-economic data for monitoring social inequalities in health. Health Reports 2009;20(4): 85-94.
26. Pampalon R, Gamache P, Hamel D. The Quebec Index of Material and Social Deprivation: Methodological follow-up, 1991-2006. Montreal; 2011.
27. Norman F, Mustard C. Socio-economic characteristics. Winnipeg; 1994.
28. Frohlich N, Carriere K. Issues in developing indicators for needs-based funding. Winnipeg; 1997.
29. Manitoba Centre for Health Policy. Constructing the SEFI (1996) score. Winnepeg; 2001.
30. Medge C, Chateau D, Prior H, Soodeen R, de Coster C, Barre L. Composite measures/indices of health and health system performance. Winnepeg; 2009.
31. Manitoba Centre for Health Policy. Concept: Socioeconomic factor index (SEFI). Winnipeg; 2014.
32. Manitoba Centre for Health Policy. Comparison of SEFI and SEFI-2. Winnipeg; 2009.
33. Krishnan V, Betts S, Wang X, editors. Living conditions index (LCI): A context-based measure to understand children’s developmental outcomes. Hawaii International Conference on Social Sciences; 2012; Honolulu.
34. Krishnan V. Constructing an area-based socioeconomic status-index: A principle components analysis approach. Edmonton; 2010.
35. BC Stats. British Columbia regional socio-economic indicators: Methodology. Victoria; 2013.
36. BC Stats. Regional socio-economic indicators - External review. Victoria; 1999.
37. Pampalon R, Hamel D, Raymond G. Indice de defavorisation pour l’etude de la sante et du bien-etre au Quebec - Mise a jour 2001. Montreal; 2001.
38. BC Stats. Index value calculation - Regional socio-economic indicators. Victoria; 1999.
39. BC Stats. Sensitivity analysis - Weights. Victoria; 1999.

Identifying How Area-based Socio-economic Indicators are Measured in Canada
18 Evidence >> Insight >> Action
40. Bell N, Hayes M. Vancouver area neighbourhood deprivation index. Canadian Journal of Public Health 2012;103(Supplement 2): 528-32.
41. McHardy M, O’Sullivan E. First Nations community well-being in Canada: The community well-being index 2001. Ottawa: Indian and Northern Affairs Canada; 2004.
42. Cooke M. The First Nations Community Well-Being Index: A conceptual review. Ottawa; 2005.
43. Penney C, O’Sullivan E, Senecal S. The Community Well-Being Index: Examining well-being in Inuit communities, 1981-2006. Ottawa; 2012.
44. Matheson F, Dunn J, Smith K, Moineddin R, Glazier R. Creating the Canadian Marginalization Index. Toronto; 2012.
45. Denny K, Davidson M. Area-based socio-economic measures as tools for health disparities research, policy and planning. Canadian Journal of Public Health 2012;103(2).
46. Pampalon R, Philibert M, Hamel D. Developpement d’un systeme d’evaluation de la defavorisation des communaites locales et des clienteles de CLSC. Montreal; 2004.
47. Pampalon R, Hamel D, Alix C, Landry M. A strategy and indicators for monitoring social inequalities in health in Quebec. Montreal; 2013.
48. Gamache P, Hamel D. The challenges of updating the deprivation index with data from the 2011 census and the National Household Survey. Montreal; 2017.
49. Matheson F, Dunn J, Smith K, Moineddin R, Glazier R. Canadian Marginalization Index (CAN-Marg) user guide Toronto; 2006.
50. Matheson F, Dunn J, Smith K, Moineddin R, Glazier R. Ontario Marginalization Index: User guide. Toronto; 2006.
51. Matheson F, Datta S, editors. Overview of the Ontario Marginalization Index (ONmarg). Conference of the Association of Public Health Epidemiologists in Ontario; 2011; Horseshoe Valley.
52. Manitoba Centre for Health Policy. Socio-economic Risk Index (SERI) Concept Description. Winnipeg; 2001.
53. Verret F. The estimation methodology of the 2011 National Household Survey. Ottawa; 2013.
54. Hamel M, Laniel N. Producing official statistics via voluntary surveys - The National Household Survey in Canada. Statistical Journal of the IAOS 2014;30(3): 237-42.

McMaster Health Forum
19 Evidence >> Insight >> Action
APPENDICES The following tables provide detailed information about the systematic reviews and primary studies identified in the rapid synthesis. The ensuing information was extracted from the following sources:
• systematic reviews - the focus of the review, key findings, last year the literature was searched, and the proportion of studies conducted in Canada; and • primary studies - the focus of the study, methods used, study sample, jurisdiction studied, key features of the intervention and the study findings
(based on the outcomes reported in the study). For the appendix table providing details about the systematic reviews, the fourth column presents a rating of the overall quality of each review. The quality of each review has been assessed using AMSTAR (A MeaSurement Tool to Assess Reviews), which rates overall quality on a scale of 0 to 11, where 11/11 represents a review of the highest quality. It is important to note that the AMSTAR tool was developed to assess reviews focused on clinical interventions, so not all criteria apply to systematic reviews pertaining to delivery, financial or governance arrangements within health systems. Where the denominator is not 11, an aspect of the tool was considered not relevant by the raters. In comparing ratings, it is therefore important to keep both parts of the score (i.e., the numerator and denominator) in mind. For example, a review that scores 8/8 is generally of comparable quality to a review scoring 11/11; both ratings are considered “high scores.” A high score signals that readers of the review can have a high level of confidence in its findings. A low score, on the other hand, does not mean that the review should be discarded, merely that less confidence can be placed in its findings and that the review needs to be examined closely to identify its limitations. (Lewin S, Oxman AD, Lavis JN, Fretheim A. SUPPORT Tools for evidence-informed health Policymaking (STP): 8. Deciding how much confidence to place in a systematic review. Health Research Policy and Systems 2009; 7 (Suppl1):S8). All of the information provided in the appendix tables was taken into account by the authors in describing the findings in the rapid synthesis.
Identifying How Area-based Socio-economic Indicators are Measured in Canada
20 Evidence >> Insight >> Action
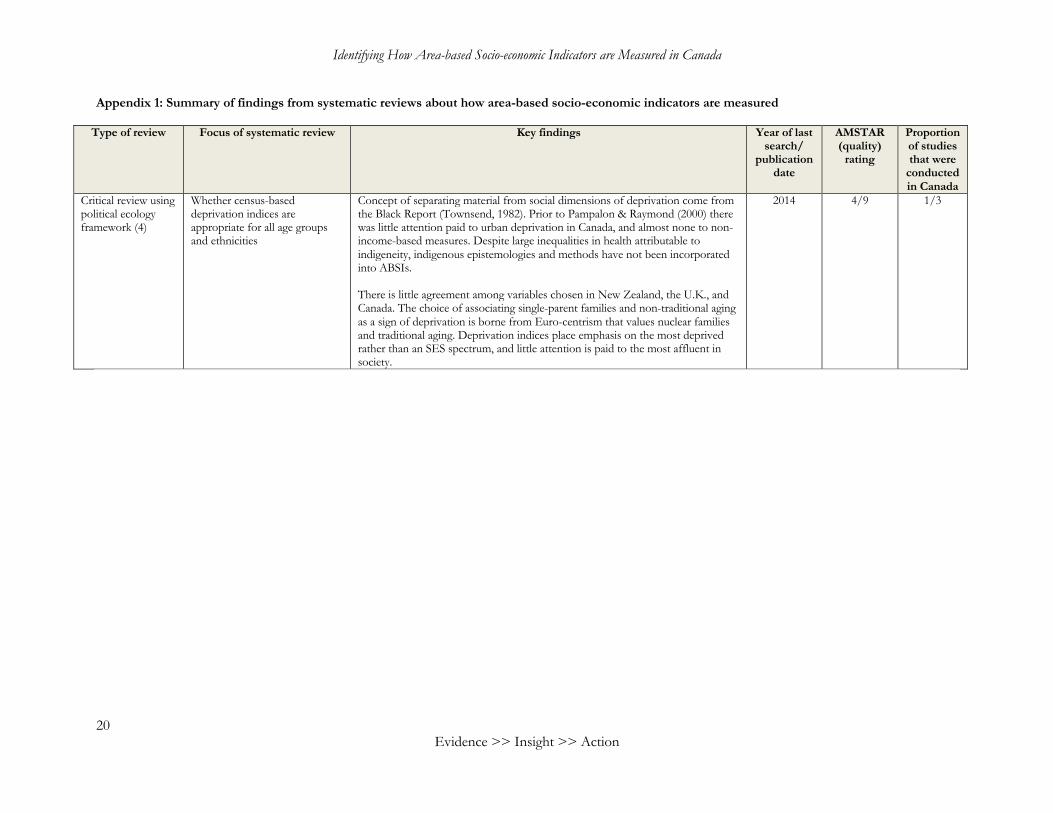
Appendix 1: Summary of findings from systematic reviews about how area-based socio-economic indicators are measured
Type of review Focus of systematic review Key findings Year of last search/
publication date
AMSTAR (quality)
rating
Proportion of studies that were
conducted in Canada
Critical review using political ecology framework (4)
Whether census-based deprivation indices are appropriate for all age groups and ethnicities
Concept of separating material from social dimensions of deprivation come from the Black Report (Townsend, 1982). Prior to Pampalon & Raymond (2000) there was little attention paid to urban deprivation in Canada, and almost none to non-income-based measures. Despite large inequalities in health attributable to indigeneity, indigenous epistemologies and methods have not been incorporated into ABSIs. There is little agreement among variables chosen in New Zealand, the U.K., and Canada. The choice of associating single-parent families and non-traditional aging as a sign of deprivation is borne from Euro-centrism that values nuclear families and traditional aging. Deprivation indices place emphasis on the most deprived rather than an SES spectrum, and little attention is paid to the most affluent in society.
2014 4/9 1/3

McMaster Health Forum
21
Appendix 2: Summary of findings from primary studies about how area-based socio-economic indicators are measured
Question addressed Focus of study Study characteristics Sample description Key features of the
intervention(s) Key findings
Comparing SES measures
To quantify health inequalities in British Columbia (5)
Publication date: 2019 Jurisdiction studied: British Columbia Methods used: Cross-sectional analysis (Disparity rate difference and disparity rate ratio) Index used: Pampalon
BC mortality data extracted from vital statistics for the period January 1, 2009 to December 31, 2013
To quantify socio-economic disparities in age-standardized mortality rates for four priority health areas
Age-standardized mortality rates (ASMRs) were calculated for quintiles of [Pampalon index] material and social deprivation, and for Local Health Area (LHA)-level income, education and employment levels. Statistically significant inequalities as measured by disparity rate difference and disparity rate ratio were found for every outcome of unintentional injury, mortality due to falls among seniors, transport-related inequality, and deaths from youth suicide. Of the two Pampalon index measures, material deprivation was found to be significantly associated with outcomes of unintentional injury, senior falls, and transport, while social deprivation only displayed a clear social gradient for the outcome of unintentional injury. For every outcome, material and social deprivation resulted in the lowest levels of inequality, while income or employment consistently resulted in the largest values.
Comparing SES measures
To compare individual income and ABSI-based health inequalities (6)
Publication date: 2018 Jurisdiction studied: Canada Methods used: Cross-sectional analysis (Kappa statistic, rate ratios, and rate differences) Index used: DA-level income
Adult respondents (aged 18+ years) to six consecutive CCHS cycles: 2.1 (2003), 3.1 (2005), 2007/2008, 2009/2010, 2011/2012 and 2013.
Comparing household-income quintiles with DA-level average income
There has been mixed evidence regarding whether ABSIs or individual-level income are associated with larger health inequalities in Canada. Household-level income and DA-level income were directly compared using weighted Kappa statistic, and quintile-specific health outcomes of diabetes diagnosis, smoking status, and obesity were calculated for individual- and area-level quintiles. There was poor concordance (0.2 Kappa) between the area level and individual SES measures for all survey cycles. There was a slightly higher level of inequality found using individual-level data (RR=2.05 versus 1.52) for diabetes, which were similar for smoking prevalence, and produced mixed results for obesity. Even though there is poor agreement between area-level and individual-level SES measures, both result in largely similar levels of health inequalities. Authors recommend using both levels if possible.
Comparing SES measures
To compare the four major Canadian ABSIs (13)
Publication date: 2017 Jurisdiction studied: Canada Methods used: Cross-sectional analysis (OLS regression) Index used: Pampalon index, CAN-Marg, SEFI and EC-Map
2,038 neighbourhoods with total population sizes of 355 to 95,295 people (based on the 2006 Census) and areas ranging from 0.42 to 792,320 square kilometres
To compare the association of early development outcomes with re-creations of the four primary Canadian ABSIs
The Early Development Instrument (EDI) is a measure of optimal childhood development that is comparable throughout Canada. Four ABSIs of Pampalon index, Can-Marg, SEFI-2, and EC-Map were compared to the outcome of proportion of neighbourhoods with vulnerable children (score in any of the five dimensions below 10% cut-off). Regressing each ABSI's sub-indices against the EDI, the EC-Map index had the largest adjusted R2 value (0.25), followed by the Pampalon index (0.17), CanMarg (0.17), and SEFI (0.16). All indices explained the most variance in Alberta and the least in Québec. Using the composite indices resulted in drops in R2 for indices with the most sub-indices, but EC-Map and Pampalon remained the best performers. The material indices of the Pampalon and CanMarg indices were the most highly predictive, but the social sub-index of the EC-Map index was the most important. There appears to be a trade-off between higher explanatory

Identifying How Area-based Socio-economic Indicators are Measured in Canada
22 Evidence >> Insight >> Action
Question addressed Focus of study Study characteristics Sample description Key features of the
intervention(s) Key findings
power of more variables and sub-indices with less interpretability. There were also clear links between indices that had language components and language-related outcomes.
Comparing SES measures
What childhood factors can predict future academic performance (23)
Publication date: 2013 Jurisdiction studied: Manitoba, Canada Methods used: Retrospective cohort (multilevel modelling) Index used: SEFI, income
41,943 records from a seven-year birth cohort (1982–1989) housed at the Population Health Research Data Repository at the Manitoba Centre for Health Policy (MCHP)
A multilevel model was developed to predict academic performance in 9th and 12th grades using individual, family, and neighbourhood characteristics
Health selection, where childhood health drives educational and social status in adulthood, may be affecting Canadian health trends. A series of health outcomes and social and economic controls were analyzed using a multilevel model of individual, family and neighbourhood characteristics, using a birth cohort with linked provincial administrative data. The variance explained by the multilevel model increases by 3.8% overall, and by 68.3% at the neighbourhood level with the addition of the SEFI scores. The use of family income at level 2 instead of the SEFI index at level 3 led to very similar results, although the use of a neighbourhood household-income average (level 3) performed slightly poorer than the SEFI index. Both family income and neighbourhood SEFI led to 23% reduction in prediction error variance. Authors conclude that a list of standardized indicators including the SEFI would be useful moving forward, and that family income may not be necessary if the SEFI is interchangeable.
Comparing SES measures
To quantify health inequalities among First Nations and non-First Nations in Manitoba using ABSIs (24)
Publication date: 2010 Jurisdiction studied: Manitoba Methods used: Retrospective cohort study Index used: EA-level income, education, unemployment, and lone-parent families
Excluded births (0.5%) with missing birth weight, gestational age, sex, or postal code of the usual place of residence, or with a gestational age <20 weeks or birth weight <500 grams, leaving 155,799 births (26,176 First Nations, 129,623 non-First Nations) remaining
Measuring inequalities in birth and child health outcomes using four ABSI constructs among First Nations and non-First Nations in Manitoba
Despite known higher rates of adverse health outcomes and lower SES of First Nations in Canada, no study has used ABSIs to investigate health inequalities among this population in Canada. A birth was considered First Nations if the mother or father self-identified as First Nations on the live birth certificate. EA-level data from 1996 for income (household-size adjusted income per single person equivalent), education (per cent of adults who had not completed high school), unemployment (per cent unemployed in the work force), and lone-parent families (per cent of single-parent families among all families with children at home) were used. Neighbourhood-level SES measures were worse for First Nations (income 40% lower, 5x higher unemployment, 2x higher lone-parent households). Infant mortality is roughly double and preterm birth is 12% more likely among First Nations. Risk of infant death was significantly different according to neighbourhood income for both First Nations and non-First Nations, with larger differences among First Nations; results that are similar to neighbourhood unemployment. Stratifying by education led to the similar results among non-First Nations, but First Nations inequalities were made not significant; results that are similar to neighbourhood prevalence of lone parents. While all four ABSIs produced significant inequalities among non-First Nations, only neighbourhood income and unemployment were significant for First Nations.

McMaster Health Forum
23
Question addressed Focus of study Study characteristics Sample description Key features of the
intervention(s) Key findings
Comparing SES measures
Comparing individual and area-based SES measures (25)
Publication date: 2009 Jurisdiction studied: Canada Methods used: Cross-sectional analysis (Cox regression and negative binomial regression) Index used: Pampalon
A 15% sample linkage between 1991 Census of Canada data and records of deaths that occurred from June 4, 1991 to December 31, 2001
Comparison of individual and ABSI measures for measuring health inequalities
There has been mixed evidence surrounding whether health inequalities are larger using individual or area-based SES indicators, independent of the size of the geographic unit. A 1991 Pampalon index was compared to six individual-level indicators representing the index's six dimensions, however, it was not possible to construct individual-level quintiles of social deprivation. An absolute difference in life expectancy between the most- and least-advantaged quintiles was found for individual material deprivation (8.8 years), social deprivation (3.9 years), and smaller inequalities for material (3.5 years) and social (two years) using EAs. Similar findings for disability-free life expectancy are found. Gaps in individual outcomes are larger in CAs, small towns, and rural areas than the largest CMAs. Individual-level data consistently result in larger inequalities and the differences are more pronounced among women.
Comparing SES measures
To compare area-based income with household-level income (14)
Publication date: 2008 Jurisdiction studied: British Columbia Methods used: Cross-sectional analysis (Spearman's correlation, Kappa coefficients and weighted Kappa coefficients) Index used: DA-level income
Households for which one or more member resided in B.C. for at least 275 days per year from 2001 to 2004 and are covered by the Medical Services Plan
Area-based income is compared to the standard of household income and both are used to quantify inequalities in prescription drug spending
No prior studies have compared individual and area-based SES measures in a large Canadian study area. Household income was obtained through 2004 BC PharmaCare registration files which are CRA certified. Area-based income link postal codes to 2001 census data on average household income. Overall there is poor agreement between the measures - only 15.6% of senior and 14.9% of non-senior households are classified within one decile of each other (Spearman correlations <0.4 and Kappa coefficient <0.31). Area-based income results in more equal distribution of prescription drug spending. A sample regression model using the two models along with typical control variables also mirror this difference, although the control variables remain mostly unchanged. The household level model also results in a higher R2 statistic. Authors suggest caution when interpreting ABSIs and suggest using household-level data whenever possible.
Comparing SES measures
The effect of changing the scale of ABSIs (15)
Publication date: 2007 Jurisdiction studied: Canada Methods used: Cross-sectional analysis (mapping and stratification by ABSI quintile) Index used: SEFI and VANDIX
Participants in the CCHS 2.1 (2003)
Varying the scale at which health inequalities are measured using two ABSIs in Vancouver
Relatively little attention has been paid to the effect of scale on ABSIs. ABSIs are relative SES measures that aim to identify the most high-risk populations. Census tracts are not designed to reflect zones of homogeneity with respect to public health, but rather prioritize compactness of population. The effect of drawing different inferences depending on the spatial scale chosen is referred to as the modifiable area unit problem (MAUP). Scale effects refer to the effect of having the same data grouped at different levels, and zoning effects refer to the ways geographical units are grouped differently at different scales. Using the SEFI and VANDIX indices in Vancouver, a homogenizing effect is observed for larger scales. There are small differences in persons reporting poor or fair health between the top and bottom quintiles using three scales of CTs (5.0 to 15.6%), MCTs (5.2 to 14.7%), and DAs (4.1 to 17.3%), but these differences are not significantly different. Authors

Identifying How Area-based Socio-economic Indicators are Measured in Canada
24 Evidence >> Insight >> Action
Question addressed Focus of study Study characteristics Sample description Key features of the
intervention(s) Key findings
conclude that scale matters and the smallest units of analysis should be used.
Comparing SES measures
Whether ABSIs affect readiness to learn (16)
Publication date: 2007 Jurisdiction studied: Vancouver, British Columbia Methods used: Cross-sectional analysis (multilevel modelling) Index used: CT-level SES measures
Readiness-to-learn data for individual kindergarten children aged 5 and 6 years in Vancouver, Canada, collected in February 2000 (n = 3942). Kindergarten children living in Vancouver but who were home schooled, or attending a private school, an Aboriginal reserve school, or a school outside of Vancouver were not assessed.
To measure the association between different levels of a readiness-to-learn index with individual and neighbourhood characteristics
Few studies have used ABSIs to investigate health outcomes among young children using hierarchical statistical techniques. This study investigates whether kindergarten children in Vancouver are affected by neighbourhood-level SES. The outcome of readiness to learn as assessed by the Early Development Instrument is regressed using multilevel modelling against EA-level median household income and census tract-level lone-parent families (%), visible minorities (%), non-movers for five years (%), rented dwellings (%), median household income, unemployment rate, and percentage of adult population with no high-school certificate. At the neighbourhood level, all variables were significantly associated with learning outcomes, with the exception of ‘non-movers five years'. In the hierarchical models, neighbourhood-level factors account for more than 25% of neighbourhood variance in outcomes, but less than 15% in individual variance in outcomes. Even though neighbourhood effects are modest, the association with physical activity and well-being scale and the communication and general knowledge scale are significant. Neighbourhood income and mother-tongue English are the most significant predictors of readiness to learn.
Comparing SES measures
To construct VANDIX and compare with competing ABSIs (17)
Publication date: 2007 Jurisdiction studied: British Columbia Methods used: Cross-sectional analysis (Kappa statistic, interquartile range) Index used: VANDIX, Pampalon, SEFI
CCHS Cycle 2.1 respondents and 40 CTs and 2,973 DAs from the 2001 census
To compare the SEFI and Pampalon indices with VANDIX in predicting self-reported health outcomes
ABSIs have been in demand since the Black Report as separate indicators than individual SES. The rise of PCA in social epidemiology had more to do with computing power than a change in theory and may remove desired variation. Little attention has been paid to survey-based ABSIs (such as the Jarman UPA8) despite promise in representing local values. The VANDIX, Pampalon and SEFI ABSIs all resulted in similar step-wise divisions of poor self-rated health, with only 135/2,973 DAs classified two quintiles higher or lower. The problem was larger at the CT level (13%). There are some DAs and CTs that are known to be deprived that only VANDIX failed to identify, possibly because of a lack of social indicators or differential weighting.
Index creation
Comparing a new ABSI with the Pampalon index (18)
Publication date: 2015 Jurisdiction studied: Canada Methods used: Cross-sectional analysis (principal components analysis)
2006 census data (CANSIM), on all singleton live births between 1999 and 2008 in Edmonton accessed through Statistics Canada
To calculate a new ABSI and compare its association with birth outcomes and particulate matter exposure with the Pampalon index
Existing pan-Canadian ABSIs such as CAN-Marg and the Pampalon index do not incorporate factors such as cultural identities, potential environmental pollutants, and adverse occupational exposures. A new index was created to measure environmental injustice using data from the 2006 census aggregated at the DA level. Analysis was conducted using PCA with a single varimax rotation and averaging factor scores per DA for the three components retained. The factors roughly relate to: 1) social advantage and high material ownership; 2) high material ownership and economic advantage; and 3) social disadvantage and specific cultural identities. The new index was significantly associated with low

McMaster Health Forum
25
Question addressed Focus of study Study characteristics Sample description Key features of the
intervention(s) Key findings
Index used: Chan index and Pampalon index
birthweight, preterm birth, small for gestational age, and exposure to particulate matter. The Pampalon index performed similarly, better predicting exposure to particulate matter, but less consistently being associated with health outcomes. Authors claim that using ethnic origins is superior to the use of recent immigration or visible minority (as in CAN-Marg). Indigenous identity had no significant impact on the calculation of the index.
Index creation
Describing the creation and utility of an index of deprivation (19)
Publication date: 2012 Jurisdiction studied: Canada (Québec) Methods used: Methodological descriptions Index used: Pampalon
N/A To provide an overview of the construction of the Pampalon index, its adaptation to users' needs, and the index's advantages and disadvantages
The Pampalon index consists of material- and social-deprivation scores, which are comprised of the proportion of persons without a high school diploma, the employment-population ratio, the average personal income, the proportion of persons living alone, the proportion of individuals separated, divorced or widowed, and the proportion of single-parent families. Indicators are age- and sex- standardized, and the first two components of a principal components analysis (PCA) are used to calculate the two index values. Data are available for enumeration areas (EA) for 1991 and 1996, and for dissemination areas (DA) for 2001 and 2006. Since the creation of the index, the data has been made freely available for a variety of geographic areas throughout Canada. Maps have been created to display the index visually and many studies have used the index to study health inequalities in Québec and Canada. Health expectancy is observed decrease over quintiles for both indices for men, but only for material deprivation for women. The two primary limitations of the index are that it does not constitute an explanatory framework for social inequalities in health (e.g., there is no information on ethnicity or aboriginality) and that it is not an individual, but a small-area measure of socio-economic conditions. This means inequalities are systematically underestimated, especially outside of urban centres.
Index creation
To introduce special edition on ABSIs in Canada (45)
Publication date: 2012 Jurisdiction studied: Canada Methods used: Commentary Index used: CAN-Marg, Pampalon index, SEFI, and VANDIX
N/A To introduce special edition on ABSIs in Canada
ABSIs are primarily used in lieu of deficiencies in micro-level data, the emergence of place as a conceptual and theoretical concern, and addressing social determinants of health through place-based action. Canada collects less SES data on birth and death records than the U.K. or the U.S. The CCHS is able to capture this information, but is not representative at levels lower than health regions. ABSIs are sensitive to heterogeneity within geographic regions, making them more appropriate to use in dense urban areas. The evidence is mixed on whether ABSIs or individual measures result in larger inequalities. The line dividing contextual and individual characteristics are also blurrier than commonly assumed. The modifiable aerial unit problem (MAUP) refers to a bias of analysis due to units of analysis that result from administrative or political convenience. Krieger and Macintyre suggest that census tracts may not be

Identifying How Area-based Socio-economic Indicators are Measured in Canada
26 Evidence >> Insight >> Action
Question addressed Focus of study Study characteristics Sample description Key features of the
intervention(s) Key findings
representative of communities even if they are small. Despite these criticisms, ABSIs can be displayed using maps which engage and inform policymakers. The primary Canadian ABSIs are CAN-Marg, Pampalon index, SEFI, and VANDIX, but no single index has attained standard usage nationally.
Index creation
Description of the development of the SEFI-2 index (20)
Publication date: 2012 Jurisdiction studied: Manitoba Methods used: Cross-sectional analysis (relative risks using a Poisson or negative binomial regression model) Index used: SEFI, SEFI-2, Pampalon
For PMR, life expectancy, and PYLL: comprehensive coverage of Manitobans from Population Health Research Data Repository. For self-rated health: respondents to 2001, 2003, and 2005 CCHS.
To compare the SEFI-2 index to a modified Pampalon index
Dissemination areas only became useful as a geographic unit of analysis in Manitoba after 2006. The first version of the Socio-economic factor index (SEFI) used PCA to analyze area-specific high-school-graduation rates, unemployment rate, proportion of single-parent families, and the age-dependency ratio. The newer SEFI-2 measure adopted in 2001 instead used average household income, proportion of high-school graduates, unemployment rate, and single-parent families. Of these components, income has the highest loading score. The SEFI-2 was compared to a modified Pampalon index using moving within the past five years instead of single-parent families. The SEFI-2 orders areas with premature mortality rates (PMRs) appropriately. and identify Winnipeg as being relatively less deprived. Most ABSIs are correlated with better health outcomes with the exception of the Pampalon social-deprivation measure and self-reported health. Social deprivation stands out as a less important predictor of health, and especially in rural areas. Authors conclude that ABSIs are more robust indicators of SES than income alone.
Index creation
Description of the development of the CAN-Marg index (7)
Publication date: 2012 Jurisdiction studied: Canada Methods used: Cross-sectional analysis (Factor analysis and logistic regression) Index used: Can-Marg
2001 and 2006 census data, and cycle 3.1 and cycle 2007/2008 of the CCHS
Multilevel modelling of health and behavioural outcomes according to CAN-Marg dimensions
Instead of focusing on material deprivation, CAN-Marg is a multidimensional index incorporating residential stability, material deprivation, ethnic concentration, and dependency. Factors were chosen by applying factor reduction to 42 census tract variables to find the 18 variables and four dimensions explaining the most variance. The relationship between the index and several health and behavioural outcomes was then examined using multilevel modelling and CCHS individual-level data aggregated at the DA level. Different health outcomes vary according to the different dimensions of Can-Marg demonstrating utility of the subdivisions. Only higher dependency was associated with greater sense of community belonging.
Index creation
Description of Geozone methodology (8)
Publication date: 2012 Jurisdiction studied: Canada Methods used: Cross-sectional analysis (Geozone methodology)
52,973 DAs for which the proportion of residents reporting Aboriginal identity or where a population large enough to calculate income quintiles was available in 2006
Concentration of Aboriginal identity and income quintiles
Geozones stem from residential segregation analysis by comparing the proportion of a population sub-group with the rest of a population within the same area. First, a threshold table is calculated for a specific sub-group and comparison group, then concentration curves are used to identify potential cutoffs, then the population is divided into quantiles, and finally quantile classification tables are used to determine appropriate cut-points. It is important that the entire population at risk be included for analysis in the denominator. A concentration of Aboriginal peoples in DAs that are majority-

McMaster Health Forum
27
Question addressed Focus of study Study characteristics Sample description Key features of the
intervention(s) Key findings
Index used: Geozones
Aboriginal is demonstrated, with influences of metropolitan areas and variation between First Nations, Métis, Inuit, and non-Aboriginal people. Similar results are found for income quintiles, with the highest and lowest quintiles representing the highest concentration levels. Concentration curves demonstrate a U-shaped curve for Aboriginal identity exposure, and different hump-shaped or decreasing curves for exposure to low and high income. Spatial autocorrelation should be accounted for at local and global levels and cut-points should be determined with care. Geozones can be used to analyze health administrative data through the PCCF.
Index creation
The use of rough sets to create ABSIs (9)
Publication date: 2008 Jurisdiction studied: Canada Methods used: Cross-sectional (rough sets) Index used: Recent immigrant disparity index
2001 census of the Greater Vancouver Regional District
To introduce rough sets as a methodology for calculating deprivation indices
Area data is plagued by the MAUP, which render place-based analysis unreliable. A rough sets approach can be used to measure and mitigate scale and aggregation biases. Since deprivation indices are multi-criteria measures with each having their own MAUP, there may be many biases that emerge in the final index. An index was created from education, employment, housing and income, with each dimension having a hierarchical structure in relation to their subcomponents. Rough sets allow for partial and full membership into one of several sets based on a series of indiscernibility criteria and equivalence relations. All inputs are first rescaled from 0 to 1, then discretized, decision rules are applied to upper and lower approximation sets, and sets are combined according to their individual distributions. A recent immigrant index is created to analyze the strength of association with a deprivation index. The index is then created at the DA, CT and CSD levels and up- and down-scaling of each was conducted. Compared to additive equal weighting method of calculating deprivation index, the rough sets index resulted in more CTs associated with extreme deprivation. Although a large percentage of CTs are deprived and comprised of immigrants, few contain rough set values of both (RIDI). Authors state these results are more robust than traditional measures because there is no bias from outliers and linearity assumptions. Going from small to large census areas results in more varied DI values than predicted, while going from large to small results in the opposite. Going from household to DA to CT to CSD results in inaccuracy of 14%, 23%, and 27%, respectively.
Uses of ABSI
To quantify inequalities in preterm birth using individual level income and an ABSI (22)
Publication date: 2019 Jurisdiction studied: Alberta Methods used: Prospective cohort study
Participants in All Our Families (AOF: n=3,341) and Alberta Pregnancy Outcome and Nutrition (APrON: n=2,187) from 2008-2012
To see whether a predictive measure of preterm birth can be developed from individual SES and an ABSI
Preterm birth is associated with poor health outcomes and low neighbourhood SES, but the predictive power and clinically meaningful differences are not clear. Neighbourhood SES was measured using Pampalon material deprivation index and median personal income at the DA level, and a predictive model was created using multilevel conventional logistic regression and validated using AUC. Approximately 6% of the variance in preterm birth was attributable to neighbourhood SES (25% of neighbourhood variation in PTB), and
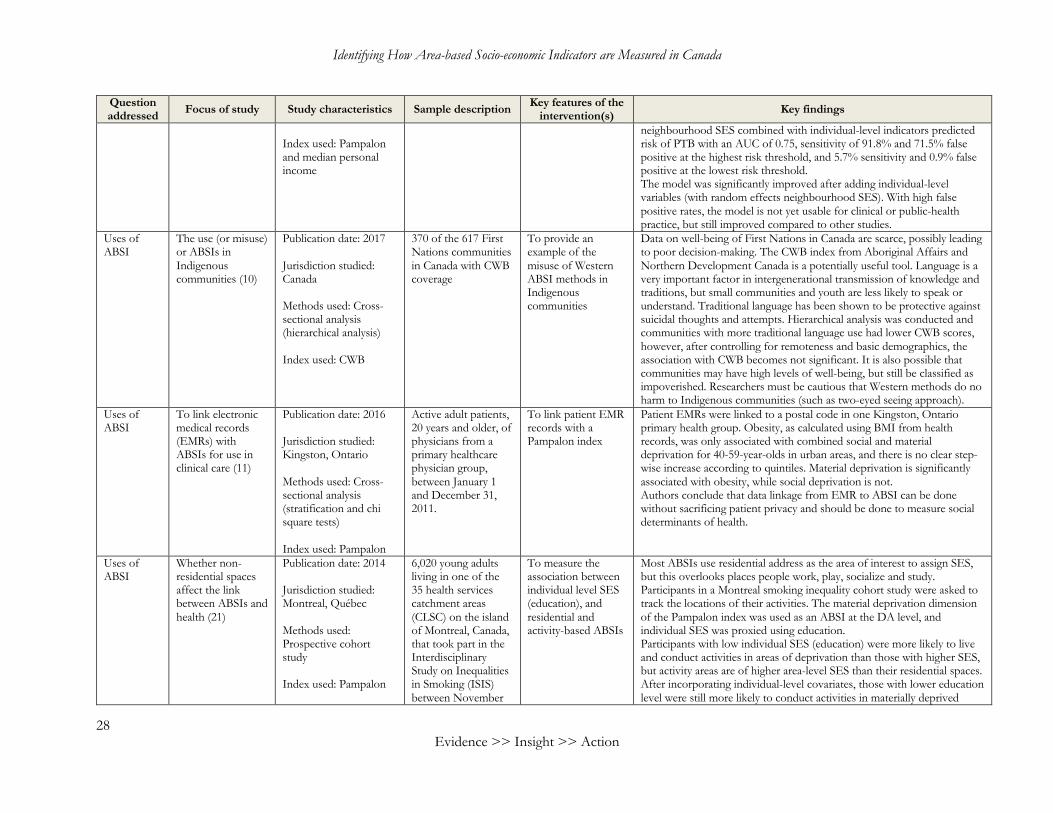
Identifying How Area-based Socio-economic Indicators are Measured in Canada
28 Evidence >> Insight >> Action
Question addressed Focus of study Study characteristics Sample description Key features of the
intervention(s) Key findings
Index used: Pampalon and median personal income
neighbourhood SES combined with individual-level indicators predicted risk of PTB with an AUC of 0.75, sensitivity of 91.8% and 71.5% false positive at the highest risk threshold, and 5.7% sensitivity and 0.9% false positive at the lowest risk threshold. The model was significantly improved after adding individual-level variables (with random effects neighbourhood SES). With high false positive rates, the model is not yet usable for clinical or public-health practice, but still improved compared to other studies.
Uses of ABSI
The use (or misuse) or ABSIs in Indigenous communities (10)
Publication date: 2017 Jurisdiction studied: Canada Methods used: Cross-sectional analysis (hierarchical analysis) Index used: CWB
370 of the 617 First Nations communities in Canada with CWB coverage
To provide an example of the misuse of Western ABSI methods in Indigenous communities
Data on well-being of First Nations in Canada are scarce, possibly leading to poor decision-making. The CWB index from Aboriginal Affairs and Northern Development Canada is a potentially useful tool. Language is a very important factor in intergenerational transmission of knowledge and traditions, but small communities and youth are less likely to speak or understand. Traditional language has been shown to be protective against suicidal thoughts and attempts. Hierarchical analysis was conducted and communities with more traditional language use had lower CWB scores, however, after controlling for remoteness and basic demographics, the association with CWB becomes not significant. It is also possible that communities may have high levels of well-being, but still be classified as impoverished. Researchers must be cautious that Western methods do no harm to Indigenous communities (such as two-eyed seeing approach).
Uses of ABSI
To link electronic medical records (EMRs) with ABSIs for use in clinical care (11)
Publication date: 2016 Jurisdiction studied: Kingston, Ontario Methods used: Cross-sectional analysis (stratification and chi square tests) Index used: Pampalon
Active adult patients, 20 years and older, of physicians from a primary healthcare physician group, between January 1 and December 31, 2011.
To link patient EMR records with a Pampalon index
Patient EMRs were linked to a postal code in one Kingston, Ontario primary health group. Obesity, as calculated using BMI from health records, was only associated with combined social and material deprivation for 40-59-year-olds in urban areas, and there is no clear step-wise increase according to quintiles. Material deprivation is significantly associated with obesity, while social deprivation is not. Authors conclude that data linkage from EMR to ABSI can be done without sacrificing patient privacy and should be done to measure social determinants of health.
Uses of ABSI
Whether non-residential spaces affect the link between ABSIs and health (21)
Publication date: 2014 Jurisdiction studied: Montreal, Québec Methods used: Prospective cohort study Index used: Pampalon
6,020 young adults living in one of the 35 health services catchment areas (CLSC) on the island of Montreal, Canada, that took part in the Interdisciplinary Study on Inequalities in Smoking (ISIS) between November
To measure the association between individual level SES (education), and residential and activity-based ABSIs
Most ABSIs use residential address as the area of interest to assign SES, but this overlooks places people work, play, socialize and study. Participants in a Montreal smoking inequality cohort study were asked to track the locations of their activities. The material deprivation dimension of the Pampalon index was used as an ABSI at the DA level, and individual SES was proxied using education. Participants with low individual SES (education) were more likely to live and conduct activities in areas of deprivation than those with higher SES, but activity areas are of higher area-level SES than their residential spaces. After incorporating individual-level covariates, those with lower education level were still more likely to conduct activities in materially deprived

McMaster Health Forum
29
Question addressed Focus of study Study characteristics Sample description Key features of the
intervention(s) Key findings
2011 and August 2012
areas than those with higher SES. There is also a positive interaction between individual SES and residential SES for less educated participants, leading to even further disadvantage in activity spaces. In contrast, there is a lower correlation among those of higher SES, meaning they experience a wider diversity of area-level SES in their daily lives.
Uses of ABSI
How trends in ABSI-based poverty changed over time in Canada (12)
Publication date: 2008 Jurisdiction studied: Canada Methods used: Cross-sectional analysis (hierarchical and fixed effects regressions) Index used: CCS-level LICO
2,400 Canadian communities using 1981, 1986, 1991, 1996 and 2001 census data
To investigate trends in long- and short-term changes in low-income neighbourhoods across Canada
The number of Canadians living below the LICO has not changed much since 1980, and this has not yet been examined at the neighbourhood level. Neighbourhood-level poverty can differ from individual due to local industry, human capital and discrimination. CCS-level LICO is regressed against a series of economic, demographic, social and spatial variables. Long-run regression results reveal LICO to be autocorrelated and associated with neighbouring LICO. Agricultural employment is negative associated with LICO, while all other employment types are positively associated. Greater population within 100 km is associated with less poverty, but being 100-200 km away is associated with more poverty. The strong association between percentage of Indigenous residents and low income is removed after controlling for labour market and demographic variables. This pattern is echoed for place of birth measures, language and share of recent immigrants. Finally, lone-parent households are associated with more poverty and higher education level with less. Within community fixed effects indicate a stronger short-term impact of changes in economic conditions, and an association between changes in Aboriginal and immigrant residents with more poverty.

>> Contact us1280 Main St. West, MML-417Hamilton, ON, Canada L8S 4L6+1.905.525.9140 x [email protected]
>> Find and follow usmcmasterforum.orghealthsystemsevidence.orgmcmasteroptimalaging.org
mcmasterforum
FORUM+