Embed Size (px)
Citation preview

Hemodynamic Waveforms Interpretation, September 18, 2005
Brenda Lynn Morgan, Critical Care Concepts
1
Hemodynamic Waveform Interpretation
Hemodynamic waveforms are “maps” of the pressure changes that take place within a given vessel or chamber. To understand the shape or morphology of a normal waveform, a clear understanding of the events of the cardiac cycle is required. Focus on the chamber or vessel that is being measured, and visualize the pressure changes that occur during one complete period of systole and diastole. All of the waveforms obtained from arterial lines, pulmonary artery catheters, or during cardiac catheterization can be recognized by recalling 3 basic waveform morphologies. These 3 waveform shapes include: 1) atrial, 2) arterial, and 3) ventricular waveforms. Because both atria fill, empty and contract in the same sequence during systole and diastole, the right atrial and left atrial waveforms have similar patterns. Similar changes occur between the pulmonary artery and aorta, and the right and left ventricles. Normal waveforms will be reviewed by examining waveforms that demonstrate each of these 3 patterns. WAVEFORM DESCRIPTIONS
1. ATRIAL WAVEFORMS (right and left atrium) Waveforms obtained from the right and left atria have similar morphologies. Thus, CVP (right atrial) and left atrial pressure tracings have similar shapes. Direct left atrial pressure monitoring is uncommon, but can be done by inserting a small catheter into the pulmonary vein during open-heart surgery. More commonly, left atrial pressure waveforms are obtained through indirect measurement. Pulmonary artery wedge pressure waveforms (PAWP, PWP) are indirect measurements of the left atrial pressure. Thus, CVP and PWP waveforms have similar shapes. We will begin by examining a right atrial pressure waveform. These principles will then be compared to the left atrial pressure waveform obtained from a pulmonary artery wedge pressure tracing (Table 1).
RIGHT ATRIAL PRESSURE TRACING
RIGHT ATRIAL CATHETER
Subclavian Line
Table 1

Hemodynamic Waveforms Interpretation, September 18, 2005
Brenda Lynn Morgan, Critical Care Concepts
2
o The right and left atrial waveforms will take on the same appearance, but the right-sided pressures are slightly lower than the left.
o The right atrial waveform can be identified through any catheter located in the right atrium or great veins, including:
The “CVP” (blue: proximal injection) port of the pulmonary artery catheter The “VIP” (white: proximal infusion) port of a VIP model pulmonary artery
catheter An introducer (cordis) that is located in a large central vein Any single or multi-lumen port of a central venous catheter
The tip of a right atrial catheter should not be located in the right atrium due to the risk of atrial wall injury. The tip should be located prior to the entry to the right atrium in the SVC (jugular or subclavian access) or IVC (femoral access).
Because there are no valves between the IVC or SVC and the right atrium, pressures monitored in the great veins will provide an “open pathway” to the right atrium and reveal a right atrial waveform.
CVP measurements obtained via double or triple lumen catheters or from introducers that are inserted via the femoral vein, may be influenced by intra-abdominal pressures and subject to inaccuracies.
o We are not really interested in measuring atrial pressures. Our true goal is to measure the pressure in the ventricles at the end of diastole, to identify a “filling pressure”. This provides direction for intravascular fluid management.
o It would be unsafe to leave a catheter with the tip located in the ventricle, therefore, the catheter is safely positioned above the ventricle in the atrium. To identify ventricular pressure, we measure the atrial pressure at a time when the AV valve (tricuspid and mitral) is open, providing an open pathway to the ventricle.
o The AV valves are open during diastole. The atrial pressure remains higher than the ventricular pressure during the entire diastolic period; this is why the valve remains open and blood continues to flow from the atrium to the ventricle. To capture the true ventricular pressure, the atrial pressure should be measured as close to the end of diastole as possible. At end-diastole, the atrial and ventricular pressures equilibrate. Beyond this point, the ventricular pressure rises above the atrial pressure, closing the AV valve (preventing further access to the ventricle from the atrium). The goal for any atrial pressure measurement is to obtain the measurement at the very end of diastole, when the atrial pressure is closest to the ventricular pressure. This should represent the ventricular pressure at the end of filling.
o CVP and PAWP are filling PRESSURES. Although a low pressure generally indicates low preload or volume, a high pressure does not necessarily correlate to a high end-diastolic volume. For example, a non-compliant ventricle (one that cannot stretch easily) can generate high pressures during filling, even when the actual volume in the ventricle is low. Ischemia can produce this type of problem, because oxygen is needed to facilitate muscle relaxation (referred to as diastolic dysfunction).
o In addition, pathology that elevates pressures between the PA catheter tip and the left ventricle can produce high PAWP readings that are not a reflection of the left ventricular pressure. For example, high PEEP, or pulmonary vasoconstriction can produce this type of error.
The greatest value in monitoring these pressures is obtained by ensuring that each pressure is measured the same way, enabling the trend in pressures to be followed. Each pressure should be compared to the

Hemodynamic Waveforms Interpretation, September 18, 2005
Brenda Lynn Morgan, Critical Care Concepts
3
patient’s clinical response, to identify the optimal filling pressure for a given patient.
o The PAWP is an indirect measurement of the left atrial pressure, therefore, it has the same morphology as a right atrial waveform (Table 2).
LEFT ATRIAL PRESSURE TRACING (FROM PAWP)
PAWP
Table 2
During wedging of the PA catheter, forward flow from the right ventricle is obstructed, and the forward, static pressure is monitored.
The absence of valves creates an uninterrupted pathway between the catheter tip and left atrium. Thus, the PAWP tracing is a measure of the left atrial pressure.
The waveform “shape” will be similar to the right atrial tracing, however, the time it takes for the left atrial pressure waveform to be transmitted backward toward the tip of the catheter is prolonged. Consequently, the PAWP will be delayed or slightly later in relationship to the ECG than the right atrial waveform.
The PAWP tracing is often less crisp and clear, and is subject to significant movement and respiratory artifact. PAWP waveforms will often have additional artifact waves.
2. VENTRICULAR WAVEFORMS Waveforms obtained from the right and left ventricle have similar morphologies. Right ventricular waveforms are obtained during insertion of a pulmonary artery catheter, if the pulmonary artery catheter slips backward into the right ventricle and from any lumen of the pulmonary artery catheter that terminates in the right ventricle (e.g., Paceport lumen of the Swan Ganz™). Left ventricular waveforms are not normally observed, with the exception of during a left heart catheterization (e.g., in the cardiac catheterization room) or during open surgery. Left ventricular waveforms have a similar shape, but much higher pressures than right ventricular waveforms.

Hemodynamic Waveforms Interpretation, September 18, 2005
Brenda Lynn Morgan, Critical Care Concepts
4
RIGHT VENTRICULAR WAVEFORM (measured from within the right
ventricle)
RIGHT VENTRICULAR WAVEFORM (measured from a
pulmonary artery catheter)
Note the timing delay between the QRS and the rise in the right ventricular pressure when obtained from the tip of the 110 cm long PA catheter (waveform on right) versus direct measurement (waveform above).
Table 3
3. ARTERIAL PRESSURE WAVEFORMS (Pulmonary artery, arterial lines)
The pressure changes in the pulmonary artery and the aorta during systole and diastole produce similar morphology (Table 4).
PULMONARY ARTERY WAVEFORM
AORTIC WAVEFORM
Table 4

Hemodynamic Waveforms Interpretation, September 18, 2005
Brenda Lynn Morgan, Critical Care Concepts
5
o Arterial lines or pulmonary artery lines demonstrate the same morphology or shape.
o Arterial lines have much higher pressures than pulmonary artery lines o Pulmonary artery tracings are subject to considerable movement artifact not seen
in arterial tracings.
4. WAVEFORM RECOGNITION
ATRIAL PRESSURE WAVEFORMS (right atrial, PAWP)
In a normal sinus rhythm, the atrial waveform can be recognized by two or three low amplitude waves for every cardiac cycle (or two-three small bumps between one R – R interval. The “a” is the rise in atrial pressure as a result of atrial contraction, the “c” (not always visible) is the rise in atrial pressure when the closed AV valve bulges upward into the right atrium following valve closure, and the “v” is the rise in the atrial pressure as it refills during ventricular contraction (Figure 1).
Figure 1
The atrial pressures initially increase during systole as the contracting ventricles return blood to the atria, refilling the upper chambers. This rise in the atrial pressure is identified as the “v” wave. The upstroke of the “v” wave is the rise in atrial pressure as a result of atrial filling (Figure 2). Because it is produced as a result of ventricular contraction, its location is relative to the QRS on the ECG. The QRS is the depolarization of the ventricle (or the getting ready to contract phase). The ventricle must depolarize first, then contract and eject blood into the great vessels. Ejection eventually leads to the return of blood to the atria (left ventricular contraction refills the right atrium and produces the right atrial “v” wave; right ventricular contraction refills the left atrium and produces the left atrial “v” wave). Thus, the QRS causes the “v” wave, however, the QRS always appears before the “v” wave is produced. In a CVP tracing, the “v” is generally located immediately after the peak of the T wave on the ECG. On the left atrial or PWP tracing, the “v” wave appears a little bit later (due to the timing delay).
Figure 2

Hemodynamic Waveforms Interpretation, September 18, 2005
Brenda Lynn Morgan, Critical Care Concepts
6
The atrial pressures peaks at the end of atrial filling or end systole (Figure 3). End
systole is the peak of the “v” wave.
Figure 3
As the “v” wave peaks, the pressure in the newly filled atria will exceed the pressure in the relaxing, empty ventricles below. This pressure change (atrium higher than ventricle) causes the opening of the mitral and tricuspid valves (onset of diastole). Once the valves open, the favourable pressure gradient causes atrial blood to rush toward the ventricle. This produces a rapid decline in atrial pressure (Figure 4), and reflects the initial third of diastole (period of “rapid inflow”). This decline in the atrial pressure is referred to as the “Y” descent (“Y” for atrial emptYing).
Figure 4
At the bottom of the downslope of the “v” wave, the pressure drops into a “valley” between the “v” wave and the next pressure rise (Figure 5). This drop in atrial pressure correlates to the decline in atrial pressure following rapid emptying. This decline in atrial pressure reduces the pressure gradient between the atrial and ventricular pressures and temporarily reduces the rate of ventricular filling. This period of reduced blood flow is called diastasis and represents the middle third of diastole.
Figure 5 In order to optimize ventricular filling, the atrial pressure needs to rise in late diastole
to augment the pressure gradient. Thus, in the final third of diastole, the atria depolarize, causing the atrial pressures to increase. This second rise in pressure is displayed on the atrial waveform as the “a” wave (Figure 6). The “a” wave begins to form as depolarization begins, therefore, it is located in the PR interval on a right
“Y” Descent

Hemodynamic Waveforms Interpretation, September 18, 2005
Brenda Lynn Morgan, Critical Care Concepts
7
atrial pressure waveform (slightly later for a left atrial or PWP waveform). The “a” wave is the rise in atrial pressure as a result of atrial depolarization and subsequent contraction.
Figure 6
Following contraction, the atria begin to relax, and the atrial pressures once again fall (Figure 7). This fall in atrial pressures is identified by the downslope of the “a” waves. This is referred to as the “X” descent (“X” for atrial relaxation).
Figure 7
As the atrial pressures continue to fall, the ventricles below begin to depolarize. This causes the ventricular pressures to begin to rise. The rising pressure causes the ventricle pressures to exceed the atrial pressures. This causes the mitral and tricuspid valves to close.
The ventricle pressures continue to rise as a result of depolarization, even though the
pulmonary and aortic valves have not yet opened. This period following diastole when all 4 heart valves are closed is called isovolumetric contraction. This period is called “isovolumetic contraction” (contraction without flow) because the ventricle pressure is rising due to isometric contraction (due to depolarization), but the closed valves prevent blood flow. As the pressure builds in the ventricle, the closed AV valves begin to “bulge” upward into the atria, producing a small rise in the pressure. This pressure rise in the atria is called the “c” wave (Figure 8). The “c” wave is not always visible, but can appear as a “bump” on the downslope of the “a” wave, or as a separate wave in between the “a” and the “v”. In a right atrial waveform, it generally coincides with the mid to late QRS. It will appear slightly later in a left atrial or PAWP tracing.
Figure 8
“X” Descent
Hemodynamic Waveforms Interpretation, September 18, 2005
Brenda Lynn Morgan, Critical Care Concepts
8
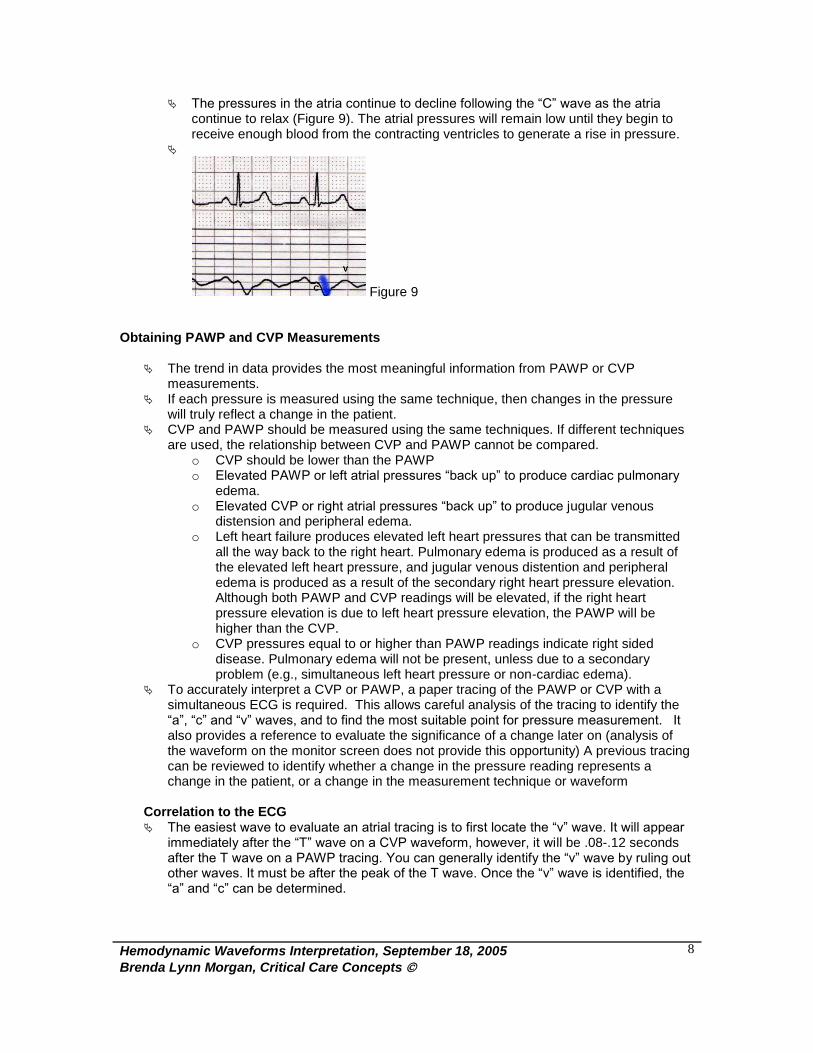
The pressures in the atria continue to decline following the “C” wave as the atria continue to relax (Figure 9). The atrial pressures will remain low until they begin to receive enough blood from the contracting ventricles to generate a rise in pressure.
Figure 9
Obtaining PAWP and CVP Measurements
The trend in data provides the most meaningful information from PAWP or CVP measurements.
If each pressure is measured using the same technique, then changes in the pressure will truly reflect a change in the patient.
CVP and PAWP should be measured using the same techniques. If different techniques are used, the relationship between CVP and PAWP cannot be compared.
o CVP should be lower than the PAWP o Elevated PAWP or left atrial pressures “back up” to produce cardiac pulmonary
edema. o Elevated CVP or right atrial pressures “back up” to produce jugular venous
distension and peripheral edema. o Left heart failure produces elevated left heart pressures that can be transmitted
all the way back to the right heart. Pulmonary edema is produced as a result of the elevated left heart pressure, and jugular venous distention and peripheral edema is produced as a result of the secondary right heart pressure elevation. Although both PAWP and CVP readings will be elevated, if the right heart pressure elevation is due to left heart pressure elevation, the PAWP will be higher than the CVP.
o CVP pressures equal to or higher than PAWP readings indicate right sided disease. Pulmonary edema will not be present, unless due to a secondary problem (e.g., simultaneous left heart pressure or non-cardiac edema).
To accurately interpret a CVP or PAWP, a paper tracing of the PAWP or CVP with a simultaneous ECG is required. This allows careful analysis of the tracing to identify the “a”, “c” and “v” waves, and to find the most suitable point for pressure measurement. It also provides a reference to evaluate the significance of a change later on (analysis of the waveform on the monitor screen does not provide this opportunity) A previous tracing can be reviewed to identify whether a change in the pressure reading represents a change in the patient, or a change in the measurement technique or waveform
Correlation to the ECG The easiest wave to evaluate an atrial tracing is to first locate the “v” wave. It will appear
immediately after the “T” wave on a CVP waveform, however, it will be .08-.12 seconds after the T wave on a PAWP tracing. You can generally identify the “v” wave by ruling out other waves. It must be after the peak of the T wave. Once the “v” wave is identified, the “a” and “c” can be determined.

Hemodynamic Waveforms Interpretation, September 18, 2005
Brenda Lynn Morgan, Critical Care Concepts
9
Observe the ECG rhythm. If the patient has a sinus rhythm, an “a” wave should be present. The “a” should be in the PR interval for a CVP. It is later in the PAWP, appearing within or even after the QRS.
If present, the “c” wave is generally within the QRS for a CVP. It will be after the QRS for a PAWP.
CVP
PWP
Table 5
Figure 10
If the patient does not have a “P” wave, the “a” wave will be absent. If the “P” is not
synchronized to the QRS (i.e., retrograde P waves that occur simultaneous with or after the QRS), very large “a” waves may be present. These large “a” waves may appear as one very large wave during a cardiac cycle. The large “a” waves are called cannon “a” waves. They are actually exaggerated atrial pressures that occur when the atria contract against a closed AV valve, adding to the pressure that is already being generated due to the “c” or “v” wave (Figure 10).
In atrial fibrillation, “a” waves are absent. The “c” and the “v” often “merge together”, producing one wider or “full figured” pressure waveform for each cardiac cycle (Figure 11).

Hemodynamic Waveforms Interpretation, September 18, 2005
Brenda Lynn Morgan, Critical Care Concepts
10
Figure 11
Where to Measure CVP and Wedge
We measure atrial pressures as a means of viewing the pressures in the ventricles when they are full of blood. Thus, we must measure the atrial pressures during diastole when the mitral and tricuspid valves are open. During diastole, the atrial pressure is higher than the ventricular pressure (this is the gradient that keeps the valves open and blood moving toward the ventricle). At the very end of diastole, the atrial pressure equilibrates with the ventricular pressure, at the very end of ventricular filling. Measurement of the atrial pressure at the end of diastole provides the best opportunity to capture ventricular filling pressure. Both CVP and PAWP should be measured the same way.
The location on the atrial pressure wave that best reflects end-diastolic pressure is the point just prior to the “C” wave (Figure 12).
Although the “C” wave is the “ideal” location, there are some realistic limitations to using the “C” wave as a landmark.
o The “C” is often absent or difficult to find. This is particularly true in the PAWP waveform, which is subject to considerable movement artifact from right ventricular systole and breathing.
Right Right Atrial Atrial Pressure (CVP)Pressure (CVP)
Figure 12
If the Pre C wave point is not available, a second method for identification of the end-diastolic pressure is to take the mean of the highest and lowest “a” wave pressure (Figure 13).
Pre “C”

Hemodynamic Waveforms Interpretation, September 18, 2005
Brenda Lynn Morgan, Critical Care Concepts
11
Right Right Atrial Atrial Pressure (CVP)Pressure (CVP)
5
25
15
35
Figure 13
A third method can be used if the “a” is hard to interpret or absent. A number of arrhythmias can alter or eliminate the “a” wave. If it is unavailable, the end-diastolic pressure can be estimated by identifying the “Z” point. Draw a line from the end of the QRS to the atrial tracing. The point where the line intersects with the waveform is the “Z” line. Note: the Z point is delayed .08-.12 seconds from the QRS on the PAWP (Figure 14).
Right Right Atrial Atrial Pressure (CVP)Pressure (CVP)
Z point
Figure 14 For a PAWP waveform, the same technique is used, however, the “Z” line should be
estimated as .08-.12 seconds (two-three small boxes on the ECG paper) to the left of the end of the QRS.
At London Health Sciences Centre, we considered the challenges associated with selecting a measurement technique that would produce inter-rater reliability. Because variable interpretation skills exist among staff, we felt that varying the measurement technique according to the waveform would make reproducibility of results problematic. Consequently, we decided to use an approach that would select a pressure similar to the end-diastolic pressure and would facilitate easier detection.
The only portion of the atrial tracing that will always be present is the “v” wave. The top or peak of the “v” wave is end-systole, therefore, the top of the “v” wave would not be a suitable location (the atrial pressure would be significantly higher than the ventricle and the AV valves would still be closed).
The bottom or base of the “v”, on the right side of the downslope, is mid-diastole (diastasis). This is the period when atrial and ventricular pressures are very similar, just prior to atrial depolarization. At this point, the atrial pressure is still slightly higher than the ventricular pressure, but is reasonably close to the pre “C” wave point. Because the bottom of the “v” (on the right hand side of the slope) is easy to locate and is close to the pre “c” wave pressure, we chose to make this our standard for measurement (Figure 15).

Hemodynamic Waveforms Interpretation, September 18, 2005
Brenda Lynn Morgan, Critical Care Concepts
12
While this may slightly over or underestimate the pressure in some patients, it is easy to locate during repeated pressure measurements. As long as the location for determining the pressure remains unchanged, a trend of data can be obtained. While this strategy may not be acceptable to other institutions, it is important that every critical care unit adopt a method that will be used consistently by all individuals measuring CVP and PAWP at their facility.
Figure 15
Hemodynamic Changes Associated with Breathing. Cardiac pressures will rise and fall with breathing. This is identified by excursions in the
waveform that coincide with ventilation. Positive pressure ventilation will cause cardiac pressure to rise upon inspiration. Spontaneous ventilation usually produces the largest respiratory artifact (mask, CPAP or
low PS ventilation). It causes a drop in vascular pressures immediately before inspiration, with a gradual rise until end-expiration.
Exhalation usually represents the longest period of the respiratory cycle and is generally the most “stable” interval (inverse I:E ratio ventilation can prolong exhalation).
Because hemodynamic pressures rise and fall with breathing, clinically significant pressure measurement differences can be obtained just by altering when in the breathing cycle the measurement was taken.
To eliminate variations in pressure measurements as a result of breathing, we attempt to measure pressures at the same phase of the respiratory cycle each time.
Record pressure measurements at end exhalation. For positive pressure ventilation, this is usually at the low point (valley) in the respiratory fluctuations. For spontaneous breathing, this is just prior to the dip in respiratory fluctuations.
End-tidal CO2 or flow recordings can be used to locate end-expiration.
Putting the Breathing and Cardiac Cycle Together 1. Obtain an atrial tracing (CVP or PAWP) with a simultaneous ECG. 2. Observe the ventilatory excursion. Identify the end of expiration according to the mode of
ventilation. o If in doubt, place your hand on the patient’s chest and observe the real time
excursions on the PAP tracing as the patient’s chest rises. This will help to identify whether the excursion are increasing with inspiration (typical mechanical ventilation pattern) or are falling with inspiration (typical spontaneous pattern). PS ventilation is the most typical mode that can cause variation in the pattern of excursion. Low PS levels may produce “spontaneous variations”, whereas, higher levels of PS often produce “mechanical type variations”.
o Patients may have a mixture of spontaneous and mechanical breaths (e.g., SIMV) or a mixture of triggered versus ventilator initiated breaths (e.g., AC).
3. Locate the “a”, “c” and “v” waves for a cycle within the end-expiration period. Identify the landmark to be used to identify “end-diastole”.
4. In the example below, the patient is on positive pressure ventilation. The “valley” in the respiratory excursion was identified as “end expiration”. The Pre C wave point from one of the cardiac cycles within this end expiration period was used (Figure 16).

Hemodynamic Waveforms Interpretation, September 18, 2005
Brenda Lynn Morgan, Critical Care Concepts
13
5. Identify the pressure by referring to the scale on the paper tracing. Place the strip in the chart for future reference.
I
E
End-diastole: Pre C wave
End-expiration
Figure 16
5. WAVEFORM RECOGNITION
VENTRICULAR PRESSURE WAVEFORMS (right ventricle, PAWP) Note that a direct right ventricle waveform has been used to describe the pressure changes during the cardiac cycle. Right ventricle waveforms obtained from a pulmonary artery catheter will display considerably delay to the right of the QRS.
During diastole, the ventricles relax and stretch in response to incoming blood (ventricular filling). Because the ventricles get larger as volume increases, the pressure in the ventricles remain very low and change little during diastole (Figure 17).
Figure 17
In late diastole, atrial contraction forces a “bolus” of blood into the ventricles, which can causes a small rise in the ventricular pressure. This may be seen as a small pressure wave immediately prior to the main rise in ventricular pressure, if the patient is in a sinus
Hemodynamic Waveforms Interpretation, September 18, 2005
Brenda Lynn Morgan, Critical Care Concepts
14
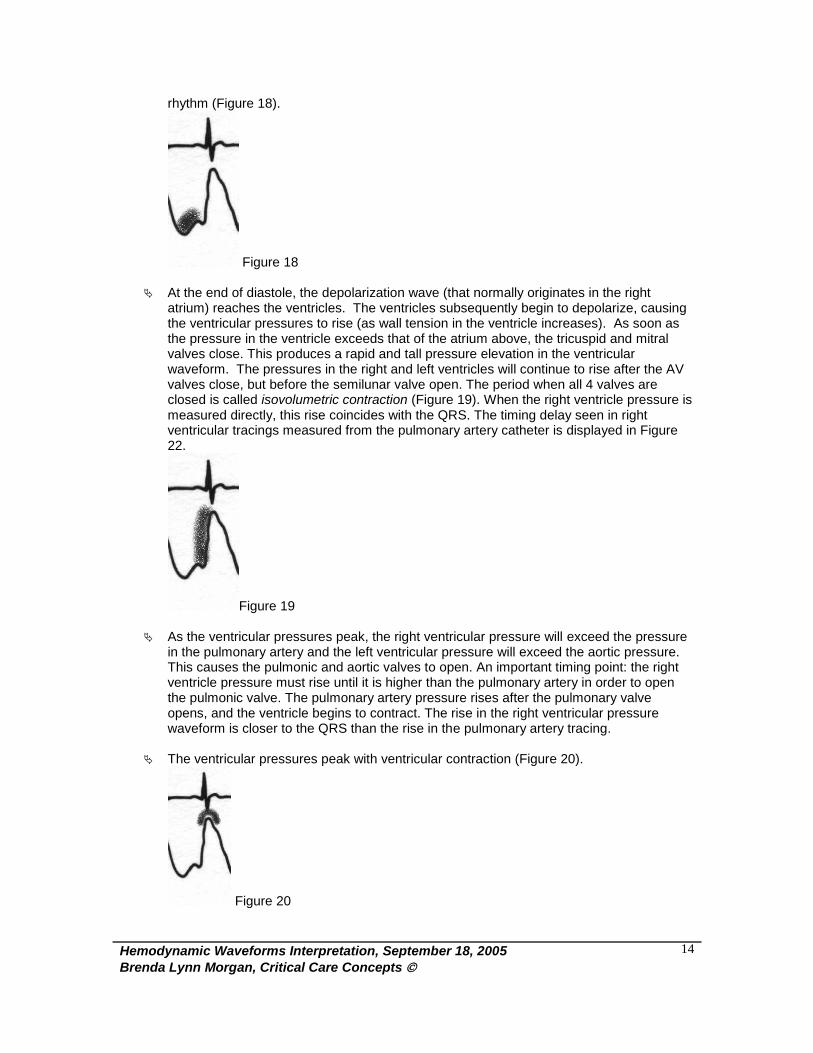
rhythm (Figure 18).
Figure 18
At the end of diastole, the depolarization wave (that normally originates in the right atrium) reaches the ventricles. The ventricles subsequently begin to depolarize, causing the ventricular pressures to rise (as wall tension in the ventricle increases). As soon as the pressure in the ventricle exceeds that of the atrium above, the tricuspid and mitral valves close. This produces a rapid and tall pressure elevation in the ventricular waveform. The pressures in the right and left ventricles will continue to rise after the AV valves close, but before the semilunar valve open. The period when all 4 valves are closed is called isovolumetric contraction (Figure 19). When the right ventricle pressure is measured directly, this rise coincides with the QRS. The timing delay seen in right ventricular tracings measured from the pulmonary artery catheter is displayed in Figure 22.
Figure 19
As the ventricular pressures peak, the right ventricular pressure will exceed the pressure in the pulmonary artery and the left ventricular pressure will exceed the aortic pressure. This causes the pulmonic and aortic valves to open. An important timing point: the right ventricle pressure must rise until it is higher than the pulmonary artery in order to open the pulmonic valve. The pulmonary artery pressure rises after the pulmonary valve opens, and the ventricle begins to contract. The rise in the right ventricular pressure waveform is closer to the QRS than the rise in the pulmonary artery tracing.
The ventricular pressures peak with ventricular contraction (Figure 20).
Figure 20

Hemodynamic Waveforms Interpretation, September 18, 2005
Brenda Lynn Morgan, Critical Care Concepts
15
As soon as the ventricles contract, blood leaves the ventricles, causing the ventricular pressures to begin to fall (Figure 21). The ventricular pressure waves will continue to fall as blood leaves the ventricle. At end systole, the ventricles begin to stretch and relax, and the ventricular pressures fall to the their lowest point. This low pressure is maintained during early diastole, because the ventricles stretch as they fill. Morphology note: the right ventricular pressure waveform has a steep slope up and steep slope downward. This gives the waveform a symmetrical shape. The pulmonary artery waveform has a more prolonged downslope, providing helpful clues when differentiating the two waveforms.
Figure 21
Right Ventricle Waveform from the tip of a Pulmonary Artery Catheter In direct measurement of the right ventricular tracing, the rise in the right ventricular pressure occurs simultaneously with the QRS. The detection of the rise in the right ventricular pressure wave is delayed when the RV pressure is measured through a pulmonary artery catheter, because of the transit time through the catheter (110 cm in length). This will cause the rise in pressure to appear after the QRS in an RV tracing measured from a PA catheter (Figure 21).
Figure 22
6. WAVEFORM RECOGNITION
ARTERIAL PRESSURE WAVEFORMS (pulmonary artery, arterial waveform) Pulmonary artery and arterial pressure waveforms have similar morphology. The pulmonary artery, like the PAWP, is subject to considerable respiratory and movement artifact. A pulmonary artery waveform will be used to display the pressure changes. Arterial lines take on a similar shape.
Systole begins with the opening of the aortic and pulmonic valves. Prior to opening of the pulmonary valve, the pulmonary artery pressure is very low (Figure 23).

Hemodynamic Waveforms Interpretation, September 18, 2005
Brenda Lynn Morgan, Critical Care Concepts
16
Figure 23
As the ventricles contract, they eject blood into the pulmonary artery and aorta. This causes an immediate rise in the arterial pressure. As blood enters the great vessels, the pressure rises quickly and steadily, producing a steep vertical rise (Figure 24).
Figure 24
Late in systole, the rate of ejection slows as the pressure gradient between the left ventricle and aorta, and right ventricle and pulmonary artery, narrows. Although blood is still moving from the ventricles to the great vessels, the rate of movement is slowed to the point where the pressure begins to decline. This causes the early downslope in the arterial tracing that represents this period of reduced ejection (Figure 25). This is late systole.
Figure 25
The ventricles begin to relax, causing the ventricular pressures to drop below the pressures in the great vessels. This causes the pulmonic and aortic valves to close, producing a small rise in the arterial pressures. This is seen as a “bump” on the downslope of the arterial pressure tracing, known as the dicrotic notch (Figure 25).
Figure 26

Hemodynamic Waveforms Interpretation, September 18, 2005
Brenda Lynn Morgan, Critical Care Concepts
17
Following closure of the semi-lunar valves, the pulmonary artery and aortic pressures continue to fall as blood leaves the great vessels to perfuse the tissues and lungs. Note that the downslope is more gradual than the upstroke (compared to the symmetrical shape of the RV) [Figure 27).
Figure 27
The pressure once again begins to rise at the onset of the next systole (Figure 28).
Figure 28
DIFFERENTIATION OF RIGHT VENTRICULAR WAVEFORM FROM PULMONARY ARTERY WAVEFORM Nurses caring for patients with pulmonary artery catheters must continually display the
pressure from the tip of the catheter. In good position, this should display a pulmonary artery pressure waveform. Two important risks exist. First, the catheter can migrate into a smaller branch of the circulation, producing a spontaneous wedge placement and risk for pulmonary infarction. Second, the tip of the catheter can slip back into the right ventricle, placing the patient at risk for lethal ventricular arrhythmias. Right ventricular placement can occur as a result of accidental withdrawal of the catheter, or in the setting of a dilated right ventricle (the catheter can loop in the right ventricle leaving less catheter available for the pulmonary artery).
The right ventricle must generate a pressure during systole that exceeds the pulmonary artery pressure (to open the semilunar valves). In diastole, the right ventricle stretches and relaxes during filling, producing very low right ventricular diastolic pressures. The Systolic (S) - Diastolic (D) pressure gradient in the right ventricle [(S:20-25) – (D:0-5) = 20-25] is higher than in the right atrium [(S:~6-10) – (D:0-5) = 5-10] or the pulmonary artery [(S:20-25) – (D:10-12) = 10-15)], giving the right ventricle pressure a taller waveform.
The right ventricle pressure is the same as the right atrial pressure during diastole, when the tricuspid valve opens and the two chambers equilibrate.
The right ventricle pressure is the same as the pulmonary artery pressure during systole, when the pulmonary valve opens and the right ventricle and pulmonary artery pressures equilibrate.
The right ventricle pressure must increase in order to open the pulmonary valve, the pulmonary pressure rises after the valve opens and the ventricle ejects. Thus, the rise in

Hemodynamic Waveforms Interpretation, September 18, 2005
Brenda Lynn Morgan, Critical Care Concepts
18
the right ventricle pressure is closer to the QRS than the rise in the pulmonary artery pressure.
In a sinus rhythm, a small rise in right ventricle pressure may be detected, in response to atrial contraction and subsequent ventricular filling.
The pulmonary artery waveform has a dicrotic notch. Examine the differences between the right ventricle pressure and the pulmonary artery
pressure below. Note that the systolic pressures are equal, but the right ventricle diastolic pressure is much lower. Note the symmetrical appearance to the right ventricle tracing, versus the crisp upstroke and prolonged downstroke of the pulmonary artery tracing. The right ventricle pressure rise is closer to the QRS.
RV
PAP
Table 6
Differentiating the Right Ventricle and Pulmonary Artery Waveforms “I think that the tip of my pulmonary artery catheter is displaying a Right Ventricular waveform. What clues would help to validate that this is a right ventricular tracing?”
The wave looks taller.
The systolic pressure equals the previously recorded pulmonary artery systolic pressure.
The diastolic pressure matches the right atrial diastolic pressure.
Inflation of the balloon fails to produce a PAWP waveform.
The waveform is symmetrical in shape.
There is no dicrotic notch.
A small preliminary rise in late diastole is present prior to the main rise in the pressure waveform.
The new pressure is closer to the QRS than the previous pulmonary artery tracing.
New ventricular ectope is present.

Hemodynamic Waveforms Interpretation, September 18, 2005
Brenda Lynn Morgan, Critical Care Concepts
19
RV PAP
Table 7
o Ensuring Monitoring Accuracy Small changes in hemodynamic pressure readings are often clinically significant. This is especially true in low pressure systems such as CVP and PAWP. For this reason, it is crucial that individuals responsible for collecting hemodynamic data, make every effort to ensure accurate data collection. The following steps are important in the collection of data:
1. Obtain baseline pressure tracings of all waveforms with simultaneous ECG at the start of each shift. This can provide a valuable reference to assist in interpretation later changes to a waveform.
2. Always check the transducer level prior to each blood pressure, PAP, CVP or PWP reading.
3. Always evaluate the quality of the waveform before recording numbers. All pressure numbers are derived from the waveform, therefore, a poor quality waveform will produce inaccurate readings. If the waveform is too small to discriminate the waveform characteristics, decrease the scale size to make the waveform larger.
o If the waveform is of a poor quality, troubleshoot the equipment. o A rounded, sluggish arterial upstroke suggests dampening of an arterial
waveform. 4. Artifact is common, especially in PAP and PAWP tracings. 5. Obtain the pressures when the patient is settled; do not record data while the patient is
restless, coughing or has just been suctioned. 6. Obtain wedge and CVP recordings in the supine position. Pressure recordings can be
made with elevations in the head of the bed, provided that the transducer is appropriately placed. Measurement inaccuracies have been shown in studies that evaluated lateral rotation positions. Coordinate pressure measurements around patient turning versus the hourly clock…don’t write a number down that has been measured inaccurately.
7. Measure hemodynamic values prior to cardiac output measurements. Transient elevations in CVP and PWP can occur in some patients during cardiac output injection.
8. Look at hemodynamic values as a group; they should tell a story. If one value seems out of synch with other values, it should be repeated.
9. Always remember to look at the patient; does your clinical assessment match the hemodynamic findings?
10. Mean BP is a more meaningful pressure to monitor and to use for drug titration. 11. If the monitor identifies hypotension, look at the patient. Is there evidence of shock or low
cardiac output? Check the cuff pressure to validate the problem. DO NOT WASTE UNNECESSARY TIME LOOKING FOR A BETTER BLOOD PRESSURE IF THE PATIENT’S CLINICAL APPEARANCE MATCHES A LOW BP!

Hemodynamic Waveforms Interpretation, September 18, 2005
Brenda Lynn Morgan, Critical Care Concepts
20
REMEMBER THAT DIRECT ARTERIAL BP MONITORING IS THE MOST ACCURATE. CUFF BP IS THE LEAST. NIBP IS BETTER THAN CUFF PRESSURE, HOWEVER, BOTH CUFF AND NIBP BECOME PROGRESSIVELY LESS ACCURATE AS HYPOTENSION WORSENS.
o Arterial line, cuff and NIBP pressure measurements all represent different technologies. BP values do vary somewhat with each method. A cuff that is too small will produce inaccurate readings (e.g. when the Velcro “pops” during measurement). For example, peripheral arterial lines tend to amplify the systolic BP and lower the DBP, however, the mean BP will generally be similar if all methods are accurate.
o A poor quality pulse oximetry tracing or may be another important indication of shock.
Brenda Lynn Morgan RN BScN MSc CNCC(C) Clinical Educator, CCTC September 18, 2005

Hemodynamic Waveforms Interpretation, September 18, 2005
Brenda Lynn Morgan, Critical Care Concepts
21
Home Challenge
1. How will an arterial pressure tracing change in atrial fibrillation?
2. How will an arterial pressure tracing change with frequent PVCs?
3. How will a right ventriclular pressure tracing change in atrial fibrillation?
4. How would a right atrial pressure tracing change in atrial fibrillation?
5. How will a PAWP tracing change in a sinus rhythm with complete heart block?
6. How would a PAWP tracing change with mitral insufficiency?
7. How would a CVP tracing change with tricuspid stenosis?
8. What is pulsus paradoxus?
9. What is pulsus alternans?
10. What is pulsus bisferians?
Hemodynamic Waveforms Interpretation, September 18, 2005
Brenda Lynn Morgan, Critical Care Concepts
22
Home Challenge
1. How will an arterial pressure tracing change in atrial fibrillation? The rise in pressure will have the same pattern of irregularity as the R-R interval. The systolic pressure will vary, with the lowest pressure occurring after the shortest R-R interval indicating reduced stroke volume from reduced filling volume (shortened diastolic time). If several very short R-R intervals appear in a row, the stroke volume may be extremely reduced (or negligible), indicating the accumulative effect of several cycles of reduced filling time.
2. How will an arterial pressure tracing change with frequent PVCs? Every premature beat will result in a premature systolic rise. The rise associated with the premature beat will usually have a decreased amplitude (lower stroke volume), because of the shortened preceding filling time.
3. How will a right ventricular pressure tracing change in atrial fibrillation? It will have the same pattern of irregularity of the R-R intervals, and it will lose the small wave that is produced as a result of atrial filling.
4. How would a right atrial pressure tracing change in atrial fibrillation? The will be no “a” wave (fibrillatory waves might be evident), the “V” – “V” interval will be irregular and display the same irregularity as the R-R interval, and some “V” wave amplitudes might be reduced due to reduced filling time (on the “V” waves that follow a short R-R interval).
5. How will a PAWP tracing change in a sinus rhythm with complete heart block? Each “P” waves will produce an “a” waves, even if out of synch with the QRS. “a” waves will appear before, during or after the “V” wave, consistent with the relationship of the “P” to the “QRS”. If the “a” wave (atrial contraction) occurs at the same time time as the “V” wave (during ventricular systole), a super tall or “cannon” “a” wave is produced. This is really a “fused” “a” and “v”, as a result of atrial contraction that occur simultaneous with atrial filling.
6. How would a PAWP tracing change with mitral insufficiency? The “V” will be very tall, and may obscure the “a” wave.
7. How would a CVP tracing change with tricuspid stenosis?
The “a” would be tall.
8. What is pulsus paradoxus? When the systolic arterial blood pressure fluctuates with breathing. Note that the variation is due to breathing and occurs in the presence of a regular ECG. Varying R-R interval does not cause the changing systolic pressure. Pulsus paradoxus occurs when the difference between the systolic pressure during inspiration versus expiration is > 15 mmHg.
9. What is pulsus alternans? Every other arterial waveform has a reduced systolic pressure, in the presence of a

Hemodynamic Waveforms Interpretation, September 18, 2005
Brenda Lynn Morgan, Critical Care Concepts
23
regular ECG (arrhythmia is not the cause for the varying output).
10. What is pulsus bisferians? A “notched” or “twice beating” pulse during late systole (before the dicrotic notch appears, there is a second rise in the systolic pressure, making it look notched).