Embed Size (px)
Citation preview

8/4/2019 HECO - Supply %26 Demand.editedfinal
http://slidepdf.com/reader/full/heco-supply-26-demandeditedfinal 1/96
Supply and Demand
Needs
Wants

8/4/2019 HECO - Supply %26 Demand.editedfinal
http://slidepdf.com/reader/full/heco-supply-26-demandeditedfinal 2/96

8/4/2019 HECO - Supply %26 Demand.editedfinal
http://slidepdf.com/reader/full/heco-supply-26-demandeditedfinal 3/96
Satisfy:
Needs
Wants
PROFITS
MARKETS
Demand Supply
Preference:
Low prices
Preference:
High price
Consumers Producers and Sellers

8/4/2019 HECO - Supply %26 Demand.editedfinal
http://slidepdf.com/reader/full/heco-supply-26-demandeditedfinal 4/96
TERMS TO REMEMBER
1. Market ± a place where buyers and sellers interact and
engage in exchange
2.
Demand ± reflects the consumer¶s desire for acommodity
3. Supply ± the amount of a commodity available for sale
4. Aggregate demand ± the totality of a group of
consumer¶s demand
5. Aggregate supply ± the totality of a group of
producer¶s supply

8/4/2019 HECO - Supply %26 Demand.editedfinal
http://slidepdf.com/reader/full/heco-supply-26-demandeditedfinal 5/96
TERMS TO REMEMBER
6. Demand Schedule ± the quantities consumers are
willing to buy of a good at various prices
7.
Supply schedule ± the quantities producers arewilling to offer for sale at various prices
8. Movement along the curve ± a change from one
point to another on the the same curve
9. Shift of the curve ± a change in the entire curvecaused by a change in the entire demand or supply
schedule
10. Equilibrium ± condition of balance or equality
8/4/2019 HECO - Supply %26 Demand.editedfinal
http://slidepdf.com/reader/full/heco-supply-26-demandeditedfinal 6/96
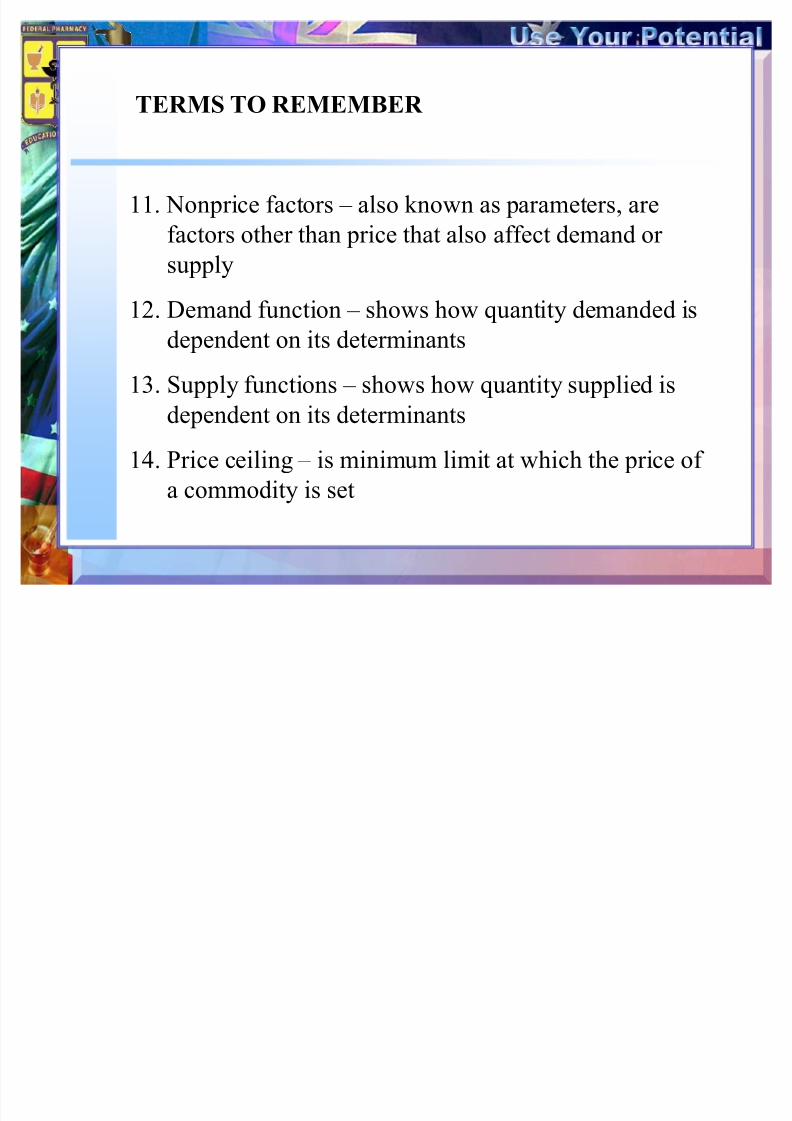
TERMS TO REMEMBER
11. Nonprice factors ± also known as parameters, are
factors other than price that also affect demand or
supply12. Demand function ± shows how quantity demanded is
dependent on its determinants
13. Supply functions ± shows how quantity supplied is
dependent on its determinants
14. Price ceiling ± is minimum limit at which the price of
a commodity is set

8/4/2019 HECO - Supply %26 Demand.editedfinal
http://slidepdf.com/reader/full/heco-supply-26-demandeditedfinal 7/96
TERMS TO REMEMBER
15. Price floor ± a minimum limit beyond which the price
of a commodity is not allowed to fall
16. Surplus ± an excess of supply over the demand for agood

8/4/2019 HECO - Supply %26 Demand.editedfinal
http://slidepdf.com/reader/full/heco-supply-26-demandeditedfinal 8/96
The Law of Demand
� Law of Demand: A principle thatstates that there is an inverse
relationship between price of agood and the amount of it buyersare willing to purchase.
� An increase in costs - reduce the
likelihood that it will be chosen� Lower the price -stimulating
consumption of it

8/4/2019 HECO - Supply %26 Demand.editedfinal
http://slidepdf.com/reader/full/heco-supply-26-demandeditedfinal 9/96
THE LAW OF DEMAND
³ The Demand For Medical Care Derived from the
Demand For Health´
2 Reasons: DEMAND FOR HEALTH
1. It is a consumption commodity ± it makes the
consumer feel better
2. It is an investment commodity ± state of health will
determine the amount of time available to the
consumer

8/4/2019 HECO - Supply %26 Demand.editedfinal
http://slidepdf.com/reader/full/heco-supply-26-demandeditedfinal 10/96
Patients seeks
Consultation
with MD orAnother health
professional
MD decides
Which goods and
Services the
Patient needs;Ex. Drugs,
Hospitalization,
Surgery, laboratory
procedure
Patient
´consumesµ
And pays for
The goods
And services
To improve
health
Patient relies onMD for information
Healthcare Good or Services

8/4/2019 HECO - Supply %26 Demand.editedfinal
http://slidepdf.com/reader/full/heco-supply-26-demandeditedfinal 11/96
Exhibit 1: THE LAW OF DEMAND
� As the Price of
Paracetamol fellduring the 1979-
1986, consumers
purchased more of them. Theconsumption level of
Paracetamol (otherproducts or services)
is inversely relatedto their Price0
200
400
600
800
1000
1200
1400
1600
1800
0 2 4 6 8 10 12 14 16
1979
1983
1986
8/4/2019 HECO - Supply %26 Demand.editedfinal
http://slidepdf.com/reader/full/heco-supply-26-demandeditedfinal 12/96
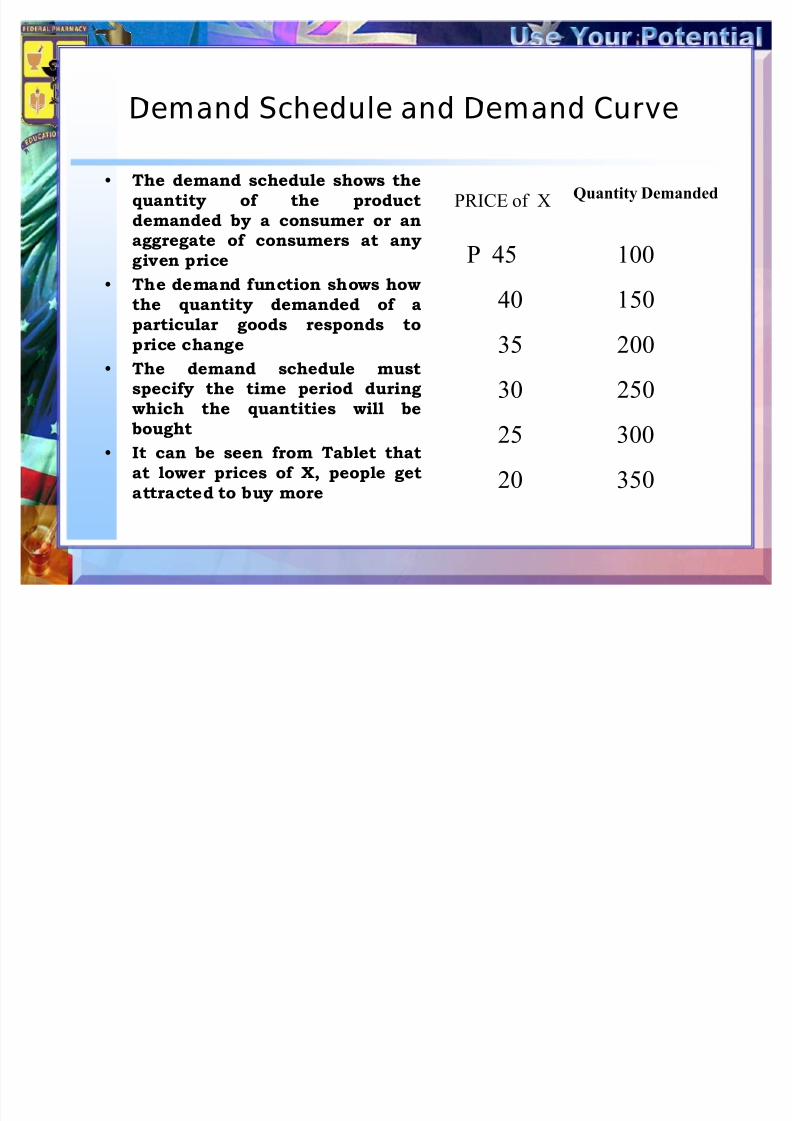
Demand Schedule and Demand Curve
� The demand schedule shows the
quantity of the product
demanded by a consumer or an
aggregate of consumers at any
given price
� The demand function shows how
the quantity demanded of a
particular goods responds to
price change
� The demand schedule must
specify the time period during
which the quantities will bebought
� It can be seen from Tablet that
at lower prices of X, people get
attracted to buy more
PRICE of X Quantity Demanded
P 45 100
40 150
35 200
30 250
25 300
20 350

8/4/2019 HECO - Supply %26 Demand.editedfinal
http://slidepdf.com/reader/full/heco-supply-26-demandeditedfinal 13/96
Demand Schedule and Demand curve
� The Demand curve is a graphicalpresentation of the demandschedule and therefore, containsthe same prices and quantitiespresented in the demand
schedule� Plotting the data from the Table,
we now arrive at the followingfigure
� The normal demand curve slopesdownward from left to right.
Any point on the demand curvereflect the quantity that will bebought at the given price
50 100 150 200 250 300 350 400
50
45
40
35
30
25
20
15
10
5
0
0
0
0
0
0
Quantity Demanded
Price

8/4/2019 HECO - Supply %26 Demand.editedfinal
http://slidepdf.com/reader/full/heco-supply-26-demandeditedfinal 14/96
THE DEMAND CURVE
@ The demand curve is a graphical
representation of the demand schedule.
@ It is a downward sloping curve.
@ It shows the inverse relationship between the
price and quantity of goods that consumers
are willing to buy.

8/4/2019 HECO - Supply %26 Demand.editedfinal
http://slidepdf.com/reader/full/heco-supply-26-demandeditedfinal 15/96
The Demand Curve
� The demand curve, adownward sloping curve,shows the relationshipbetween the price of a good
and the quantity demanded.� At the lower price (P1),
quantity demanded is higher(Q2).
� At a higher price (P2),quantity demanded is lower
(Q1).QuantityQ1 Q2
Price
P2
P1
D

8/4/2019 HECO - Supply %26 Demand.editedfinal
http://slidepdf.com/reader/full/heco-supply-26-demandeditedfinal 16/96
CETERIS PARIBUS ASSUMPTION
Factors other the PRICE which also influence the quantity
of Demand
1. Own price of the product
2. Tastes and preference
3. Income
4. Expectations on the future price
5. Prices of related goods like substitutes
6. Compliments and the size of the population
8/4/2019 HECO - Supply %26 Demand.editedfinal
http://slidepdf.com/reader/full/heco-supply-26-demandeditedfinal 17/96
NOTE:
Therefore, the functional relationship
between PRICE and QUANTITY demanded
is essential since non price factors are assumed
as CONSTANT.
The Law of Demand now States:
³ Assuming other things constant,
PRICE and QUANTITY demanded are
INVERSELY PROPORTIONAL´

8/4/2019 HECO - Supply %26 Demand.editedfinal
http://slidepdf.com/reader/full/heco-supply-26-demandeditedfinal 18/96
1. Own Price of the Product
� A higher ownprice of a product
� A lower own priceof a product
� Decreases thedemand
� Increase thedemand
NOTE: There is an inverse relationship
between the price of the product and
the quantity being demanded

8/4/2019 HECO - Supply %26 Demand.editedfinal
http://slidepdf.com/reader/full/heco-supply-26-demandeditedfinal 19/96
2. Average Income
Differential 1
Differential 2
Income 1
Income 2
Product
Price
Relationship of Income and Price. With the price of a theoretical product
constant, more of such product will be bought with Income 2 which has a bigger
Differential 2, compared to that of Income 1, with a smaller Differential 1

8/4/2019 HECO - Supply %26 Demand.editedfinal
http://slidepdf.com/reader/full/heco-supply-26-demandeditedfinal 20/96
3.
P
opulation Size and Demographics
As the population increases, more people will use
commodities. As more members of the population enter
adulthood, the demand for specific products that are being
used by this specific age group also increases.
Remember that an increase in population generally
increase the demand for most products, and changes or
shifts in population demographics will affect thedemand for specific products.
8/4/2019 HECO - Supply %26 Demand.editedfinal
http://slidepdf.com/reader/full/heco-supply-26-demandeditedfinal 21/96
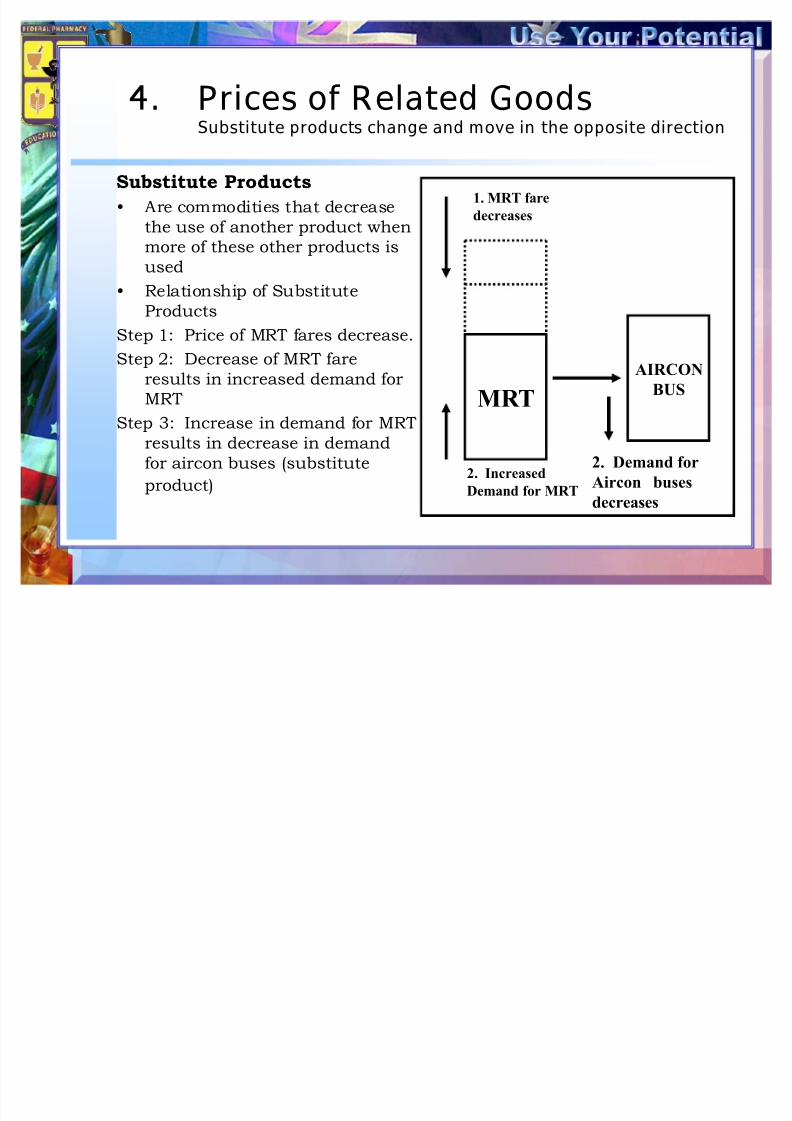
4. Prices of Related GoodsSubstitute products change and move in the opposite direction
Substitute Products
� Are commodities that decreasethe use of another product whenmore of these other products isused
� Relationship of SubstituteProducts
Step 1: Price of MRT fares decrease.
Step 2: Decrease of MRT fareresults in increased demand forMRT
Step 3: Increase in demand for MRT results in decrease in demandfor aircon buses (substitute
product)
MRT
AIRCON
BUS
1. MRT fare
decreases
2. Increased
Demand for MRT
2. Demand for
Aircon buses
decreases

8/4/2019 HECO - Supply %26 Demand.editedfinal
http://slidepdf.com/reader/full/heco-supply-26-demandeditedfinal 22/96
4. Prices of Related GoodsComplementary products change in the same direction
Complementary products
� Are commodities thatdecrease the use of anotherproduct when less of the
other complement is used-and vice versa
� Lower gasoline prices tend toincrease the demand not onlyfor gasoline but also for cars.
� Greater use of one leads to
more use of the other and viceversa.
1. Price
2. Decreased
demand for
gas
GAS
Cars
3. Decreased
demand for
cars

8/4/2019 HECO - Supply %26 Demand.editedfinal
http://slidepdf.com/reader/full/heco-supply-26-demandeditedfinal 23/96
5. Taste of buyers- Influences buying decisions but is more difficult
to assess
- Difficult to measure but very important factors
in decisions of customers
- Failure in determining buyers tastes may lead to
disastrous mistakes in the choice of products to
offer to consumers

8/4/2019 HECO - Supply %26 Demand.editedfinal
http://slidepdf.com/reader/full/heco-supply-26-demandeditedfinal 24/96
6. Other Particular Factors
- climate and weather affect the demand for
specific product
Example: Summer increases the
demand for cough and cold
preparations

8/4/2019 HECO - Supply %26 Demand.editedfinal
http://slidepdf.com/reader/full/heco-supply-26-demandeditedfinal 25/96
The following changes in the non price factors maycause the corresponding shift in the Demand curve
� Increase in Income
� Decrease in income
� Greater taste/preference
� Less taste/preference� Increase in population
� Decrease in population
� Greater speculation
� Less speculation
� Shift to the right
� Shift to the left
� Shift to the right
� Shift to the left� Shift to the right
� Shift to the left
� Shift to the right
� Shift to the left

8/4/2019 HECO - Supply %26 Demand.editedfinal
http://slidepdf.com/reader/full/heco-supply-26-demandeditedfinal 26/96
The Demand shifts
� Shift to the right indicates apositive (+) shift, or an increasein actual demand for acommodity
� Shift to the left indicates anegative(-) shift, or a decreasein the actual demand for acommodity.
� Movement along the curve areappreciated when only the
prices of products are changed. There will be no actual shift.
D
(-) (+)
Decrease
in demand
Movement
along the curve
Increase indemand
Price
Quantity

8/4/2019 HECO - Supply %26 Demand.editedfinal
http://slidepdf.com/reader/full/heco-supply-26-demandeditedfinal 27/96
THE DEMAND SHIFT
Remember that
1. A shift to the left corresponds to an actual
decrease in demand
2. A shift to the right corresponds to an actual
increase in demand
3. There is a ³movement along the curve´ if
only the prices of products are manipulated

8/4/2019 HECO - Supply %26 Demand.editedfinal
http://slidepdf.com/reader/full/heco-supply-26-demandeditedfinal 28/96
The of Law of Supply
� Supply is the amount of acommodity available for sale
� Aggregate supply the totally of agroup of producer·s supply
� Supply schedule is the quantitiesof goods and services producers
are willing to offer for sale atvarious prices

8/4/2019 HECO - Supply %26 Demand.editedfinal
http://slidepdf.com/reader/full/heco-supply-26-demandeditedfinal 29/96
The Law of Supply
� Law of Supply: A principle thatstates there will be a directrelationship between the price of agood and the amount of it offeredfor sale
� Higher prices will induce
producers to supply a greateramount

8/4/2019 HECO - Supply %26 Demand.editedfinal
http://slidepdf.com/reader/full/heco-supply-26-demandeditedfinal 30/96
TERMS
PROFIT: An excess of sales revenue relative to the cost
of production. The cost component includes the
opportunity cost of all resources, including those
owned by the firm.
LOSS: Deficit of sales revenue relative to the cost of
production, once all the resources used have
received their opportunity cost. Losses are a
penalty imposed on those who use resources inlower, rather than higher, valued uses as judged by
buyers in the market.

8/4/2019 HECO - Supply %26 Demand.editedfinal
http://slidepdf.com/reader/full/heco-supply-26-demandeditedfinal 31/96
The supply curve
� The supply curve is an upwardsloping curve.
� It shows the relationshipbetween a good·s and the
quantity that producers arewilling to produce and sell
� At lower price (P1), thequantity produced and sold islower (Q1).
� At higher price (P2), the
quantity produced and sold ishigher at (Q2).
S
Q1 Q2
P1
P2
Price
Quantity

8/4/2019 HECO - Supply %26 Demand.editedfinal
http://slidepdf.com/reader/full/heco-supply-26-demandeditedfinal 32/96
The Supply of Health Services
1. Expert advice from physician or otherhealth personnel
2. Hospital/clinic facilities
3. Pharmaceuticals;
4. Medical technology

8/4/2019 HECO - Supply %26 Demand.editedfinal
http://slidepdf.com/reader/full/heco-supply-26-demandeditedfinal 33/96
Substitution of Inputs
Type of
Inputs
Traditional Substitutes Examples
Obstetric
Manpower forNormalspontaneousdelivery
Physicians Trained
Nurses
Kamuning
Lying-in-clinic
Drugs
Drugs
Branded
Pharmaceuticals
Generics
Herbals
Generic Law
Flavier Herbal
Drug program

8/4/2019 HECO - Supply %26 Demand.editedfinal
http://slidepdf.com/reader/full/heco-supply-26-demandeditedfinal 34/96
Factors Determining Supply
1. Own Price of the Product
- a higher own price of a certain product
gives better profits to the producers andsellers of the product
- when producing and selling a certainproduct give businesses more profits,
producers will produce and sell more

8/4/2019 HECO - Supply %26 Demand.editedfinal
http://slidepdf.com/reader/full/heco-supply-26-demandeditedfinal 35/96

8/4/2019 HECO - Supply %26 Demand.editedfinal
http://slidepdf.com/reader/full/heco-supply-26-demandeditedfinal 36/96
3. Technology and Input PricesThe relationship between production costs changes because of
changes in technology and input prices and its effect on profits
Profit 1
Cost 1
Cost 2
Product XYZ
Selling
Price
TechnologyInput Prices Profit 2
A decrease in production costs (costs 1 > cost 2), brought about byimprovements through technology and input prices gives better profits(profit 2 > profit 1) and thus incentives for producers to produce and sellmore

8/4/2019 HECO - Supply %26 Demand.editedfinal
http://slidepdf.com/reader/full/heco-supply-26-demandeditedfinal 37/96
4. Price of Production Substitutes
ABC Company
Limited 6M·s
X
Low Price
Y
High Price
Z
Low Price
Effect of prices of production substitutes on a certain product.More of the higher-priced product is produced relative to thelower-priced products
8/4/2019 HECO - Supply %26 Demand.editedfinal
http://slidepdf.com/reader/full/heco-supply-26-demandeditedfinal 38/96
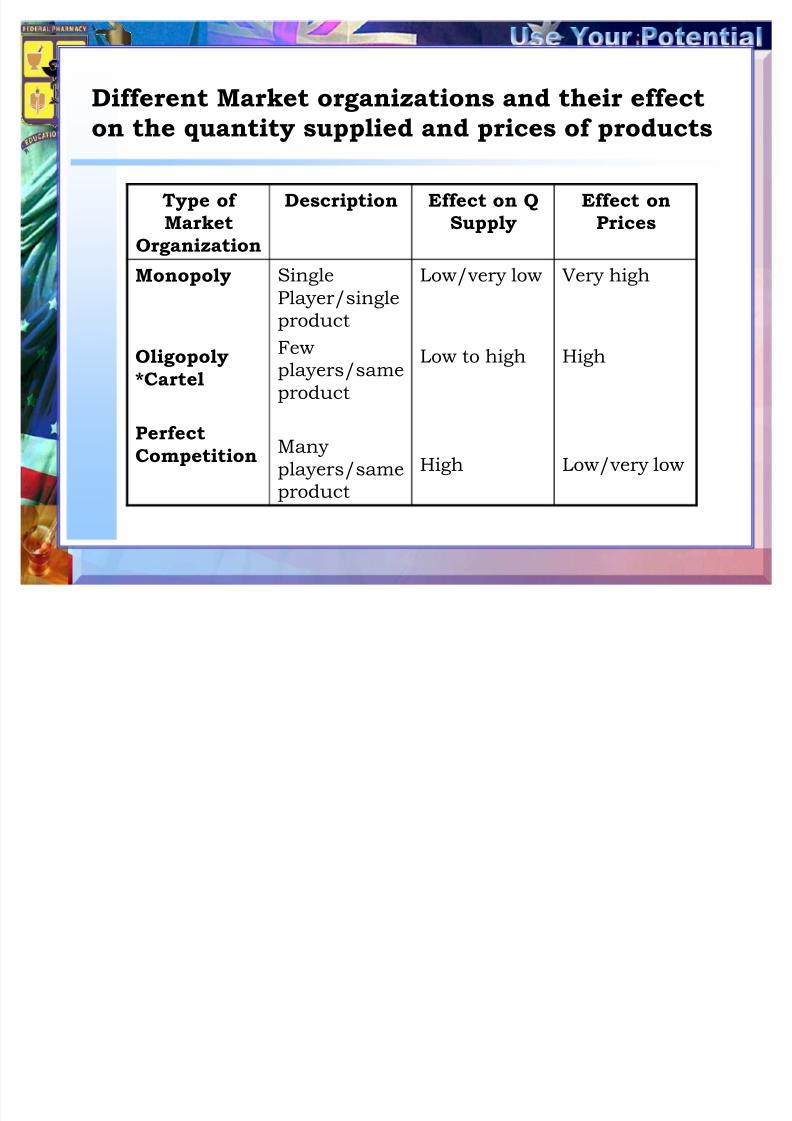
5. Market organization
Types:
1. Monopoly ² is a market structure in whicha commodity is supplied by a single firm
2. Oligopoly ² is a market state of imperfectcompetition, in which the industry isdominated by a small number of
competitors, producing and selling thesame products

8/4/2019 HECO - Supply %26 Demand.editedfinal
http://slidepdf.com/reader/full/heco-supply-26-demandeditedfinal 39/96
TERMS
Perfect competition ² is the best forconsumers
Characteristics
� The number of sellers is numerous
� The products offered by sellers are
almost the same or indistinguishable

8/4/2019 HECO - Supply %26 Demand.editedfinal
http://slidepdf.com/reader/full/heco-supply-26-demandeditedfinal 40/96
TERMS
Monopolistic competition ² is a marketstructure in between oligopoly and
perfect competition wherein manysellers supply goods that are close,but not perfect substitutes
8/4/2019 HECO - Supply %26 Demand.editedfinal
http://slidepdf.com/reader/full/heco-supply-26-demandeditedfinal 41/96
Type of
Market
Organization
Description Effect on Q
Supply
Effect on
Prices
Monopoly
Oligopoly
*Cartel
Perfect
Competition
SinglePlayer/singleproduct
Fewplayers/sameproduct
Manyplayers/sameproduct
Low/very low
Low to high
High
Very high
High
Low/very low
Different Market organizations and their effect
on the quantity supplied and prices of products

8/4/2019 HECO - Supply %26 Demand.editedfinal
http://slidepdf.com/reader/full/heco-supply-26-demandeditedfinal 42/96
6. Particular Factors
a. Cold weather
b. Government
NOTE: These factors may be eitherincrease or decrease the supply of these commodities
8/4/2019 HECO - Supply %26 Demand.editedfinal
http://slidepdf.com/reader/full/heco-supply-26-demandeditedfinal 43/96
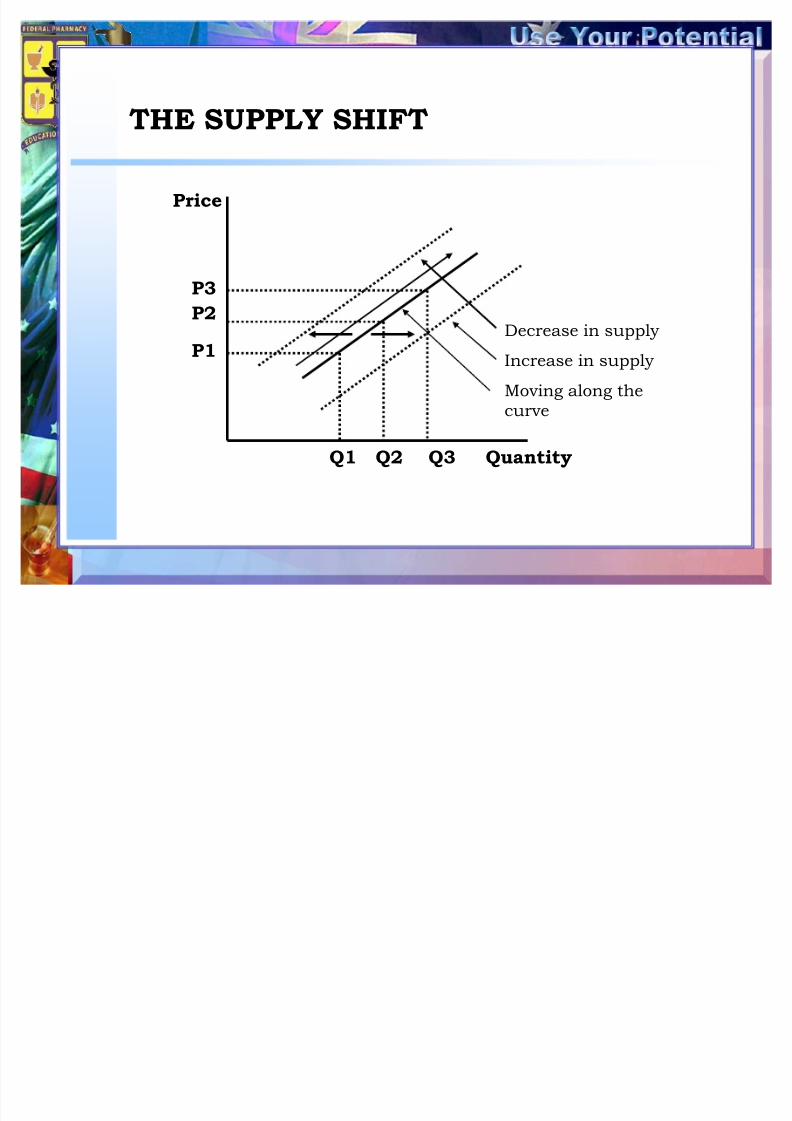
THE SUPPLY SHIFT
Price
Quantity
P3
P2
P1
Q1 Q2 Q3
Decrease in supply
Increase in supply
Moving along thecurve
8/4/2019 HECO - Supply %26 Demand.editedfinal
http://slidepdf.com/reader/full/heco-supply-26-demandeditedfinal 44/96
1. A shift to the left corresponds to anactual decrease in supply
2. A shift to the right corresponds toan actual increase in supply
3. There is only a ´movement along
the curveµ if only the prices of products are manipulated
Remember that «

8/4/2019 HECO - Supply %26 Demand.editedfinal
http://slidepdf.com/reader/full/heco-supply-26-demandeditedfinal 45/96

8/4/2019 HECO - Supply %26 Demand.editedfinal
http://slidepdf.com/reader/full/heco-supply-26-demandeditedfinal 46/96
Supply Schedule and Supply Curve
� The supply curve is upwardsloping from left to right. Itshows a direct relationship
between price and quantitysupplied. Any point on the
supply curve reflects thequantity that will be suppliedat the given price
� After analyzing the aboverelationship we can now statethat as price increases, thequantity supplied of the
product tends to increaseand as price decreases,quantity supplied insteaddecreases
0
10
20
30
40
50
60
0 50 100 150 200 25030 60 90 120 180 210

8/4/2019 HECO - Supply %26 Demand.editedfinal
http://slidepdf.com/reader/full/heco-supply-26-demandeditedfinal 47/96
Exhibit 3: The Supply Curve
� As the price of aproduct increases,other things
constant, producerswill increase theamount of theproduct supplied
P3
P2
P1
Q1
Q2 Q3
S
8/4/2019 HECO - Supply %26 Demand.editedfinal
http://slidepdf.com/reader/full/heco-supply-26-demandeditedfinal 48/96
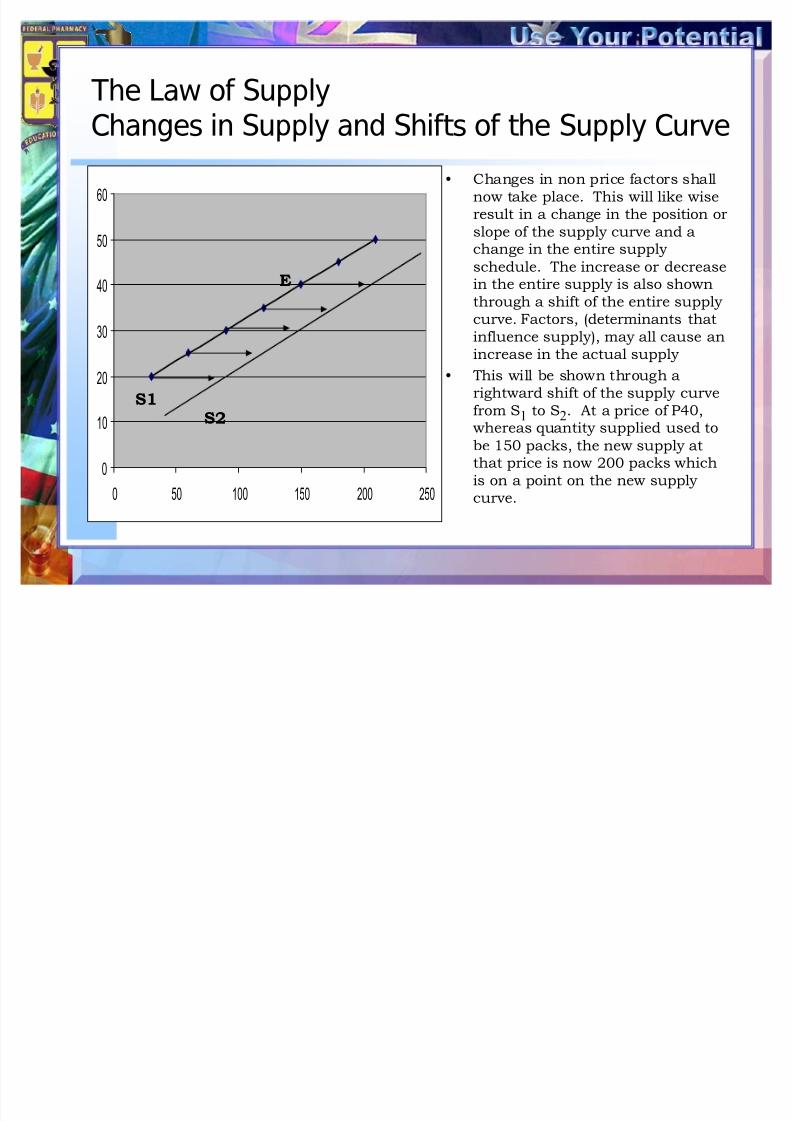
The Law of SupplyChanges in Supply and Shifts of the Supply Curve
0
10
20
30
40
50
60
0 50 100 150 200 250
� Changes in non price factors shallnow take place. This will like wiseresult in a change in the position orslope of the supply curve and achange in the entire supplyschedule. The increase or decrease
in the entire supply is also shownthrough a shift of the entire supplycurve. Factors, (determinants thatinfluence supply), may all cause anincrease in the actual supply
� This will be shown through arightward shift of the supply curvefrom S
1to S
2
. At a price of P40,whereas quantity supplied used tobe 150 packs, the new supply atthat price is now 200 packs whichis on a point on the new supplycurve.
E
S1
S2
8/4/2019 HECO - Supply %26 Demand.editedfinal
http://slidepdf.com/reader/full/heco-supply-26-demandeditedfinal 49/96
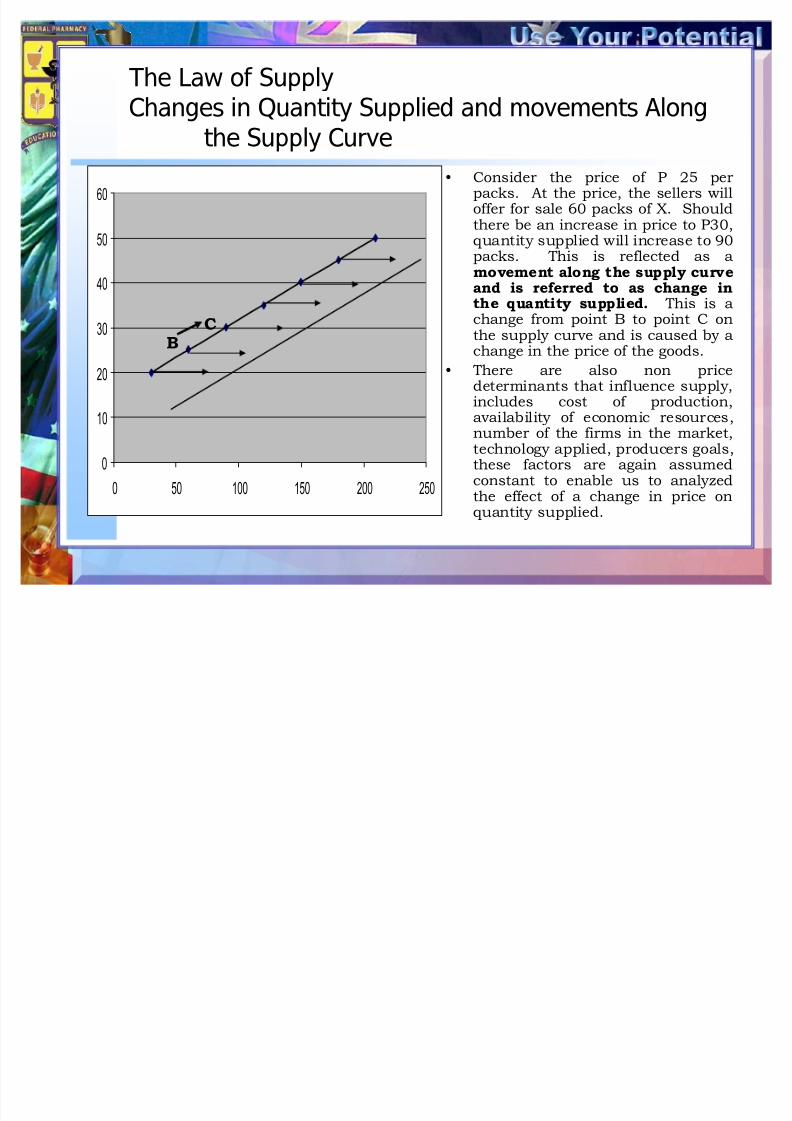
The Law of SupplyChanges in Quantity Supplied and movements Along
the Supply Curve� Consider the price of P 25 per
packs. At the price, the sellers willoffer for sale 60 packs of X. Shouldthere be an increase in price to P30,quantity supplied will increase to 90packs. This is reflected as amovement along the supply curve
and is referred to as change inthe quantity supplied. This is achange from point B to point C onthe supply curve and is caused by achange in the price of the goods.
� There are also non pricedeterminants that influence supply,includes cost of production,
availability of economic resources,number of the firms in the market,technology applied, producers goals,these factors are again assumedconstant to enable us to analyzedthe effect of a change in price onquantity supplied.
0
10
20
30
40
50
60
0 50 100 150 200 250
BC
8/4/2019 HECO - Supply %26 Demand.editedfinal
http://slidepdf.com/reader/full/heco-supply-26-demandeditedfinal 50/96
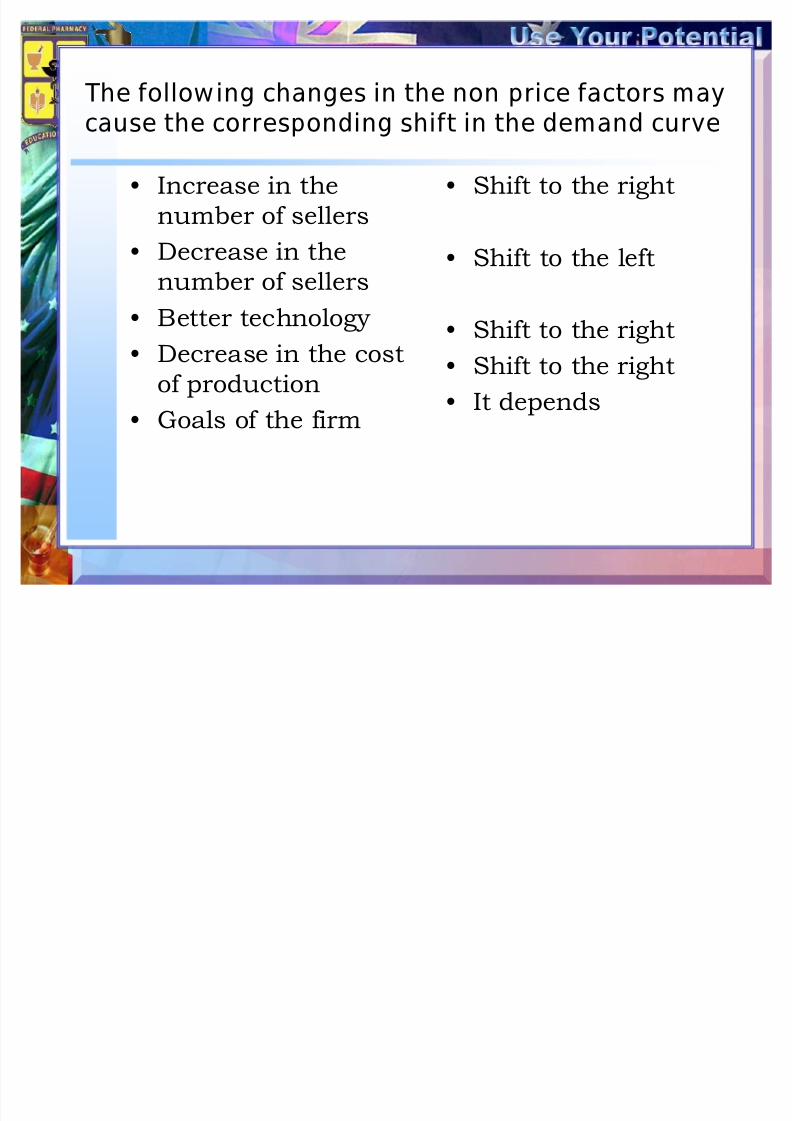
The following changes in the non price factors maycause the corresponding shift in the demand curve
� Increase in thenumber of sellers
� Decrease in the
number of sellers� Better technology
� Decrease in the costof production
� Goals of the firm
� Shift to the right
� Shift to the left
� Shift to the right
� Shift to the right
� It depends

8/4/2019 HECO - Supply %26 Demand.editedfinal
http://slidepdf.com/reader/full/heco-supply-26-demandeditedfinal 51/96
Supply and Demand Interactions
1. Supply and Demand forces are not static
2. They interact dynamically
3. Factors other than price affect eithersupply or demand forces, the supply anddemand curves shift either to the left orright
4. This causes either an increase (shift tothe right) or a decrease (shift to the left)is supply or demand
8/4/2019 HECO - Supply %26 Demand.editedfinal
http://slidepdf.com/reader/full/heco-supply-26-demandeditedfinal 52/96
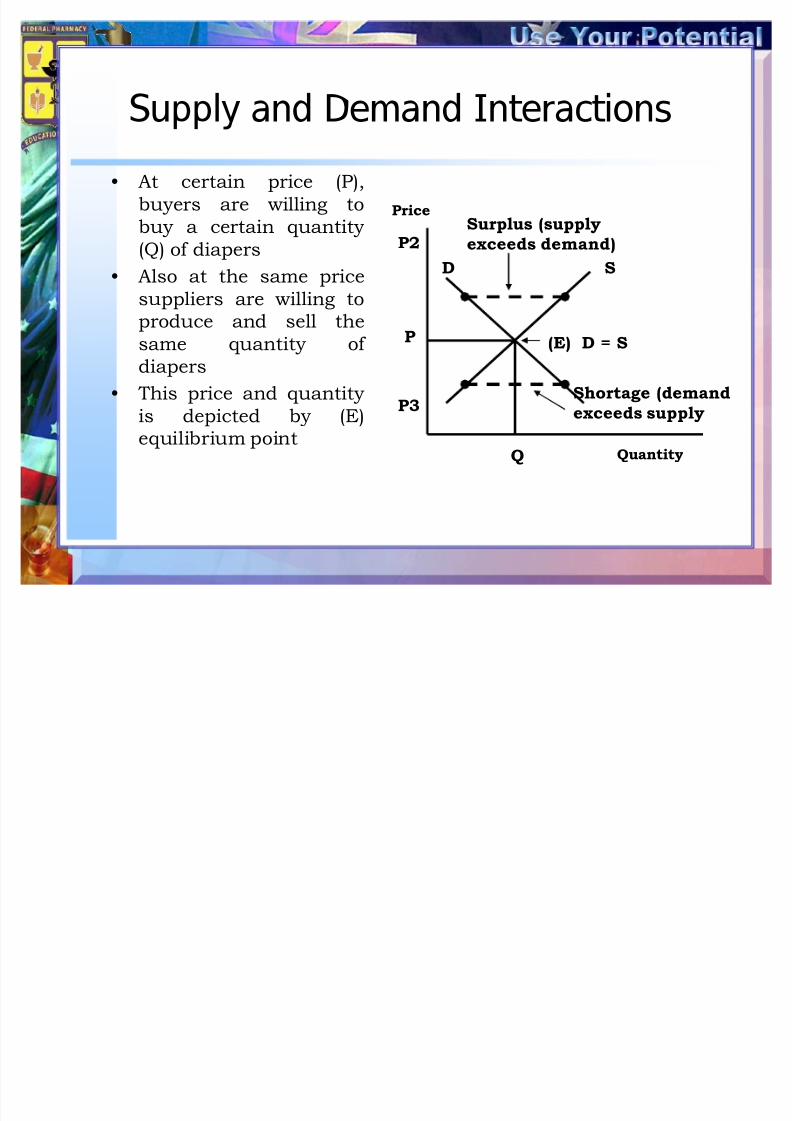
Supply and Demand Interactions
� At certain price (P),buyers are willing tobuy a certain quantity(Q) of diapers
� Also at the same pricesuppliers are willing toproduce and sell thesame quantity of diapers
� This price and quantity
is depicted by (E)equilibrium point
Surplus (supply
exceeds demand)
Shortage (demand
exceeds supply
(E) D = S
Price
Quantity
SD
Q
P
P2
P3
8/4/2019 HECO - Supply %26 Demand.editedfinal
http://slidepdf.com/reader/full/heco-supply-26-demandeditedfinal 53/96
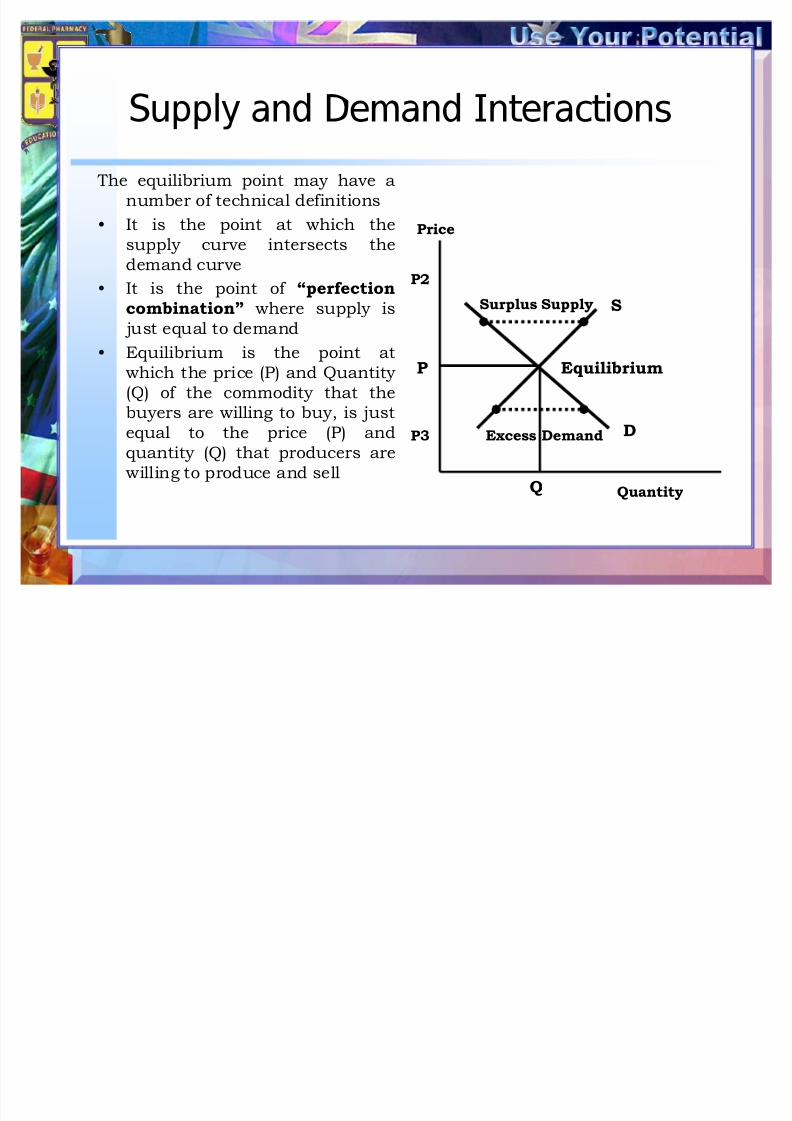
Supply and Demand Interactions
The equilibrium point may have anumber of technical definitions
� It is the point at which thesupply curve intersects thedemand curve
� It is the point of ´perfectioncombinationµ where supply is
just equal to demand
� Equilibrium is the point atwhich the price (P) and Quantity(Q) of the commodity that thebuyers are willing to buy, is justequal to the price (P) andquantity (Q) that producers arewilling to produce and sell
Equilibrium
Excess Demand
Surplus Supply S
D
Q
P
Quantity
Price
P2
P3

8/4/2019 HECO - Supply %26 Demand.editedfinal
http://slidepdf.com/reader/full/heco-supply-26-demandeditedfinal 54/96
Supply and Demand Interactions
� At a price higher (P2) thanequilibrium price (P), moresuppliers will be willing toproduce and sell more, whilebuyers will buy less. Thisbrings about a surplus
situation. There is pressure todecrease prices to enticeconsumers to buy
� At a price lower (P3) thanequilibrium price (P), morebuyers will be willing to buymore, less suppliers will be
willing to produce and sell. This brings about the shortageof goods, and pressure toincrease prices to enticeproducers to produce and sellmore
P
Q Quantity
Price
P2
P3
S
D
E
SurplusSupply
ExcessDemand

8/4/2019 HECO - Supply %26 Demand.editedfinal
http://slidepdf.com/reader/full/heco-supply-26-demandeditedfinal 55/96
Market Equilibrium
� The E is attained at the pointwhere demand is equal to supply
� This point of equality is theEquilibrium point.
� It is corresponds to a price P40,
which is the E price� At this price the Q supplied is also
150 packs
� The ideal situation is when all theQ that is offered will bought by theconsumers, and all the demand
will be met by the sellers� Any price above or below P40 will
be temporary because price willrevert to the E level.
40
35
45
100 120 150 180 200
Surplus Supply
80
Excess Demand
80
E
8/4/2019 HECO - Supply %26 Demand.editedfinal
http://slidepdf.com/reader/full/heco-supply-26-demandeditedfinal 56/96
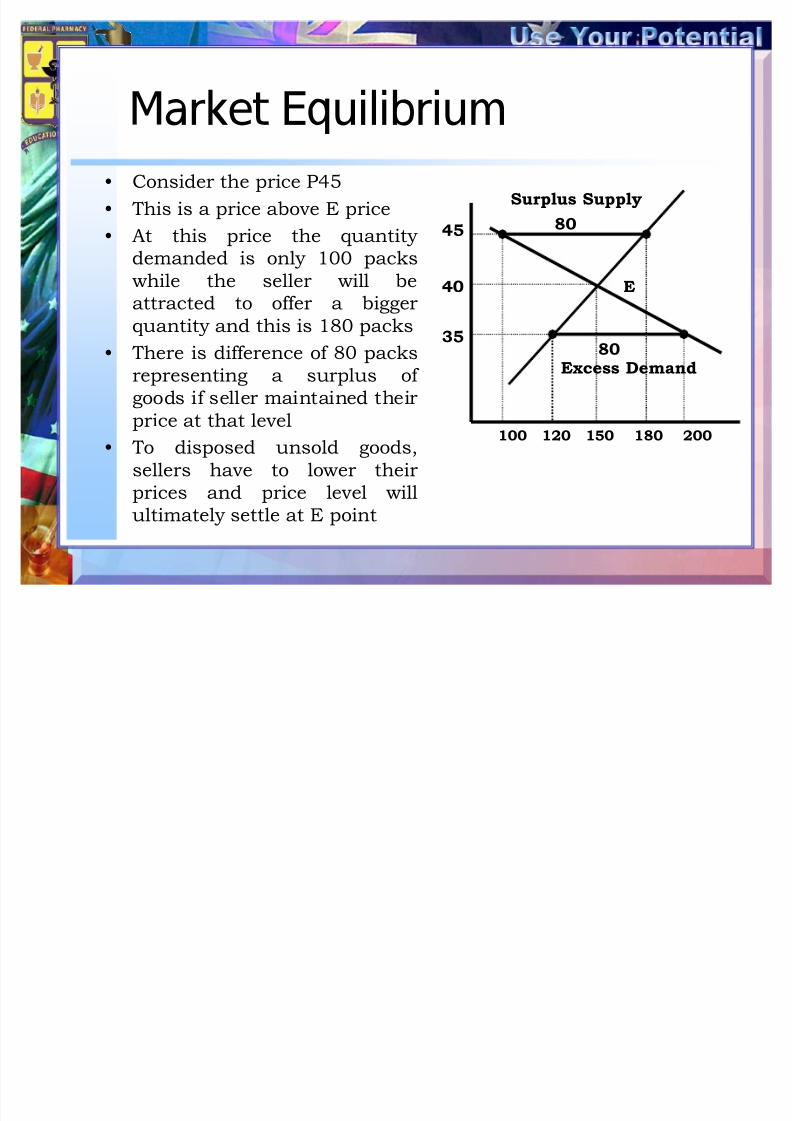
Market Equilibrium
� Consider the price P45
� This is a price above E price
� At this price the quantitydemanded is only 100 packs
while the seller will beattracted to offer a biggerquantity and this is 180 packs
� There is difference of 80 packsrepresenting a surplus of goods if seller maintained their
price at that level� To disposed unsold goods,
sellers have to lower theirprices and price level willultimately settle at E point
100 120 150 180 200
40
35
45
Surplus Supply
Excess Demand
80
80
E

8/4/2019 HECO - Supply %26 Demand.editedfinal
http://slidepdf.com/reader/full/heco-supply-26-demandeditedfinal 57/96
Market Equilibrium
� Analyze what happens at a priceof P35, which is lower than Eprice.
� This low price will attract thebuyers to demand for more, thisquantity demanded correspondsto 200 packs
� The low price will discourage thesellers from offering more. Qsupplied at the price of P35 isdown to 120 packs
� The difference of 80 packsrepresents a shortage of the
product� To fully exploit demand, the
consumers be willing to pay moreand revert the price level at P40where supply meets demands
100 120 150 180 200
Excess Demand80
Surplus Supply
80
E40
35
45

8/4/2019 HECO - Supply %26 Demand.editedfinal
http://slidepdf.com/reader/full/heco-supply-26-demandeditedfinal 58/96
Example: Supply and Demand
� The table indicates the supplyand demand conditions forhealthcare services.
� When the price exceeds P10,
an excess supply is present,which places downwardpressure on price.
� In contrast, when the price isless than P10, an excessdemand results, which causes
the price to rise.� Thus, the market price will
tend toward P10, at whichpoint supply and demand willbalance
350 450 550 650 750
10
Quantity
PriceS
D
Excess Supply
Excess Demand

8/4/2019 HECO - Supply %26 Demand.editedfinal
http://slidepdf.com/reader/full/heco-supply-26-demandeditedfinal 59/96
Price of Product
QuantitySupplied
Quantity
Demanded
Condition inthe Market
Direction onPressure on
Price13 625 400 Excess
SupplyDownward
12 600 450 ExcessSupply
Downward
11 575 500 Excess
Supply
Downward
10 550 550 Balance Equilibrium
9 525 600 ExcessDemand
Upward
8 500 650 Excess
Demand
Upward
7 475 700 ExcessDemand
Upward

8/4/2019 HECO - Supply %26 Demand.editedfinal
http://slidepdf.com/reader/full/heco-supply-26-demandeditedfinal 60/96
A hypothetical Shift in the Market Supply Curvewith Demand Curve Kept Constant
� The point E is subject to changeshifts in either the demand curvealone, or supply curve alone, orboth D and S curves at the sametime can cause change in E in E
point.Example: a rightward shift of the
supply curve, with the originaldemand curve maintained, willresult in a decrease in E price.
� In the graph, the original E price
is at P3 per capsule. The
rightward shift of the supplycurve has caused the E price todrop P2 per capsule.
S1
S2
D1
A
B
Q1 Q2
P3
P2
Price
Quantity
Excess Supply

8/4/2019 HECO - Supply %26 Demand.editedfinal
http://slidepdf.com/reader/full/heco-supply-26-demandeditedfinal 61/96
Hypothetical Shift of the Market demand Curvewith the Market Supply Curve Kept Constant
� In the like manner, a shift of the demand curve with theoriginal supply curvemaintained will cause achange in the E point.
� In this graph, a rightwardshift of the demand curve,with the supply curvemaintained, has caused theE price to increase from P3
to P4 per capsule.
B
A
D2
D1
S1
Q1 Q2 Q3
P4
P3
Price
Quantity
ExcessDemand
(Q3-Q1)

8/4/2019 HECO - Supply %26 Demand.editedfinal
http://slidepdf.com/reader/full/heco-supply-26-demandeditedfinal 62/96
A hypothetical simultaneous shift in both theDemand and Supply Curves
� In the graph, both the D and S
curves show a rightward shift.
� Since the increase in D isproportionate to the increase in
S, the E price is maintained atP3 per capsule.
� However, the new E point
corresponds to a biggerquantity which is now Q5
capsule to a new E position
over time as result of a shift of either the D curve or the S
curve of a commodity.
S1
S2
D2
D1
Q3 Q5
P3
Quantity
Price

8/4/2019 HECO - Supply %26 Demand.editedfinal
http://slidepdf.com/reader/full/heco-supply-26-demandeditedfinal 63/96
THUMBNAIL SKETCH
These factors increase (decrease
the Demand for a good:
� A rise (fall) in consumer income
� A rise (fall) in the price of a good
used as a substitute
� A fall (rise) in the price of acomplementary good often usedwith the original good
� A rise (fall) in the expected futureprice of the good
These factors increase (decrease)
the supply of a good:
� A fall (rise) in the price of aresource used in producing the
good� A technological change allowing
cheaper production of the good
� Favorable weather (bad weatheror a disruption in supply due topolitical factors, or war)

8/4/2019 HECO - Supply %26 Demand.editedfinal
http://slidepdf.com/reader/full/heco-supply-26-demandeditedfinal 64/96
Repealing The Laws of Supply AndDemand
Price Ceiling ² a legally established maximum price thatsellers may charge
Shortage ² a condition in which the amount of a goodoffered by sellers is less than the amountdemanded by buyers at the existing price. Anincrease in price would eliminate the shortage.
Price Floor ² a legally established minimum price thatbuyers must pay for good or resource
Surplus ² a condition in which the amount of a good thatsellers are willing to offer is greater than theamount that buyers will purchase at the existingprice. A decline in price would eliminate thesurplus.

8/4/2019 HECO - Supply %26 Demand.editedfinal
http://slidepdf.com/reader/full/heco-supply-26-demandeditedfinal 65/96
�Elasticity - the responsiveness of demand andsupply to a change in its determinants
�Price Elasticity - the percentage change inquantity compared to a percentage changein price
�Income elasticity of Demand - percentagechange in quantity demanded compared topercentage change in income
�Cross elasticity of Demand - percentage changein quantity demanded of one goodcompared to the percentage change in theprice of a related good.
Elasticity of Supply and Demand

8/4/2019 HECO - Supply %26 Demand.editedfinal
http://slidepdf.com/reader/full/heco-supply-26-demandeditedfinal 66/96
Coefficient of elasticity ² absolute value of elasticity
Total Revenue ² price multiplied by quantity
Inferior goods ² goods which are bought when income
levels are low, the demand for which tends todecrease when income increase.
Normal goods ² goods for which demand tends toincrease when income increase
Substitute goods ² goods used in place of each other
Complementary goods ² goods that supplement eachother and are, therefore, used together
TERMS

8/4/2019 HECO - Supply %26 Demand.editedfinal
http://slidepdf.com/reader/full/heco-supply-26-demandeditedfinal 67/96
Elasticity of DemandDemand Elasticity ´ indicates the extent to
which changes in price cause changes inthe quantity demandedµ
� Classification of Elasticity of
Demand
1. Price elasticity of demand
2. Income Elasticity of Demand3. Cross elasticity of Demand

8/4/2019 HECO - Supply %26 Demand.editedfinal
http://slidepdf.com/reader/full/heco-supply-26-demandeditedfinal 68/96
The Concept of Elasticity in
Pharmacoeconomics/Healthcare
OBJECTIVES
1. Sellers are naturally expected to hopefor more demand for their product
2. Higher revenues
3. To make some decisions to improve
demand for their product
8/4/2019 HECO - Supply %26 Demand.editedfinal
http://slidepdf.com/reader/full/heco-supply-26-demandeditedfinal 69/96
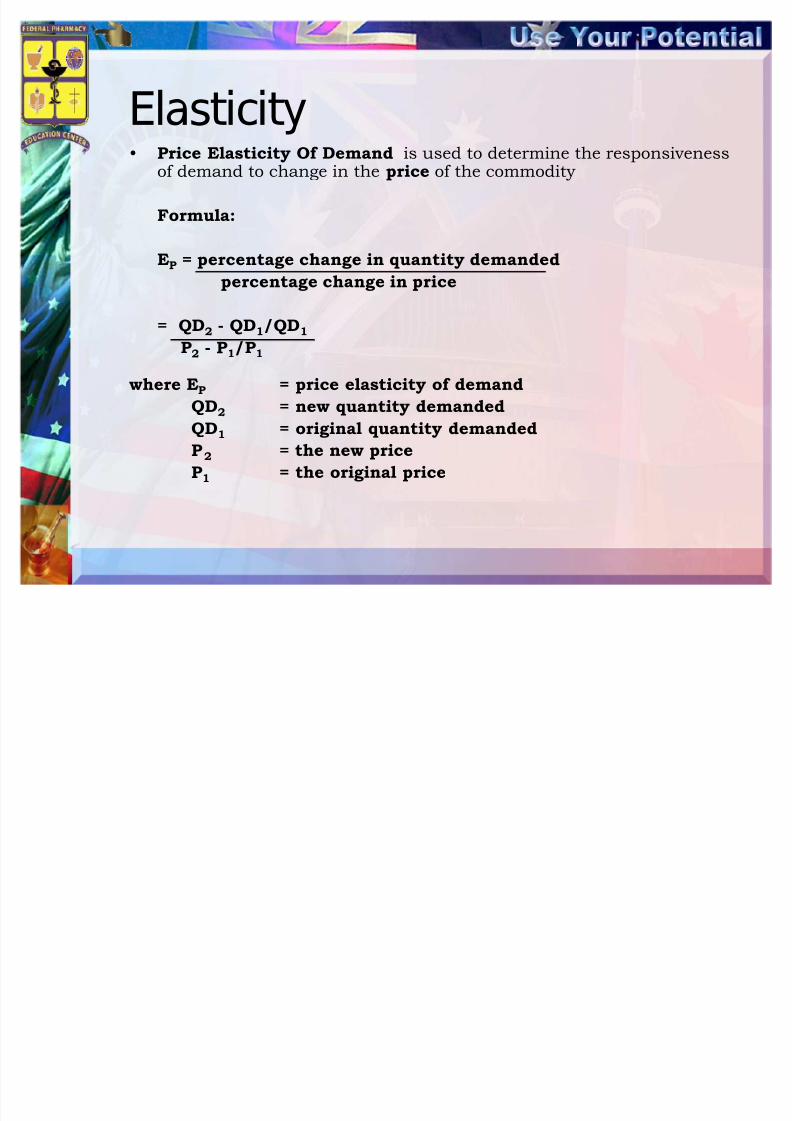
Elasticity� Price Elasticity Of Demand is used to determine the responsiveness
of demand to change in the price of the commodity
Formula:
EP = percentage change in quantity demanded
percentage change in price
= QD2 - QD1/QD1
P2 - P1/P1
where EP = price elasticity of demand
QD2 = new quantity demanded
QD1 = original quantity demandedP 2 = the new price
P1 = the original price

8/4/2019 HECO - Supply %26 Demand.editedfinal
http://slidepdf.com/reader/full/heco-supply-26-demandeditedfinal 70/96
Elasticity� Sample Problem
Original quantity demanded = 10,000 pcs antihypertensive drugs
Original price = P5.00 per tablet
New quantity demanded = 16,000 pcs of antihypertensive drugs
New price = P4.00 per tablet
Answer: 16,000 -10,000/10,000
4.00 -5.00/5.00
= 3

8/4/2019 HECO - Supply %26 Demand.editedfinal
http://slidepdf.com/reader/full/heco-supply-26-demandeditedfinal 71/96
Elasticity� Classification of price Elasticity of Demand
1. Elastic Is that type of demand where the quantity that willbe bought is affected greatly by change in price. Thechange must be greater than elasticity coefficient of 1.
2. Inelastic This refers to the demand where a percentage
change in price creates a lesser change in quantitydemanded.Example: When 20% reduction in price causedonly a 10% increase in demand. The elasticity coefficientin this type is less than 1.
3. Unitary Demand A change in price creates an equal
change in quantity demanded. Example: When 20% pricereduction resulted to 20% increase in demand. Theelasticity under unitary demand is equal to the
coefficient of 1.

8/4/2019 HECO - Supply %26 Demand.editedfinal
http://slidepdf.com/reader/full/heco-supply-26-demandeditedfinal 72/96
Figure 1: Elastic DemandIs the type of demand where the quantity that will be bought is
affected greatly by changes in price. The change must be greater than
elasticity coefficient of 1.
� Original quantity demanded =10,000 pcs of antihypertensivedrugs
� Original price = P5.00 per tablet
� New quantity demanded =16,000 pcs of antihypertensivedrugs
� New price = P4.00 per tablet
EP = 16,000 ² 10,000/10,000
4.00 ² 5.00/5.00
= 3 0
1
2
3
4
5
6
7
0 5 10 15 20
Series1
QD1
QD2

8/4/2019 HECO - Supply %26 Demand.editedfinal
http://slidepdf.com/reader/full/heco-supply-26-demandeditedfinal 73/96
Figure 2: Inelastic DemandThis refers to the demand where a percentage change in price
creates a lesser change in quantity demanded. Example: When a 20%reduction in price caused only a 10% increase in demanded. Theelasticity coefficient in this type is less than 1
� Original quantity demanded =10,000 pcs of antihypertensicve drugs
� Original price = P5.00 per
tablet
� New quantity demanded =11,000 pcs of antihypertensivedrugs
� New price = P4.00
EP = 11,000 ² 10,000/10,0004.00 ² 5.00/5.00
= 0.5
0
1
2
3
4
5
6
7
0 5 10 15 20
Series1
QD1
QD2
8/4/2019 HECO - Supply %26 Demand.editedfinal
http://slidepdf.com/reader/full/heco-supply-26-demandeditedfinal 74/96
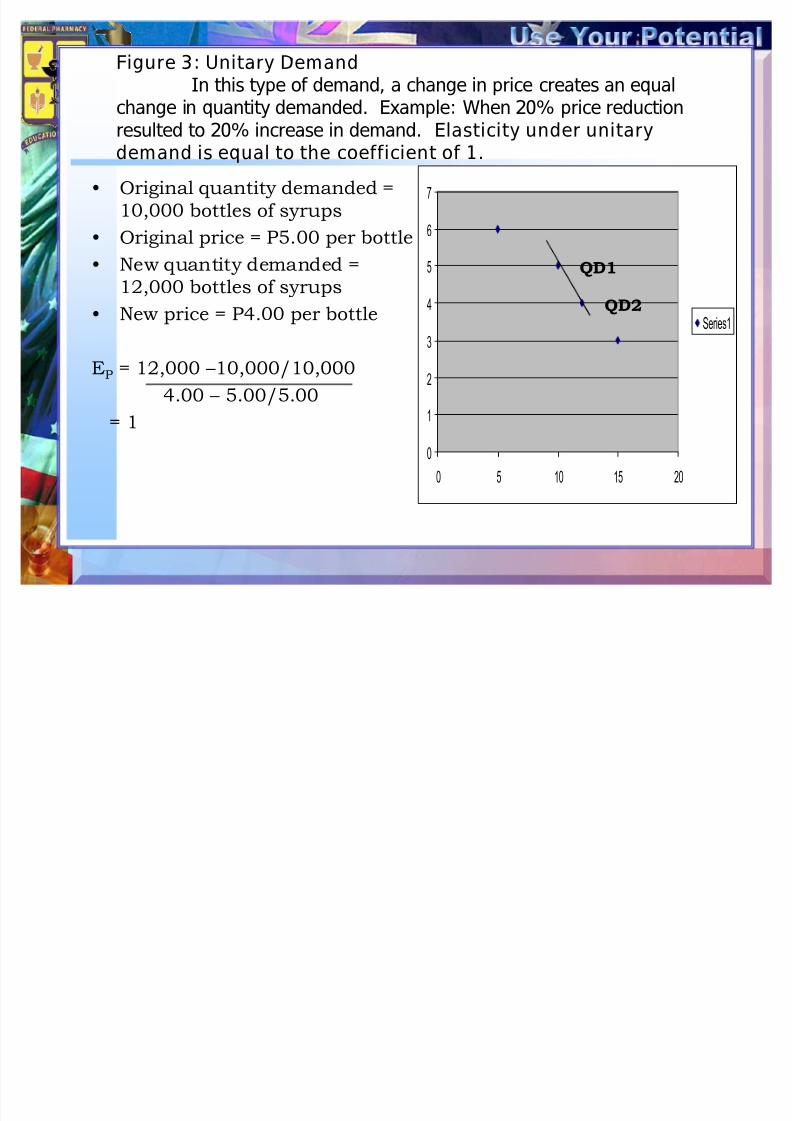
Figure 3: Unitary DemandIn this type of demand, a change in price creates an equal
change in quantity demanded. Example: When 20% price reductionresulted to 20% increase in demand. Elasticity under unitary
demand is equal to the coefficient of 1.
� Original quantity demanded =10,000 bottles of syrups
� Original price = P5.00 per bottle
� New quantity demanded =
12,000 bottles of syrups� New price = P4.00 per bottle
EP = 12,000 ² 10,000/10,000
4.00 ² 5.00/5.00
= 10
1
2
3
4
5
6
7
0 5 10 15 20
Series1
QD1
QD2

8/4/2019 HECO - Supply %26 Demand.editedfinal
http://slidepdf.com/reader/full/heco-supply-26-demandeditedfinal 75/96
Implications of Price Elasticity of
Demand
@ when elasticity is known, it can guide the seller in making
decisions about price
´If the price elasticity of demand
is greater than 1, the price should
be lowered; if less than 1, the
price should be increaseµ
8/4/2019 HECO - Supply %26 Demand.editedfinal
http://slidepdf.com/reader/full/heco-supply-26-demandeditedfinal 76/96
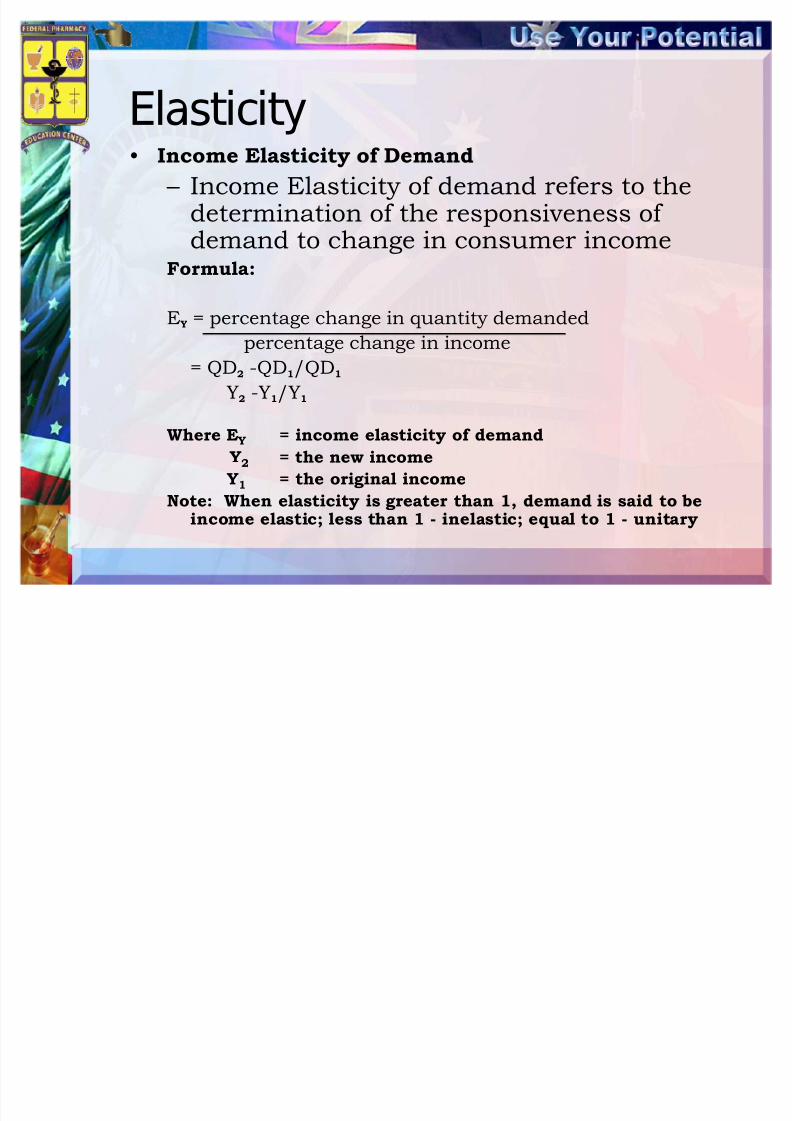
Elasticity� Income Elasticity of Demand
² Income Elasticity of demand refers to thedetermination of the responsiveness of demand to change in consumer income
Formula:
EY = percentage change in quantity demanded
percentage change in income
= QD2 -QD1/QD1
Y2 -Y1/Y1
Where EY = income elasticity of demand
Y2 = the new income
Y1 = the original income
Note: When elasticity is greater than 1, demand is said to beincome elastic; less than 1 - inelastic; equal to 1 - unitary

8/4/2019 HECO - Supply %26 Demand.editedfinal
http://slidepdf.com/reader/full/heco-supply-26-demandeditedfinal 77/96
ElasticityCross Elasticity of Demand
Cross elasticity of demand is the responsiveness of thequality demanded of a particular good to changes in theprices of another good
Formula
QA2 - QA1/QA1
PB2 - PB1/PB1
Where
EC = cross elasticity of demanded
QA2 = new demand for product AQA1 = original demand for product A
PB2 = new price of product B
PB1 = original price of product B

8/4/2019 HECO - Supply %26 Demand.editedfinal
http://slidepdf.com/reader/full/heco-supply-26-demandeditedfinal 78/96
NOTE:If cross elasticity is positive, the goods areSUBSTITUTES.
Example: if 2% increase in the price of
paracetamol drug which causes a 0.66% increase in thedemand for mefenamic acid
If cross elasticity is negative, the goods areCOMPLIMENTS
Example: If hospitalization fee increases resultsto a decrease in the demand for health professionals,hospital personnel are complements

8/4/2019 HECO - Supply %26 Demand.editedfinal
http://slidepdf.com/reader/full/heco-supply-26-demandeditedfinal 79/96
Elasticity� The following summarize the
change in revenue under the twobasis elasticity conditions
Price Increase Price Decrease
Elastic Decrease Increase
Inelastic Increase Decrease
Income Elasticity Of Demanded1. > 1 means demand is elastic and the good is superior
2. < 1 means demand is inelastic and the good is inferior
3. = 1 means demand is unitary and the good is normal

8/4/2019 HECO - Supply %26 Demand.editedfinal
http://slidepdf.com/reader/full/heco-supply-26-demandeditedfinal 80/96
Elasticity
� Determinants of demand Elasticity
1. The price of goods in relation tothe consumer·s budget
2. The availability of substitutes
3. The type of Good
4. The time under consideration

8/4/2019 HECO - Supply %26 Demand.editedfinal
http://slidepdf.com/reader/full/heco-supply-26-demandeditedfinal 81/96
Elasticity� Elasticity of Supply refers to the responsiveness of thesellers to a change in price
Formula
ES = percentage change in quantity supplied
percentage rise in price
= QS2 - QS1/QS1
P2 - P1/P1
Where:
ES = price elasticity of supply
QS2 = new quantity supplied
QS1 = original quantity supplied
P2 = new priceP1 = original price

8/4/2019 HECO - Supply %26 Demand.editedfinal
http://slidepdf.com/reader/full/heco-supply-26-demandeditedfinal 82/96
Elasticity� Classification of supply Elasticity1. Elastic Supply - is where the quantity
supplied is affected greatly by changes in theprice. The change is greater than the
elasticity coefficient of 1.2. Inelastic Supply - when the quantity
supplied is not affected greatly by changes inthe price, supply is said to be inelastic. Theelasticity coefficient is less than 1
3. Unitary Elastic Supply - When the % changein the quantity supplied is equal to thepercentage change in price. The elasticitycoefficient is equal to 1.

8/4/2019 HECO - Supply %26 Demand.editedfinal
http://slidepdf.com/reader/full/heco-supply-26-demandeditedfinal 83/96
Figure 4: Elastic SupplyIs where the quantity supplied is affected greatly by changes in
the price. The change is greater than the elasticity coefficient of
1.� New quantity supplied =
18,000 bottles
� Old quantity supplied =10,000 bottles
� New price (P2) =P6.00/bottle
� Old price (P1) =P5.00/bottle
ES = 18,000 ² 10,000/10,000
6.00 ² 5.00/5.00
= 4 0
1
2
3
4
5
6
7
0 5 10 15 20
Series1
QS2
QS21

8/4/2019 HECO - Supply %26 Demand.editedfinal
http://slidepdf.com/reader/full/heco-supply-26-demandeditedfinal 84/96
Figure 5: Inelastic SupplyWhen the quantity supplied is not affected greatly by changes
in the price, supply is said inelastic. The elasticity coefficient is lessthan 1.
� New quantity supplied = 11,000 bottles
� Old quantity supplied = 10,000 bottles
� New price = P6.00/bottle� Old price = P5.00/bottle
E = 11,000 ² 10,000/10,000
6.00 ² 5.00/5.00
= 0.5
0
1
2
3
4
5
6
7
0 2 4 6 8 10 12
Series1
QS2
QS1

8/4/2019 HECO - Supply %26 Demand.editedfinal
http://slidepdf.com/reader/full/heco-supply-26-demandeditedfinal 85/96
Figure 6: Unitary Elastic SupplyWhen the percentage change in the quantity supplied is equal
to the percentage change in price. The elasticity coefficient isequal to 1.
� New supplied = 12,000 bottles
� Old quantity supplied =10,000 bottles
� New price = P6.00/bottles
� Old price = P5.00/bottles
E = 12,000 ² 10,000/10,000
6.00 ² 5.00/5.00
= 1
0
1
2
3
4
5
6
7
0 2 4 6 8 10 12 14
Series1
QS2
QS1

8/4/2019 HECO - Supply %26 Demand.editedfinal
http://slidepdf.com/reader/full/heco-supply-26-demandeditedfinal 86/96
Elasticity
� Determinants of Supply Elasticity
1. The feasibility and cost of storage
2. The ability of producers torespond to price changes
3. Time

8/4/2019 HECO - Supply %26 Demand.editedfinal
http://slidepdf.com/reader/full/heco-supply-26-demandeditedfinal 87/96
Elasticity
� Elasticity is a measure of responsiveness.
� The most common elasticitymeasurement is that of priceelasticity of demand. It measureshow much consumers respond in
their buying decisions to a changein price.
8/4/2019 HECO - Supply %26 Demand.editedfinal
http://slidepdf.com/reader/full/heco-supply-26-demandeditedfinal 88/96
Elasticity
E = (percentage change inquantity) / (percentage change inprice);
² Where E = coefficient of elasticity
Read that as elasticity is thepercentage change in quantity
divided by the percentage changein price

8/4/2019 HECO - Supply %26 Demand.editedfinal
http://slidepdf.com/reader/full/heco-supply-26-demandeditedfinal 89/96
Demand and Price Elasticity
ÏAn important characteristic of demand is the relationship amongmarket price, quantity demandand consumer expenditure.
ÏDemand - a reduction in marketprice will usually lead to an
increase in quantity demanded.

8/4/2019 HECO - Supply %26 Demand.editedfinal
http://slidepdf.com/reader/full/heco-supply-26-demandeditedfinal 90/96
Demand and Price Elasticity
In some cases a reduction in pricewill be more than offset by a largeincrease in quantity demanded -- asituation where demand is p rice
sensitive or price elastic.

8/4/2019 HECO - Supply %26 Demand.editedfinal
http://slidepdf.com/reader/full/heco-supply-26-demandeditedfinal 91/96
Demand and Price Elasticity
In other cases, the reduction inprice results in a proportionallysmaller increase in quantitydemanded-- a situation wheredemand is p rice insensitive orprice inelastic.

8/4/2019 HECO - Supply %26 Demand.editedfinal
http://slidepdf.com/reader/full/heco-supply-26-demandeditedfinal 92/96
Demand and Price Elasticity
Elastic demand ² (E>1)
² relative change in revenue > relativechange in price
Inelastic demand ² (E<1)
relative change in revenue <relative change in price
Unitary elasticity ² relative changein price & revenue are equal
8/4/2019 HECO - Supply %26 Demand.editedfinal
http://slidepdf.com/reader/full/heco-supply-26-demandeditedfinal 93/96
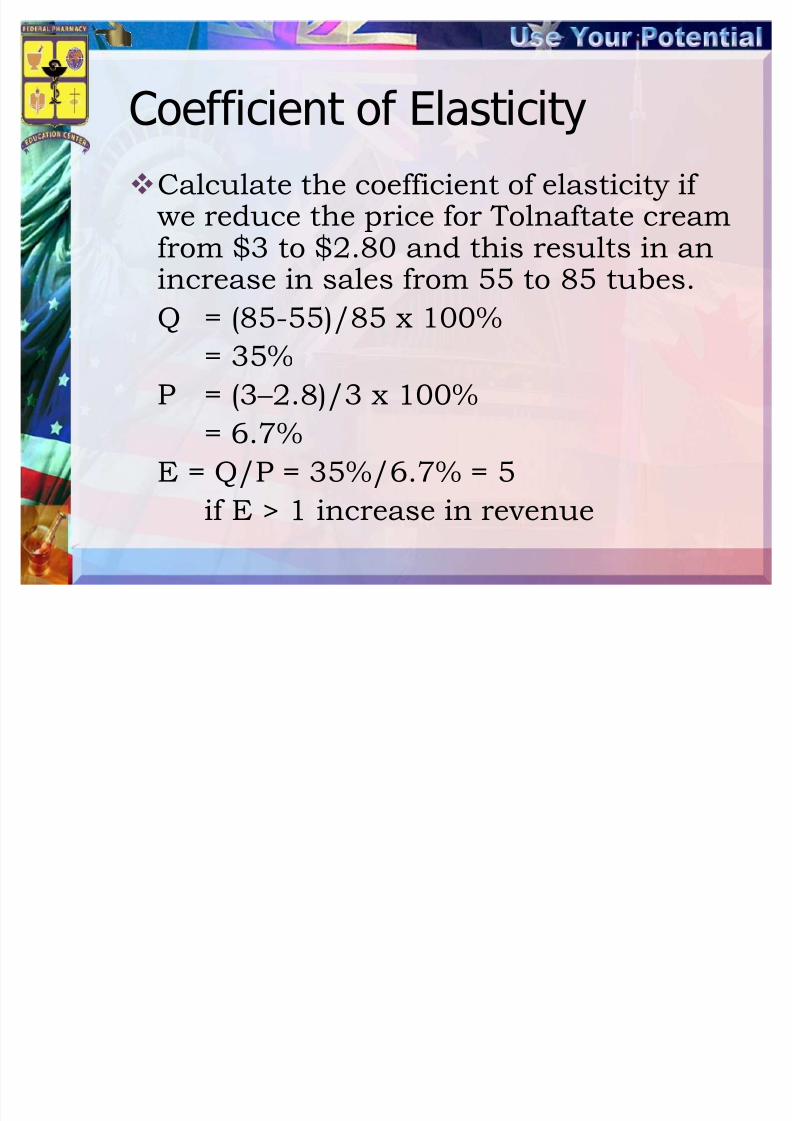
Coefficient of Elasticity
Calculate the coefficient of elasticity if we reduce the price for Tolnaftate creamfrom $3 to $2.80 and this results in an
increase in sales from 55 to 85 tubes.Q = (85-55)/85 x 100%
= 35%
P = (3 ² 2.8)/3 x 100%
= 6.7%E = Q/P = 35%/6.7% = 5
if E > 1 increase in revenue

8/4/2019 HECO - Supply %26 Demand.editedfinal
http://slidepdf.com/reader/full/heco-supply-26-demandeditedfinal 94/96
Demand Curve and Elasticity
As a result of the different degrees of elasticity,
there are different ways of presenting the Demand CurveP
P
P
P
Qd
Qd Qd
Qd
D1 is relatively elastic, achange in price leads to asignificant change in Qd.
D1 D2
D4
D3
D2 is relatively inelastic, achange in price leads to avery slightly change in Qd.
D3 is perfectly elastic. At givenprice, Qd can change infinitely
D4 is perfectly inelastic. At anyprice, the Qd will remain thesame. Qd is equal to zero

8/4/2019 HECO - Supply %26 Demand.editedfinal
http://slidepdf.com/reader/full/heco-supply-26-demandeditedfinal 95/96
Price Elasticity of Supply
As a results of the varying degrees of elasticity of
supply, the following supply curves are also possible:
S1
S3
S2
S4
Qs Qs
QsQs
P
P
P
P
S1 is relatively elastic: Achange in price results in asignificant change in Qs.
S3 is perfectly elastic: At a given price,Qs may change infinitely
S2 is relatively inelastic: Achange in price results in aslight change in QS.
S4 is perfectly inelastic: At any price,Qs remains constant or Qs = 0

8/4/2019 HECO - Supply %26 Demand.editedfinal
http://slidepdf.com/reader/full/heco-supply-26-demandeditedfinal 96/96
THANK YOU!!!