Embed Size (px)
Citation preview

DSM-00059-01
GRAPH PresentationGraphing System
Reference Manual
RIGHT. FROM THE START.
RIGHT. FROM THE START.
RIGHT. FROM THE START.
RIGHT. FROM THE START.
RIGHT. FROM THE START.
RIGHT. FROM THE START.
RIGHT. FROM THE START.
RIGHT. FROM THE START.
RIGHT. FROM THE START.
RIGHT. FROM THE START.
RIGHT. FROM THE START.
RIGHT. FROM THE START.
RIGHT. FROM THE START.

© 1995 Alpha Microsystems
REVISIONS INCORPORATED
REVISION DATE
00 August 1988
01 April 1990
GRAPH Reference Manual
To re-order this document, request part number DSO-00059-00.
The information contained in this manual is believed to be accurate and reliable. However, no responsibilityfor the accuracy, completeness or use of this information is assumed by Alpha Microsystems.
This document applies to GRAPH Versions 1.2 and later
This document may contain references to products covered under U.S. Patent Number 4,530,048.
The following are registered trademarks of Alpha Microsystems, Santa Ana, CA 92799:
AMIGOS AMOS Alpha Micro AlphaACCOUNTINGAlphaBASIC AlphaCALC AlphaCOBOL AlphaDDEAlphaFORTRAN 77 AlphaLAN AlphaLEDGER AlphaMAILAlphaMATE AlphaNET AlphaPASCAL AlphaRJEAlphaWRITE CASELODE OmniBASIC VER-A-TELVIDEOTRAX
The following are trademarks of Alpha Microsystems, Santa Ana, CA 92799:
AlphaBASIC PLUS AlphaVUE AM-PC AMTECDART ESP MULTI inSight/aminFront/am
All other copyrights and trademarks are the property of their respective holders.
ALPHA MICROSYSTEMS2722 S. Fairview St.
P.O. Box 25059Santa Ana, CA 92799

Page iTable of Contents
TABLE OF CONTENTS
CHAPTER 1 - INTRODUCTION1.1 WHAT IS GRAPH? . . . . . . . . . . . . . . . . . . . . . . . . . . . . . . . . . . . . . . . 1-11.2 PREREQUISITES . . . . . . . . . . . . . . . . . . . . . . . . . . . . . . . . . . . . . . . . 1-11.3 INSTALLATION INSTRUCTIONS . . . . . . . . . . . . . . . . . . . . . . . . . . . . 1-11.4 AUDIENCE . . . . . . . . . . . . . . . . . . . . . . . . . . . . . . . . . . . . . . . . . . . . . 1-11.5 DOCUMENTATION . . . . . . . . . . . . . . . . . . . . . . . . . . . . . . . . . . . . . . . 1-21.6 REFERENCE BOOKS . . . . . . . . . . . . . . . . . . . . . . . . . . . . . . . . . . . . . 1-21.7 HOW THIS BOOK IS ORGANIZED . . . . . . . . . . . . . . . . . . . . . . . . . . . 1-31.8 PRINTING CONVENTIONS . . . . . . . . . . . . . . . . . . . . . . . . . . . . . . . . 1-3
CHAPTER 2 - GENERAL CONCEPTS2.1 OVERVIEW . . . . . . . . . . . . . . . . . . . . . . . . . . . . . . . . . . . . . . . . . . . . . 2-12.2 DATA TYPES AND ORGANIZATION . . . . . . . . . . . . . . . . . . . . . . . . . 2-22.3 CHART STYLES . . . . . . . . . . . . . . . . . . . . . . . . . . . . . . . . . . . . . . . . . 2-3
2.3.1 Line Chart . . . . . . . . . . . . . . . . . . . . . . . . . . . . . . . . . . . . . . . . 2-42.3.2 Clustered Bar Chart . . . . . . . . . . . . . . . . . . . . . . . . . . . . . . . . . 2-52.3.3 Stacked Bar Chart . . . . . . . . . . . . . . . . . . . . . . . . . . . . . . . . . . 2-62.3.4 Pie Chart . . . . . . . . . . . . . . . . . . . . . . . . . . . . . . . . . . . . . . . . . 2-72.3.5 Area Chart . . . . . . . . . . . . . . . . . . . . . . . . . . . . . . . . . . . . . . . . 2-82.3.6 X-Y Chart . . . . . . . . . . . . . . . . . . . . . . . . . . . . . . . . . . . . . . . . . 2-9
2.4 CHART OPTIONS . . . . . . . . . . . . . . . . . . . . . . . . . . . . . . . . . . . . . . . . 2-102.4.1 Axis Scaling . . . . . . . . . . . . . . . . . . . . . . . . . . . . . . . . . . . . . . . 2-102.4.2 Titles, Legends and Data Labels . . . . . . . . . . . . . . . . . . . . . . . 2-102.4.3 Text Attributes . . . . . . . . . . . . . . . . . . . . . . . . . . . . . . . . . . . . . 2-102.4.4 Color . . . . . . . . . . . . . . . . . . . . . . . . . . . . . . . . . . . . . . . . . . . . 2-102.4.5 Data Point Markers . . . . . . . . . . . . . . . . . . . . . . . . . . . . . . . . . 2-11
2.5 CHART STORAGE AND RETRIEVAL . . . . . . . . . . . . . . . . . . . . . . . . 2-112.5.1 User Text . . . . . . . . . . . . . . . . . . . . . . . . . . . . . . . . . . . . . . . . . 2-11
CHAPTER 3 - THE GRAPH INTERFACE3.1 CALL DEFINITIONS . . . . . . . . . . . . . . . . . . . . . . . . . . . . . . . . . . . . . . 3-13.2 MEMORY REQUIREMENTS AND USAGE . . . . . . . . . . . . . . . . . . . . 3-23.3 GRAPH PARAMETER STRUCTURE . . . . . . . . . . . . . . . . . . . . . . . . . 3-2
3.3.1 GP.TTL - Chart Title . . . . . . . . . . . . . . . . . . . . . . . . . . . . . . . . 3-33.3.2 GP.ST1 - Subtitle 1 . . . . . . . . . . . . . . . . . . . . . . . . . . . . . . . . . 3-3
GRAPH Reference Manual, Rev. 01

Page ii Table of Contents
3.3.3 GP.ST2 - Subtitle 2 . . . . . . . . . . . . . . . . . . . . . . . . . . . . . . . . . 3-33.3.4 GP.FOT - Footnote . . . . . . . . . . . . . . . . . . . . . . . . . . . . . . . . . 3-33.3.5 GP.XLB - X-axis Label . . . . . . . . . . . . . . . . . . . . . . . . . . . . . . . 3-43.3.6 GP.YLB - Y-axis Label . . . . . . . . . . . . . . . . . . . . . . . . . . . . . . . 3-43.3.7 GP.YST - Y-axis Start Value . . . . . . . . . . . . . . . . . . . . . . . . . . 3-43.3.8 GP.YEN - Y-axis End Value . . . . . . . . . . . . . . . . . . . . . . . . . . 3-43.3.9 GP.YIN - Y-axis Increment . . . . . . . . . . . . . . . . . . . . . . . . . . . 3-43.3.10 GP.YPR - Y-axis Prescale . . . . . . . . . . . . . . . . . . . . . . . . . . . . 3-43.3.11 GP.XST - X-axis Start Value . . . . . . . . . . . . . . . . . . . . . . . . . . 3-53.3.12 GP.XEN - X-axis End Value . . . . . . . . . . . . . . . . . . . . . . . . . . 3-53.3.13 GP.XIN - X-axis Increment . . . . . . . . . . . . . . . . . . . . . . . . . . . 3-53.3.14 GP.XPR - X-axis Prescale . . . . . . . . . . . . . . . . . . . . . . . . . . . . 3-53.3.15 GP.TXA - Default Text Attributes . . . . . . . . . . . . . . . . . . . . . . . 3-53.3.16 GP.FAP - Fill Area Pattern Table . . . . . . . . . . . . . . . . . . . . . . . 3-63.3.17 GP.TYP - Type of Chart . . . . . . . . . . . . . . . . . . . . . . . . . . . . . . 3-63.3.18 GP.XTP - X-axis Type . . . . . . . . . . . . . . . . . . . . . . . . . . . . . . . 3-63.3.19 GP.YTP - Y-axis Type . . . . . . . . . . . . . . . . . . . . . . . . . . . . . . . 3-63.3.20 GP.XGR - X-axis Grid Type . . . . . . . . . . . . . . . . . . . . . . . . . . . 3-63.3.21 GP.YGR - Y-axis Grid Type . . . . . . . . . . . . . . . . . . . . . . . . . . . 3-73.3.22 GP.TCL - Text Color . . . . . . . . . . . . . . . . . . . . . . . . . . . . . . . . 3-73.3.23 GP.BCL - Background Color . . . . . . . . . . . . . . . . . . . . . . . . . . 3-7
3.4 GP.LGN - LEGEND TYPE . . . . . . . . . . . . . . . . . . . . . . . . . . . . . . . . . . 3-83.4.1 GP.MRK - Data Point Marker Type . . . . . . . . . . . . . . . . . . . . . 3-8
3.5 GRAPH DATA STRUCTURE . . . . . . . . . . . . . . . . . . . . . . . . . . . . . . . 3-83.5.1 GR.NUM - Data Range Number . . . . . . . . . . . . . . . . . . . . . . . 3-83.5.2 GR.CNT - Count of Data Points . . . . . . . . . . . . . . . . . . . . . . . . 3-93.5.3 GR.FLG - Data Range Flag . . . . . . . . . . . . . . . . . . . . . . . . . . . 3-93.5.4 GR.CLR - Data Range Color . . . . . . . . . . . . . . . . . . . . . . . . . . 3-93.5.5 GR.LST - Data Range Linestyle . . . . . . . . . . . . . . . . . . . . . . . 3-93.5.6 GR.TTL - Data Range Title . . . . . . . . . . . . . . . . . . . . . . . . . . . 3-103.5.7 GR.DAT - Data Offset . . . . . . . . . . . . . . . . . . . . . . . . . . . . . . . 3-103.5.8 Data Element Structure . . . . . . . . . . . . . . . . . . . . . . . . . . . . . . 3-10
GE.FLG Data Element Flag . . . . . . . . . . . . . . . . . . . . . . 3-10GE.TYP Data Element Type . . . . . . . . . . . . . . . . . . . . . 3-11GE.DTX X Data Value . . . . . . . . . . . . . . . . . . . . . . . . . . 3-11GE.DTY Y Data Value . . . . . . . . . . . . . . . . . . . . . . . . . . 3-11GE.LBL Data Point Label . . . . . . . . . . . . . . . . . . . . . . . 3-11
CHAPTER 4 - GRAPH FUNCTION CALLS4.1 GO.IMP - REPORT IMPURE AREA SIZE . . . . . . . . . . . . . . . . . . . . . . 4-24.2 GO.INI - INITIALIZE IMPURE AREA . . . . . . . . . . . . . . . . . . . . . . . . . . 4-44.3 GO.DSP - DISPLAY CHART . . . . . . . . . . . . . . . . . . . . . . . . . . . . . . . . 4-54.4 GO.LOD - LOAD A GRAPH DEFINITION FILE . . . . . . . . . . . . . . . . . . 4-74.5 GO.SAV - SAVE CURRENT CHART IN GRAPH DEFINITION FILE . 4-94.6 GO.GGP - GET GRAPH PARAMETERS . . . . . . . . . . . . . . . . . . . . . . 4-114.7 GO.PGP - PUT GRAPH PARAMETERS . . . . . . . . . . . . . . . . . . . . . . . 4-134.8 GO.GRD - GET RANGE OF DATA . . . . . . . . . . . . . . . . . . . . . . . . . . . 4-154.9 GO.PRD - PUT RANGE OF DATA . . . . . . . . . . . . . . . . . . . . . . . . . . . 4-174.10 GO.CSR - CLEAR SINGLE RANGE OF DATA . . . . . . . . . . . . . . . . . . 4-19
GRAPH Reference Manual, Rev. 01

Page iiiTable of Contents
4.11 GO.CAR - CLEAR ALL RANGES OF DATA . . . . . . . . . . . . . . . . . . . . 4-204.12 GO.SUP - SET USER POINTER . . . . . . . . . . . . . . . . . . . . . . . . . . . . 4-21
CHAPTER 5 - GDF FILE KEYWORD DEFINITION5.1 GRAPH PARAMETER KEYWORDS . . . . . . . . . . . . . . . . . . . . . . . . . . 5-1
5.1.1 GTY - Type of graph . . . . . . . . . . . . . . . . . . . . . . . . . . . . . . . . 5-15.1.2 GYT - Y-axis type . . . . . . . . . . . . . . . . . . . . . . . . . . . . . . . . . . 5-15.1.3 GYS - Y-axis start . . . . . . . . . . . . . . . . . . . . . . . . . . . . . . . . . . 5-25.1.4 GYE - Y-axis end . . . . . . . . . . . . . . . . . . . . . . . . . . . . . . . . . . . 5-25.1.5 GYI - Y-axis increment . . . . . . . . . . . . . . . . . . . . . . . . . . . . . . . 5-25.1.6 GYP - Y-axis prescale value . . . . . . . . . . . . . . . . . . . . . . . . . . 5-25.1.7 GYG - Y-axis grid type . . . . . . . . . . . . . . . . . . . . . . . . . . . . . . . 5-25.1.8 GXT - X-axis type . . . . . . . . . . . . . . . . . . . . . . . . . . . . . . . . . . 5-35.1.9 GXS - X-axis start . . . . . . . . . . . . . . . . . . . . . . . . . . . . . . . . . . 5-35.1.10 GXE - X-axis end . . . . . . . . . . . . . . . . . . . . . . . . . . . . . . . . . . . 5-35.1.11 GXI - X-axis increment . . . . . . . . . . . . . . . . . . . . . . . . . . . . . . . 5-35.1.12 GXP - X-axis prescale value . . . . . . . . . . . . . . . . . . . . . . . . . . 5-35.1.13 GXG - X-axis grid type . . . . . . . . . . . . . . . . . . . . . . . . . . . . . . . 5-35.1.14 GTC - Text color . . . . . . . . . . . . . . . . . . . . . . . . . . . . . . . . . . . 5-45.1.15 GBC - Background color . . . . . . . . . . . . . . . . . . . . . . . . . . . . . 5-45.1.16 GMT - Data point marker type . . . . . . . . . . . . . . . . . . . . . . . . . 5-45.1.17 LGN - Legend enable . . . . . . . . . . . . . . . . . . . . . . . . . . . . . . . 5-55.1.18 GFP - Fill pattern definition . . . . . . . . . . . . . . . . . . . . . . . . . . . 5-55.1.19 GTA - Text attributes . . . . . . . . . . . . . . . . . . . . . . . . . . . . . . . . 5-55.1.20 GUP - User parameter text line . . . . . . . . . . . . . . . . . . . . . . . . 5-65.1.21 GTL - Title . . . . . . . . . . . . . . . . . . . . . . . . . . . . . . . . . . . . . . . . 5-65.1.22 GS1 - Subtitle 1 . . . . . . . . . . . . . . . . . . . . . . . . . . . . . . . . . . . . 5-65.1.23 GS2 - Subtitle 2 . . . . . . . . . . . . . . . . . . . . . . . . . . . . . . . . . . . . 5-65.1.24 GFN - Footnote . . . . . . . . . . . . . . . . . . . . . . . . . . . . . . . . . . . . 5-65.1.25 GXL - X-axis label . . . . . . . . . . . . . . . . . . . . . . . . . . . . . . . . . . 5-65.1.26 GYL - Y-axis label . . . . . . . . . . . . . . . . . . . . . . . . . . . . . . . . . . 5-7
5.2 GRAPH DATA KEYWORDS . . . . . . . . . . . . . . . . . . . . . . . . . . . . . . . . 5-75.2.1 GnC - Range color . . . . . . . . . . . . . . . . . . . . . . . . . . . . . . . . . . 5-75.2.2 GnS - Range linestyle . . . . . . . . . . . . . . . . . . . . . . . . . . . . . . . 5-75.2.3 GnT - Range title . . . . . . . . . . . . . . . . . . . . . . . . . . . . . . . . . . . 5-85.2.4 RnDm - Data element . . . . . . . . . . . . . . . . . . . . . . . . . . . . . . . 5-85.2.5 RnLm - Data Element Label . . . . . . . . . . . . . . . . . . . . . . . . . . 5-8
APPENDIX A - ERROR CODES REPORTED BY GRAPH
DOCUMENT HISTORY
INDEX
GRAPH Reference Manual, Rev. 01

CHAPTER 1
INTRODUCTION
1.1°°WHAT IS GRAPH?
The GRAPH program and interface described in this document provide a a fully-featuredpresentation graphing system for use with the Alpha Micro Graphics Operating System(AMIGOS). The GRAPH system interface allows incorporation of chart creation, storage,retrieval, and modification into a program application. For more information regardingAMIGOS, please see the AMIGOS Reference Manual.
1.2°°PREREQUISITES
The GRAPH software requires AMOS/L 1.3C or later, or AMOS/32 1.0 or later as the hostoperating system and AMIGOS version 1.1 or later for the graphics interface. Forcomplete compatibility information, see the current AMIGOS Release Notes.
1.3°°INSTALLATION INSTRUCTIONS
The GRAPH software is a part of the AMIGOS product and as such is contained in theAMIGOS software media. GRAPH software installation instructions are included in theAMIGOS Release Notes.
1.4°°AUDIENCE
This reference manual is intended for application programmers and assumes you arefamiliar with the AMIGOS software, the AMOS operating system and the AlphaBASIC,AlphaC, or Assembler programming languages.
GRAPH Reference Manual, Rev. 01

Page 1-2 Chapter 1
1.5°°DOCUMENTATION
This document is a part AMIGOS’s documentation library which consists of these books:
°°°AMIGOS Reference Manual - gives a brief introduction to graphics systems ingeneral and includes detailed information for all AMIGOS functions.
°°°AMIGOS Release Notes - contains all the information you need to get AMIGOSand GRAPH up and running on your computer.
°°°GRAPH Reference Manual - describes how to use the GRAPH software withAMIGOS to let your application make, store, retrieve and modify charts.
1.6°°REFERENCE BOOKS
During development of the AMIGOS and GRAPH software, the books listed below haveproven to be excellent resources for information about graphics.
°°°Computer Graphics. Written by Donald Hearn and M. Pauline Baker. Published in1986 by Prentice-Hall, Inc.
°°°Principles of Interactive Computer Graphics, second edition. Written by WilliamM. Newman, Robert F. Sproull. Published in 1979 by McGraw-Hill BookCompany.
°°°Computer Graphics A Programming Approach. Written by Steven Harrington.Published in 1983 by McGraw-Hill Book Company.
°°°Fundamentals of Interactive Computer Graphics. Written by J. D. Foley and A.Van Dam. Published in 1982 by Addison-Wesley Publishing Company, Inc.
°°°Raster Graphics Handbook. Written and published by Conrac Corporation in1980.
°°°PostScript Language Tutorial and Cookbook. Written by Adobe Systems Incorpor-ated. Published in 1985 by Addison-Wesley Publishing Company, Inc.
°°°PostScript Language Reference Manual. Written by Adobe Systems Incorporated.Published in 1985 by Addison-Wesley Publishing Company, Inc.
°°°PostScript Language Program Design. Written by Adobe Systems Incorporated.Published in 1988 by Addison-Wesley Publishing Company, Inc.
Alpha Microsystems documents you may need to refer to are:
°°°AMOS Monitor Calls Reference Manual
GRAPH Reference Manual, Rev. 01

Page 1-3Introduction
°°°AlphaBASIC User’s Manual
°°°AlphaBASIC PLUS User’s Manual
°°°AlphaBASIC XCALL Subroutine User’s Manual
°°°AMOS Terminal System Programmer’s Manual
1.7°°HOW THIS BOOK IS ORGANIZED
The GRAPH Reference Manual is organized into five chapters and one appendix.
Chapter°2°-°"General Concepts" introduces you to terms and ideas particular to theGRAPH software.
Chapter°3-°"The GRAPH Interface" describes Assembler, AlphaBASIC and AlphaC calldefinitions, memory requirements, the GRAPH parameter and data structures.
Chapter°4°"GRAPH Function Calls" describes the function calls associated with GRAPH.
Chapter 5°-°"GDF File Keyword Definition" provides the currently supported keywordsdefining the graph definition file format.
Appendix A°-°"Error Codes Reported by GRAPH" lists the error codes, and correspondingmeaning, which are returned by the GRAPH software.
1.8°°PRINTING CONVENTIONS
Like other Alpha Micro documents, this book uses standard symbols and abbreviations tomake the information easier to read and understand.
SYMBOL DESCRIPTION
°type This mono-spaced courier type face is used whenillustrating the function format. For example:
CALL GO.IMP(A6)
{°°°°°} Optional elements in a function are enclosed withinbraces. When these symbols appear in a sample, theydesignate elements you may omit from the call.
GRAPH Reference Manual, Rev. 01

CHAPTER 2
GENERAL CONCEPTS
GRAPH is organized as a collection of subroutines which may be used by an applicationprogram to create presentation charts and graphs on a variety of output devices with datasupplied by an application program. GRAPH uses the AMIGOS device-independent graphicsinterface to provide flexibility in output options. A chart created on a CRT based display may beoutput on a laser printer or plotter without additional change or programming effort.
2.1°°OVERVIEW
The program GRAPH.SYS is the heart of the GRAPH system. It contains all of thesubroutines required to create and display charts. GRAPH makes use of the AMIGOSgraphics operating system which must be loaded in system memory before GRAPHmay be used. You may load GRAPH.SYS into the user’s partition or it may reside insystem memory.
The file GRFSYM.M68 is used by assembly language programmers to define all of thecalls and data structures provided by GRAPH.
AlphaBASIC programs may access GRAPH.SYS through use of the GRFSBR.SBRexternal subroutine. The file GRFSYM.BSI may be INCLUDEd in your AlphaBASICprogram to define the calls and variables used.
The AlphaC program interface to the GRAPH system is provided by the file GRAPH.Hwhich may be included in your AlphaC program. In addition, the compiled object modulemust be linked with the GRFCLB.LIB library file to complete the interface.
The following sequence of events typifies a normal communication session withGRAPH. The sequence assumes a chart was previously created and resides on disk asCHART.GDF. Please refer to the AMIGOS Reference Manual for more detailed informa-tion regarding AMIGOS functions.
1.°°°Allocate a GCB (graphics control block) and perform an AMIGOS GOPWK (openworkstation) call to initialize the desired output device.
2.°°°Perform an AMIGOS GCLRW (clear workstation) call to clear and initialize theworkstation.
GRAPH Reference Manual, Rev. 01

Page 2-2 Chapter 2
3.°°°Perform a GRAPH GO.IMP call to determine how much impure memory isrequired.
4.°°°Allocate the required memory.
5.°°°Perform a GRAPH GO.INI call to initialize the impure memory area.
6.°°°Open the file CHART.GDF for input and perform a GRAPH GO.LOD call to loadthe chart into the impure space.
7.°°°Perform various storage and retrieval calls to GRAPH to return and store datavalues and/or chart parameters as necessary. This allows your program to modifychart values without regard to impure area layout.
8.°°°Perform a GRAPH GO.DSP call to display the modified chart on the output device.
9.°°°Open a file for output and perform a GRAPH GO.SAV call to store the modifiedchart on disk.
10.°°°Close all files and perform an AMIGOS GCLWK call to close the outputworkstation.
It is not necessary to load a chart from an existing file. Your program may perform allinitialization steps and simply provide data and chart parameters for display.
2.2°°DATA TYPES AND ORGANIZATION
The underlying purpose of the GRAPH system is to present the user’s data in as clear amanner as possible. This data may be provided to GRAPH from any source the userwants. All data must be supplied in AMOS compatible 6-byte floating point format.
Each data point on a chart is represented by a corresponding X and Y coordinate pair.In all charts except X-Y, only the Y portion is used to represent the data value. A groupof data points corresponding to a particular theme is referred to as a "Range" of data.Up to eight data ranges may be defined and plotted on a single chart. Thus, on a linechart, eight data ranges would appear as eight separate line plots, one for each range.
GRAPH supports both positive and negative data values within the range of floatingpoint limits imposed by the system. Certain chart types cannot support negative datapoints. These chart types accumulate a total which assumes a total greater than theprevious value. An example is the pie chart where it would be difficult to display a piewedge representing a negative percentage of the total.
GRAPH Reference Manual, Rev. 01

Page 2-3General Concepts
2.3°°CHART STYLES
GRAPH displays six basic chart styles:
Line Charts Pie ChartsClustered Bar Charts Area ChartsStacked Bar Charts X-Y Charts
In the following examples, each chart consists of two data ranges comprised of six datapoints each with the following values:
Data °°Range 1 °°Range 2Point X Y X Y
1 °2.0 °4.0 °1.5 °3.0 2 °3.5 °9.0 °8.0 10.0 3 °5.2 °3.0 °8.4 °7.5 4 °7.0 °6.0 11.75 12.0 5 10.3 °1.2 16.0 °4.9 6 15.0 19.6 20.0 °7.0
GRAPH Reference Manual, Rev. 01
Page 2-4 Chapter 2
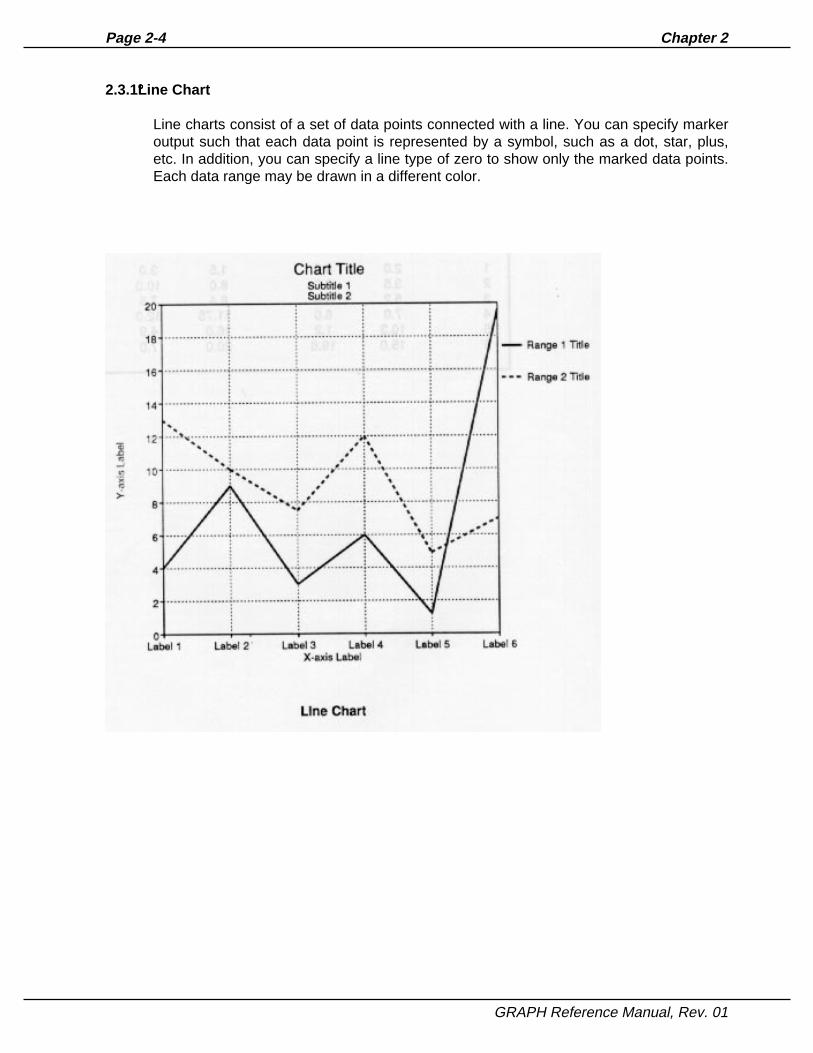
2.3.1°°Line Chart
Line charts consist of a set of data points connected with a line. You can specify markeroutput such that each data point is represented by a symbol, such as a dot, star, plus,etc. In addition, you can specify a line type of zero to show only the marked data points.Each data range may be drawn in a different color.
GRAPH Reference Manual, Rev. 01

Page 2-5General Concepts
2.3.2°°Clustered Bar Chart
The clustered bar chart, or simply bar chart, consists of a filled rectangular area torepresent the Y magnitude of the data points. Multiple data ranges are displayedadjacent to each other for comparison purposes. Each range may be represented by avariable color.
GRAPH Reference Manual, Rev. 01

Page 2-6 Chapter 2
2.3.3°°Stacked Bar Chart
The stacked bar chart is similar to the clustered bar chart except the Y-data point valuesfrom each range are added and stacked one on top of another to show a cumulativetotal.
Positive and negative data values are accumulated separately, with the total of positivevalues displayed above the X axis, and the total of all negative values displayed belowthe X axis.
GRAPH Reference Manual, Rev. 01

Page 2-7General Concepts
2.3.4°°Pie Chart
The pie chart represents a single range of data as a pie-wedge percentage of the rangetotal. The color of each sector may be selected. Negative data values are ignored in piecharts.
GRAPH Reference Manual, Rev. 01

Page 2-8 Chapter 2
2.3.5°°Area Chart
The area chart is similar to the stacked bar chart except that the Y-data values arelinked together in a filled area which tends to more dramatically show trends in the datapattern.
Positive and negative data values are accumulated separately, with the total of positivevalues displayed above the X axis, and the total of all negative values displayed belowthe X axis.
GRAPH Reference Manual, Rev. 01

Page 2-9General Concepts
2.3.6°°X-Y Chart
The X-Y chart is used for relational plotting of coordinate pairs. The data points arelinked with a line which may be blanked or altered in the same manner as the line chart.
GRAPH Reference Manual, Rev. 01

Page 2-10 Chapter 2
2.4°°CHART OPTIONS
GRAPH is able to produce a chart from a minimum set of parameters. Many of the chartfeatures such as axis scaling, headings, subtitles, text color, and legend output areproduced as defaults when displaying a chart. You can alter these parameters toproduce customized charts.
2.4.1°°Axis Scaling
When given a set of data points to plot, GRAPH calculates the minimum and maximumrange of the data and creates X and Y axes with scales to accommodate the entire datarange. Users need not be concerned with scale values in order to produce an initialchart. However, in many applications it is necessary to modify the starting and endingvalues of an axis. In addition, the data might be more easily understood if theincremental axis points were user-definable. Perhaps each data value should beprescaled, or multiplied by a fixed value before display. GRAPH allows all of theseoptions on both the X and Y axes.
2.4.2°°Titles, Legends and Data Labels
GRAPH provides a rich set of titles, subtitles, axis labels, and data labels which are userdefinable. In addition, each data range label may be used to produce an optional legendwhich distinguishes the individual data ranges.
2.4.3°°Text Attributes
Titles, subtitles, and labels may be defined with individual text attributes. Each textelement is produced using default values for font, character height, color, rotation, andorigin. These attributes may be modified by your program on an individual basis.
2.4.4°°Color
GRAPH allows users to modify the color output of text, background, and data areasindividually. A pre-defined set of colors is available, or users may specify special colorsif the workstation used supports them. On monochrome workstations, such as laserprinters, the color is represented by varying degrees of gray scale or a specific fillpattern.
GRAPH Reference Manual, Rev. 01

Page 2-11General Concepts
2.4.5°°Data Point Markers
GRAPH allows you to specify optional marker types to represent each data point. Usingthese markers, and specifying a zero line type, allows your program to produce scattercharts when in line or X-Y mode.
2.5°°CHART STORAGE AND RETRIEVAL
GRAPH provides two calls, GO.LOD and GO.SAV, to allow storage and retrieval ofcompleted charts. GRAPH stores the chart on disk in a simple keyword text format. Thisfile is referred to as a Graph Definition File and is generally given an extension of .GDF.You do not need to access this file directly as all subsequent access may be beperformed by GRAPH. The data in the GDF file is not keyed to a particular program oroutput device. It is a universal exchange file which may be used by another program todisplay the same chart on a different output device.
2.5.1°°User Text
It might be convenient for a particular application program to store some additional datain the GDF file so that it may retrieve that data when loading the chart during asubsequent session. An example of this requirement might be a program which charts acolumn of data from a spreadsheet containing many columns. Upon loading the chart ata later date, it would be convenient for the program to determine which column the datacame from. In this case, the program would need to store the column number in theGDF file for later retrieval.
Since many different programs are able to create and modify charts through use of theGRAPH interface, the information stored in the GDF file by one program must be able tobe discerned from that which was placed there by another program. In addition, all userinformation which is not used by the current program must be passed to any newmodified GDF files. These functions are performed by the User Text Pointer Systemwithin GRAPH.
Within the impure area controlled by GRAPH are 100 pointers which are initialized witha value of zero. Each application program is assigned a unique number in the range of 1to 99. When a program wishes to store or retrieve information in the GDF file, itinitializes its appropriate pointer with an index to a text buffer which resides in the user’smemory space. Once this pointer is initialized, any information in the GDF file whichcorresponds to that pointer number is loaded or stored from the user’s text buffer. Allother user text in the GDF file is ignored.
Before loading a GDF file, your program initializes its text buffer pointer through use ofthe GO.SUP call. If the GDF file is to be updated, your program opens a new file foroutput and informs GRAPH that this file is active during the load process. As user text isretrieved from the GDF file, all text which is not associated with this program’s uniquepointer is passed directly to the output file. In this way, any other program’s unique datais preserved.
GRAPH Reference Manual, Rev. 01

Page 2-12 Chapter 2
The user text area may be any size you want. It is layed out as a series of text strings,each terminated with a null. The final string is terminated with a byte of -1 (377 octal) toindicate the logical end of the buffer. Each string is stored in the GDF file as a separateline.
GRAPH Reference Manual, Rev. 01

CHAPTER 3
THE GRAPH INTERFACE
The program interface to the GRAPH system is provided by the file GRFSYM.M68 which isCOPYed by an assembly language program to define the call and data structures associatedwith the system.
The AlphaBASIC program interface to the GRAPH system is provided by the file GRFSYM.BSI,which your AlphaBASIC program incorporates via the INCLUDE statement to define the calland data structures associated with the system. All calls to GRAPH.SYS are performedthrough the GRFSBR.SBR external subroutine.
The AlphaC program interface to the GRAPH system is provided by the file GRAPH.H whichyou must "include" in your AlphaC program. In addition, the compiled object module must belinked with the GRFCLB.LIB library file to complete the interface.
3.1°°CALL DEFINITIONS
At the base of the GRAPH.SYS module, just after the standard program header, are aseries of jumps to specific routines in GRAPH. The offsets are defined inGRFSYM.M68. The implementation and operation of these calls is described in detail inChapter 4, "GRAPH Function Calls." Briefly, the call offsets are:
GO.IMP Return impure memory size required for operation of GRAPH witha specified number of data points.
GO.INI Initialize user allocated impure area.
GO.DSP Display Chart currently residing in impure area.
GO.LOD Load a previously saved chart from disk into impure area.
GO.SAV Save current chart in impure area onto disk.
GO.GGP Get current graph parameter list from impure area and place in auser specified area.
GO.PGP Put a user specified parameter list into the impure parameter listarea.
GRAPH Reference Manual, Rev. 01

Page 3-2 Chapter 3
GO.GRD Get a range of data from the impure area and place it in a userspecified data area.
GO.PRD Put a user specified data area into an impure area data range.
GO.CSR Clear a single range of data in the impure area.
GO.CAR Clear all data ranges in the impure area.
GO.SUP Load a user text index pointer in the impure area.
3.2°°MEMORY REQUIREMENTS AND USAGE
The GRAPH interface was designed to provide flexibility in interface for a variety ofexisting software packages. Since many of these programs do not allocate memoryconsistently with the standard AMOS memory allocation methods, it was necessary todefine a universal means of providing GRAPH with its necessary impure memory.
When a program uses GRAPH, it must first ask GRAPH how much memory is required.The user program does this through use of the GO.IMP call. Once GRAPH reports therequired memory size, it is the user program’s responsibility to allocate a contiguousarea of memory in a manner consistent with that program’s operation. Once the area isallocated, GRAPH is informed of its location through use of the GO.INI call.
Since AlphaBASIC allocates free memory from the top down, AlphaBASIC programsmust pre-allocate the impure area through use of a MAPped unformatted variable. Thesize of this area may be determined through use of the GO’IMP call but the impure areaitself may not be dynamically allocated.
The impure memory is not directly accessed or modified by the user program. Instead,various calls to GRAPH return elements from the area and place elements into the area.The layout of the impure memory area is not available to the user program. By usingthis method, updates and changes to the GRAPH system will not necessitaterecompilation or assembly of programs which use it.
The user program allocates two defined memory areas in order to exchange data andparameters with the impure area. The definition of each of these areas follows.
3.3°°GRAPH PARAMETER STRUCTURE
A data structure of size GP.SIZ is used to exchange chart parameters with GRAPH. Acall to GRAPH to get or put this area results in the entire area being moved. Thedefinition of each element within this area follows.
GRAPH Reference Manual, Rev. 01

Page 3-3The GRAPH Interface
Each text element is defined with individual text attributes. The format of a text elementis:
0 font2 character height4 color6 rotation10 offset x12 offset y14 text14+ text size
GRAPH.SYS will normally display all text in a default location using default attributes.Specifying a non-zero attribute causes the default to be overridden by the new attribute.In addition, the user is able to preset an overall default set of attributes to be used ifindividual attributes are not specified. For more information, see the description of theparameter text attribute area (GP.TXA) below.
3.3.1°°GP.TTL - Chart Title
The GP.TTL - chart title may be up to 60 characters in length and must be terminated bya null byte. The title appears centered at the top of the chart. This is a text element withindividual text attributes as described above.
3.3.2°°GP.ST1 - Subtitle 1
GP.ST1 - subtitle 1 may be up to 60 characters in length and must be terminated with anull byte. It appears centered directly below the title. This is a text element withindividual text attributes as described above.
3.3.3°°GP.ST2 - Subtitle 2
GP.ST2 - subtitle 2 may be up to 60 characters in length and must be terminated with anull byte. It appears centered directly below subtitle 1. This is a text element withindividual text attributes as described above.
3.3.4°°GP.FOT - Footnote
The GP.FOT - footnote may be up to 60 characters in length and is terminated with anull byte. It appears in the lower right corner of the display area. This is a text elementwith individual text attributes as described above.
GRAPH Reference Manual, Rev. 01

Page 3-4 Chapter 3
3.3.5°°GP.XLB - X-axis Label
The X-axis label may be up to 60 characters in length and must be terminated with anull byte. It appears centered directly below the scale values on the X-axis. This is atext element with individual text attributes as described above.
3.3.6°°GP.YLB - Y-axis Label
The Y-axis label may be up to 60 characters in length and must be terminated with anull byte. It appears centered directly to the left of the scale values on the Y-axis. This isa text element with individual text attributes as described above.
3.3.7°°GP.YST - Y-axis Start Value
The GP.YST value is a floating point number specifying the Y-axis starting value. Avalue of zero causes GRAPH to default to the lowest Y value determined from the datato be charted. This value may not appear exactly since GRAPH may select anincrement value which does not cause a stop at the specified value. In this case,GRAPH selects the closest increment which will display as much data as possible.
3.3.8°°GP.YEN - Y-axis End Value
GP.YEN is a floating point number specifying the Y-axis ending value. A value of zerocauses GRAPH to default to the highest Y value determined from the data to becharted. This value may not appear exactly since GRAPH may select an incrementvalue which does not cause a stop at the specified value. In this case, GRAPH selectsthe closest increment which will display as much data as possible.
3.3.9°°GP.YIN - Y-axis Increment
GP.YIN is a floating point number specifying the increment used between tick marks onthe Y axis. A value of zero will cause GRAPH to select an increment based on the rangeand values of the data to be charted.
3.3.10°°GP.YPR - Y-axis Prescale
This floating point number specifies a constant value to be multiplied by each Y-axisincrement for easier readability. A value of zero or one indicates no prescaling is ineffect.
GRAPH Reference Manual, Rev. 01

Page 3-5The GRAPH Interface
3.3.11°°GP.XST - X-axis Start Value
GP.XST is a floating point number specifying the X-axis starting value. A value of zerocauses GRAPH to default to the lowest X value determined from the data to be charted.This value may not appear exactly since GRAPH may select an increment value whichdoes not cause a stop at the specified value. In this case, GRAPH selects the closestincrement which will display as much data as possible. This parameter is only effectivein X-Y charts.
3.3.12°°GP.XEN - X-axis End Value
GP.XEN is a floating point number specifying the X-axis ending value. A value of zerocauses GRAPH to default to the highest X value determined from the data to becharted. This value may not appear exactly since GRAPH may select an incrementvalue which does not cause a stop at the specified value. In this case, GRAPH selectsthe closest increment which will display as much data as possible. This parameter isonly effective in X-Y charts.
3.3.13°°GP.XIN - X-axis Increment
GP.XIN is a floating point number specifying the increment used between tick marks onthe X axis. A value of zero will cause GRAPH to select an increment based on the rangeand values of the data to be charted. This parameter is only effective in X-Y charts.
3.3.14°°GP.XPR - X-axis Prescale
GP.XPR is a floating point number specifying a constant value to be multiplied by eachX-axis increment for easier readability. A value of zero or one indicates no prescaling isin effect. This parameter is only effective in X-Y charts.
3.3.15°°GP.TXA - Default Text Attributes
GP.TXA stores the default text attributes for subsequent text commands. Theseattributes are used if the individual text attributes items are zero. A value of zero in anyfield causes GRAPH to use the default attribute for the current operation. This area isused by the GDF file load routine to track the currently active attributes set through useof the GTA keyword. The format of this area is:
0 font2 character height4 color6 rotation10 offset x12 offset y
GRAPH Reference Manual, Rev. 01

Page 3-6 Chapter 3
3.3.16°°GP.FAP - Fill Area Pattern Table
GP.FAP stores a list of fill pattern indices to be used in bar, stacked bar, area, and piecharts. Up to 64 fill patterns may be stored. For bar, stacked bar, and area charts, thefirst 8 patterns are used to represent the 8 data ranges allowed.
For pie charts, each successive data element retrieves the next fill pattern from this list.If over 64 segments are used, the table will start over at location 0 and proceed forward.A value of zero in any location causes a solid fill in the current color.
On monochrome devices, solid fills are represented by gray scales corresponding to thedesired color. Unlike color devices, fill patterns are always generated at full intensity.That is, gray scales are not used to represent color within a fill pattern.
3.3.17°°GP.TYP - Type of Chart
GP.TYP determines the chart type to be displayed as defined by the following list:
1 Line Chart2 Clustered Bar Chart3 Stacked Bar Chart4 Pie Chart5 Area Chart6 X-Y Chart
All other values default to type 1.
3.3.18°°GP.XTP - X-axis Type
The GP.XTP byte defines the X-axis type to be displayed. Currently, only linear axisscales are allowed and this variable has no effect.
3.3.19°°GP.YTP - Y-axis Type
The GP.YTP byte defines the Y-axis type to be displayed. Currently, only linear axisscales are allowed and this variable has no effect.
3.3.20°°GP.XGR - X-axis Grid Type
The GP.XGR byte defines the type of grid to be displayed on the X-axis as defined bythe following list:
0 No grid1 Dotted grid
GRAPH Reference Manual, Rev. 01

Page 3-7The GRAPH Interface
3.3.21°°GP.YGR - Y-axis Grid Type
The GP.YGR byte defines the type of grid to be displayed on the Y-axis as defined bythe following list:
0 No grid1 Dotted grid
3.3.22°°GP.TCL - Text Color
The GP.TXL byte defines the color of all text on the chart as defined by the following list:
0 Black1 White2 Blue3 Magenta4 Red5 Yellow6 Green7 Cyan
Additional colors may be specified if the workstation in use supports them.
3.3.23°°GP.BCL - Background Color
The GP.BCL byte defines the color of the chart background as defined by the followinglist:
0 Black1 White2 Blue3 Magenta4 Red5 Yellow6 Green7 Cyan
Additional colors may be specified if the workstation in use supports them.
GRAPH Reference Manual, Rev. 01

Page 3-8 Chapter 3
3.4°°GP.LGN - LEGEND TYPE
The GP.LGN byte defines the type of legend to be output on the chart. The legend iskeyed to the color of each range and displays the data range title. Legend types are:
0 No Legend1 Standard Legend
3.4.1°°GP.MRK - Data Point Marker Type
The GP.MRK byte defines the type of marker to be displayed at each data point in a lineor X-Y type chart. The marker types may be selected from the following list:
0 No Marker Output1 Dot2 Plus3 Star4 circle5 cross
3.5°°GRAPH DATA STRUCTURE
The GRAPH impure area is capable of storing eight ranges of data in a dynamicmanner. Each data range may have a different number of data points, and it is theresponsibility of GRAPH to maintain this data within the impure area. The user programdeals with one range of data at a time.
A range data memory area is allocated by the user program to exchange with theGRAPH impure area in much the same manner as the parameter area. This areaconsists of a fixed area defining the data range characteristics, and a variable lengtharea containing the data itself.
The following offsets are defined in GRFSYM.M68 pertaining to the data range.
3.5.1°°GR.NUM - Data Range Number
GR.NUM is a 16-bit value containing the data range number identifying the data area.This number may be in the range of 0 to 7. Any other value will cause unpredictableresults.
GRAPH Reference Manual, Rev. 01

Page 3-9The GRAPH Interface
3.5.2°°GR.CNT - Count of Data Points
GR.CNT is a 16-bit number containing the total count of active data elements followingthe fixed portion of the data range area. The user may allocate more memory thanrequired to contain the data elements. When requesting a data range from the GRAPHimpure area, it is the user’s responsibility to ensure that enough memory has beenallocated to contain all of the data elements.
3.5.3°°GR.FLG - Data Range Flag
GR.FLG is a 16-bit flag used to define various data range characteristics. This flagcontains the following element:
Bit 0 GR$HDR When this bit is set (=1), the GO.GRD call willreturn the range header only.
3.5.4°°GR.CLR - Data Range Color
The GR.CLR byte defines the color of lines and fill areas to represent this range of dataon the display device. The color values area defined as follows:
0 Black1 White2 Blue3 Magenta4 Red5 Yellow6 Green7 Cyan
Additional colors may be specified if the workstation in use supports them.
3.5.5°°GR.LST - Data Range Linestyle
The GR.LST byte defines the linestyle to be used in line and X-Y type charts torepresent this range of data. The linestyles available are:
0 No Line Output1 Solid Line2 Dashed3 Dotted4 Dash-Dot5 Long Dash6 Long Dash-Dot
GRAPH Reference Manual, Rev. 01

Page 3-10 Chapter 3
3.5.6°°GR.TTL - Data Range Title
The GR.TTL field may be up to 40 characters in length and must be terminated with anull byte. It appears in the legend output to title a range of data. If the legend is enabled,and this field is null, no legend output will occur. This is a text element with individualtext attributes as described above.
3.5.7°°GR.DAT - Data Offset
The GR.DAT offset defines the size of the preceding fixed area and the location of thebase of the data area. The data elements start at this location and extend as far asnecessary to define all elements. Each data element is composed of the X and Y datavalues and several items to define the characteristics of the data.
3.5.8°°Data Element Structure
Each data element is GE.SIZ bytes in length and contains:
°°°GE.FLG - Data Element Flag
°°°GE.TYP - Data Element Type
°°°GE.DTX - X Data Value
°°°GE.DTY - Y Data Value
°°°GE.LBL - Data Point Label
GE.FLG - Data Element Flag
The GE.FLG byte contains flags describing the data contained in the cell. Theassociated flag values are:
GE$XVL X data is validGE$YVL Y data is validGE$EXP Explode pie segmentGE$PRC Display percentage on pie segment
GRAPH Reference Manual, Rev. 01

Page 3-11The GRAPH Interface
GE.TYP - Data Element Type
The GE.TYP byte contains a description of the data type contained in the cell as follows:
0 6-byte AMOS floating point1 8-byte IEEE floating point (currently unsupported)
GE.DTX - X Data Value
GE.DTX is an 8-byte variable that contains the X data value in floating point.
GE.DTY - Y Data Value
GE.DTY is an 8-byte variable that contains the Y data value in floating point.
GE.LBL - Data Point Label
The GE.LBL variable may be up to 20 characters in length and must be terminated witha null byte. The data point labels from the first range are used to label the X-axis tickmarks in all charts except Pie and X-Y. This is a text element with individual textattributes as described above.
GRAPH Reference Manual, Rev. 01

CHAPTER 4
GRAPH FUNCTION CALLS
GRAPH provides twelve function calls which are defined as offsets in GRFSYM.M68. Eachfunction requires one or more registers to be initialized prior to calling GRAPH. Each functioncall returns a status in register D6. A successful return is indicated by the Z flag being set and avalue of zero in D6. If the Z flag is not set, D6 contains an error code. For complete detailsregarding error codes, refer to Appendix A, "Error Codes Reported By Graph."
Function calls are performed by initializing any required registers, and performing a subroutinecall from a specific offset from the base of GRAPH.SYS. The following example assumes thatthe variable GRFPNT(A5) contains a pointer to the base of GRAPH.SYS in memory.
MOV #100.,D1 ; set up maximum data countMOV GRFPNT(A5),A6 ; get pointer to GRAPH.SYSCALL GO.IMP(A6) ; call the appropriate routineBEQ OK ; all’s well if Z flag set
perform error handling
OK: continue
GRAPH Reference Manual, Rev. 01

Page 4-2 Chapter 4
4.1°°GO.IMP - REPORT IMPURE AREA SIZE
Prior to using GRAPH, it is necessary to allocate an impure memory area for parameterand data storage. The size of this area is variable depending on the total number of dataelements to be displayed. GRAPH does not allocate this memory, but rather reports tothe user program how much memory is necessary to accommodate the user’s datarequirements. The user may then allocate this impure area in a manner convenient to theparticular application being executed.
Inputs: D1 Total number of data elements required. This isequivalent to the number of active data rangestimes the number of data points in each range.
Outputs: D1 Size in bytes of required impure area.
AlphaBASIC CALLING SEQUENCE
XCALL GRFSBR,GO’IMP,num’el,size,status
where:
num’el A floating point variable containing the total number of dataelements which the user desires to allocate. This is equivalent tothe number of active data ranges time the number of data pointsin each range.
size A floating point variable which will receive the size of the requiredimpure zone.
status A floating point variable which will receive the return status of thecall. Refer to Appendix A for a description of status and errorcodes.
GRAPH Reference Manual, Rev. 01
Page 4-3GRAPH Function Calls
AlphaC CALLING SEQUENCE
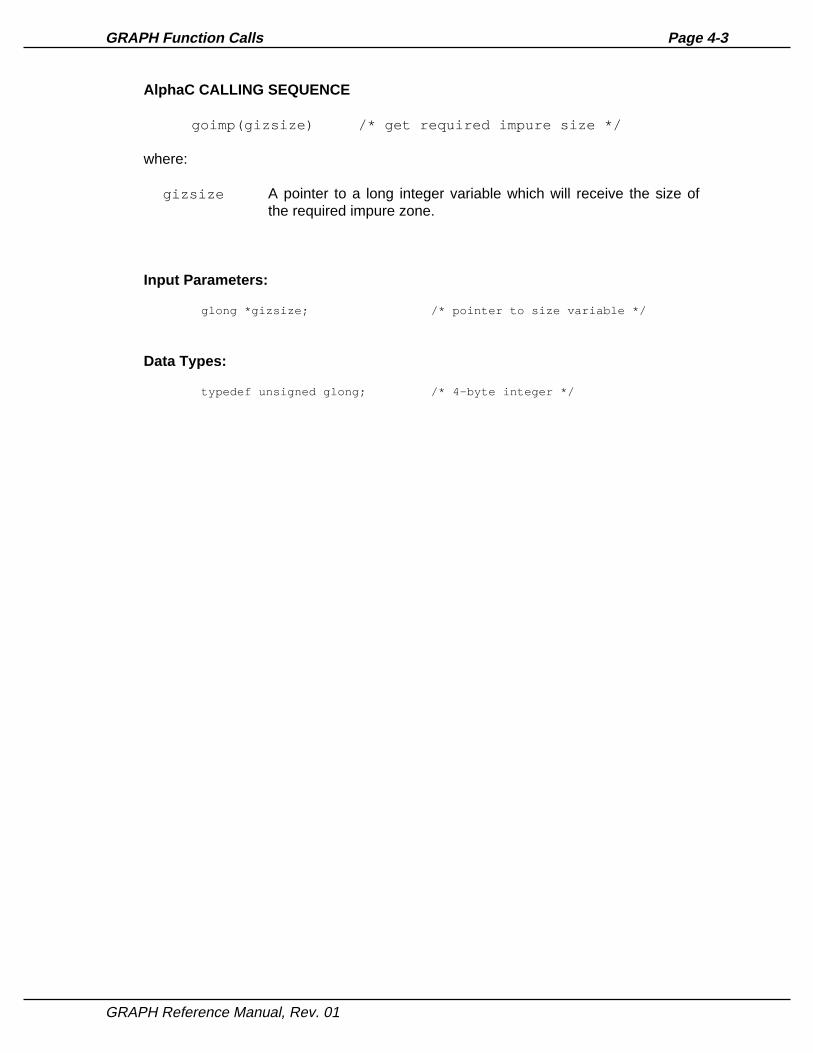
goimp(gizsize) /* get required impure size */
where:
gizsize A pointer to a long integer variable which will receive the size ofthe required impure zone.
Input Parameters:
glong *gizsize; /* pointer to size variable */
Data Types:
typedef unsigned glong; /* 4-byte integer */
GRAPH Reference Manual, Rev. 01

Page 4-4 Chapter 4
4.2°°GO.INI - INITIALIZE IMPURE AREA
Once the user program has allocated the required impure area, it is necessary to informGRAPH of its location so that it may be initialized for subsequent use.
Inputs: A3 Pointer to impure memory areaD1 Size of impure area. (Returned by GO.IMP call)
Outputs: -- none
AlphaBASIC CALLING SEQUENCE
XCALL GRFSBR,GO’INI,giz,status
where:
giz An unformatted variable containing the Graph Impure Zone usedas intermediate storage and work space for the GRAPH sub-routine.
status A floating point variable which will receive the return status of thecall. Refer to Appendix A for a description of status and errorcodes.
AlphaC CALLING SEQUENCE
goini(giz,size) /* initialize GIZ */
where:
giz A pointer to the Graph Impure Zone used as intermediate storageand work space for GRAPH.
size A long integer variable which contains the size of the impure area.
Input Parameters:
glong *giz; /* pointer to graph impure zone */ glong size; /* size of impure zone */
Data Types:
typedef unsigned glong; /* 4-byte integer */
GRAPH Reference Manual, Rev. 01

Page 4-5GRAPH Function Calls
4.3°°GO.DSP - DISPLAY CHART
GO.DSP causes the chart currently stored in the impure area to be displayed on aspecified output workstation.
Inputs: A3 Pointer to impure area.A4 Pointer to Graphics Control Block (GCB) which has
been opened for output for the desired workstation.
Outputs: -- None
AlphaBASIC CALLING SEQUENCE
XCALL GRFSBR,GO’DSP,giz,gcb,status
where:
giz An unformatted (type X) variable containing the Graph ImpureZone used as intermediate storage and work space for theGRAPH subroutine.
gcb An unformatted variable containing the Graphics Control Block fora graphics workstation previously open through the use of theAMIGOS G’OPWK (open workstation) call. Refer to the AMIGOSdocumentation for additional information.
status A floating point variable which will receive the return status of thecall. Refer to Appendix A for a description of status and errorcodes.
GRAPH Reference Manual, Rev. 01

Page 4-6 Chapter 4
AlphaC CALLING SEQUENCE
godsp(giz,gcb) /* Display graph */
where:
giz A pointer to the Graph Impure Zone used as intermediate storageand work space for GRAPH.
gcb A pointer to the Graphics Control Block for a graphics workstationpreviously open through the use of the AMIGOS G’OPWK (openworkstation) call. Refer to the AMIGOS documentation foradditional information.
Input Parameters:
glong *giz; /* pointer to graph impure zone */ g_gcb *gcb; /* Graphics Control Block */
Data Types:
typedef struct gcb g_gcb; /* graphics control block */
typedef unsigned glong; /* 4-byte integer */
GRAPH Reference Manual, Rev. 01

Page 4-7GRAPH Function Calls
4.4°°GO.LOD - LOAD A GRAPH DEFINITION FILE
GO.LOD loads an existing graph definition file into the impure area. Prior to loading thefile, all user text buffer pointers must be initialized through use of the GO.SUP call. Usertext buffers which are not to be used by this program may be passed to an output file byproviding an optional output DDB index in the call. See section 2.5.1 for further details onuser text input and output.
Inputs: A3 Pointer to impure area.A4 Pointer to GDF file DDB which has been initialized
and open for input.A2 Pointer to DDB which has been initialized and
open for output if necessary to output unused usertext. This register must contain zero if no output isrequired.
Outputs: -- None
AlphaBASIC CALLING SEQUENCE
XCALL GRFSBR,GO’LOD,giz,in’file,out’file,status
where:
giz An unformatted variable containing the Graph Impure Zone usedas intermediate storage and work space for the GRAPH sub-routine.
in’file A variable containing a file channel which has been opened forinput. The .GDF file defined by this channel will be input to theGraph Impure Zone for further processing.
out’file
A variable containing a file channel which has been opened foroutput. This file will be updated with any user text not assigned tothis program through the GO’SUP call. If no output is necessaryduring the load process, this variable must be null or zero.
status A floating point variable which will receive the return status of thecall. Refer to Appendix A for a description of status and errorcodes.
GRAPH Reference Manual, Rev. 01

Page 4-8 Chapter 4
AlphaC CALLING SEQUENCE
golod(giz,iddb,oddb) /* load GDF file */
where:
giz A pointer to the Graph Impure Zone used as intermediate storageand work space for GRAPH.
iddb A pointer to a DDB of a file which has been opened for input. The.GDF file defined by this variable will be input to the Graph ImpureZone for further processing.
oddb A pointer to a DDB of a file which has been opened for output.This file will be updated with any user text not assigned to thisprogram through the GO’SUP call. If no output is necessaryduring the load process, this variable must be null or zero.
Input Parameters:
glong *giz; /* pointer to graph impure zone */ glong *iddb; /* pointer to input file ddb */ glong *oddb; /* pointer to output file ddb */
Data Types:
typedef unsigned glong; /* 4-byte integer */
GRAPH Reference Manual, Rev. 01

Page 4-9GRAPH Function Calls
4.5°°GO.SAV - SAVE CURRENT CHART IN GRAPH DEFINITION FILE
GO.SAV causes the current impure area contents to be output to a Graph Definition File.All initialized user pointers will cause output of the associated user text buffers. SeeChapter 2,"General Concepts," for more information about text input and output.
Inputs: A3 Pointer to impure area.A4 Pointer to GDF file DDB which has been initialized
and open for output.
Outputs: -- None
AlphaBASIC CALLING SEQUENCE
XCALL GRFSBR,GO’SAV,giz,out’file,status
where:
giz An unformatted variable containing the Graph Impure Zone usedas intermediate storage and work space for the GRAPH sub-routine.
out’file
A variable containing a file channel which has been opened foroutput. The graph definition currently residing in the GraphImpure Zone will be output to this file in GDF file format. Refer toChapter 5, "GDF File Keyword Definition," for more information onGDF file format.
status A floating point variable which will receive the return status of thecall. Refer to Appendix A for a description of status and errorcodes.
GRAPH Reference Manual, Rev. 01

Page 4-10 Chapter 4
AlphaC CALLING SEQUENCE
gosav(giz,oddb) /* save GDF file */
where:
giz A pointer to the Graph Impure Zone used as intermediate storageand work space for GRAPH.
oddb A pointer to a DDB for a file which has been opened for output.The graph definition currently residing in the Graph Impure Zonewill be output to this file in GDF file format. Refer to Chapter 5,"GDF File Keyword Definition," for more information on GDF fileformat.
Input Parameters:
glong *giz; /* pointer to graph impure zone */ glong *oddb; /* pointer to output file ddb */
Data Types:
typedef unsigned glong; /* 4-byte integer */
GRAPH Reference Manual, Rev. 01

Page 4-11GRAPH Function Calls
4.6°°GO.GGP - GET GRAPH PARAMETERS
GO.GGP causes the graph parameter list defined in GRFSYM.M68 to be copied from theimpure area to a user specified location. The parameters copied reflect the current stateof the chart defined in the impure area.
Inputs: A3 Pointer to impure area.A4 Pointer to user parameter buffer.
Outputs: -- None
AlphaBASIC CALLING SEQUENCE
XCALL GRFSBR,GO’GGP,giz,parameter’list,status
where:
giz An unformatted variable containing the Graph Impure Zone usedas intermediate storage and work space for the GRAPH sub-routine.
parameter’list
An unformatted (type X) variable which is to receive the currentgraph parameters. The format of this area is defined inGRFSYM.BSI.
status A floating point variable which will receive the return status of thecall. Refer to Appendix A for a description of status and errorcodes.
GRAPH Reference Manual, Rev. 01
Page 4-12 Chapter 4
AlphaC CALLING SEQUENCE
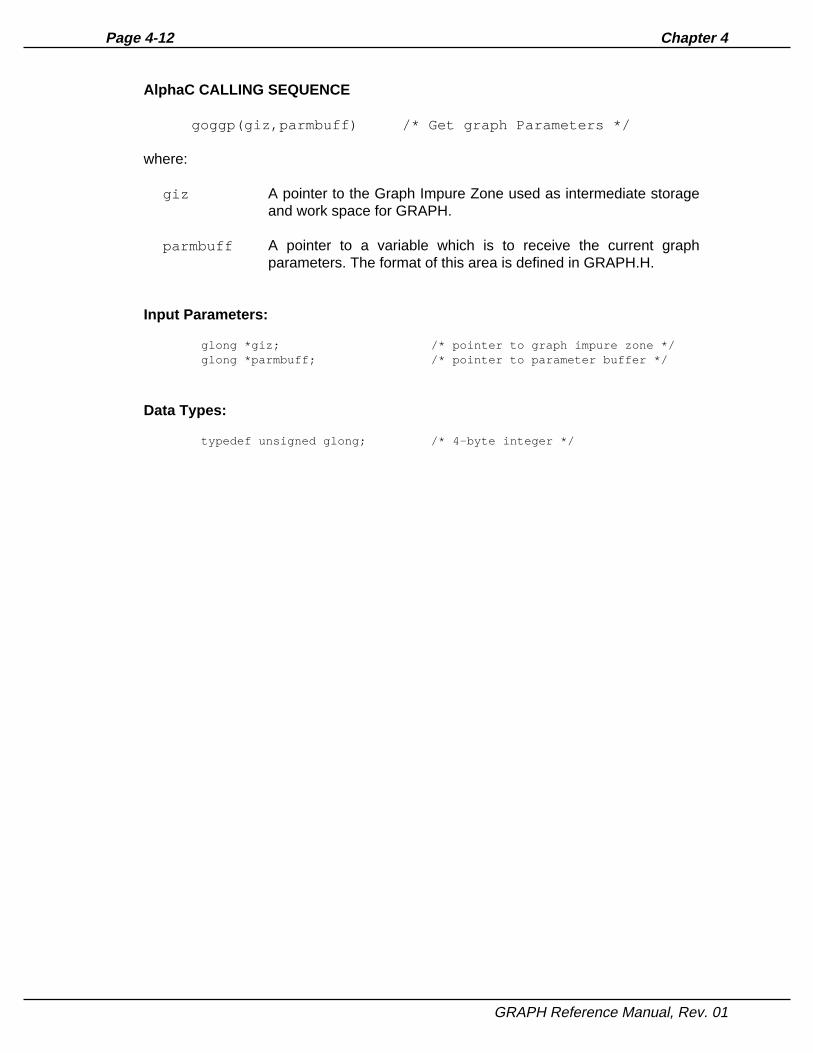
goggp(giz,parmbuff) /* Get graph Parameters */
where:
giz A pointer to the Graph Impure Zone used as intermediate storageand work space for GRAPH.
parmbuff A pointer to a variable which is to receive the current graphparameters. The format of this area is defined in GRAPH.H.
Input Parameters:
glong *giz; /* pointer to graph impure zone */ glong *parmbuff; /* pointer to parameter buffer */
Data Types:
typedef unsigned glong; /* 4-byte integer */
GRAPH Reference Manual, Rev. 01

Page 4-13GRAPH Function Calls
4.7°°GO.PGP - PUT GRAPH PARAMETERS
GO.PGP causes a parameter list as defined in GRFSYM.M68 to be copied from a userspecified location to the impure area. This results in setting the current charts parametersto a user specified state.
Inputs: A3 Pointer to impure area.A4 Pointer to user parameter buffer.
Outputs: -- None
AlphaBASIC CALLING SEQUENCE
XCALL GRFSBR,GO’PGP,giz,parameter’list,status
where:
giz An unformatted variable containing the Graph Impure Zone usedas intermediate storage and work space for the GRAPH sub-routine.
parameter’list
An unformatted (type X) variable which contains the current graphparameters to be stored in the Graph Impure Zone. The format ofthis area is defined in GRFSYM.BSI.
status A floating point variable which will receive the return status of thecall. Refer to Appendix A for a description of status and errorcodes.
GRAPH Reference Manual, Rev. 01

Page 4-14 Chapter 4
AlphaC CALLING SEQUENCE
gopgp(giz,parmbuff) /* Put graph Parameters */
where:
giz A pointer to the Graph Impure Zone used as intermediate storageand work space for GRAPH.
parmbuff A pointer to a variable which contains the current graphparameters to be stored in the Graph Impure Zone. The format ofthis area is defined in GRAPH.H.
Input Parameters:
glong *giz; /* pointer to graph impure zone */ glong *parmbuff; /* pointer to parameter buffer */
Data Types:
typedef unsigned glong; /* 4-byte integer */
GRAPH Reference Manual, Rev. 01

Page 4-15GRAPH Function Calls
4.8°°GO.GRD - GET RANGE OF DATA
The GO.GRD call causes a specified range of data to be copied from the impure area toa user specified data area. This area must be formatted as defined in GRFSYM.M68.Prior to making the call, the user program must set the required data range (0 - 7) inGR.NUM in the data area. If the range flag is set in GR$HDR, only the range header willbe returned.
Inputs: A3 Pointer to impure area.A4 Pointer to user data area.
Outputs: -- None
AlphaBASIC CALLING SEQUENCE
XCALL GRFSBR,GO’GRD,giz,data’range,status
where:
giz An unformatted variable containing the Graph Impure Zone usedas intermediate storage and work space for the GRAPH sub-routine.
data’range
unformatted (type X) variable which is to receive a range of data.The format of this area is defined in GRFSYM.BSI.
status A floating point variable which will receive the return status of thecall. Refer to Appendix A for a description of status and errorcodes.
GRAPH Reference Manual, Rev. 01

Page 4-16 Chapter 4
AlphaC CALLING SEQUENCE
gogrd(giz,range) /* Get range of data */
where:
giz A pointer to the Graph Impure Zone used as intermediate storageand work space for GRAPH.
range A pointer to a variable which is to receive A range of data. Theformat of this area is defined in GRAPH.H.
Input Parameters:
glong *giz; /* pointer to graph impure zone */ glong *range; /* pointer to data range buffer */
Data Types:
typedef unsigned glong; /* 4-byte integer */
GRAPH Reference Manual, Rev. 01

Page 4-17GRAPH Function Calls
4.9°°GO.PRD - PUT RANGE OF DATA
GO.PRD causes a user specified data area to be copied to a specified data range in theimpure area. This results in the current chart data for that data range to be changed to theuser data. The data area must conform to the structure defined by GRFSYM.M68. Thevariables in the fixed part of the data area must be initialized to the required values priorto the call.
Inputs: A3 Pointer to impure areaA4 Pointer to user data area
Outputs: -- None
AlphaBASIC CALLING SEQUENCE
XCALL GRFSBR,GO’PRD,giz,data’range,status
where:
giz An unformatted variable containing the Graph Impure Zone usedas intermediate storage and work space for the GRAPH sub-routine.
data’range
An unformatted (type X) variable which contains the range of databe stored in the Graph Impure Zone. The format of this area isdefined in GRFSYM.BSI.
status A floating point variable which will receive the return status of thecall. Refer to Appendix A for a description of status and errorcodes.
GRAPH Reference Manual, Rev. 01

Page 4-18 Chapter 4
AlphaC CALLING SEQUENCE
goprd(giz,range) /* Put range of data */
where:
giz A pointer to the Graph Impure Zone used as intermediate storageand work space for GRAPH.
range A pointer to a variable which contains the range of data be storedin the Graph Impure Zone. The format of this area is defined inGRAPH.H.
Input Parameters:
glong *giz; /* pointer to graph impure zone */ glong *range; /* pointer to data range buffer */
Data Types:
typedef unsigned glong; /* 4-byte integer */
GRAPH Reference Manual, Rev. 01

Page 4-19GRAPH Function Calls
4.10°°GO.CSR - CLEAR SINGLE RANGE OF DATA
GO.CSR cause a user specified data range to be deleted from the impure area.
Inputs: A3 Pointer to impure areaD1 Data range to clear (0 - 7)
Outputs: -- None
AlphaBASIC CALLING SEQUENCE
XCALL GRFSBR,GO’CSR,giz,range,status
where:
giz An unformatted variable containing the Graph Impure Zone usedas intermediate storage and work space for the GRAPH sub-routine.
range A variable containing the range number to be cleared. Thisnumber may be in the range 0 to 7.
status A floating point variable which will receive the return status of thecall. Refer to Appendix A for a description of status and errorcodes.
AlphaC CALLING SEQUENCE
gocsr(giz,range) /* Clear single range */
where:
giz A pointer to the Graph Impure Zone used as intermediate storageand work space for GRAPH.
range A long integer variable containing the range number to becleared. This number may be in the range 0 to 7.
Input Parameters:
glong *giz; /* pointer to graph impure zone */ glong range; /* range number */
Data Types:
typedef unsigned glong; /* 4-byte integer */
GRAPH Reference Manual, Rev. 01
Page 4-20 Chapter 4
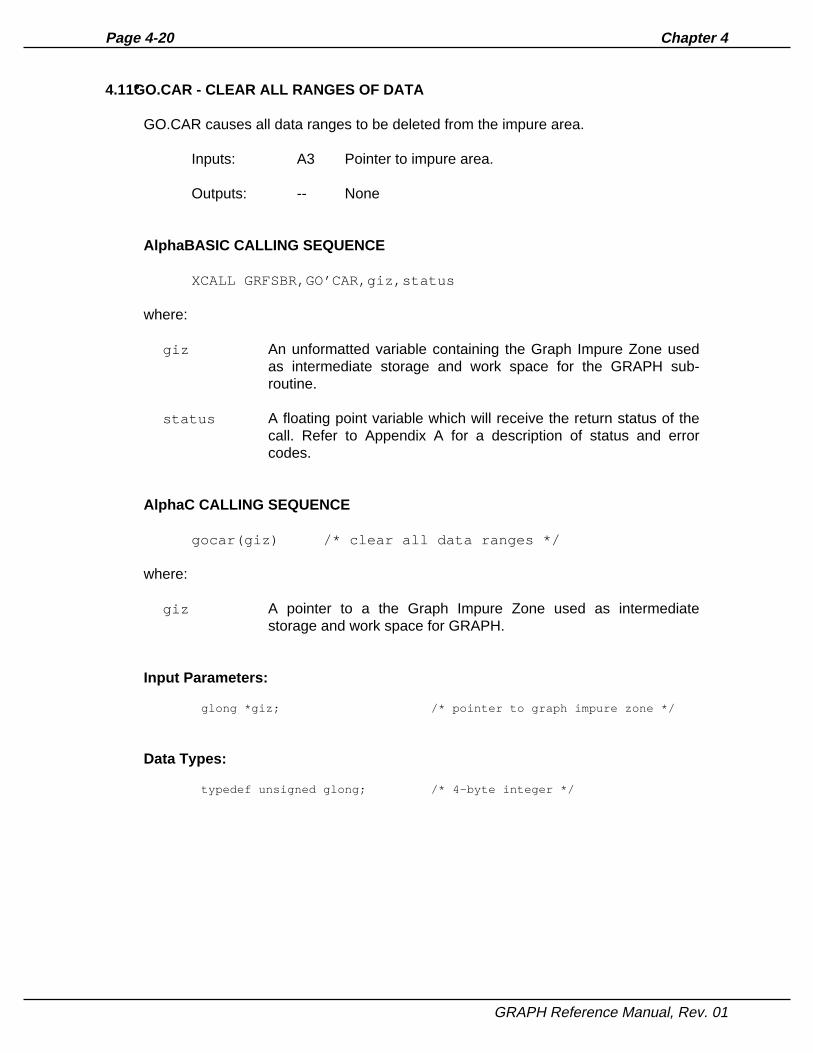
4.11°°GO.CAR - CLEAR ALL RANGES OF DATA
GO.CAR causes all data ranges to be deleted from the impure area.
Inputs: A3 Pointer to impure area.
Outputs: -- None
AlphaBASIC CALLING SEQUENCE
XCALL GRFSBR,GO’CAR,giz,status
where:
giz An unformatted variable containing the Graph Impure Zone usedas intermediate storage and work space for the GRAPH sub-routine.
status A floating point variable which will receive the return status of thecall. Refer to Appendix A for a description of status and errorcodes.
AlphaC CALLING SEQUENCE
gocar(giz) /* clear all data ranges */
where:
giz A pointer to a the Graph Impure Zone used as intermediatestorage and work space for GRAPH.
Input Parameters:
glong *giz; /* pointer to graph impure zone */
Data Types:
typedef unsigned glong; /* 4-byte integer */
GRAPH Reference Manual, Rev. 01

Page 4-21GRAPH Function Calls
4.12°°GO.SUP - SET USER POINTER
GO.SUP causes the user supplied text buffer index to be associated with a specified usernumber. The user text buffer is cleared by placing a byte of -1 in the first position of thebuffer. For further details on user text input and output, see Chapter 2, "GeneralConcepts."
Inputs: A3 Pointer to impure area.A4 Pointer to user text buffer.D1 User pointer number. (1 - 99.)
Outputs: -- None
AlphaBASIC CALLING SEQUENCE
XCALL GRFSBR,GO’SUP,giz,buffer,point’num,status
where:
giz An unformatted variable containing the Graph Impure Zone usedas intermediate storage and work space for the GRAPH sub-routine.
buffer A string or unformatted variable which will contain the user text.
point’num
A variable containing the user pointer number (1 to 99) toassociate the text with.
status A floating point variable which will receive the return status of thecall. Refer to Appendix A for a description of status and errorcodes.
GRAPH Reference Manual, Rev. 01

Page 4-22 Chapter 4
AlphaC CALLING SEQUENCE
gosup(giz,textbuff,pointnum) /* Set user pointer */
where:
giz A pointer to the Graph Impure Zone used as intermediate storageand work space for GRAPH.
textbuff A pointer to a string variable which will contain the user text.
pointnum A long integer variable containing the user pointer number (1 to99) to associate the text with.
Input Parameters:
glong *giz; /* pointer to graph impure zone */ glong *textbuff; /* pointer to text buffer */ glong pointnum; /* user pointer number for text */
Data Types:
typedef unsigned glong; /* 4-byte integer */
GRAPH Reference Manual, Rev. 01

CHAPTER 5
GDF FILE KEYWORD DEFINITION
Graph definition (GDF) files consist of a series of single line definitions that define both thecontent and the format of the graph to be generated. Each line of the file contains a keywordand an argument, separated by a space. Blank lines are ignored.
The following keywords which define the graph format are supported:
5.1°°GRAPH PARAMETER KEYWORDS
The parameter portion of the graph definition file is made up of keywords which affectthe overall appearance and style of the graph.
5.1.1°°GTY - Type of graph
GTY allows you to specify the type of graph you wish to have generated. The validarguments for this keyword are:
1 = line graph2 = column chart3 = stacked column chart4 = pie chart5 = area graph6 = X-Y graph
5.1.2°°GYT - Y-axis type
The GYT keyword allows you to specify the type of Y-axis that is used. Currently, onlylinear axes are supported and a value in this variable has no effect.
GRAPH Reference Manual, Rev. 01

Page 5-2 Chapter 5
5.1.3°°GYS - Y-axis start
The GYS field allows you to specify a minimum value for the Y-axis. Any data pointsthat lie below this minimum will be truncated. This allows you to eliminate spurious datavalues, preventing the graph from being compressed due to a few points. This keywordtakes a floating point number as an argument. A value of zero is taken as no maximumspecified, causing the maximum to be based on the data to be charted.
5.1.4°°GYE - Y-axis end
The GYE field allows you to specify a maximum value for the Y-axis. Any data pointsthat lie beyond this maximum will be truncated. This allows you to eliminate spuriousdata values, preventing the graph from being compressed due to a few points. Thiskeyword takes a floating point number as an argument. A value of zero is taken as nomaximum specified, causing the maximum to be based on the data to be charted.
5.1.5°°GYI - Y-axis increment
The GYI keyword allows you to specify the increment that will be used between tickmarks along the Y-axis. Specify the value to be used as a floating point numberfollowing the keyword. A value of zero is taken as no increment specified, causing asystem default increment to be chosen based on the data to be charted.
5.1.6°°GYP - Y-axis prescale value
The GYP keyword allows you to specify a value to be used to prescale all supplied datavalues. This value will be used to multiply all data, allowing you to choose the correctmagnitude for displaying the data values. A value of zero is taken as no prescalespecified, causing all supplied data to be used unchanged.
5.1.7°°GYG - Y-axis grid type
The GYG keyword allows you to specify the type of Y-axis grid (if any) that is to bedisplayed within the chart area. A grid can help the viewer determine the preciseposition of a data point. The types of grids supported are:
0 = no grid1 = dotted grid
GRAPH Reference Manual, Rev. 01

Page 5-3GDF File Keyword Definition
5.1.8°°GXT - X-axis type
The GXT keyword allows you to specify the type of X-axis that is used. Currently, onlylinear axes are supported and a value in this variable has no effect.
5.1.9°°GXS - X-axis start
The GXS field allows you to specify a minimum value for the X-axis. Any data pointsthat lie below this minimum will be truncated. This allows you to eliminate spurious datavalues, preventing the graph from being compressed due to a few points. This keywordtakes a floating point number as an argument. A value of zero is taken as no maximumspecified, causing the maximum to be based on the data to be charted.
5.1.10°°GXE - X-axis end
The GXE field allows you to specify a maximum value for the X-axis. Any data pointsthat lie beyond this maximum will be truncated. This allows you to eliminate spuriousdata values, preventing the graph from being compressed due to a few points. Thiskeyword takes a floating point number as an argument. A value of zero is taken as nomaximum specified, causing the maximum to be based on the data to be charted.
5.1.11°°GXI - X-axis increment
The GXI keyword allows you to specify the increment that will be used between tickmarks along the X-axis. Specify the value to be used as a floating point numberfollowing the keyword. A value of zero is taken as no increment specified, causing asystem default increment to be chosen based on the data to be charted.
5.1.12°°GXP - X-axis prescale value
The GXP keyword allows you to specify a value to be used to prescale all supplied datavalues. This value will be used to multiply all data, allowing you to choose the correctmagnitude for displaying the data values. A value of zero is taken as no prescalespecified, causing all supplied data to be used unchanged.
5.1.13°°GXG - X-axis grid type
The GXG keyword allows you to specify the type of X-axis grid (if any) that is to bedisplayed within the chart area. A grid can help the viewer determine the preciseposition of a data point. The types of grids supported are:
0 = no grid1 = dotted grid
GRAPH Reference Manual, Rev. 01

Page 5-4 Chapter 5
5.1.14°°GTC - Text color
The GTC field allows you to specify the color in which all text will be rendered. Thiskeyword takes a single numeric integer argument specifying the text color. The valuesfor the colors are shown below. If no GTC command is included in the GDF file, the textdefaults to white.
0 = Black1 = White2 = Blue3 = Magenta4 = Red5 = Yellow6 = Green7 = Cyan
5.1.15°°GBC - Background color
The GBC field allows you to specify the color in which the background will be rendered.This keyword takes a single numeric integer argument specifying the color. The valuesfor the colors are shown below. If no GBC command is included in the GDF file, thebackground defaults to black.
0 = Black1 = White2 = Blue3 = Magenta4 = Red5 = Yellow6 = Green7 = Cyan
5.1.16°°GMT - Data point marker type
The GMT keyword allow the definition of a marker type to be placed at each data pointon the graph. The defined marker types are:
0 = no marker 1 = dot (.) 2 = plus (+) 3 = star (*) 4 = circle (O) 5 = cross (X)>5 = workstation dependent
GRAPH Reference Manual, Rev. 01

Page 5-5GDF File Keyword Definition
5.1.17°°LGN - Legend enable
The LGN keyword allows you to enable and disable the legend area. The legend is usedto differentiate between data ranges when multiple data ranges are in use. This keywordtakes a boolean argument (0 or 1), where 0 disables the legend (the default case) and 1enables the legend.
5.1.18°°GFP - Fill pattern definition
The GFP keyword allows the definition of up to 64 fill patterns to be used in filling area,bar, stacked bar, and pie charts. In pie charts, each data element will use a consecutivefill pattern from this list, starting at position 0. Bar, stacked bar, and area charts will useonly the first 8 patterns, one for each data range, starting with location 0.
The first argument must be the starting location of the first fill pattern to be defined,followed by as many fill pattern indices desired. For example, the command:
GFP 12,4,7,9
defines fill location 12 to use pattern index 4, location 13 using pattern 7, and location14 using pattern 9.
5.1.19°°GTA - Text attributes
The GTA command loads default text attributes for all subsequent text items. Up to sixarguments may follow the command. If any argument is zero, the current defaultattribute associated with its position is used. The order of the arguments is:
FONT, HEIGHT, COLOR, ROTATION, OFFSET-X, OFFSET-Y
FONT is any value font available in the currently active workstation. AMIGOS strokefonts 1001 through 1009 are also available.
HEIGHT is the character height in world coordinates. If zero or missing, the defaultGRAPH height is used.
COLOR specifies a color index for subsequent text. If zero or missing, the default colorspecified by GTC is used.
ROTATION may be specified in 1/10 degree resolution. Internal stroke fonts (1001through 1009) may be continuously scaled and rotated. Workstation generated fonts(bitmap fonts) may not be rotatable or may only rotate in 90 degree increments. In thiscase, the closest rotation available will be used.
GRAPH Reference Manual, Rev. 01

Page 5-6 Chapter 5
OFFSET-X, and OFFSET-Y are specified in integer world coordinates in the range 0 to32767 and allow the repositioning of a subsequent text string relative to its defaultlocation. Value of 0 or a missing argument results in the default positioning being used.
5.1.20°°GUP - User parameter text line
The GUP keyword defines an application specific text element associated with a specificuser parameter number. The first argument is the parameter number in the range 1 to99. This is followed by a line of text to be store/retrieved from the user parameter buffer.
The following keywords allow you to define textual annotation of the graph. These textfields can contain any printing ASCII characters, including leading and trailing spaces.Control characters are not allowed. All text is generated using the current or default textattributes.
5.1.21°°GTL - Title
The GTL keyword allows you to specify a title for the chart of up to 60 characters. Thetitle is displayed at the top of the chart, above the main graph area.
5.1.22°°GS1 - Subtitle 1
The GS1 keyword allows you to specify an optional subtitle for the chart of up to 60characters. This subtitle is displayed at the top of the chart, immediately below the title.
5.1.23°°GS2 - Subtitle 2
The GS2 keyword allows you to specify an additional optional subtitle for the chart of upto 60 characters. This subtitle is displayed at the top of the chart, immediately belowsubtitle number 1.
5.1.24°°GFN - Footnote
The GFN keyword allows you to specify up to 60 characters as a footnote, which will beprinted at the bottom right of the chart area.
5.1.25°°GXL - X-axis label
The GXL keyword allows you to place a label below the X-axis of the chart. Up to 60characters may be specified.
GRAPH Reference Manual, Rev. 01
Page 5-7GDF File Keyword Definition
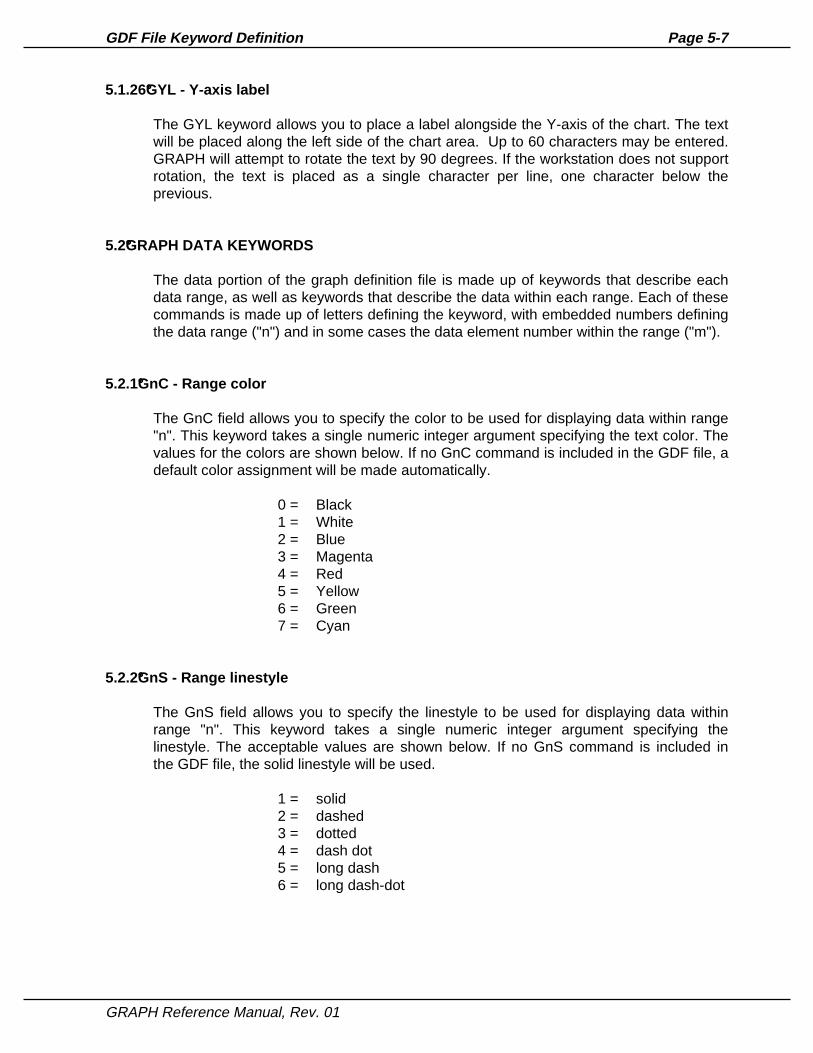
5.1.26°°GYL - Y-axis label
The GYL keyword allows you to place a label alongside the Y-axis of the chart. The textwill be placed along the left side of the chart area. Up to 60 characters may be entered.GRAPH will attempt to rotate the text by 90 degrees. If the workstation does not supportrotation, the text is placed as a single character per line, one character below theprevious.
5.2°°GRAPH DATA KEYWORDS
The data portion of the graph definition file is made up of keywords that describe eachdata range, as well as keywords that describe the data within each range. Each of thesecommands is made up of letters defining the keyword, with embedded numbers definingthe data range ("n") and in some cases the data element number within the range ("m").
5.2.1°°GnC - Range color
The GnC field allows you to specify the color to be used for displaying data within range"n". This keyword takes a single numeric integer argument specifying the text color. Thevalues for the colors are shown below. If no GnC command is included in the GDF file, adefault color assignment will be made automatically.
0 = Black1 = White2 = Blue3 = Magenta4 = Red5 = Yellow6 = Green7 = Cyan
5.2.2°°GnS - Range linestyle
The GnS field allows you to specify the linestyle to be used for displaying data withinrange "n". This keyword takes a single numeric integer argument specifying thelinestyle. The acceptable values are shown below. If no GnS command is included inthe GDF file, the solid linestyle will be used.
1 = solid2 = dashed3 = dotted4 = dash dot5 = long dash6 = long dash-dot
GRAPH Reference Manual, Rev. 01

Page 5-8 Chapter 5
5.2.3°°GnT - Range title
The GnT keyword allows you to specify up to 40 characters to be used as the title ofdata range "n". This title will be used within the legend to identify the range of data.
5.2.4°°RnDm - Data element
The RnDm keyword allows you to define the value of data element "m" within datarange "n". This keyword may be followed by up to 3 arguments. The first two argumentsare the X and Y data values in floating point ASCII representation. The Y value may beomitted if this is not an XY chart. In this case, the Y value is equated to the X value. Thethird argument is the data element flags value. This is a decimal representation of thesum of the data element flag bits described in the section describing GE.FLG.
5.2.5°°RnLm - Data Element Label
The RnLm keyword allows you to specify up to 20 characters to be used as the X-axistitle of data element "m". This title will be used within pie charts to label each piesegment.
GRAPH Reference Manual, Rev. 01

APPENDIX A
ERROR CODES REPORTED BY GRAPH
Each function call to GRAPH returns a status code in register D6. If this code is non-zero, itindicates an error condition. The following decimal error codes are defined:
CODE SYMBOL MESSAGE
0 -- No error - normal complettion status.1-255 -- AMOS file system error.256 GE$GDF Unrecognized keyword during GDF file load.257 GE$NEG Negative data values not allowed in
specified graph type.258 GE$NDF Requested data range label has no
associated data point stored.259 GE$AXS Axis start value exceeds end value.260 GE$GNF GRAPH.SYS not found.261 GE$FUL Impure data area full.262 GE$PIM Parameter variable not large enough.263 GE$FNO File channel not open.
GRAPH Reference Manual, Rev. 01

Page Index-1GRAPH Reference Manual
INDEX
AlphaBASIC . . . . . . . . . . . . . . . . . . . . . . . . 3-2AlphaBASIC language . . . . . . . . . . . . . . . . 2-1, 3-1AlphaC language . . . . . . . . . . . . . . . . . . . . 2-1AMIGOS . . . . . . . . . . . . . . . . . . . . . . . . . . . 2-1 documentation library . . . . . . . . . . . . . . 1-2 functions . . . . . . . . . . . . . . . . . . . . . . . . 2-1 software . . . . . . . . . . . . . . . . . . . . . . . . . 1-1AMOS compatibility . . . . . . . . . . . . . . . . . . 1-1Area chart . . . . . . . . . . . . . . . . . . . . . . . . . . 2-3, 2-8, 3-6Area fill . . . . . . . . . . . . . . . . . . . . . . . . . . . . 3-6Assembly language . . . . . . . . . . . . . . . . . . 2-1, 3-1Attributes . . . . . . . . . . . . . . . . . . . . . . . . . . . 2-10, 3-5Audience . . . . . . . . . . . . . . . . . . . . . . . . . . . 1-1Axis scaling . . . . . . . . . . . . . . . . . . . . . . . . . 2-10
Bar chart . . . . . . . . . . . . . . . . . . . . . . . . . . . 2-3, 3-6Braces (in examples) . . . . . . . . . . . . . . . . . 1-3
Call definitions . . . . . . . . . . . . . . . . . . . . . . 3-1Call format type face used for . . . . . . . . . . . . . . . . . 1-3Chart options . . . . . . . . . . . . . . . . . . . . . . . . . . 2-10 storage and retrieval . . . . . . . . . . . . . . . 2-11 style . . . . . . . . . . . . . . . . . . . . . . . . . . . . 2-3 type . . . . . . . . . . . . . . . . . . . . . . . . . . . . 2-3Chart title . . . . . . . . . . . . . . . . . . . . . . . . . . 3-3CHART.GDF . . . . . . . . . . . . . . . . . . . . . . . . 2-2Clustered bar chart . . . . . . . . . . . . . . . . . . . 2-3, 2-5, 3-6Color . . . . . . . . . . . . . . . . . . . . . . . . . . . . . . 2-4, 2-10, 3-6 to 3-7, 3-9 background . . . . . . . . . . . . . . . . . . . . . . 5-4
Data element . . . . . . . . . . . . . . . . . . . . . . . . . 3-10, 5-8 element label . . . . . . . . . . . . . . . . . . . . . 5-8 label . . . . . . . . . . . . . . . . . . . . . . . . . . . . 2-10, 3-11 point . . . . . . . . . . . . . . . . . . . . . . . . . . . . 2-2 point marker type . . . . . . . . . . . . . . . . . . 5-4 range maximum . . . . . . . . . . . . . . . . . . 2-2
GRAPH Reference Manual, Rev. 01

Page Index-2 GRAPH Reference Manual
structure . . . . . . . . . . . . . . . . . . . . . . . . . 2-1, 3-2, 3-8 type . . . . . . . . . . . . . . . . . . . . . . . . . . . . 2-2, 3-11 values . . . . . . . . . . . . . . . . . . . . . . . . . . 2-2Definition file extension . . . . . . . . . . . . . . . . 2-11Devices . . . . . . . . . . . . . . . . . . . . . . . . . . . . 2-1Display . . . . . . . . . . . . . . . . . . . . . . . . . . . . 4-5Displaying charts . . . . . . . . . . . . . . . . . . . . 2-2Documentation . . . . . . . . . . . . . . . . . . . . . . 1-2
Error codes . . . . . . . . . . . . . . . . . . . . . . . . . 4-1, A-1
File closing . . . . . . . . . . . . . . . . . . . . . . . . . . 2-2 opening for output . . . . . . . . . . . . . . . . . 2-2Fill pattern . . . . . . . . . . . . . . . . . . . . . . . . . . 2-10, 3-6 definition . . . . . . . . . . . . . . . . . . . . . . . . 5-5Floating point . . . . . . . . . . . . . . . . . . . . . . . 3-11 format . . . . . . . . . . . . . . . . . . . . . . . . . . . 2-2Footnote . . . . . . . . . . . . . . . . . . . . . . . . . . . 3-3, 5-6Functions . . . . . . . . . . . . . . . . . . . . . . . . . . 4-1
GCB . . . . . . . . . . . . . . . . . . . . . . . . . . . . . . 2-1GCLRW . . . . . . . . . . . . . . . . . . . . . . . . . . . 2-1GCLWK . . . . . . . . . . . . . . . . . . . . . . . . . . . . 2-2GDF file . . . . . . . . . . . . . . . . . . . . . . . . . . . . 2-11, 4-7, 4-9GE$EXP . . . . . . . . . . . . . . . . . . . . . . . . . . . 3-10GE$PRC . . . . . . . . . . . . . . . . . . . . . . . . . . . 3-10GE$XVL . . . . . . . . . . . . . . . . . . . . . . . . . . . 3-10GE$YVL . . . . . . . . . . . . . . . . . . . . . . . . . . . 3-10GE.DTX . . . . . . . . . . . . . . . . . . . . . . . . . . . 3-11GE.DTY . . . . . . . . . . . . . . . . . . . . . . . . . . . 3-11GE.FLG . . . . . . . . . . . . . . . . . . . . . . . . . . . . 3-10GE.LBL . . . . . . . . . . . . . . . . . . . . . . . . . . . . 3-11GE.SIZ . . . . . . . . . . . . . . . . . . . . . . . . . . . . 3-10GE.TYP . . . . . . . . . . . . . . . . . . . . . . . . . . . . 3-11GO.CAR . . . . . . . . . . . . . . . . . . . . . . . . . . . 3-2, 4-20GO.CSR . . . . . . . . . . . . . . . . . . . . . . . . . . . 3-2GO.DSP . . . . . . . . . . . . . . . . . . . . . . . . . . . 2-2, 3-1, 4-5GO.GGP . . . . . . . . . . . . . . . . . . . . . . . . . . . 3-1, 4-11GO.GRD . . . . . . . . . . . . . . . . . . . . . . . . . . . 3-2, 4-15GO.IMP . . . . . . . . . . . . . . . . . . . . . . . . . . . . 2-2, 3-1 to 3-2, 4-2GO.INI . . . . . . . . . . . . . . . . . . . . . . . . . . . . . 2-2, 3-1, 4-4GO.LOD . . . . . . . . . . . . . . . . . . . . . . . . . . . 2-2, 2-11, 3-1, 4-7GO.PGP . . . . . . . . . . . . . . . . . . . . . . . . . . . 3-1, 4-13GO.PRD . . . . . . . . . . . . . . . . . . . . . . . . . . . 3-2, 4-17GO.SAV . . . . . . . . . . . . . . . . . . . . . . . . . . . 2-2, 2-11, 3-1, 4-9GO.SCR . . . . . . . . . . . . . . . . . . . . . . . . . . . 4-19GO.SUP . . . . . . . . . . . . . . . . . . . . . . . . . . . 2-11, 3-2, 4-21GOPWK function . . . . . . . . . . . . . . . . . . . . 2-1GP.BCL . . . . . . . . . . . . . . . . . . . . . . . . . . . . 3-7
GRAPH Reference Manual, Rev. 01

Page Index-3GRAPH Reference Manual
GP.FAP . . . . . . . . . . . . . . . . . . . . . . . . . . . . 3-6GP.FOT . . . . . . . . . . . . . . . . . . . . . . . . . . . 3-3GP.LGN . . . . . . . . . . . . . . . . . . . . . . . . . . . 3-8GP.MRK . . . . . . . . . . . . . . . . . . . . . . . . . . . 3-8GP.SIZ . . . . . . . . . . . . . . . . . . . . . . . . . . . . 3-2GP.ST1 . . . . . . . . . . . . . . . . . . . . . . . . . . . . 3-3GP.ST2 . . . . . . . . . . . . . . . . . . . . . . . . . . . . 3-3GP.TCL . . . . . . . . . . . . . . . . . . . . . . . . . . . . 3-7GP.TTL . . . . . . . . . . . . . . . . . . . . . . . . . . . . 3-3GP.TXA . . . . . . . . . . . . . . . . . . . . . . . . . . . . 3-3, 3-5GP.TYP . . . . . . . . . . . . . . . . . . . . . . . . . . . . 3-6GP.XEN . . . . . . . . . . . . . . . . . . . . . . . . . . . 3-5GP.XGR . . . . . . . . . . . . . . . . . . . . . . . . . . . 3-6GP.XIN . . . . . . . . . . . . . . . . . . . . . . . . . . . . 3-5GP.XLB . . . . . . . . . . . . . . . . . . . . . . . . . . . . 3-4GP.XPR . . . . . . . . . . . . . . . . . . . . . . . . . . . 3-5GP.XST . . . . . . . . . . . . . . . . . . . . . . . . . . . . 3-5GP.XTP . . . . . . . . . . . . . . . . . . . . . . . . . . . . 3-6GP.YEN . . . . . . . . . . . . . . . . . . . . . . . . . . . 3-4GP.YGR . . . . . . . . . . . . . . . . . . . . . . . . . . . 3-7GP.YIN . . . . . . . . . . . . . . . . . . . . . . . . . . . . 3-4GP.YLB . . . . . . . . . . . . . . . . . . . . . . . . . . . . 3-4GP.YPR . . . . . . . . . . . . . . . . . . . . . . . . . . . 3-4GP.YST . . . . . . . . . . . . . . . . . . . . . . . . . . . . 3-4GP.YTP . . . . . . . . . . . . . . . . . . . . . . . . . . . . 3-6GR.CLR . . . . . . . . . . . . . . . . . . . . . . . . . . . 3-9GR.CNT . . . . . . . . . . . . . . . . . . . . . . . . . . . 3-9GR.DAT . . . . . . . . . . . . . . . . . . . . . . . . . . . 3-10GR.FLG . . . . . . . . . . . . . . . . . . . . . . . . . . . 3-9GR.LST . . . . . . . . . . . . . . . . . . . . . . . . . . . . 3-9GR.NUM . . . . . . . . . . . . . . . . . . . . . . . . . . . 3-8GR.TTL . . . . . . . . . . . . . . . . . . . . . . . . . . . . 3-10GRAPH . . . . . . . . . . . . . . . . . . . . . . . . . . . . 1-1, 2-1 software . . . . . . . . . . . . . . . . . . . . . . . . . 1-1GRAPH.H . . . . . . . . . . . . . . . . . . . . . . . . . . 2-1, 3-1GRAPH.SYS . . . . . . . . . . . . . . . . . . . . . . . . 2-1, 3-1, 4-1Gray scale . . . . . . . . . . . . . . . . . . . . . . . . . . 2-10GRFCLB.LIB . . . . . . . . . . . . . . . . . . . . . . . . 2-1GRFSBR.SBR . . . . . . . . . . . . . . . . . . . . . . 2-1, 3-1GRFSYM.BSI . . . . . . . . . . . . . . . . . . . . . . . 2-1, 3-1GRFSYM.M68 . . . . . . . . . . . . . . . . . . . . . . 2-1, 3-1, 4-1GTY keyword type of graph . . . . . . . . . . . . . . . . . . . . . 5-1GXG . . . . . . . . . . . . . . . . . . . . . . . . . . . . . . 5-3
Impure area . . . . . . . . . . . . . . . . . . . . . . . . 2-11, 3-8Impure memory . . . . . . . . . . . . . . . . . . . . . . 2-2, 3-2, 4-2 loading . . . . . . . . . . . . . . . . . . . . . . . . . . 2-2Initialization . . . . . . . . . . . . . . . . . . . . . . . . . 4-4Initialize
GRAPH Reference Manual, Rev. 01

Page Index-4 GRAPH Reference Manual
impure memory . . . . . . . . . . . . . . . . . . . 2-2 output device . . . . . . . . . . . . . . . . . . . . . 2-1 workstation . . . . . . . . . . . . . . . . . . . . . . . 2-1Installation . . . . . . . . . . . . . . . . . . . . . . . . . . 1-1
Keyword GBC . . . . . . . . . . . . . . . . . . . . . . . . . . . . 5-4 GFN . . . . . . . . . . . . . . . . . . . . . . . . . . . . 5-6 GFP . . . . . . . . . . . . . . . . . . . . . . . . . . . . 5-5 GMT . . . . . . . . . . . . . . . . . . . . . . . . . . . . 5-4 GnC . . . . . . . . . . . . . . . . . . . . . . . . . . . . 5-7 GnS . . . . . . . . . . . . . . . . . . . . . . . . . . . . 5-7 GnT . . . . . . . . . . . . . . . . . . . . . . . . . . . . 5-8 GS1 . . . . . . . . . . . . . . . . . . . . . . . . . . . . 5-6 GS2 . . . . . . . . . . . . . . . . . . . . . . . . . . . . 5-6 GTA . . . . . . . . . . . . . . . . . . . . . . . . . . . . 5-5 GTC . . . . . . . . . . . . . . . . . . . . . . . . . . . . 5-4 GTL . . . . . . . . . . . . . . . . . . . . . . . . . . . . 5-6 GUP . . . . . . . . . . . . . . . . . . . . . . . . . . . . 5-6 GXE . . . . . . . . . . . . . . . . . . . . . . . . . . . . 5-3 GXI . . . . . . . . . . . . . . . . . . . . . . . . . . . . . 5-3 GXL . . . . . . . . . . . . . . . . . . . . . . . . . . . . 5-6 GXP . . . . . . . . . . . . . . . . . . . . . . . . . . . . 5-3 GXS . . . . . . . . . . . . . . . . . . . . . . . . . . . . 5-3 GXT . . . . . . . . . . . . . . . . . . . . . . . . . . . . 5-3 GYE . . . . . . . . . . . . . . . . . . . . . . . . . . . . 5-2 GYG . . . . . . . . . . . . . . . . . . . . . . . . . . . . 5-2 GYI . . . . . . . . . . . . . . . . . . . . . . . . . . . . . 5-2 GYL . . . . . . . . . . . . . . . . . . . . . . . . . . . . 5-7 GYP . . . . . . . . . . . . . . . . . . . . . . . . . . . . 5-2 GYS . . . . . . . . . . . . . . . . . . . . . . . . . . . . 5-2 GYT . . . . . . . . . . . . . . . . . . . . . . . . . . . . 5-1 LGN . . . . . . . . . . . . . . . . . . . . . . . . . . . . 5-5 RnDm . . . . . . . . . . . . . . . . . . . . . . . . . . . 5-8 RnLm . . . . . . . . . . . . . . . . . . . . . . . . . . . 5-8 X-axis grid type . . . . . . . . . . . . . . . . . . . 5-3
Label . . . . . . . . . . . . . . . . . . . . . . . . . . . . . . 3-4, 3-11Legend . . . . . . . . . . . . . . . . . . . . . . . . . . . . 2-10, 3-8Legend enable . . . . . . . . . . . . . . . . . . . . . . 5-5Line chart . . . . . . . . . . . . . . . . . . . . . . . . . . 2-3 to 2-4, 3-6Linestyle . . . . . . . . . . . . . . . . . . . . . . . . . . . 3-9
Marker . . . . . . . . . . . . . . . . . . . . . . . . . . . . . 2-11, 3-8Memory allocating . . . . . . . . . . . . . . . . . . . . . . . . 2-2 requirements . . . . . . . . . . . . . . . . . . . . . 3-2, 4-2Monochrome . . . . . . . . . . . . . . . . . . . . . . . . 2-10, 3-6
Negative data . . . . . . . . . . . . . . . . . . . . . . . 2-2, 2-6 to 2-8
GRAPH Reference Manual, Rev. 01

Page Index-5GRAPH Reference Manual
Operating system . . . . . . . . . . . . . . . . . . . . 1-1Options . . . . . . . . . . . . . . . . . . . . . . . . . . . . 2-10Output . . . . . . . . . . . . . . . . . . . . . . . . . . . . . 2-2
Parameters . . . . . . . . . . . . . . . . . . . . . . . . . 3-2Pie chart . . . . . . . . . . . . . . . . . . . . . . . . . . . 2-3, 2-7, 3-6Prerequisites . . . . . . . . . . . . . . . . . . . . . . . . 1-1
Range color . . . . . . . . . . . . . . . . . . . . . . . . . . . . 5-7 linestyle . . . . . . . . . . . . . . . . . . . . . . . . . 5-7 of data . . . . . . . . . . . . . . . . . . . . . . . . . . 2-2, 3-8 title . . . . . . . . . . . . . . . . . . . . . . . . . . . . . 5-8Reference books . . . . . . . . . . . . . . . . . . . . . 1-2Registers . . . . . . . . . . . . . . . . . . . . . . . . . . . 4-1Retrieval . . . . . . . . . . . . . . . . . . . . . . . . . . . 2-11 calls . . . . . . . . . . . . . . . . . . . . . . . . . . . . 2-2
Scaling . . . . . . . . . . . . . . . . . . . . . . . . . . . . 2-10Scatter chart . . . . . . . . . . . . . . . . . . . . . . . . 2-11Stacked bar chart . . . . . . . . . . . . . . . . . . . . 2-3, 2-6, 3-6Status . . . . . . . . . . . . . . . . . . . . . . . . . . . . . 4-1Storage . . . . . . . . . . . . . . . . . . . . . . . . . . . . 2-2, 2-11 calls . . . . . . . . . . . . . . . . . . . . . . . . . . . . 2-2 of text in GDF . . . . . . . . . . . . . . . . . . . . . 2-11Subroutines . . . . . . . . . . . . . . . . . . . . . . . . . 2-1Subtitle . . . . . . . . . . . . . . . . . . . . . . . . . . . . 2-10, 3-3Subtitle 1 . . . . . . . . . . . . . . . . . . . . . . . . . . . 5-6Subtitle 2 . . . . . . . . . . . . . . . . . . . . . . . . . . . 5-6System memory . . . . . . . . . . . . . . . . . . . . . 2-1
Text . . . . . . . . . . . . . . . . . . . . . . . . . . . . . . . 2-11 attributes . . . . . . . . . . . . . . . . . . . . . . . . 5-5 color . . . . . . . . . . . . . . . . . . . . . . . . . . . . 5-4Text attributes . . . . . . . . . . . . . . . . . . . . . . . 2-10, 3-5Title . . . . . . . . . . . . . . . . . . . . . . . . . . . . . . . 2-10, 3-3, 3-10, 5-6Type of graph keyword . . . . . . . . . . . . . . . . . . . . . . . . . 5-1
User memory . . . . . . . . . . . . . . . . . . . . . . . . . 2-1 parameter text line . . . . . . . . . . . . . . . . . 5-6 pointer . . . . . . . . . . . . . . . . . . . . . . . . . . 4-21 text . . . . . . . . . . . . . . . . . . . . . . . . . . . . . 4-21
X-axis end . . . . . . . . . . . . . . . . . . . . . . . . . . . . . 5-3 increment . . . . . . . . . . . . . . . . . . . . . . . . 5-3 label . . . . . . . . . . . . . . . . . . . . . . . . . . . . 5-6 prescale value . . . . . . . . . . . . . . . . . . . . 5-3
GRAPH Reference Manual, Rev. 01

Page Index-6 GRAPH Reference Manual
start . . . . . . . . . . . . . . . . . . . . . . . . . . . . 5-3 type . . . . . . . . . . . . . . . . . . . . . . . . . . . . 5-3X-Y chart . . . . . . . . . . . . . . . . . . . . . . . . . . . . 2-3, 2-9, 3-6 coordinate pair . . . . . . . . . . . . . . . . . . . . 2-2
Y-axis end . . . . . . . . . . . . . . . . . . . . . . . . . . . . . 5-2 grid type . . . . . . . . . . . . . . . . . . . . . . . . . 5-2 increment . . . . . . . . . . . . . . . . . . . . . . . . 5-2 label . . . . . . . . . . . . . . . . . . . . . . . . . . . . 5-7 prescale value . . . . . . . . . . . . . . . . . . . . 5-2 start . . . . . . . . . . . . . . . . . . . . . . . . . . . . 5-2 type . . . . . . . . . . . . . . . . . . . . . . . . . . . . 5-1
GRAPH Reference Manual, Rev. 01