Embed Size (px)
Citation preview
Graphing
Chapter 2 Section 3pp. 42-47
GRAPHING
A graph is a visual way to organize data.
TYPES OF GRAPHS
Scatterplots (A.K.A. XY graphs)
Bar graphsPie graphsLine graphs
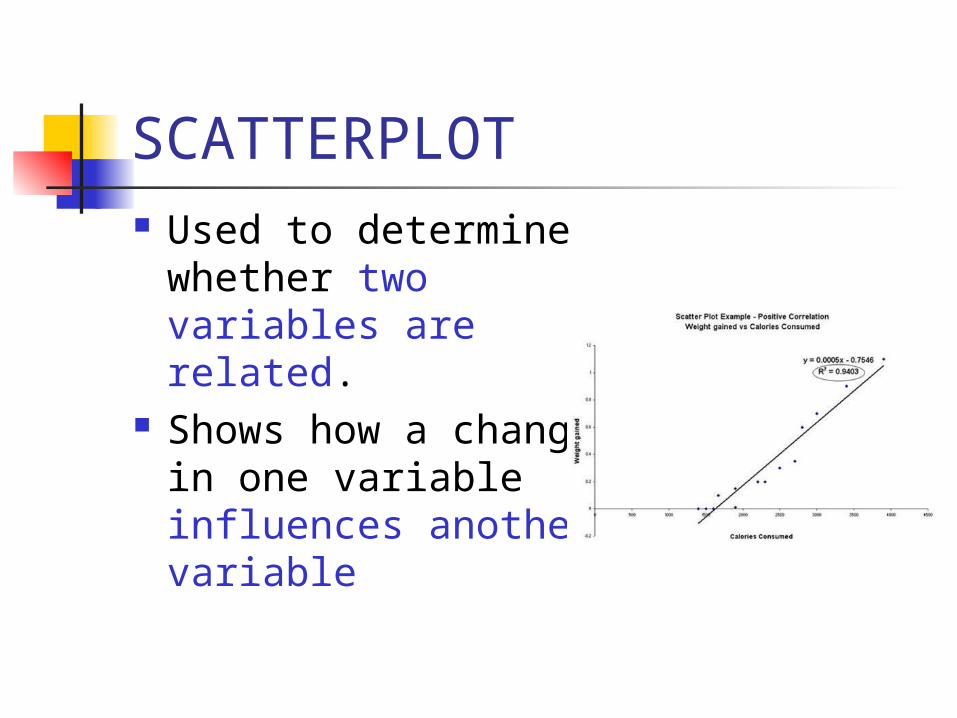
SCATTERPLOT Used to determine
whether two variables are related.
Shows how a change in one variable influences another variable
MAKING A SCATTERPLOT GRAPH
1. Assign the x- and y- axes2. Make a scale3. Plot your data4. Create a title
If time is a variable, it usually goes on the x-axis.
BAR GRAPH
Compares groups of information
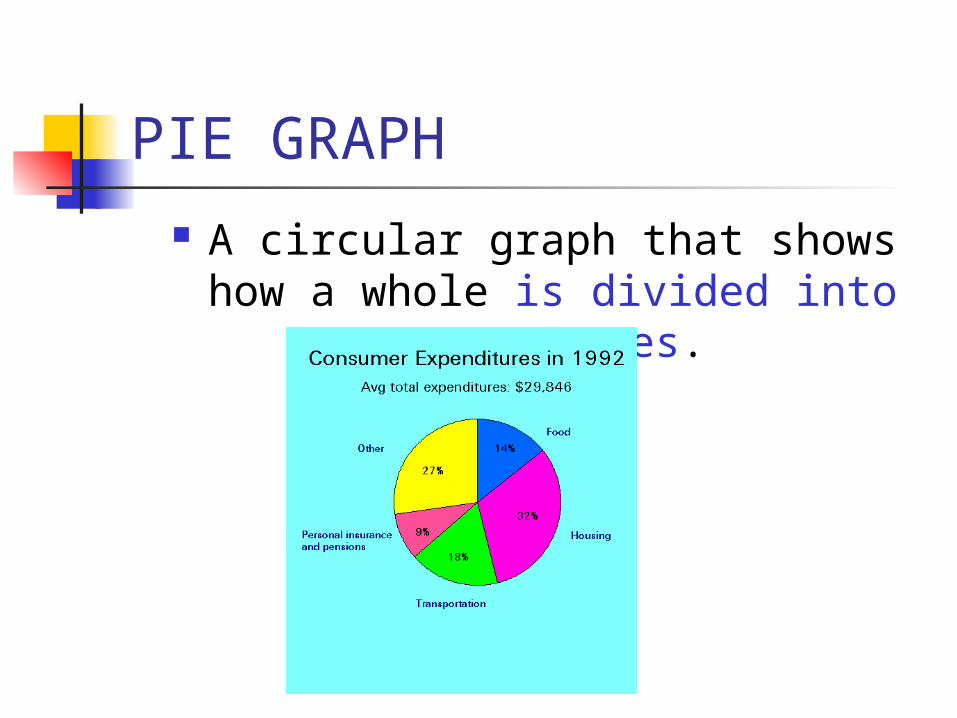
PIE GRAPH A circular graph that shows how a
whole is divided into percentages.
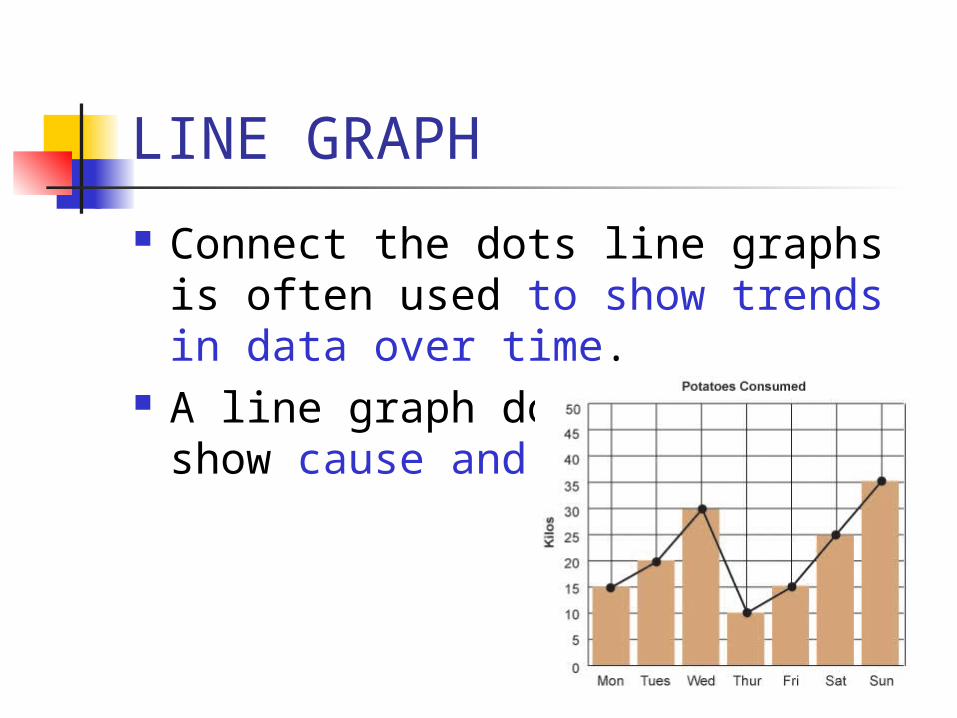
LINE GRAPH
Connect the dots line graphs is often used to show trends in data over time.
A line graph does not usually show cause and effect.
TYPES OF VARIABLE
Independent variable – the variable the experimenter changes “on purpose”. This is also known as a manipulated variable.
Dependent variable - the variable that is influenced by the independent variable. This is also known as a responding variable.
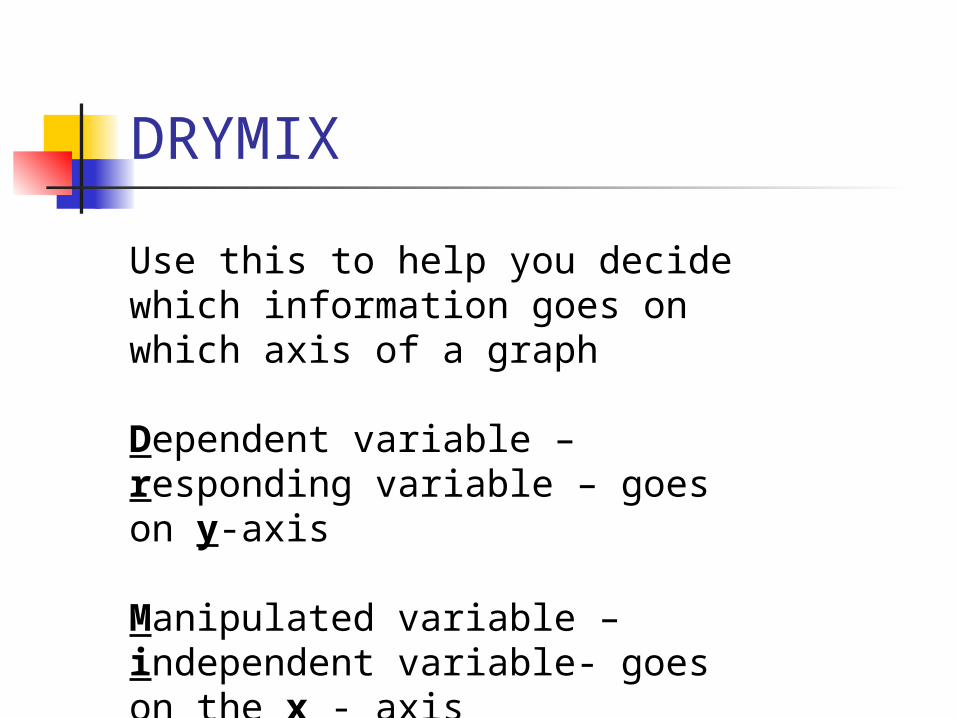
DRYMIX
Use this to help you decide which information goes on which axis of a graph
Dependent variable – responding variable – goes on y-axis
Manipulated variable – independent variable- goes on the x - axis
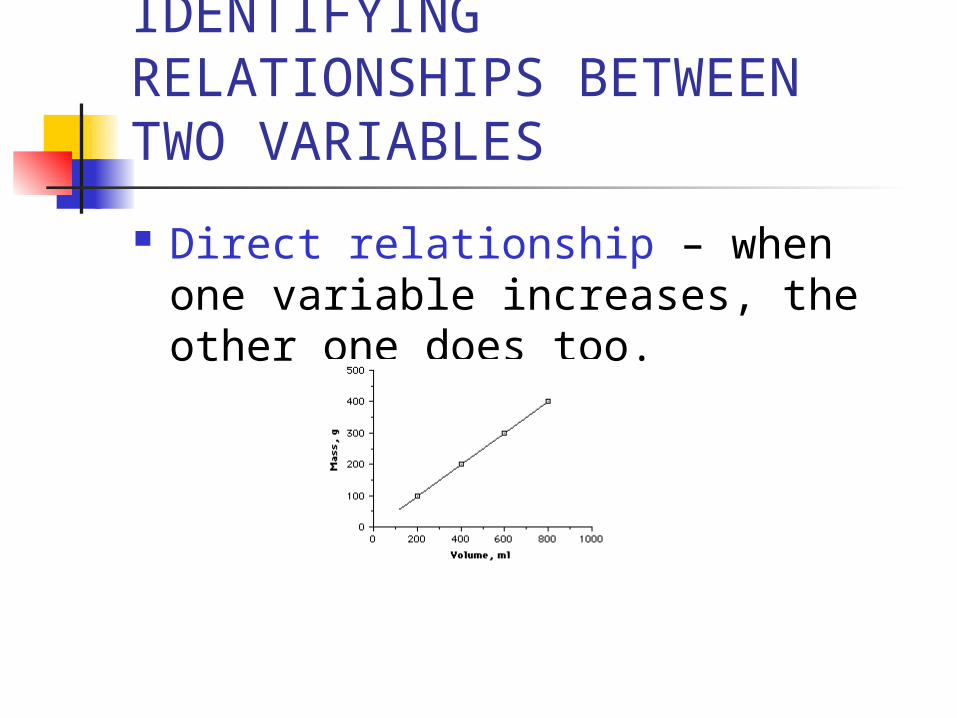
IDENTIFYING RELATIONSHIPS BETWEEN TWO VARIABLES
Direct relationship – when one variable increases, the other one does too.
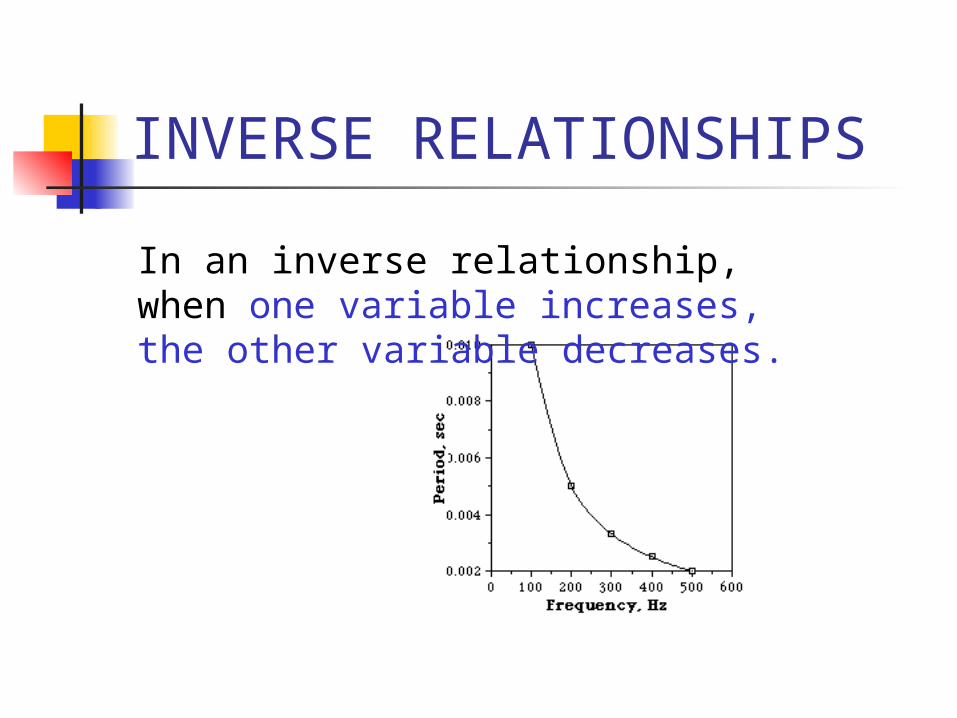
INVERSE RELATIONSHIPS
In an inverse relationship, when one variable increases, the other variable decreases.
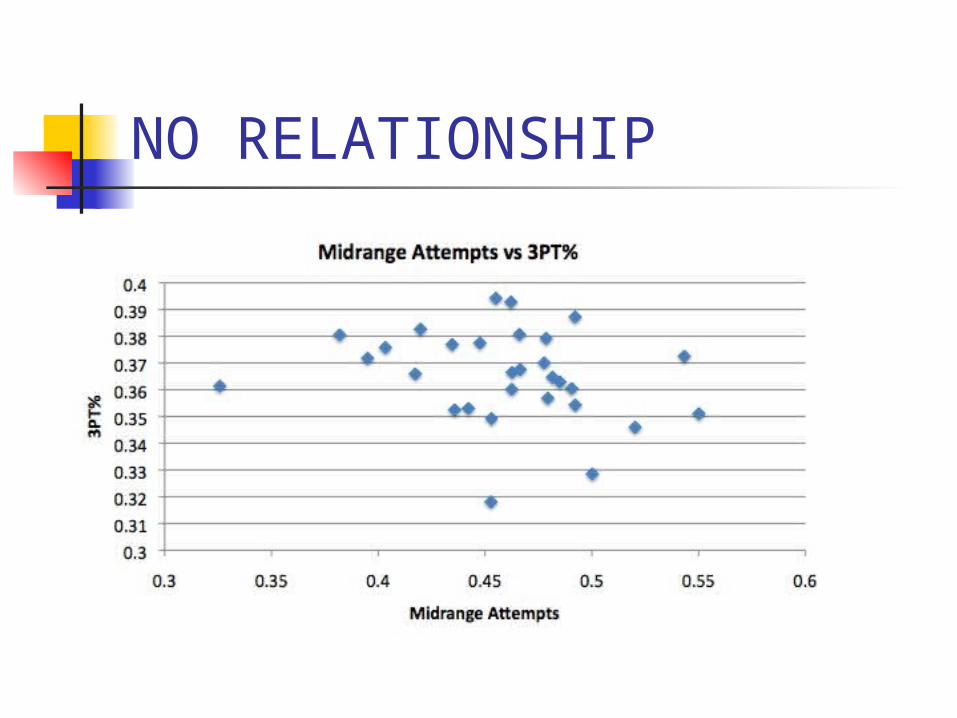
NO RELATIONSHIP
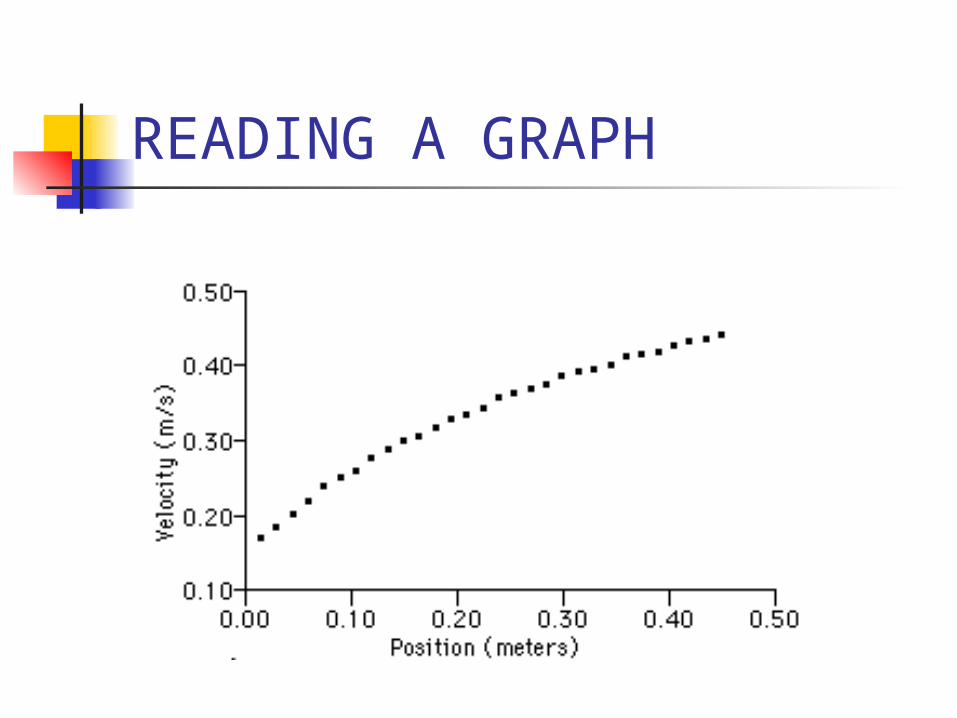
READING A GRAPH
GRAPHS
Large graphs are more precise than small graphs.
A graph is a form of a model. Scientists use models to make and test predictions.
SOLVING PROBLEMS
Chapter 2 Section 4 – pp. 48-50
A FOUR STEP TECHNIQUE
1. Looking for: What is the problem asking for? What variables or values need to be in the answer?
2. Given: What information are you given? This may include numbers or values or it may include descriptive info. to be interpreted.
A FOUR STEP TECHNIQUE
3. Relationships: What are the relationships that exist between what you are asked to find out & what you are given?
4. Solution: Combine the relationships with the info. you know to solve the problem.
A FOUR STEP TECHNIQUE TO PROBLEM SOLVING
Lettuce Grows Rather Slowly
First letter of each word stands for one step
TWO TYPES OF PROBLEMS
1. “Formula” problems – have one correct answer.
i.e. How far do you travel in 2 hours at 60 mph on a straight road?
2. Design problems – have more than one solution
i.e. Create a container that will protect a raw egg from breaking when dropped 10 meters on a sidewalk.
STEPS TO HELP YOU SOLVE DESIGN PROBLEMS
1. Write down everything your solution needs to accomplish.
2. Write down any constraints that must be met.
3. Think of an idea that might work.4. Follow the design cycle.
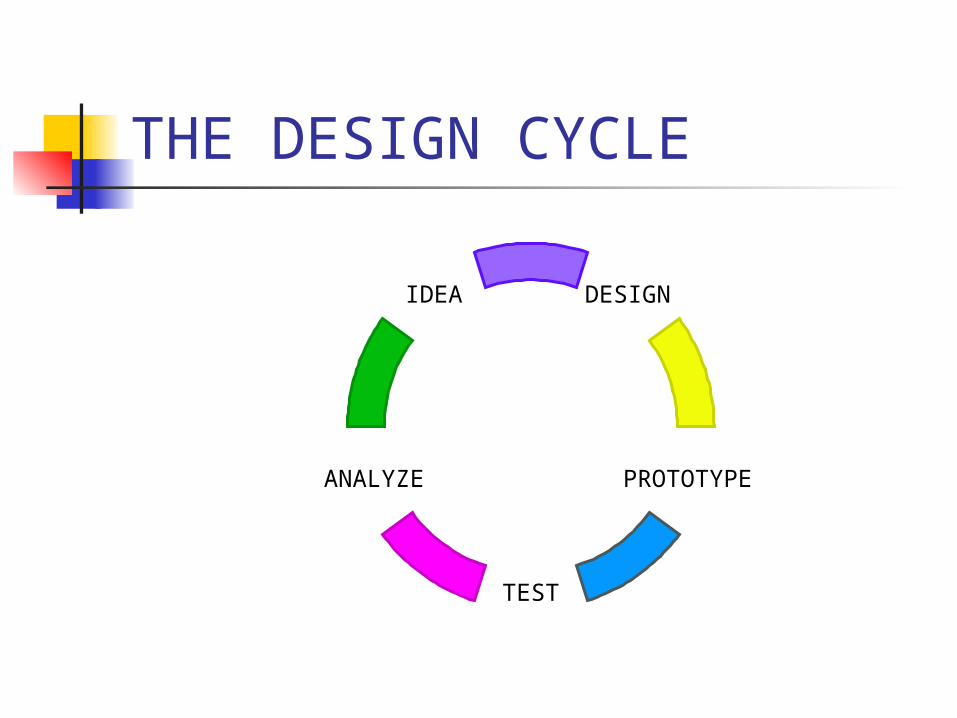
THE DESIGN CYCLE
DESIGN
TEST
ANALYZE PROTOTYPE
IDEA