Embed Size (px)
Citation preview
HAL Id: hal-00302133https://hal.archives-ouvertes.fr/hal-00302133
Submitted on 25 Sep 2006
HAL is a multi-disciplinary open accessarchive for the deposit and dissemination of sci-entific research documents, whether they are pub-lished or not. The documents may come fromteaching and research institutions in France orabroad, or from public or private research centers.
L’archive ouverte pluridisciplinaire HAL, estdestinée au dépôt et à la diffusion de documentsscientifiques de niveau recherche, publiés ou non,émanant des établissements d’enseignement et derecherche français ou étrangers, des laboratoirespublics ou privés.
Global contrail radiative forcing and the impact ofdiurnal variations of air the impact of diurnal variations
of airN. Stuber, P. Forster
To cite this version:N. Stuber, P. Forster. Global contrail radiative forcing and the impact of diurnal variations of airthe impact of diurnal variations of air. Atmospheric Chemistry and Physics Discussions, EuropeanGeosciences Union, 2006, 6 (5), pp.9123-9149. �hal-00302133�
ACPD6, 9123–9149, 2006
Global contrailradiative forcing
N. Stuber and P. Forster
Title Page
Abstract Introduction
Conclusions References
Tables Figures
J I
J I
Back Close
Full Screen / Esc
Printer-friendly Version
Interactive Discussion
EGU
Atmos. Chem. Phys. Discuss., 6, 9123–9149, 2006www.atmos-chem-phys-discuss.net/6/9123/2006/© Author(s) 2006. This work is licensedunder a Creative Commons License.
AtmosphericChemistry
and PhysicsDiscussions
Global contrail radiative forcingand the impact of diurnal variations of airtrafficN. Stuber1 and P. Forster2
1Department of Meteorology, The University of Reading, Earley Gate, PO Box 243, Reading,Berkshire, RG6 6BB, UK2School of Earth and Environment, University of Leeds, Leeds, LS2 9JT, UK
Received: 3 August 2006 – Accepted: 6 September 2006 – Published: 25 September 2006
Correspondence to: N. Stuber ([email protected])
9123

ACPD6, 9123–9149, 2006
Global contrailradiative forcing
N. Stuber and P. Forster
Title Page
Abstract Introduction
Conclusions References
Tables Figures
J I
J I
Back Close
Full Screen / Esc
Printer-friendly Version
Interactive Discussion
EGU
Abstract
We combined high resolution aircraft flight data from the EU Fifth Framework Pro-gramme project AERO2k with analysis data from the ECMWF’s integrated forecastsystem to calculate diurnally resolved 3-D contrail cover. Calibrating for the 1992 con-trail cover in the Bakan area (eastern-Atlantic/western-Europe), we obtained a global,5
annual mean contrail cover due to persistent, line-shaped contrails of 0.04%. Adoptinga contrail visible optical depth of 0.1, this contrail cover results in a global, annual meanradiative forcing of 2.0 mW/m2 for all-sky and 2.1 mW/m2 for clear sky conditions. Lessthan 40% of the global distance travelled by aircraft is due to flights during local nighttime. Yet, due to the cancellation of shortwave and longwave effects during daytime,10
night-flights contribute a disproportional 60 to 76% to the annual mean forcing. In gen-eral, regions with a significant local contrail radiative forcing are also regions for whichnight time flights amount to less than half of the daily total of flights. Neglecting diur-nal variations in air traffic/contrail cover by assuming a diurnal mean contrail cover cantherefore increase the global mean radiative forcing by up to 30%.15
Scaling the 1992 forcing for the year 2000 fuel usage and accounting for differencesin contrail optical depth, our forcing estimate is at the lower end but within the rangeof the most recent results. This reinforces the finding that some earlier published esti-mates of contrail radiative forcing are likely to be too large. Our study builds confidencein the calculation of contrail radiative forcing. Once the amount and optical properties20
of contrails are known there is relatively little uncertainty about their radiative effects.However, global model calculations of contrail radiative forcing crucially rely on scalingtheir contrail cover with observations. We therefore see the urgent need for an updateof area mean contrail cover values derived from multi-year analyses of observationaldata.25
9124

ACPD6, 9123–9149, 2006
Global contrailradiative forcing
N. Stuber and P. Forster
Title Page
Abstract Introduction
Conclusions References
Tables Figures
J I
J I
Back Close
Full Screen / Esc
Printer-friendly Version
Interactive Discussion
EGU
1 Introduction
Aviation can affect climate through a number of mechanisms, both directly and indi-rectly. The most visible one, and possibly also the mechanism than can be managedmost easily, is through contrails. A contrail will form when the atmospheric conditionsat the aircraft’s cruise altitude – in connection with the characteristics of the aircraft ex-5
haust – are favourable. Once formed, line-shaped contrails can persist for a few hours.Some of these persistent contrails can spread out and form cirrus clouds.
Whereas the climate effect (as measured by radiative forcing) of these contrail-induced cirrus clouds is highly uncertain, the radiative forcing due to line-shaped con-trails is sufficiently known to be attributed at least a “fair” level of scientific understand-10
ing (IPCC, 1999). In its Special Report on Aviation IPCC (1999) gave a best estimateof global mean radiative forcing from line-shaped contrails in 1992 of 20 mW/m2.
However, the IPCC estimate was based on a single study (Minnis et al., 1999), andsince then the global radiative effects of contrails have been further investigated, usingdifferent datasets, models, and methods (e.g., Myhre and Stordal, 2001; Marquart et15
al., 2003; Fichter et al., 2005). In these studies the estimate of global mean, annualmean radiative forcing due to line-shaped contrails has been continously lowered. In2005 the TRADEOFF project updated the IPCC’s 1992 value. Based on post-IPCCstudies it gave 10.0 mW/m2 as the best estimate of contrail radiative forcing in 2000(Sausen et al., 2005).20
In global studies of contrail radiative forcing the diurnal variation of air traffic is oftenneglected (e.g., Marquart et al., 2003; Fichter et al., 2005). Stuber et al. (2006) in-vestigated the effects of diurnal variations of air traffic on contrail radiative forcing oversoutheast England. They found that flights during the night time have a disproportion-ate effect on the annual, diurnal mean contrail radiative forcing.25
To determine the impact of diurnal variations of air traffic on global mean contrailradiative forcing, and to see how far the results of Stuber et al. (2006) are applicableon a global scale, we performed a global calculation of the radiative forcing due to line-
9125
ACPD6, 9123–9149, 2006
Global contrailradiative forcing
N. Stuber and P. Forster
Title Page
Abstract Introduction
Conclusions References
Tables Figures
J I
J I
Back Close
Full Screen / Esc
Printer-friendly Version
Interactive Discussion
EGU
shaped contrails. We derived contrail cover from a combination of diurnally resolved airtraffic data, and ECMWF analysis data. This contrail cover data set has been derivedindependently from earlier studies and is used here for the first time. As we additionallyused a sophisticated radiative transfer model our study also serves the purpose to giveanother independent estimate of global mean contrail radiative forcing.5
2 Model description
We used the delta-4-stream version of the radiative transfer code of Fu and Liou (1992,1993). The model includes gaseous absorption and scattering of shortwave as well aslongwave radiation (Fu et al., 1997). For water clouds spherical droplets are assumedat all wavelengths. For ice clouds the optical properties in the longwave are computed10
using the method described in Fu et al. (1998), assuming randomly oriented hexagonalice crystals. As well as taking part in model intercomparison exercises (Ellingson andFouquart, 1990), the model has also been previously applied in cloud (e.g., Charlock etal., 1995; Carlin et al., 2002) and contrail studies (e.g., Meerkoetter et al.,1999; Dudaet al., 2001).15
Solar insolation was modified according to the Julian day of the year. To accountfor the diurnal cycle of solar insolation we performed calculations every 1 hour, varyingthe solar zenith angle accordingly. The sizes of the cloud or contrail particles wereprescribed, letting the model calculate the liquid water content or ice water contentneeded to produce the prescribed optical depth in the visible (τvis). Generalised effec-20
tive diameters (Fu, 1996) of 21µm for high clouds and 6µm for mid and low cloudswere assumed. The generalised effective diameter of the contrail particles was calcu-lated from the particle spectrum given in Strauss et al. (1997), which is based on bothin-situ measurements and a temperature dependent parametrisation.
To test our model configuration we repeated the calculations performed by Meerkoet-25
ter et al. (1999) and Myhre and Stordal (2001; hereafter MS2001). Following Meerkoet-ter et al. (1999), a 100% contrail cover with τvis=0.52 was introduced into an otherwise
9126
ACPD6, 9123–9149, 2006
Global contrailradiative forcing
N. Stuber and P. Forster
Title Page
Abstract Introduction
Conclusions References
Tables Figures
J I
J I
Back Close
Full Screen / Esc
Printer-friendly Version
Interactive Discussion
EGU
clear atmosphere, using a continental midlatitude summer atmospheric profile. Thecontrail top was located as closely as possible to 11 km.
Following MS2001 a global 1% homogeneous contrail cover (τvis=0.3) was intro-duced at approximately 10.8 km altitude. Optical properties were prescribed accordingto Strauss et al. (1997). For this comparison we used seasonal mean atmospheric ver-5
tical profiles and surface data derived from a three-dimensional climatology compiledat the University of Reading, in a 20 by 10 degrees longitude/latitude resolution. Thisclimatology is based on satellite, aircraft and ground-based observations and provideslong-term monthly mean profiles of temperature and the mixing ratios of water vapourand ozone on 15 to 19 vertical pressure levels extending up to 1 hPa. Information is10
also given about the surface albedo and the amount, optical depth and height of low,mid, and high level clouds. Cloud information is based on ISCCP C2 data (Rossow etal., 1988).
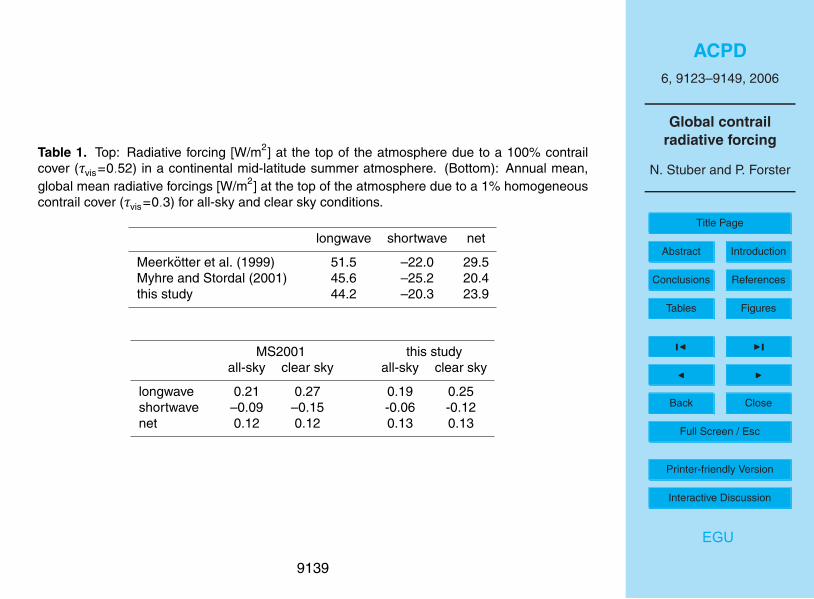
Given the different model configurations as well as differences inherent in a compari-son, e.g., differences in clouds, temperature and humidity profiles, and surface albedo,15
the results (Table 1) agree reasonably well for both contrail configurations. This impliesthat once the amount, location and properties of line-shaped contrails are known, thereis relatively little uncertainty in their radiative effect. It is worth noting, however, that allglobal estimates of contrail radiative forcing so far are based on calculations using aplane parallel geometry. Three-dimensional radiative transfer calculations have been20
found to increase the longwave radiative forcing and to either increase or decrease theshortwave radiative forcing – depending on the orientation of the contrail with respectto the sun (Gounou and Hogan, 2006). Although the individual effects are relativelysmall, they potentially have a significant impact on the fine balance between positivelongwave and negative shortwave effects. However, until 3-D effects are incorporated25
to re-evaluate global contrail radiative forcing calculations, best estimates of globalcontrail radiative forcing have to be based on plane-parallel approximations.
9127
ACPD6, 9123–9149, 2006
Global contrailradiative forcing
N. Stuber and P. Forster
Title Page
Abstract Introduction
Conclusions References
Tables Figures
J I
J I
Back Close
Full Screen / Esc
Printer-friendly Version
Interactive Discussion
EGU
3 Air traffic and contrail cover
We used gridded data from the EU FP5 project AERO2k (V1.0; see Eyers et al., 2004for details) to calculate global contrail cover. This dataset records several aviationemissions and details of distance flown for each month in 2002 and for four six-hourlytime periods – starting at midnight Greenwich Mean Time – averaged over one week in5
June 2002. The dataset gives a total fuel usage by civil aviation in 2002 of 156 Tg/year.From the distance-flown data for June 2002, we calculated the maximum persistentcontrail cover, assuming that every flight produced a contrail of a standard width andlifetime of 2 km and 2 h, respectively. Details of this methodology can be found in Stuberet al. (2006). We scaled these result with the monthly total column air traffic for 2002 to10
get diurnally resolved data for each month. This latter step has the consequence thatthe structure of the vertical profile of maximum persistent contrail cover is fixed to theJune profile over the course of the year.
Next we calculated the contrail frequency of occurrence using analysis data of theEuropean Centre for Medium-Range Weather Forecast’s integrated forecast system for15
the year 2004/2005. The data provides atmospheric profiles for each day of the month.We used data with a horizontal resolution of 2.5◦ longitude/latitude. For each layerin each gridbox we determined wether conditions were favourable for the formationof a contrail by applying a temperature/humidity criterion. Contrails formed in a grid-box if the temperature was less than 233.16 K (–40.0 ◦C) and the relative humidity with20
respect to ice exceeded 80.0%. Sensitivity studies, comparing observations of contrailsover Reading with ECMWF analysis data (for 2005) showed that these choices werethe optimum thresholds for maximizing the predicitive success of the analysis data(G. Radel, personal communication).
Combining the resulting contrail frequency of occurrence with the maximum possi-25
ble contrail cover we obtained the actual vertical distribution of monthly mean contrailcover for each gridbox, for each of the four six-hour time periods. Note that due tohaving only one week of diurnally resolved AREO2k data we had to omit possible sea-
9128
ACPD6, 9123–9149, 2006
Global contrailradiative forcing
N. Stuber and P. Forster
Title Page
Abstract Introduction
Conclusions References
Tables Figures
J I
J I
Back Close
Full Screen / Esc
Printer-friendly Version
Interactive Discussion
EGU
sonal variations in the vertical distribution of air traffic (see above). Therefore, anyseasonal variations in the height profile of contrails over a given location are solely dueto variations in atmospheric conditions.
We calibrated the data to match satellite observations for the eastern-Atlantic/western-Europe region. In 1992, the diurnal mean, annual mean contrail cover5
in this Bakan Area (30◦ W–30◦ E, 35◦ N–75◦ N) amounted to 0.375% (Bakan et al.,1994). This means that although flight data for 2002 was employed, by scaling the datawe are effectively making a radiative forcing estimate for 1992. To enable us to performthe calculations within a reasonable time-frame we reduced the spatial resolution to 20by 10 degrees longitude/latitude by averaging the contrail cover. Tests showed that this10
has a negligible effect on global and continental-scale radiative forcing numbers.As input for the radiative transfer calculations we derived vertical profiles of the atmo-
sphere using the three-dimensional climatology compiled at the University of Reading(see Sect. 2).
Figure 1 shows the annual variation in air traffic and global mean, monthly mean total15
column contrail cover, assuming random overlap of contrails in different layers. Globalair traffic has a minimum in February and a maximum in August with the distancetravelled by aircraft being approximately 23% larger. Nearly 94% of global air trafficare concentrated in the Northern Hemisphere, and an analysis of the AERO2k datashows that traffic is especially dense in the North Atlantic flight corridor of northern20
mid-latitudes. This NH concentration of air traffic has very little seasonal variation.The annual cycle in global mean, monthly mean contrail cover is affected by both,
the amount of air traffic and the meteorological conditions which determine if flights willactually form contrails. Air traffic and contrail favourable conditions peak in differentseasons. Whereas the global amount of air traffic is smallest in December, January,25
and February, chances for the formation of contrails reach a mimimum in June, July,and August, when the relative humidity in the upper troposphere of NH mid-latitudeshas its lowest values (see, e.g., Kley et al., 2000). The annual variation in contrail covershows that it is not the annual variations in air traffic, but rather the variations in contrail
9129
ACPD6, 9123–9149, 2006
Global contrailradiative forcing
N. Stuber and P. Forster
Title Page
Abstract Introduction
Conclusions References
Tables Figures
J I
J I
Back Close
Full Screen / Esc
Printer-friendly Version
Interactive Discussion
EGU
favourable conditions which have the dominant effect on the annual cycle in contrailcoverage. (Global contrail coverage is smallest in Northern Hemispheric summer witha distinct minimum in August.) Assuming random overlap, the global mean, annualmean contrail coverage, effective for 1992, is calculated to be 0.04%. Both Marquartet al. (2003) and Fichter et al. (2005) used a GCM to determine contrail favourable5
conditions. Using flight data for 1992 they obtained global annual mean contrail coversof 0.06 and 0.047%, respectively. Given the very different approach to calculatingcontrail cover, as well as differences in the flight data used, the agreement between thedifferent estimates is encouraging.
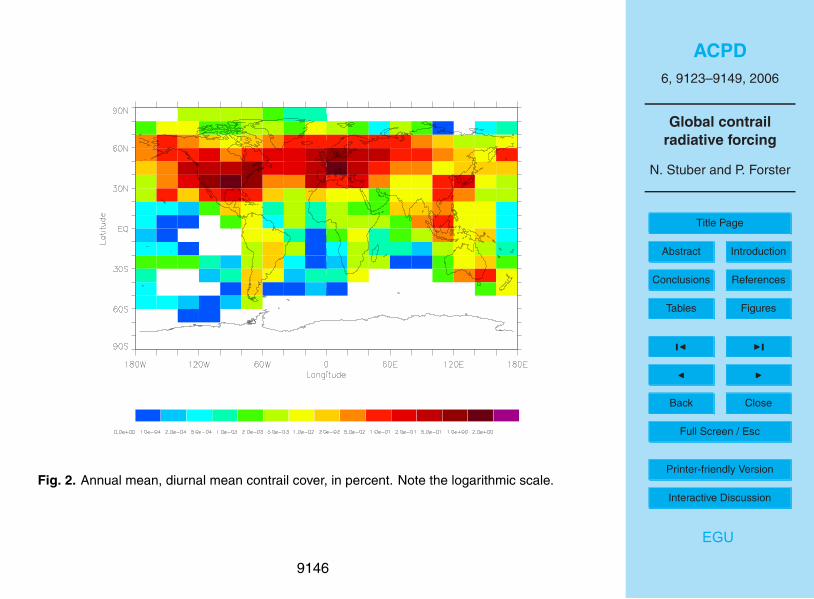
The geographical distribution of total column contrail cover (Fig. 2) reflects the lo-10
cation of the major flight routings. However, the poor horizontal resolution precludesdetailed features emerging. Maxima in contrail cover are seen over North America, theNorth Atlantic flight corridor, Europe, and the Far East.
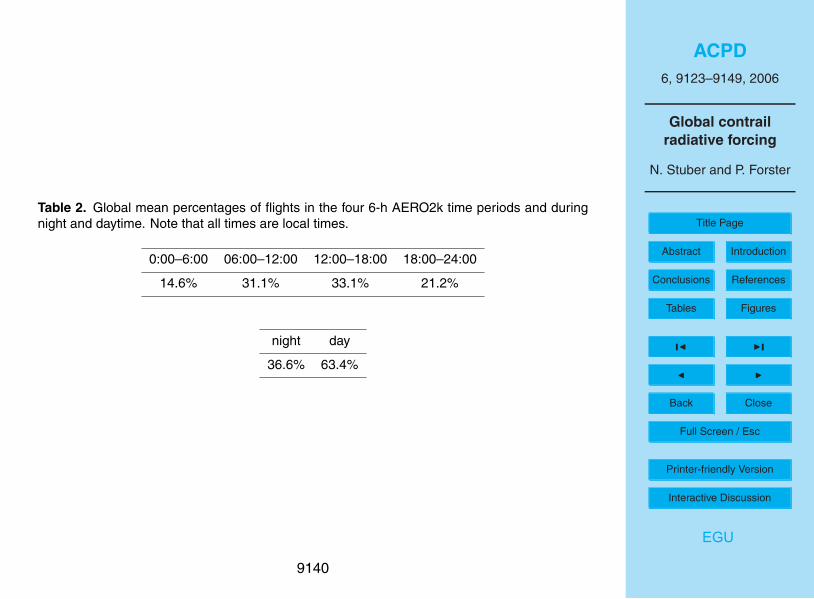
Table 2 gives the global mean percentages of flights during the four six-hour timeperiods (times given are local times) as well as during local night and day time. We15
performed the calculations (every 1 h) in local time, determining the relevant contrailcover by converting local times into GMT. Contributions were calculated using the solarzenith angle as an indicator of night and daytime. Note that in contrast to the num-bers stated in Stuber et al. (2006), “night” and “day” are no longer approximated by thetime periods 18:00–06:00 and 06:00–18:00, respectively, but refer to local times of day-20
light and darkness. Whereas the two time periods 6:00–12:00 and 12:00–18:00 haveapproximately equal shares in daily total air traffic, air traffic is unequally distributedbetween local day and night time, and the distance travelled is split roughly 2 to 1.
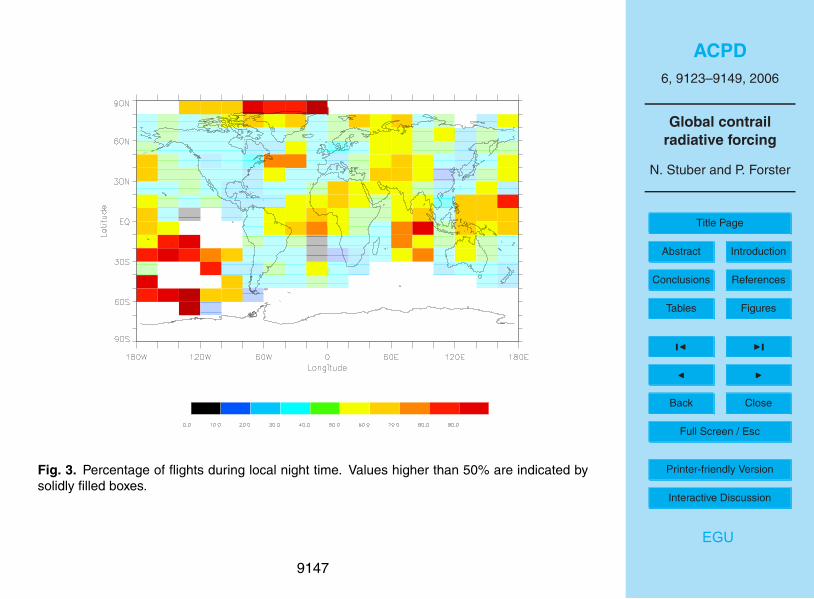
The diurnal variation in air traffic strongly depends on the geographic location(Fig. 3). For Western Europe and North America, where some night flying restric-25
tions apply to both incoming and outgoing flights, night time flights typically amount tobetween 20 and 40% of the total amount of flights. Flights heading for North Americaor Europe, where night flying restrictions are in place, have only certain time slots fordeparture from their home countries. Additionally, long haul flights, departing during
9130
ACPD6, 9123–9149, 2006
Global contrailradiative forcing
N. Stuber and P. Forster
Title Page
Abstract Introduction
Conclusions References
Tables Figures
J I
J I
Back Close
Full Screen / Esc
Printer-friendly Version
Interactive Discussion
EGU
day time, may well fly in darkness for parts of the journey. As a consequence, overparts of the Atlantic, Pacific, and Indian ocean, as well as Asia, more than half of thedaily total of air travel occurs during night time.
4 Contrail radiative forcing
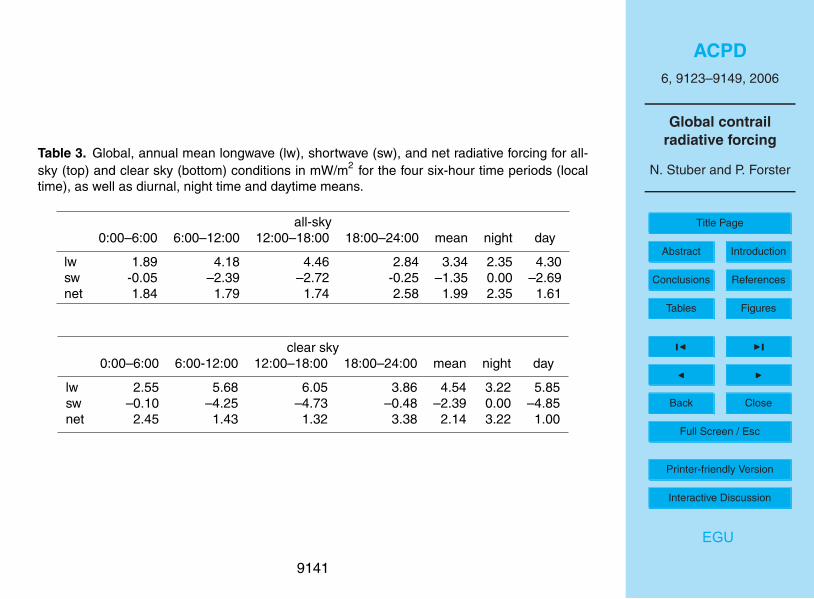
As our best estimate we calculated a global, annual mean contrail radiative forcing of5
2.0 mW/m2 for 1992 all-sky conditions (Table 3, top). Night time flights contribute 60%of this forcing. During daytime, most (62%) of the contrails’ longwave effects are offsetby their shortwave effects. If we assume clear sky conditions the forcing is slightly(5%) larger (Table 3, bottom). The presence of natural clouds tends to reduce themagnitude of both the shortwave and longwave effects. Thus, they increase daytime10
net forcings, and reduce night time net forcings. In the absence of natural cloudsthe importance of night time flights is increased, with night time flights’ contributionto the diurnal mean forcing amounting to 76%. In this case the cancellation betweenlongwave and shortwave effects during daytime is even more pronounced than for all-sky conditions and amounts to 83%.15
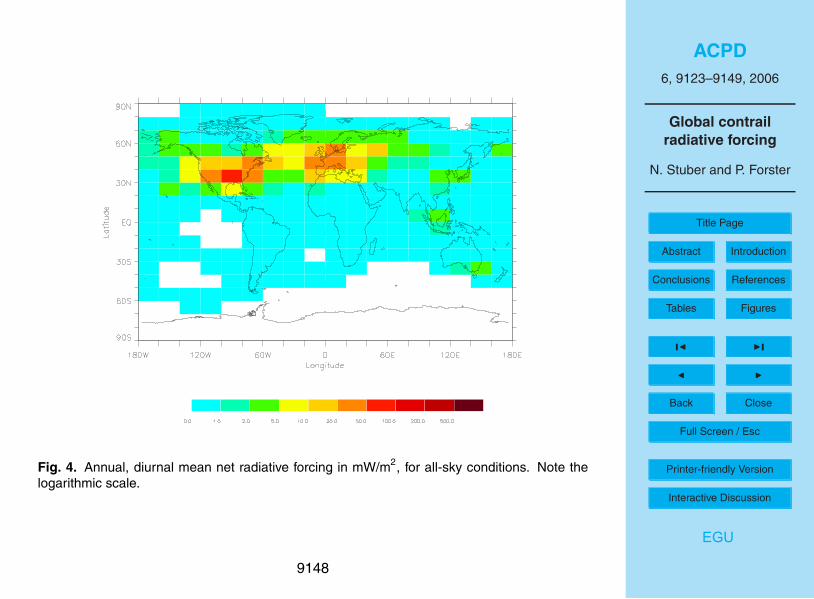
The geographical distribution of the annual, diurnal mean net radiative forcing (Fig. 4)shows relative maxima of contrail radiative forcing over North America, Western Eu-rope, and the North Atlantic flight corridor. With the exception of the North Atlanticflight corridor these are locations for which night time flights account for less than 50%of daily flights (Fig. 3).20
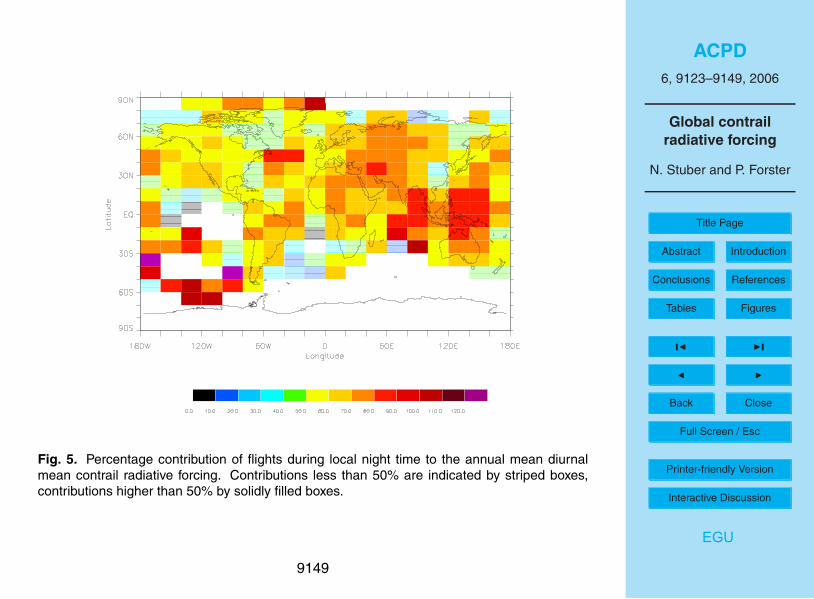
Figure 5 shows a geographical distribution of the contribution of local night timeflights to the annual, diurnal mean net radiative forcing. Over large parts of the globenight time flights contribute more than half of the annual, diurnal mean net radiativeforcing. For two gridboxes in the Southern Pacific the contributions are larger than100%. A close inspection of these locations shows that air traffic and meteorological25
conditions are such that contrails only occur during one month, for which mean daytimeforcings are negative. However, as Fig. 4 shows, the net forcing for these gridboxes is
9131
ACPD6, 9123–9149, 2006
Global contrailradiative forcing
N. Stuber and P. Forster
Title Page
Abstract Introduction
Conclusions References
Tables Figures
J I
J I
Back Close
Full Screen / Esc
Printer-friendly Version
Interactive Discussion
EGU
insignificant.In order to determine the impact of the diurnal variation of air traffic on contrail radia-
tive forcing, we conducted an additional experiment, in which we eliminated the diurnalvariation by assuming the diurnal mean vertical profile of contrail cover at all times ofday. Note that, as the vertical profile of air traffic is varying during the course of the day,5
assuming a diurnal mean contrail cover will change not only the amount but also thevertical distribution of contrails.
In the global, annual mean, eliminating the diurnal variation of air traffic increasesthe amount of flights during local night time (Table 2). Accordingly, the magnitude ofthe shortwave forcing decreases by about 17% (Table 4). The longwave forcing slightly10
increases by 5%. As it is hardly affected by the solar zenith angle, the change inlongwave forcing is likely to be due to changes in the vertical profiles of contrail cover.Depending on wether all-sky or clear sky conditions are assumed net radiative forcingincreases by 20% (all-sky) to 30% (clear sky) when a diurnally constant contrail coveris imposed.15
For those locations with a significant local forcing, i.e., the USA, Western Europe, andparts of the North Atlantic flight corridor (Fig. 4), net radiative forcings increase whenthe diurnal variation of air traffic is neglected. For these locations a diurnally uniformdistribution of flights increases the amount of flights during local night time (Fig. 3), andthus decreases the amount of cancellation between longwave and shortwave effects.20
5 Summary and conclusions
Combining AERO2k flight data with analysis data from the ECMWF’s integrated fore-cast system, and calibrating for the 1992 contrail cover in the Bakan Area, we calcu-lated a diurnally resolved 3-D distribution of contrail cover. In the global, annual mean,contrail cover due to line-shaped persistent contrails amounts to 0.04%. Assuming a25
contrail visible optical depth of 0.1, this contrail cover results in a global mean, annualmean net radiative forcing for 1992 of 2.0 mW/m2 for cloudy, and 2.1 mW/m2 for clear
9132
ACPD6, 9123–9149, 2006
Global contrailradiative forcing
N. Stuber and P. Forster
Title Page
Abstract Introduction
Conclusions References
Tables Figures
J I
J I
Back Close
Full Screen / Esc
Printer-friendly Version
Interactive Discussion
EGU
sky conditions. Note that these numbers give an estimate of the radiative forcing due toline-shaped, persistent contrails. They neither include the possible radiative effects ofaged, spread contrails, nor the effects of aviation induced cirrus clouds. Currently bothmechanisms are still too uncertain to have the basis for anything close to a reliableforcing estimate.5
Stuber et al. (2006) found that for the south-east of England night flights contribute 60to 80% to the annual mean forcing, despite the fact of being responsible for only 25%of the flights. Globally, the amount of night flights is larger, with almost 40% of the totaldistance travelled being due to flying during local night time. Their contribution to theannual mean contrail radiative forcing is very similar to that for flights over south-east10
England. For all-sky conditions they contribute 60% to the annual mean contrail radia-tive forcing. For clear sky conditions their relative importance is even higher (76%).
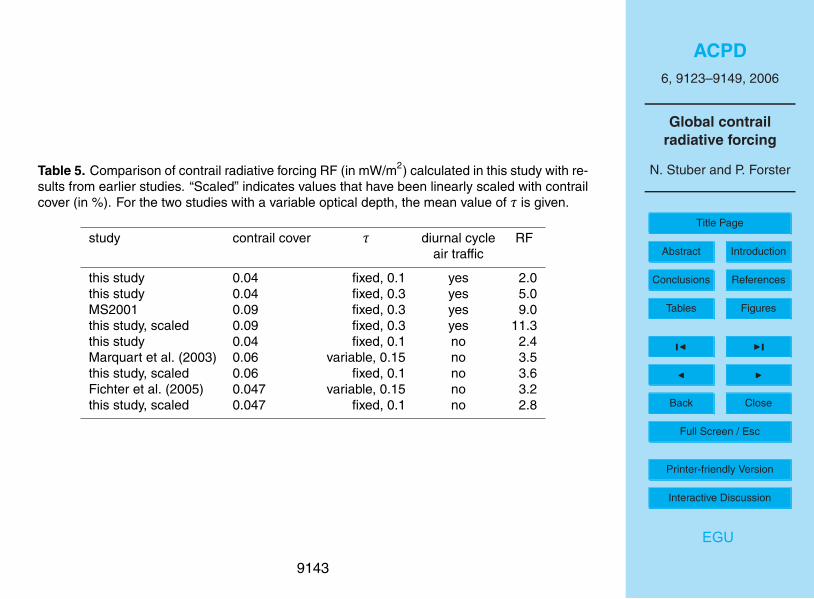
Table 5 compares the contrail radiative forcing obtained in this study with valuesfrom earlier studies. Myhre and Stordal (2001; MS2001) used the Sausen et al. (1998)contrail cover, which is based on the DLR inventory (Schmitt and Brunner, 1997), to15
calculate global contrail radiative forcing. The global mean contrail cover for this dataset amounts to 0.09%, also for 1992. They scaled the data to obtain a diurnally re-solved contrail cover and used a radiative transfer model to calculate contrail radiativeforcing. Assuming a contrail visible optical depth of 0.3 they calculated a net forcingof 9.0 mW/m2. Typical contrail optical depths are now believed to be lower than 0.3.20
However, increasing the optical depth in our calculation to 0.3 results in a net radiativeforcing of 5.0 mW/m2. A linear scaling of this value for a global mean contrail coverof 0.09% increases the forcing to 11.3 mW/m2, which is 25% larger than the equiva-lent value calculated by MS2001. One reason for this discrepancy is that the modelused by MS2001 assumes non-scattering clouds in the longwave part of the spectrum.25
Scattering of longwave radiation is known to enhance the greenhouse effect of cloudsand especially high clouds and contrails (e.g., Edwards and Slingo, 1996). Other rea-sons are most likely due to differences in the horizontal and vertical distribution of airtraffic and, hence, contrails, the distribution of natural clouds, and differences in the
9133
ACPD6, 9123–9149, 2006
Global contrailradiative forcing
N. Stuber and P. Forster
Title Page
Abstract Introduction
Conclusions References
Tables Figures
J I
J I
Back Close
Full Screen / Esc
Printer-friendly Version
Interactive Discussion
EGU
background meteorological conditions.Marquart et al. (2003) also adopted the DLR inventory, but used a GCM to determine
both contrail cover and optical depth. They obtained a global, annual mean contrailcover of 0.06% and a mean contrail optical depth of about 0.15. Neglecting the diurnalcycle of air traffic, but correcting their result a posteriori for the effects of longwave5
scattering excluded in the GCM’s radiation code, they calculated a contrail radiativeforcing of 3.5 mW/m2 for 1992. They stated that including the diurnal cycle of air trafficdecreased their forcing by less than 10%. Using the same GCM, but the inventorydeveloped within the EU FP5 project TRADEOFF, Fichter et al. (2005) obtained a globalannual mean contrail cover for 1992 of 0.047%. Again neglecting the diurnal variation10
in air traffic, they calculated a contrail radiative forcing of 3.2 mW/m2.Omitting the diurnal cycle of air traffic in our calculations we derived a contrail radia-
tive forcing of 2.4 mW/m2. Scaling this value linearly for a contrail coverage of 0.047%or 0.06% results in forcings of 2.8 mW/m2 and 3.6 mW/m2, respectively. Given the verydifferent approaches to calculating contrail cover and differences in the radiation code15
as well as taking into account the consequences of assuming a globally and season-ally fixed contrail optical depth, our values agree very well with those of the two earlierstudies. Additionally, taking into account the differences in the studies’ approaches todetermining contrail cover, the agreement in the amount of global, annual mean contrailcover is remarkably good.20
Our study agrees with the finding of Marquart et al. (2003), that global mean con-trail radiative forcing is increased, when the diurnal variation of air traffic/contrail coveris neglected. However, in contrast to Marquart et al. (2003) we found that neglectingthe diurnal variation of air traffic resulted in an overestimation of the global mean con-trail radiative forcing by 20% (all sky) to 30% (clear sky). Given the rather different25
result with respect to the relative importance of this effect we see the need for furtherinvestigations.
Our study builds confidence in calculating contrail radiative forcing. Once theamount, location and optical properties of the contrail cover are known there is rela-
9134
ACPD6, 9123–9149, 2006
Global contrailradiative forcing
N. Stuber and P. Forster
Title Page
Abstract Introduction
Conclusions References
Tables Figures
J I
J I
Back Close
Full Screen / Esc
Printer-friendly Version
Interactive Discussion
EGU
tively little uncertainty in its radiative forcing. It is therefore important to note that globalestimates of contrail radiative forcing crucially rely on calibrating their contrail cover-age with observations. Unfortunately, the Bakan et al. (1994) study, which gives anarea-mean contrail cover for the air traffic dense region of the eastern-Atlantic/western-Europe, and which is widely used to scale modeled contrail cover (e.g., Marquart et al.,5
2003; Fichter et al., 2005), has so far not been updated. Therefore, although we usedflight data for 2002, our estimate of contrail radiative forcing is effectively for the year1992. Estimates of contrail RF for other years (e.g., Sausen et al., 2005) can be ob-tained by linear scaling with the respective fuel usage. However, this method clearlyhas its limitations. We therefore see an urgent need for an update of the Bakan et10
al. (1994) contrail cover values. Additionally it is highly desirable to have multi-yearanalyses of contrail cover over other regions of the globe.
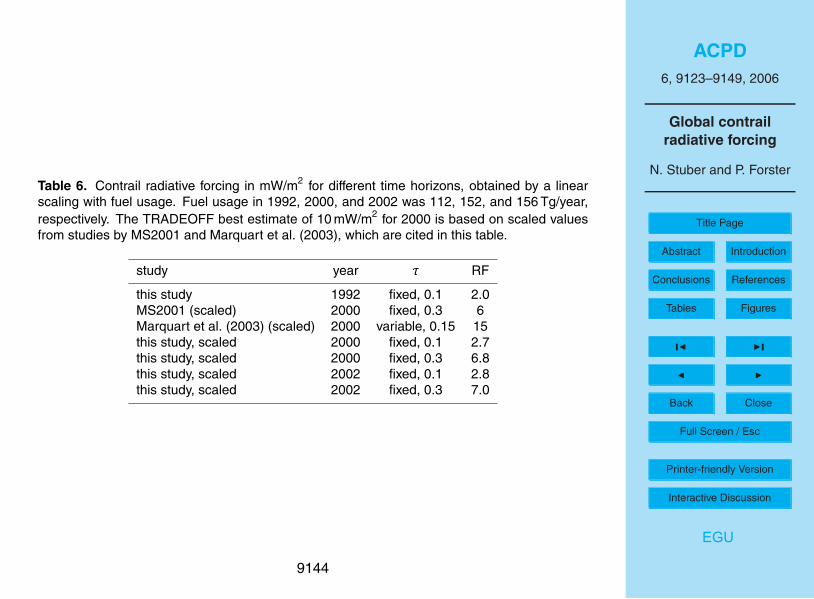
A linear scaling of our 1992 forcing value (fuel usage in 1992: 112 Tg/year; IPCC,1999) with fuel usage for the year 2000 (152 Tg/year; TRADEOFF value for fuel us-age by civil aviation; Gauss et al., 2006) gives a forcing of 2.7 mW/m2 (Table 6).15
The TRADEOFF best estimate of radiative forcing from linear contrails in 2000 is10 mW/m2, based on scaled values from MS2001 (6 mW/m2) and Marquart et al.(2003; 15 mW/m2). This puts our result below the lower end of radiative forcing es-timates so far. This is not surprising, given that the MS2001 estimate is for a contrailoptical depth of 0.3 rather than 0.1, and that the mean contrail optical depth in the20
Marquart et al. (2003) calculations is 0.15. Upscaling our τvis=0.3 forcing (5.0 mW/m2)for the year 2000 fuel usage gives a forcing of 6.8 mW/m2, which is close to the scaledMS2001 value and within the TRADEOFF range of estimates (Sausen et al., 2005).
Scaling with fuel usage in 2002 (156 Tg/year; Eyers et al., 2004) we obtain a forc-ing of 2.8 mW/m2 for τvis=0.1 and 7.0 mW/m2 for τvis=0.3. Contrail radiative forcing is25
small for current levels of air traffic. Sausen et al. (2005) give the radiative forcing dueto the various emissions from aircraft in 2000. Their best estimates show linear con-trails to have only the third largest radiative forcing (10 mW/m2) after aviation carbondioxide (25 mW/m2) and aircraft-induced ozone increases (19 mW/m2). However, air
9135
ACPD6, 9123–9149, 2006
Global contrailradiative forcing
N. Stuber and P. Forster
Title Page
Abstract Introduction
Conclusions References
Tables Figures
J I
J I
Back Close
Full Screen / Esc
Printer-friendly Version
Interactive Discussion
EGU
travel is a rapidly growing sector, and its large growth rates make contrails a potentiallyimportant factor in anthropogenic climate change. Besides that, the appropriate metricfor comparing different emissions is not radiative forcing but the global warming poten-tial GWP. Forster et al. (2006) showed that over a 100 year time horizon contrails areroughly equivalent to aviation’s carbon dioxide emissions.5
Taking into account the rather different approaches to the calculation of both contrailcover and contrail radiative forcing, our estimate of annual mean, global mean con-trail radiative forcing agrees reasonably well with other post-IPCC 1999 studies. Thissupports the conclusion by Sausen et al. (2005) that the IPCC estimate of radiativeforcing due to line-shaped contrails was considerably too high. Our best estimate of10
2.0 mW/m2 in 1992 suggest an overestimation of the radiative effect of linear, persistentcontrails by up to a factor of 10.
Acknowledgements. We wish to thank G. Radel and K. Shine for valuable input during thecourse of this study and many stimulating discussions. C. Eyers made the AERO2k data avail-able for us and A. Tompkins provided us with ECMWF analysis data. This study was funded by15
the UK Department for Transport.
References
Bakan, S., Betancor, M., Gayler, V., and Grassl, H.: Contrail frequency over Europe fromNOAA-satellite images, Ann. Geophys., 12, 962–968, 1994.
Carlin, B., Fu, Q., Lohmann, U., Comstock, J. M., Mace, G.G., and Sassen, K.: High cloud20
horizontal inhomogeneity and solar albedo bias, J. Climate, 15, 2321–2339, 2002.Charlock, T. P., Rutan, D., Smith, G. L., et al.: Clouds and the Earth’s Radiant Energy Sys-
tem (CERES) Algorithm Theoretical Basis Document, NASA Reference Publ. 1376, vol. IV.,1995.
Duda, D. P., Minnis, P., and Nguyen, L.: Estimates of cloud radiative forcing in contrail clusters25
using GOES imagery, J. Geophys. Res., 106, 4927–4937, 2001.Duda, D. P., Minnis, P., Nguyen, L., and Palikonda, R.: A case study of the development of
contrail clusters over the Great Lakes, J. Atmos. Sci., 61, 1132–1146, 2004.
9136
ACPD6, 9123–9149, 2006
Global contrailradiative forcing
N. Stuber and P. Forster
Title Page
Abstract Introduction
Conclusions References
Tables Figures
J I
J I
Back Close
Full Screen / Esc
Printer-friendly Version
Interactive Discussion
EGU
Edwards, J. M. and Slingo, A.: Studies with a flexible new radiation code. I: Choosing a config-uration for a large-scale model, Q. J. R. Meteorol. Soc., 122, 689–719, 1996.
Ellingson, R. G. and Fouquart, Y.: Intercomparison of radiation codes in climate models, ICR-CCM, WCRP-39, WMO/TD-371, 1990
Eyers, C. J., Norman, P., Middel, J., Plohr, M., Michot, S., Atkinson, K., and Christou, R. A.:5
AERO2k Global Aviation Emissions Inventories for 2002 and 2025 (available from QinetiQLtd, Cody Technology Park, Farnborough, Hampshire, GU14 0LX, UK), 2004.
Fichter, C., Marquart, S., Sausen, R., and Lee, D.S.,: The impact of cruise altitude on con-trails and related radiative forcing, Meteorol. Zeitschrift, 14, 563–572, doi:10.1127/0941-2948/2005/0048, 2005.10
Forster, P. M. de F., Shine, K. P., and Stuber, N.: It is premature to include non-CO2 effects of aviation in emission trading schemes, Atmos. Environ., 40, 1117–1121,doi:10.1016/j.atmosenv.2005.11.005, 2006.
Fu, Q.: An accurate parameterization of the solar radiative properties of cirrus clouds for climatemodels, J. Climate, 9, 2058–2082, 1996.15
Fu, Q. and Liou, K. N.: On the correlated k-distribution method for radiative transfer in nonho-mogeneous atmospheres, J. Atmos. Sci., 49, 2139–2156, 1992.
Fu, Q. and Liou, K. N.: Parameterization of the radiative properties of cirrus clouds, J. At-mos. Sci., 50, 2008–2025, 1993.
Fu, Q., Liou, K. N., Cribb, M. C., Charlock, T. P., and Grossman, A.: Multiple scattering param-20
eterization in thermal infrared radiative transfer, J. Atmos. Sci., 54, 2799–2812, 1997.Fu, Q., Yang, P., and Sun, W. B.: An accurate parameterization of the infrared radiative proper-
ties of cirrus clouds for climate models, J. Climate, 11, 2223–2237, 1998.Gauss, M., Isaksen, I. S. A., Lee, D. S., and Søvde, O. A.: Impact of aircraft NOx emissions
on the atmosphere – tradeoffs to reduce the impact, Atmos. Chem. Phys., 6, 1529–1548,25
2006.Gounou, A. and Hogan, R. J.: A sensitivity study of the effect of horizontal photon transport on
the radiative forcing on contrails, J. Atmos. Sci., in press, 2006.IPCC: Aviation and the Global Atmosphere – A Special Report of IPCC Working Groups I
and III, edited by: Penner, J. E., Lister, D. H., Griggs, D. J., et al., Cambridge Univ. Press,30
Cambridge, UK, 1999.Kley, D. et al.: SPARC Assessment of Upper Tropospheric and Stratospheric Water Vapour,
WCRP-113, WMO/TD-No. 1043 (SPARC, Verrieres le Buisson Cedex), 2000.
9137
ACPD6, 9123–9149, 2006
Global contrailradiative forcing
N. Stuber and P. Forster
Title Page
Abstract Introduction
Conclusions References
Tables Figures
J I
J I
Back Close
Full Screen / Esc
Printer-friendly Version
Interactive Discussion
EGU
Marquart, S., Ponater, M., Mager, F., and Sausen, R.: Future development of contrail cover,optical depth and radiative forcing: Impacts of increasing air traffic and climate change, J. Cli-mate, 16, 2890–2904, 2003.
Meerkotter, R., Schumann, U., Doelling, D. R., Minnis, P., Nakajima, T., and Tsushima, Y:Radiative forcing by contrails, Ann. Geophys., 17, 1080–1094, 1999.5
Minnis, P., Schumann, U., Doelling, D. R., Gierens, K. M., and Fahey, D. W.: Global distributionof contrail radiative forcing, Geophys. Res. Lett., 26, 1853–1856, 1999.
Myhre, G. and Stordal, F.: On the tradeoff of the solar and thermal infrared radiative impact ofcontrails, Geophys. Res. Lett., 28, 3119–3122, 2001.
Rossow, W.B., Garder, L., Lu, P.-J., and Walker, A.: International Satellite Cloud Climatology10
Project (ISCCP) Documentation of Cloud Data, WMO/TD 266, World Climate Research Pro-gramme, Geneva, 1988.
Sausen, R., Gierens, K., Ponater, M., and Schumann, U.: A diagnostic study of the globaldistribution of contrails part I: Present day climate, Theor. Appl. Climatol., 61, 127–141,1998.15
Sausen, R., Isaksen, I., Hauglustaine, D., Grewe, V., Lee, D.S., Myhre, G., Khler, M.O., Pitari,G., Schumann, U., Stordal, F., Zerefos, C.: Aviation radiative forcing in 2000: An update onIPCC (1999), Meteorol. Zeitschrift, 14, 555–561. doi:10.1127/0941-2948/2005/0049, 2005.
Schmitt, A. and Brunner, B.: Emissions from aviation and their development over time, DLR-Mitt. 97-04, Deutsches Zentrum fur Luft- und Raumfahrt e.V., Koln, Germany, 37–52, 1997.20
Strauss, B., Meerkoetter, R., Wissinger, B., Wendling, P., and Hess, M.: On the regional climaticimpact of contrails: microphysical and radiative properties of contrails and natural cirrusclouds, Ann. Geophys., 15, 1457–1467, 1997.
Stuber, N., Forster, P., Radel, G., and Shine, K.: The importance of the diurnal and annual cycleof air traffic for contrail radiative forcing, Nature, 441, 864–867. doi:10.1038/nature04877,25
2006.
9138
ACPD6, 9123–9149, 2006
Global contrailradiative forcing
N. Stuber and P. Forster
Title Page
Abstract Introduction
Conclusions References
Tables Figures
J I
J I
Back Close
Full Screen / Esc
Printer-friendly Version
Interactive Discussion
EGU
Table 1. Top: Radiative forcing [W/m2] at the top of the atmosphere due to a 100% contrailcover (τvis=0.52) in a continental mid-latitude summer atmosphere. (Bottom): Annual mean,global mean radiative forcings [W/m2] at the top of the atmosphere due to a 1% homogeneouscontrail cover (τvis=0.3) for all-sky and clear sky conditions.
longwave shortwave net
Meerkotter et al. (1999) 51.5 –22.0 29.5Myhre and Stordal (2001) 45.6 –25.2 20.4this study 44.2 –20.3 23.9
MS2001 this studyall-sky clear sky all-sky clear sky
longwave 0.21 0.27 0.19 0.25shortwave –0.09 –0.15 -0.06 -0.12net 0.12 0.12 0.13 0.13
9139
ACPD6, 9123–9149, 2006
Global contrailradiative forcing
N. Stuber and P. Forster
Title Page
Abstract Introduction
Conclusions References
Tables Figures
J I
J I
Back Close
Full Screen / Esc
Printer-friendly Version
Interactive Discussion
EGU
Table 2. Global mean percentages of flights in the four 6-h AERO2k time periods and duringnight and daytime. Note that all times are local times.
0:00–6:00 06:00–12:00 12:00–18:00 18:00–24:00
14.6% 31.1% 33.1% 21.2%
night day
36.6% 63.4%
9140
ACPD6, 9123–9149, 2006
Global contrailradiative forcing
N. Stuber and P. Forster
Title Page
Abstract Introduction
Conclusions References
Tables Figures
J I
J I
Back Close
Full Screen / Esc
Printer-friendly Version
Interactive Discussion
EGU
Table 3. Global, annual mean longwave (lw), shortwave (sw), and net radiative forcing for all-sky (top) and clear sky (bottom) conditions in mW/m2 for the four six-hour time periods (localtime), as well as diurnal, night time and daytime means.
all-sky0:00–6:00 6:00–12:00 12:00–18:00 18:00–24:00 mean night day
lw 1.89 4.18 4.46 2.84 3.34 2.35 4.30sw -0.05 –2.39 –2.72 -0.25 –1.35 0.00 –2.69net 1.84 1.79 1.74 2.58 1.99 2.35 1.61
clear sky0:00–6:00 6:00-12:00 12:00–18:00 18:00–24:00 mean night day
lw 2.55 5.68 6.05 3.86 4.54 3.22 5.85sw –0.10 –4.25 –4.73 –0.48 –2.39 0.00 –4.85net 2.45 1.43 1.32 3.38 2.14 3.22 1.00
9141

ACPD6, 9123–9149, 2006
Global contrailradiative forcing
N. Stuber and P. Forster
Title Page
Abstract Introduction
Conclusions References
Tables Figures
J I
J I
Back Close
Full Screen / Esc
Printer-friendly Version
Interactive Discussion
EGU
Table 4. Global, annual and diurnal mean longwave, shortwave, and net radiative forcings inmW/m2, for both all-sky and clear sky conditions with or without diurnal variations of air traffic.
all-skywith diurnal cycle w/o diurnal cycle
lw 3.34 3.52sw –1.35 –1.11net 1.99 2.41
clear skywith diurnal cycle w/o diurnal cycle
lw 4.54 4.78sw –2.39 –1.99net 2.14 2.79
9142
ACPD6, 9123–9149, 2006
Global contrailradiative forcing
N. Stuber and P. Forster
Title Page
Abstract Introduction
Conclusions References
Tables Figures
J I
J I
Back Close
Full Screen / Esc
Printer-friendly Version
Interactive Discussion
EGU
Table 5. Comparison of contrail radiative forcing RF (in mW/m2) calculated in this study with re-sults from earlier studies. “Scaled” indicates values that have been linearly scaled with contrailcover (in %). For the two studies with a variable optical depth, the mean value of τ is given.
study contrail cover τ diurnal cycle RFair traffic
this study 0.04 fixed, 0.1 yes 2.0this study 0.04 fixed, 0.3 yes 5.0MS2001 0.09 fixed, 0.3 yes 9.0this study, scaled 0.09 fixed, 0.3 yes 11.3this study 0.04 fixed, 0.1 no 2.4Marquart et al. (2003) 0.06 variable, 0.15 no 3.5this study, scaled 0.06 fixed, 0.1 no 3.6Fichter et al. (2005) 0.047 variable, 0.15 no 3.2this study, scaled 0.047 fixed, 0.1 no 2.8
9143
ACPD6, 9123–9149, 2006
Global contrailradiative forcing
N. Stuber and P. Forster
Title Page
Abstract Introduction
Conclusions References
Tables Figures
J I
J I
Back Close
Full Screen / Esc
Printer-friendly Version
Interactive Discussion
EGU
Table 6. Contrail radiative forcing in mW/m2 for different time horizons, obtained by a linearscaling with fuel usage. Fuel usage in 1992, 2000, and 2002 was 112, 152, and 156 Tg/year,respectively. The TRADEOFF best estimate of 10 mW/m2 for 2000 is based on scaled valuesfrom studies by MS2001 and Marquart et al. (2003), which are cited in this table.
study year τ RF
this study 1992 fixed, 0.1 2.0MS2001 (scaled) 2000 fixed, 0.3 6Marquart et al. (2003) (scaled) 2000 variable, 0.15 15this study, scaled 2000 fixed, 0.1 2.7this study, scaled 2000 fixed, 0.3 6.8this study, scaled 2002 fixed, 0.1 2.8this study, scaled 2002 fixed, 0.3 7.0
9144

ACPD6, 9123–9149, 2006
Global contrailradiative forcing
N. Stuber and P. Forster
Title Page
Abstract Introduction
Conclusions References
Tables Figures
J I
J I
Back Close
Full Screen / Esc
Printer-friendly Version
Interactive Discussion
EGU
0.0
0.5
1.0
1.5
2.0
2.5
3.0
DecNovOctSepAugJulJunMayAprMarFebJan0.00
0.01
0.02
0.03
0.04
0.05
0.06
0.07
0.08
Tot
al d
ista
nce
trav
elle
d [1
09 km]
Con
trai
l cov
er [%
]Month
global air trafficNH air traffic
contrail cover
Fig. 1. Annual cycle of global and Northern Hemispheric air traffic (distance travelled in 109 km),and global mean, monthly mean contrail coverage (in %).
9145
ACPD6, 9123–9149, 2006
Global contrailradiative forcing
N. Stuber and P. Forster
Title Page
Abstract Introduction
Conclusions References
Tables Figures
J I
J I
Back Close
Full Screen / Esc
Printer-friendly Version
Interactive Discussion
EGU
Fig. 2. Annual mean, diurnal mean contrail cover, in percent. Note the logarithmic scale.
9146
ACPD6, 9123–9149, 2006
Global contrailradiative forcing
N. Stuber and P. Forster
Title Page
Abstract Introduction
Conclusions References
Tables Figures
J I
J I
Back Close
Full Screen / Esc
Printer-friendly Version
Interactive Discussion
EGU
Fig. 3. Percentage of flights during local night time. Values higher than 50% are indicated bysolidly filled boxes.
9147
ACPD6, 9123–9149, 2006
Global contrailradiative forcing
N. Stuber and P. Forster
Title Page
Abstract Introduction
Conclusions References
Tables Figures
J I
J I
Back Close
Full Screen / Esc
Printer-friendly Version
Interactive Discussion
EGU
Fig. 4. Annual, diurnal mean net radiative forcing in mW/m2, for all-sky conditions. Note thelogarithmic scale.
9148
ACPD6, 9123–9149, 2006
Global contrailradiative forcing
N. Stuber and P. Forster
Title Page
Abstract Introduction
Conclusions References
Tables Figures
J I
J I
Back Close
Full Screen / Esc
Printer-friendly Version
Interactive Discussion
EGU
Fig. 5. Percentage contribution of flights during local night time to the annual mean diurnalmean contrail radiative forcing. Contributions less than 50% are indicated by striped boxes,contributions higher than 50% by solidly filled boxes.
9149