Embed Size (px)
Citation preview
Multidecadal trends in aerosol radiative forcingover the Arctic: Contribution of changesin anthropogenic aerosol to Arcticwarming since 1980Thomas J. Breider1, Loretta J. Mickley1 , Daniel J. Jacob1, Cui Ge2,3, Jun Wang2,3 ,Melissa Payer Sulprizio1 , Betty Croft4, David A. Ridley5 , Joseph R. McConnell6 ,Sangeeta Sharma7, Liaquat Husain8, Vincent A. Dutkiewicz8, Konstantinos Eleftheriadis9 ,Henrik Skov10 , and Phillip K. Hopke11
1John A. Paulson School of Engineering and Applied Sciences, Harvard University, Cambridge, Massachusetts, USA, 2Centerfor Global and Regional Environmental Research, University of Iowa, Iowa City, Iowa, USA, 3Department of Chemical andBiochemical Engineering, University of Iowa, Iowa City, Iowa, USA, 4Department of Physics and Atmospheric Science,Dalhousie University, Halifax, Nova Scotia, Canada, 5Department of Civil and Environmental Engineering, MassachusettsInstitute of Technology, Cambridge, Massachusetts, USA, 6Desert Research Institute, Reno, Nevada, USA, 7AtmosphericScience and Technology Directorate, Climate Research Division, Environment and Climate Change Canada, Toronto,Ontario, Canada, 8Atmospheric Sciences Research Center, State University of New York at Albany, Albany, New York, USA,9Environmental Radioactivity Laboratory, INRaSTES, NCSR Demokritos, Athens, Greece, 10Arctic Research Center,Department of Environmental Science, Aarhus University, Roskilde, Denmark, 11Center for Air Resources Engineering andScience, Clarkson University, Potsdam, New York, USA
Abstract Arctic observations show large decreases in the concentrations of sulfate and black carbon (BC)aerosols since the early 1980s. These near-term climate-forcing pollutants perturb the radiative balance of theatmosphere and may have played an important role in recent Arctic warming. We use the GEOS-Chem globalchemical transport model to construct a 3-D representation of Arctic aerosols that is generally consistent withobservations and their trends from 1980 to 2010. Observations at Arctic surface sites show significantdecreases in sulfate and BC mass concentrations of 2–3% per year. We find that anthropogenic aerosols yielda negative forcing over the Arctic, with an average 2005–2010 Arctic shortwave radiative forcing (RF) of�0.19 ± 0.05Wm�2 at the top of atmosphere (TOA). Anthropogenic sulfate in our study yields more stronglynegative forcings over the Arctic troposphere in spring (�1.17 ± 0.10Wm�2) than previously reported. From1980 to 2010, TOA negative RF by Arctic aerosol declined, from �0.67± 0.06Wm�2 to �0.19 ± 0.05Wm�2,yielding a net TOA RF of +0.48 ± 0.06Wm�2. The net positive RF is due almost entirely to decreases inanthropogenic sulfate loading over the Arctic. We estimate that 1980–2010 trends in aerosol-radiationinteractions over the Arctic and Northern Hemisphere midlatitudes have contributed a net warming atthe Arctic surface of +0.27 ± 0.04 K, roughly one quarter of the observed warming. Our study does notconsider BC emissions from gas flaring nor the regional climate response to aerosol-cloud interactions or BCdeposition on snow.
1. Introduction
Arctic surface temperatures have increased by ~1.2°C since 1980, while annual average Arctic sea ice cover-age has declined by 3.6% per decade [Trenberth et al., 2007; NSIDC, 2015]. The factors driving the observedchanges in Arctic surface temperatures and sea ice extent are uncertain. Recent studies suggest that account-ing for changes in near-term (NT) climate-forcing agents (aerosol, ozone, andmethane) might improve globalclimate model simulations of Arctic warming and sea ice loss [Mickley et al., 2004; Shindell, 2007; Quinn et al.,2008; Yang et al., 2014]. Emissions of primary aerosol and aerosol precursors have decreased in recentdecades in Europe, Russia, and North America due to air quality concerns, and in situ observations in theArctic show large declines in concentrations of sulfate and black carbon (BC) aerosol since 1980, consistentwith these emission trends [Gong et al., 2010; Hirdman et al., 2010]. In this study we use the GEOS-Chemchemical transport model together with a detailed inventory of historical anthropogenic emissions to quan-tify decadal changes in Arctic radiative forcing (RF) from trends in aerosols species from 1980 to 2010.
BREIDER ET AL. THE 1980–2010 TRENDS IN ARCTIC AEROSOL RF 3573
PUBLICATIONSJournal of Geophysical Research: Atmospheres
RESEARCH ARTICLE10.1002/2016JD025321
Special Section:The Arctic: An AGU JointSpecial Collection
Key Points:• Observed sulfate and BC massconcentrations at Arctic surfacesites and Greenland ice cores showdecreases of 2–3%/yr between 1980and 2010
• Anthropogenic aerosol RF is negativein the Arctic troposphere due to alarge negative RF from sulfate inspring (�1.17 ± 0.10 W m
�2)
• The 1980–2010 trends inaerosol-radiation interactions overthe Arctic and NH midlatitudescontributed 0.27 ± 0.04 K warmingat Arctic surface
Correspondence to:T. J. Breider,[email protected]
Citation:Breider, T. J., et al. (2017), Multidecadaltrends in aerosol radiative forcingover the Arctic: Contribution of changesin anthropogenic aerosol to Arcticwarming since 1980, J. Geophys. Res.Atmos., 122, 3573–3594, doi:10.1002/2016JD025321.
Received 4 MAY 2016Accepted 9 FEB 2017Accepted article online 15 FEB 2017Published online 16 MAR 2017
©2017. American Geophysical Union.All Rights Reserved.

Aerosols perturb the radiative balance of the atmosphere through scattering and absorption of solar radia-tion, reduction of snow albedo, and alteration of cloud properties [Twomey, 1974; Clarke and Noone, 1985;Charlson et al., 1992]. The radiative impact of Arctic aerosols is modulated by the large seasonal amplitudein available radiation, which peaks in summer [Quinn et al., 2008], and in cloud coverage, which peaks in sum-mer to fall [Shupe et al., 2011]. Aerosol abundance at remote Arctic stations also shows a distinct seasonalcycle, with a maximum in late winter and early spring known as “Arctic Haze” and a minimum in summer[Mitchell, 1956; Heidam et al., 2004; Quinn et al., 2007]. Aircraft measurements reveal that the aerosol seasonalcycle extends into the Arctic middle to upper troposphere [Fisher et al., 2011;Wang et al., 2011; Di Pierro et al.,2013; Ancellet et al., 2014]. The spring peak in aerosol loading arises from efficient pollution transport alongisentropic surfaces from the midlatitudes to the Arctic at this time of year [Rahn and McCaffrey, 1979; Radkeet al., 1984; Shaw, 1995; Stohl, 2006].
Observations of sulfate and BC at remote Arctic stations have shown rapid decreases of 1–3% yr�1 since the1980s [Sharma et al., 2004, 2013; Eleftheriadis et al., 2009; Quinn et al., 2009; Hirdman et al., 2010]. Consistentwith these trends, ice cores in Greenland and Svalbard Island indicate that sulfate deposition peaked in the1970s, followed by decline [Goto-Azuma and Koerner, 2001; Isaksson et al., 2001; McConnell et al., 2007]. AtBarrow, Alaska, observed background aerosol optical depth (AOD) decreased from 1977 to 2002 butincreased slightly between 2002 and 2010 [Tomasi et al., 2012]. Many studies have attributed the observeddecreases in sulfate and BC in the Arctic to reductions in anthropogenic emissions of primary aerosol andaerosol precursors in Russia and West Eurasia [Sirois and Barrie, 1999; Heidam et al., 2004; Gong et al., 2010;Hirdman et al., 2010; Sharma et al., 2013]. Tomasi et al. [2012] attributed the recent increase in backgroundAOD at Barrow to emissions increases in developing countries at lower latitudes. Stone et al. [2014] foundan increase of 0.01 per decade in observed background AOD (500 nm) at Barrow, Ny-Alesund, and Alert overthe period 2001 to 2012.
Previous studies have used model simulations to investigate how anthropogenic aerosols affect Arcticclimate through aerosol effects on radiation, clouds, and surface albedo.Quinn et al. [2008] found that anthro-pogenic aerosol warms the Arctic atmosphere and cools the surface in all seasons, with the largest forcingcontribution from BC. Samset et al. [2014] estimated the RF from atmospheric BC in the Arctic (70°N–90°N)to be 0.38 ± 0.30Wm�2. Previous estimates for the RF from BC in the Arctic atmosphere (60°N–90°N) rangefrom 0.12 to 0.63Wm�2 [Koch and Hansen, 2005; Flanner et al., 2009; AMAP, 2011; Bond et al., 2011; Wanget al., 2014a]. Estimates of Arctic RF due to BC deposition to snow and ice range from 0.03 to 0.28Wm�2
[Flanner et al., 2009; Koch et al., 2009; AMAP, 2011; Zhou et al., 2012; Jiao et al., 2014]. The Arctic Monitoringand Assessment Programme [AMAP, 2015] report, in particular, provided a comprehensive overview of BCRF in the Arctic. The report estimated an average multimodel BC Arctic RF of 0.64Wm�2.
Several studies have attempted to quantify the contribution of changes in aerosol to Arctic warming in recentdecades. Shindell and Faluvegi [2009] found that changes in aerosols from 1976 to 2007 contributed1.09 ± 0.81°C to the observed Arctic surface temperature increase of 1.48 ± 0.28°C, while Koch et al. [2011]found that reductions in BC in the Arctic since 1980 led to cooling at the Arctic surface. In contrast, Yanget al. [2014] found no significant response in average Arctic surface temperatures to the 1975–2005 trendsin sulfate and BC. Yang et al. [2014] did find large regional trends, including a warming in the EuropeanArctic of 0.6 K decade�1 and a cooling of 0.6 K decade�1 in the Siberian Arctic.
In this paper we use GEOS-Chem to simulate multidecadal trends in distributions of aerosol concentrationsin the Arctic. Our aim is first to achieve a satisfactory representation of observed trends in NT climate for-cers over decadal timescales in the Arctic and then to quantify the climatic effects of these forcers. Ourwork builds on the knowledge gained in previous GEOS-Chem studies that focused on the interpretationof measurements during the International Polar Year of 2008 [Fisher et al., 2011; Wang et al., 2011; Breideret al., 2014].
2. Model Description
We use the GEOS-Chem chemical transport model version v9-01-03 (http://geos-chem.org) driven by6-hourly assimilated Modern Era Retrospective Reanalysis (MERRA) meteorology from the NASA GlobalModeling and Analysis Office. The original MERRA data are at 0.5° × 0.67° horizontal resolution but are
Journal of Geophysical Research: Atmospheres 10.1002/2016JD025321
BREIDER ET AL. THE 1980–2010 TRENDS IN ARCTIC AEROSOL RF 3574

regridded here to 4° × 5° to enable multidecadal simulations. There are 47 vertical layers extending upto 0.01 hPa.
The GEOS-Chem aerosol simulation includes BC, primary organic carbon (OC), sulfate-nitrate-ammonium,dust, and sea salt and is described in detail by Breider et al. [2014].
For primary aerosol, 80% of BC and 50% of OC are emitted in hydrophobic form [Cooke et al., 1999]. Ane-folding time of 1.15 days is assumed for the aging of hydrophobic to hydrophilic aerosol. Oxidation ofSO2 to sulfate aerosol takes place via OH in the gas phase and in the aqueous phase by O3 and H2O2 at tem-peratures above 258 K [Alexander et al., 2009]. Aerosol dry deposition is described in Fisher et al. [2011], andthe wet deposition scheme is described in Liu et al. [2001]. We include updates to aerosol scavenging in con-vective updrafts and in cold clouds, as described in Wang et al. [2014a, 2014b]. The aerosol simulation iscoupled to oxidant chemistry through heterogeneous processes, aerosol effects on photolysis rates, forma-tion of secondary aerosol, and inorganic nitrate partitioning. The scheme for dust mobilization accountsfor subgrid variability in wind speeds [Ridley et al., 2013]. The sea salt aerosol simulation is described byJaeglé et al. [2011], and aerosol optical properties are from Drury et al. [2010]. We use the linearized ozoneclimatological parameterization for stratospheric ozone [McLinden et al., 2000].
In their GEOS-Chem analysis of Arctic aerosols, Breider et al. [2014] reported an overestimate of Arctic sulfatemass concentrations at the surface in summer. Croft et al. [2016] also identified an overestimate of summer-time Arctic surface layer accumulation-mode aerosol number concentrations in a version of GEOS-Chemwithaerosol microphysics, and these authors pointed to problems in model assumptions of cloud liquid-watercontent (LWC) in precipitating low-level clouds. The standard GEOS-Chem specifies LWC in such clouds ata globally constant 1.5 × 10�6 g m�3; spatially and temporally variable fields of LWC have not yet been testedin the model. Observations in summer over the Arctic, however, suggest that LWC in low-level clouds is anorder of magnitude lower than the global specified value [Shupe et al., 2001]. In our study, we therefore reducethe June–September cloud LWC in GEOS-Chem to a uniform 1 × 10�7 gm�3 north of 65°N from the surface upto 300m above the boundary layer, the region of the atmosphere characterized by low-level precipitatingclouds in summer. In this manner we effectively increase the aerosol scavenging efficiency in the Arctic anddecrease the sulfate concentrations at the Arctic surface in summer by a factor of 2. Amore detailed discussionof the sensitivity of cloud scavenging to these model updates is provided by Croft et al. [2016].
We use the Fu-Liou radiative transfer model (RTM) to estimate all-sky aerosol RF due to aerosol-radiationinteractions over the Arctic [Wang et al., 2008, 2013]. The radiative transfer calculation is performed offlineusing monthly averaged aerosol fields and meteorology from GEOS-Chem. A monthly varying surface reflec-tance data climatology from the period June 1995 to December 2000 is applied to the RTM [Koelemeijer et al.,2003]. The aerosols do not affect cloud properties. The forcing calculation is conducted every 6 h, consistentwith input cloud properties. The RTM includes a treatment of cloud fraction overlap, ice crystal effective size,and single scattering properties, and the effect of hygroscopic growth on sulfate particle size and refractiveindex [Liou et al., 2008; Gu et al., 2011]. Our calculation provides an estimate of radiative forcing due toaerosol-radiation interactions only (i.e., the direct effect). We do not consider radiative forcing due toaerosol-clouds interactions. We define radiative forcing as the difference in net upwelling radiation betweenthe full aerosol simulation (anthropogenic + natural aerosols) and a simulation with natural aerosols only,often termed the radiative forcing of the aerosol-radiation interactions (ARI) [Myhre et al., 2013]. We reportthe 95th percentile confidence intervals for all forcings.
2.1. Historical Emissions
Anthropogenic emissions of primary aerosols (OC and BC) and trace gases—including NOx, CO, NH3, and spe-ciated nonmethane hydrocarbons—are taken from the Monitoring Atmospheric Composition and Climate(MACCcity) inventory for 1980 to 2010 [Granier et al., 2011]. MACCcity emissions are based on a simple linearscaling of decadal emissions in the ACCMIP inventory, whose sectors are described in detail in Lamarque et al.[2010]. For most species, the simple linear scaling adequately describes the observed trends. Our preliminarysimulations showed that the MACCcity SO2 emissions fail to reproduce the steep decline in sulfate concen-trations in 1988 observed at Kevo and Ny-Ålesund (Zeppelin), and we therefore update the SO2 emissionsinventory following Smith et al. [2011]. Compared to MACCcity, Smith et al. [2011] provides an improved tem-poral representation of the emissions drop due to the economic contraction in Eastern Europe after 1988.While retaining the seasonal and spatial information from MACCcity, we apply annual scaling factors to the
Journal of Geophysical Research: Atmospheres 10.1002/2016JD025321
BREIDER ET AL. THE 1980–2010 TRENDS IN ARCTIC AEROSOL RF 3575

total anthropogenic SO2 emissionsacross all sectors from every countryso that they match the annualnational totals from Smith et al.[2011]. After 2005, the last year inthe Smith et al. [2011] inventory, wescale the MACCcity emissions by themean 2000–2005 ratio of these twoinventories for each country.
Emissions estimates of anthropo-genic BC vary by a factor of 2 in thepresent day [Bond et al., 2007; Cohenand Wang, 2014], and emissionsuncertainties are even larger in pre-vious decades owing to scant infor-mation on fuel use and technologiesused. We update the MACCcity BCemissions following Cohen andWang [2014]. Again, we retain theseasonal and spatial informationfrom MACCcity but scale the annualemissions in the nine regions speci-fied in Cohen and Wang [2014].Scale factors are calculated as themean 2002–2006 ratio of annualemissions in the two inventories, theperiod analyzed by Cohen and Wang[2014], and we assume that these fac-tors do not change over time. OC isoften coemitted with BC; however,no scaling is applied to anthropo-
genic OC emissions since our study focuses only on aerosol species with long-term observational recordsin the Arctic (BC and sulfate). To our knowledge there are no long-term observations of OC in the Arctic thatwould provide a constraint for an estimate of the multidecadal forcing from OC.
Recent work has shown that gas flaring is an important source of BC in the high Arctic [Stohl et al., 2013;Eckhardt et al., 2015], but given the large uncertainties in this source, we do not include it in our analysis.BC emissions in our study are 126 Gg north of 60°N and 15 Gg north of 66 oN, less than those in Stohl et al.[2013], who estimated emissions of 156 Gg and 39 Gg, respectively, with gas flaring emissions included.Our study thus may underestimate BC emissions by 20% north of 60°N and by a factor of 2.6 north of66°N. The gas flaring source of BC in Russia, however, shows strong temporal variability. Huang and Fu[2016] diagnosed a 50% increase in this BC source between 1997 and 2005, followed by a subsequent declineof 40% between 2005 and 2012. BC emissions in Russia in 2010 in our study are 890 Gg, over a factor of 3higher than the 224 Gg estimated in Huang et al. [2015]. The large difference in BC emission estimatesbetween Huang et al. [2015] and Cohen and Wang [2014] is due to different methodologies (bottom-up ver-sus inverse modeling) and reflects the uncertainties from sparse observations and scant information on thetechnological emission factors for different BC source estimates.
Figure 1 shows the 1980–2010 time series of SO2 and BC anthropogenic emissions used in this work, aggre-gated over key regions. We collectively refer to the former Soviet states (excluding Russia) and eastern bloccountries (excluding East Germany) as FSS + EBLOC. Total global emissions of anthropogenic SO2 decrease by35 Tg SO2 (�20%) between 1980 and 2010. The largest decreases in SO2 emissions during this time take placein Europe (80%) and North America (70%). In FSS + EBLOC and Russia, emissions are almost constant between1980 and 1988, and subsequently decrease by 50% between 1988 and 2010. Over China, anthropogenic SO2
emissions increase by a factor of 3 between 1980 and 2006, followed by a decline.
Figure 1. Time series of total anthropogenic emissions of (top) SO2 and(bottom) black carbon (BC), classified by region or country. The plot appor-tions emissions from the former Soviet Union and the Eastern Bloc countriesinto two categories: (1) Russia and (2) all other former Soviet states (FSS)and eastern bloc countries (excluding East Germany), which we collectivelyrefer to as FSS + EBLOC.
Journal of Geophysical Research: Atmospheres 10.1002/2016JD025321
BREIDER ET AL. THE 1980–2010 TRENDS IN ARCTIC AEROSOL RF 3576

Global anthropogenic BC emissions in our study increase linearly from 14 Tg C in 1980 to a peak of 17.5 Tg Cin 2005 before leveling off. Regionally, BC emissions showmuch smaller temporal trends than SO2 emissions.BC emissions over Europe and North America decrease by 20% between 1980 and 2010. The smaller decreasein BC emissions relative to sulfate is in part due to increasing numbers of diesel cars and trucks which havehigher particulate emissions than gasoline engines [Bond et al., 2007]. BC emissions in Russia and FSS + EBLOCdecrease by 60% between 1980 and 2010, while BC emissions in China increase by a factor of 2. Historicalemissions of SO2 and BC are uncertain in Russia and FSS + EBLOC due to large uncertainties in technologyemission factors and few long-term measurements to constrain emissions. In FSS + EBLOC and Russia, thedecline in SO2 emissions is reflected by long-term observations of particulate sulfate in these regions.Sharma et al. [2004] analyzed Alert BC and back-trajectory data and found that most of the observed decreasein BC at Alert between 1989 and 2002 can be explained by decreases in emissions in the former USSR.
SO2 emissions from erupting and nonerupting volcanoes are from the AeroCom inventory [Diehl, 2009].Oceanic emissions of dimethylsulfide (DMS) are calculated using the DMS seawater climatology from Lanaet al. [2011] and the sea air gas transfer parameterization from Liss and Merlivat [1986].
Constructing a continuous biomass burning inventory for 1980–2010 is challenging. We use biomass burningemissions from Duncan et al. [2003] for 1980–1996 and the Global Fire Emissions Database version 3 (GFED3)inventory for 1997–2010 [van der Werf et al., 2006]. In most regions, the seasonality of the Duncan et al. [2003]inventory is based on area burned data or on retrievals of Aerosol Index from the Total Ozone MappingSpectrometer. Elsewhere, we apply the 1997–2010 average seasonality from GFED3 to the Duncan et al.[2003] inventory. To speciate biomass burning emissions prior to 1997, we use emission factors fromAndreae and Merlet [2001]. GFED3 misses most small fires [Randerson et al., 2012], so we scale these emissionswith the mean seasonality measured by the Global Fire Assimilation System [Kaiser et al., 2012]. Average1997–2010 global fire BC emissions in our inventory are 13% higher than during 1980–1996. A previousinventory also estimated higher fire emissions in the 1990s compared to previous decades [Schultz et al.,2008]. It is unclear whether this increase reflects the uncertainty inherent in our inventory or whether it arisesfrom an actual increase in recent fire activity at northern latitudes [Westerling et al., 2006].
3. Observed and Modeled Trends of Arctic Aerosols
We focus our study on changes in sulfate and BC aerosol because long-term observational records are avail-able for these species and both are considered to be important drivers of Arctic climate forcing [Quinn et al.,
Table 1. Global and Arctic Budgets of Total and Anthropogenic Aerosols in GEOS-Chema
SpeciesLoad
(mgm�2)AtmosphericLifetime (days)
Total Wet and DryDeposition (Tg species yr�1)
Fraction WetDeposition (%)
Fraction DryDeposition (%)
Global TotalBC 0.37 0.47 4.47 4.47 15.5 20.1 74 77 26 23OC 1.02 1.09 4.36 4.36 43.8 48.5 80 82 20 18Sulfate 2.99 2.53 4.15 3.66 134 129 84 85 16 15
Global AnthropogenicBC 0.33 0.40 4.42 4.29 14.0 17.5 76 74 24 26OC 0.26 0.29 4.32 4.23 11.1 12.8 75 76 25 24Sulfate 1.71 1.49 2.84 2.62 112 106 87 88 13 12
Arctic TotalBC 0.45 0.34 7.48 7.55 0.75 0.56 78 84 22 16OC 0.72 1.20 5.45 5.00 1.65 3.00 81 87 19 13Sulfate 5.26 3.04 6.85 7.18 9.60 5.28 87 88 13 12
Arctic AnthropogenicBC 0.43 0.28 7.67 8.31 0.70 0.43 78 83 22 17OC 0.34 0.24 8.21 8.54 0.52 0.36 77 80 23 20Sulfate 3.57 2.06 5.15 5.55 8.66 4.65 88 90 12 10
aShown are the 1980 (bold) and 2006 annual mean aerosol burdens, atmospheric lifetimes, deposition rates, and frac-tions of deposition by wet and dry processes, integrated over the troposphere between the surface and 200 hPa. BC andOC values are given in grams carbon. Arctic values are provided for latitudes greater than 60°N.
Journal of Geophysical Research: Atmospheres 10.1002/2016JD025321
BREIDER ET AL. THE 1980–2010 TRENDS IN ARCTIC AEROSOL RF 3577

2008]. We use arithmetic meansthroughout our analysis and definethe Arctic as the region north of60°N. To quantify long-term trendsin the data, we use the Mann-Kendall Sens Slope estimator ofthe arithmetic seasonal mass meanconcentrations as in Hirdman et al.[2010] and Gong et al. [2010].We report only those trendssignificant at the 95% confidencelevel. The annual percentage trendis calculated as the overall trenddivided by the average of the firstfive data points in the time series.
3.1. Global and ArcticAerosol Budgets
Table 1 summarizes the globaland Arctic aerosol budgets in oursimulations for 1980 and 2006. In2006, the annual mean global load-ing of anthropogenic sulfate is1.49mgm�2, down 13% from 1980.The annual mean anthropogenic BCglobal load is 0.40mgm�2 in 2006, afactor of 3 higher than the averagein the Aerosol Comparison betweenObservations and Models (AeroCom)project phase II simulations [Myhreet al., 2013]. The higher anthropo-genic BC load in our study is due toour use of the Cohen and Wang[2014] inventory, with BC emissionsmore than twice those in AeroCom.Using the updated scavengingscheme in convective updrafts
[Wang et al., 2014b], we find a global lifetime of atmospheric BC of 4.4 days. Our estimate is at the lowerend of AeroCom phase II models, which report a global BC lifetime of 3.9–11.9 days [Jiao et al., 2014]. Theshort lifetime of BC in our study is explained by relatively more efficient wet scavenging processes and isdiscussed inWang et al. [2011, 2014b]. Over the Arctic (i.e., north of 60°N), the total sulfate load in our simula-tions decreases by 42% from 1980 to 2006, even as global SO2 emissions decrease just 3%. The large decreasein the annual mean Arctic sulfate load can be traced to the shift of pollution sources from the high northernlatitudes to lower latitudes, from which transport to the Arctic is much less efficient [Stohl, 2006]. Themodeled annual mean Arctic BC load also decreases by 24% from 1980 to 2010, consistent with declininganthropogenic emissions in the northern midlatitudes.
Figure 2 shows the seasonality of the simulated Arctic load of total BC and sulfate, averaged over the periodbetween 2001 and 2010. The modeled aerosol load is enhanced in spring compared to summer by a factor of2 for sulfate and by 50% for BC. The figure also presents the simulated annual mean Arctic load of anthropo-genic sulfate and BC at three different altitudes, averaged over two time periods, 1980–1989 and 2001–2010.By the 2000s, the annual mean anthropogenic sulfate load decreases by 50% at the surface, 39% in the mid-dle troposphere (700–500 hPa), and 20% in the upper troposphere (500–200 hPa), with the largest changes inspring. The anthropogenic annual mean BC load decreases by 50% at the surface but changes little aloft. The
Figure 2. (top) Seasonal cycle in the simulated load of sulfate (black) and BC(brown) in the Arctic (>60°N), averaged over the period 2001–2010 in unitsof mgm�2. Vertical bars show 1 standard deviation of the interannual mean.The other two panels compare the simulated mean Arctic loads of (middle)anthropogenic sulfate and (bottom) BC for 1980–1989 versus 2001–2010.Loads are binned by altitude, and the black horizontal bars show 1 standarddeviation of the interannual mean in each bin.
Journal of Geophysical Research: Atmospheres 10.1002/2016JD025321
BREIDER ET AL. THE 1980–2010 TRENDS IN ARCTIC AEROSOL RF 3578

largest changes in the Arctic BC load occur in winter. This change in the Arctic surface BC load is consistentwith the 50% decrease in emissions north of 60°N; however, it is not clear which specific emission sectors aredriving the decrease in BC emissions.
3.2. Trends in Sulfate Over Source Regions
We next assess the model capability to reproduce observed trends in sulfate over two key source regions,North America and Europe (Figure 3). Over North America we focus our analysis on the eastern part ofthe U.S. (<90°W), as that region is most relevant for transport of pollution to sites in southern Greenland.Over Europe, the observed 1980–2010 trends in sulfate in surface air (�2.8% yr�1) and in precipitation(�3% yr�1) are consistent with Tørseth et al. [2012]. Over Canada non-sea salt (nss) sulfate deposition showsa decreasing trend of�2% yr�1 from 1984 to 2010, while sites in the eastern United States show decreases insulfate in surface air of�2.9% yr�1 from 1992 to 2010. The observed decreases in sulfate in Europe and North
Figure 3. Trends in annual mean sulfate concentrations in surface air and in precipitation at sites in Europe and North America. Observations in all panels are shownas black circles, with black bars denoting the standard deviation of the annual means. Stacked contours represent the anthropogenic (blue) and natural (green)contributions to the modeled values. (top left) Trend in total sulfate in surface air, averaged over the 14 EMEP sites with at least 25 years of data between 1980 and2010. (top right) Trend in total sulfate at the 10 IMPROVE stations on the U.S. East Coast (<90°W) with at least 14 years of data between 1992 and 2010. (bottomleft) Trend in nss sulfate in precipitation at the 19 EMEP stations with at least 24 years of data between 1980 and 2010. (bottom right) Trend in nss sulfate inprecipitation at the 14 CAPMON stations in Canada with at least 20 years of data between 1984 and 2010.
Table 2. Observed Trends in Sulfate in Surface Air and in Precipitation in Source Regionsa
SulfateEurope surface
(EMEPb) 1980–2010Eastern US surface
(IMPROVEc) 1992–2010Canada Precip.
(CAPMONd) 1985–2010Europe Precip.
(EMEPb) 1980–2010
Annual �131.8 (�2.8%) �213.8 (�3.0%) �155.3 (�3.1%) �169.8 (�3.4%) �284 (�2.0%) �296 (�2.4%) �821 (�3.0%) �469 (�3.1%)
aValues are absolute trends with units of ng m�3 yr�1 for surface sulfate. Deposition trends in precipitation g ha�1 yr�1 for sulfate. Percentage trends areshown in parentheses (% change yr�1). Observed values are shown in bold.
bEuropean Monitoring and Evaluation Programme.cInteragency Monitoring of Protected Visual Environments.dCanadian Air and Precipitation Network.
Journal of Geophysical Research: Atmospheres 10.1002/2016JD025321
BREIDER ET AL. THE 1980–2010 TRENDS IN ARCTIC AEROSOL RF 3579

America reflect the influence of airquality regulations. Table 2 sum-marizes the observed and modeledannual trends in sulfate in surface airand in precipitation in Europe andNorth America. The simulated per-centage trends in sulfate and BC areroughly consistent with the observedtrends. In Europe, the overestimate insurface sulfate and the underesti-mate in nss sulfate in precipitationindicate that the aerosol scavengingis too weak in the region.
3.3. Trends in Arctic AerosolOptical Depth
Long-term measurements of AODhelp to constrain trends in lightextinction by aerosols through theatmosphere column. At Resolute
Bay, Canada, observed AOD (λ =700 nm) from the 1970s to the present day decreased about �25 to�30% averaged over April, May, and June (AMJ), yielding a 1975–2010 linear decrease of �0.8% yr�1 duringthese months (Figure 4). Present-day (1997–2010) AOD observations averaged over the eight Arctic sites inthe Aerosol Robotic Network (AERONET) reveal the expected springtime maximum, consistent withenhanced transport to the region at this time of year (Figure 5). The annual cycle in Arctic AOD is mainlydriven by seasonal changes in the transport and chemical formation of sulfate aerosol. Anthropogenic sulfate
contributes over 80% of the totalanthropogenic AOD in April andMay [Breider et al., 2014]. The largeOC component in summer is due toemissions from boreal fires that peakin July and August. Sampled at theseeight sites, the model successfullycaptures the spring peak andSeptember minimum but underesti-mates AOD by 18% in summer. Thesummertime bias is largely due tothe failure of the model to capturehigher Arctic AOD values overCanada at that time of year.
3.4. Observed and ModeledTrends in Sulfate and BC at RemoteArctic Surface Stations
Table 3 summarizes the observedseasonal and annual trends in sulfateand BC for the Arctic surface sitesand ice cores analyzed in our study.The sites included in our study withlong-term observations are Alert(62.5°W, 82.5°N), Barrow (156.6°W,71.3°N), Ny-Alesund (11.9°E, 78.9°N),Kevo (27.0°E, 69.5°N), and VillumResearch Station, Station Nord (VRS)(16.4°W, 81.4°N).
Figure 4. Mean seasonality of AOD at 700 nm at Resolute Bay, Canada (75°N,95°W) for 1970–1979 (black) and 2004–2014 (red). Vertical bars show 1 stan-dard deviation of the mean. Only those monthly averages with at least threedata points are shown. Observations for 1970–1979 are from McGuffie andCogley [1985]. Observations for 2004 to 2014 are fromAERONET Version 2 data.
Figure 5. Seasonal variation of AOD, averaged over 1997–2010 at eightAERONET stations in the Arctic. The stations used in the figure are Andenes[16.0°E, 69.2°N], Barrow [156.6°W, 71.3°N], Hornsund [15.6°E, 77.0°N],Kangerlussuaq [50.6°W, 70°N], OPAL [85.9°W, 79.9°N], PEARL [86.4°W, 80.0°N],Resolute Bay [94.9°W, 74.7°N], and Thule [68.7°W, 76.5°N]. Black circlesdenote observed monthly mean AOD, and vertical bars show 1 standarddeviation of the means. To remove the influence of large volcanic eruptionsin September 2008 and 2009, we exclude these months in the Septembermean. Monthlymeans in the plot also do not include outliers, here defined asthose months when AOD is greater than 2.7σ from the mean. This filteringremoves 14% of the 234 available observations. Stacked contours representthe contributions from different aerosol types to modeled AOD at 500 nm.White dashed line shows the modeled AOD contribution from naturalsources. The model AOD is sampled at 550 nm. The observed AOD at 440 nmis corrected for 550 nm using the Angstrom exponent and assuming alinear fit [Seinfeld and Pandis, 2006].
Journal of Geophysical Research: Atmospheres 10.1002/2016JD025321
BREIDER ET AL. THE 1980–2010 TRENDS IN ARCTIC AEROSOL RF 3580

Sulfate measurements were made analyzing filter samples using ion-chromatography. The nss sulfate wasdetermined from Na+ concentrations and the mass ratio of sulfate to sodium in seawater of 0.252. Long-termobservations of BC have large uncertainties due to changes in instruments over time and interference fromother absorbing species such as dust and organic carbon. In this work we use observations of equivalent BC,determined from filter-based absorption measurements using a particle soot absorption photometer or anaethalometer. Absorption measurements are converted to BC mass using an assumed mass absorptioncoefficient (MAC). MAC values, while well known for freshly emitted BC, are less understood for aged BCand can vary temporally and spatially, thus adding uncertainty [Sharma et al., 2004; Eleftheriadis et al.,2009]. In our study, we use instrument-specific MAC values as discussed in Stone et al., [2014]. Given thelarge temporal variability in the MAC, estimated BC mass concentrations may have an uncertainty of upto a factor of 2. As a result, the estimated trends in BC mass at Barrow, Alert, and Ny-Alesund arehighly uncertain.
Figure 6 shows the observed mean spring (March–May) and summer (June–August) mass concentrations ofsulfate aerosol during 1980–2010 at five Arctic sites [Quinn et al., 2007; Gong et al., 2010; Laing et al., 2013;Nguyen et al., 2013]. All stations show higher sulfate concentrations in spring than summer due to more effi-cient meridional transport, increased surface stratification, and lower rates of removal by precipitation at thattime of year [Stohl, 2006]. The highest nss sulfate concentrations occur in spring at Kevo in the 1980s, withvalues about double the concentrations at other Arctic sites, reflecting its closer proximity to pollutionsources in western Eurasia than other sites. Between 1980 and 2010, observed sulfate mass in springdecreases by 2–3% yr�1 at all sites with the exception of VRS, where observations began only in 1991.Taken together, these trends are consistent with observed trends in sulfate over source regions (Figure 3),
Table 3. Observed Trends in Sulfate and Black Carbon at Arctic Sites (North of 60°N), and in Greenland Ice Coresa
SulfateBarrow, Alaska1998–2007
Alert, Canada1981–2010
Kevo, Finland1980–2010
Ny-Alesund, Svalbard1990–2009
Winter ns ns �38.2 (�3.0%) �28.3 (�2.4%) �46.8 (�2.5%) �46.3 (�2.0%) �22.7 (�2.7%) �34.5 (�2.5%)Spring ns �17.7 (�1.5%) �48.3 (�3.1%) �34.8 (�2.7%) �84.0 (�2.6%) �91.0 (�3.0%) ns �32.1 (�2.2%)Summer +26.8 (+27.9%) ns ns �1.0 (�1.1%) �29.5 (�2.1%) �40.2 (�3.8%) ns �9.5 (�3.1%)Fall ns �12.1 (�2.8%) �9.5 (�2.9%) �10.5 (�2.3%) �33.9 (�2.5%) �44.9 (�3.0%) �8.2 (�2.4%) �16.8 (�2.7%)Annual ns �10.2 (�1.6%) �24.2 (�2.9%) �17.0 (�2.3%) �45.0 (�2.2%) �57.0 (�2.9%) �10.7 (�1.7%) �24.2 (�2.6%)
ICb GreenlandSouthc 1980–2010
ICb GreenlandCentrald 1980–2003
ICb GreenlandNorthe 1980–2010
ICb Ackademii Nauk,Russia 1980–1998
Annual �9.5 (�2.2%) �15.0 (�1.5%) �11.2 (�2.8%) �7.8 (�1.3%) �5.3 (�2.0%) �9.2 (�2.4%) ns ns
Black carbonBarrow, Alaska1989–2010
Alert, Canada1989–2010
Kevo, Finland1980–2010
Winter n/a �4.7 (�3.1%) �4.7 (�2.9%) �6.7 (�3.3%) �8.0 (�2.9%) �8.3 (�1.8%)Spring �1.3 (�2.1%) �1.5 (�1.9%) �2.5 (�2.1%) �2.0 (�2.2%) �5.3 (�2.1%) �7.1 (�2.6%)Summer ns ns ns �0.1 (�2.8%) �2.1 (�2.0%) �0.5 (�1.4%)Fall ns �0.8 (�2.7%) ns ns �4.2 (�2.5%) �2.6 (�1.7%)Annual �0.9 (�1.9%) �1.4 (�2.0%) �1.6 (�2.1%) �2.4 (�2.9%) �4.5 (�2.2%) �4.7 (�2.1%)
ICb GreenlandSouthc 1980–2010
ICb GreenlandCentrald 1980–2003
ICb GreenlandNorthe 1980–2010
ICb Ackademii Nauk,Russia 1980–1998
Annual �0.29 (�2.7%) ns ns +0.43 (+2.6%) �0.07 (�1.6%) ns ns ns
aValues are absolute trends with units of ng m�3 yr�1 for surface sulfate and ng C m�3 yr�1 for surface BC. Deposition trends in ice cores (IC) are given as gha�1 yr�1 for sulfate and g C ha�1 yr�1 for BC. Percentage trends are shown in brackets (% change yr�1). Observed values are shown in bold. Trends that are notsignificant (p = 0.05) are shown as ns.
bIce core observations.cGreenland South includes the ice core stations at Act2 (66.0°N, 45.2°W) and ACT11d (66.5°N, 46.3°W).dGreenland Central includes the ice core station D4 (71.4°N, 43.9°W).eGreenland North includes the ice core stations at Humboldt (78.5°N, 56.8°W), NEEM20m (77.5°N, 51.1°W), Tunu2013 (78.0°N, 34.0°W), and Summit2010
(72.6°N, 38.3°W).fShown are the 1980 (bold) and 2006 annual mean aerosol burdens, atmospheric lifetimes, deposition rates, and fractions of deposition by wet and dry
processes, integrated over the troposphere between the surface and 200 hPa. BC and OC values are given in grams carbon. Arctic values are provided for latitudesgreater than 60°N.
Journal of Geophysical Research: Atmospheres 10.1002/2016JD025321
BREIDER ET AL. THE 1980–2010 TRENDS IN ARCTIC AEROSOL RF 3581

indicating the influence of more stringent restrictions on air quality. In summer, the more remote Arctic sites(Alert, VRS, and Barrow) show no significant trend in observed surface sulfate mass, which suggests that thesesites are not influenced by anthropogenic sources at this time of year.
Observed mean sulfate mass concentrations at Arctic surface sites are overestimated in GEOS-Chem by 4% inspring, while summer mean sulfate is underestimated by 26%. At Barrow the observations are filtered toremove pollution from local sources. We do not remove local pollution sources in our comparison, and this
Figure 6. Observed nss sulfate surface concentrations at five Arctic sites in spring (March–May) and summer (June–August). Seasonal means are denoted by solid black circles, medians as short horizontal bars, and the 25th to 75thpercentile ranges as vertical bars. The observations shown by the solid black circles are provided by the following sources;Alert (Canadian National Atmospheric Chemistry (NAtChem) Database and Analysis System); Villum Research Station,Station Nord, and Ny-Alesund-Zeppelin (European Monitoring and Evaluation Programme (EMEP)); Barrow (NOAA PMEL);and Kevo [Laing et al., 2013]). Black triangles early in the record at Barrow are from Rahn and McCaffrey [1980] and Liand Winchester [1989]. Black triangles at Ny-Ålesund for the period 1979–1981 showmean observations from Heintzenbergand Larssen [1983]. Black diamond at Ny-Alesund in summer shows median nss sulfate concentration fromMaenhaut et al.[1989]. Open circles in the spring panel for Ny-Ålesund are mean March–April values [Sirois and Barrie, 1999]. Stackedcontours represent the anthropogenic (blue) and natural (green) contributions to the modeled concentrations. Note thatthe y axis range differs among panels.
Journal of Geophysical Research: Atmospheres 10.1002/2016JD025321
BREIDER ET AL. THE 1980–2010 TRENDS IN ARCTIC AEROSOL RF 3582
may explain the model overestimate of annual mean sulfate and sulfate trends at that site. Theunderestimate at Ny-Alesund may be due to an underestimate in DMS emissions in the North Atlantic.GEOS-Chem reproduces the observed annual mean trends in nss sulfate to within 30% at Kevo and Alert.The large increasing trend in sulfate in summer at Barrow has been reported by Quinn et al. [2009]. Asimilar trend in MSA (not shown) suggests that the observed trend in sulfate has a biogenic source originand may be in response to climate changes in the Arctic, including sea ice melt and increasing sea surfacetemperatures. The failure of GEOS-Chem to capture the observed trend may be due to local influencesfrom anthropogenic sources in Barrow, the use of a fixed DMS seawater climatology, or inadequaterepresentation of local sea ice coverage.
At all sites except Kevo, natural sources of sulfate from oceanic emissions of dimethylsulfide (DMS) and vol-canoes contribute 28% of the total nss sulfate mass in spring and over 60% in summer during 2001–2010. Thenatural source contribution at Kevo is smaller, 18% in spring and 40% in summer. Observations of SO2, themajor precursor to sulfate aerosol are reproduced to within 35% at VRS in all seasons except the fall, whenthe simulation overestimates the observations by 77%.
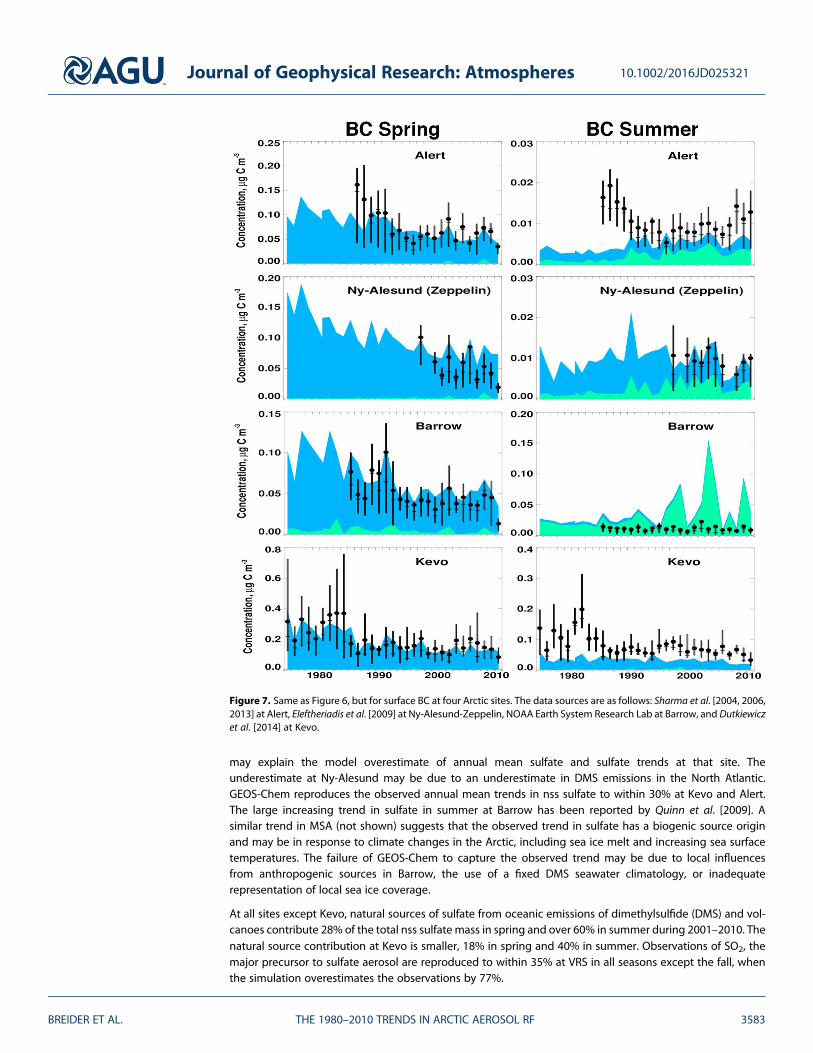
Figure 7. Same as Figure 6, but for surface BC at four Arctic sites. The data sources are as follows: Sharma et al. [2004, 2006,2013] at Alert, Eleftheriadis et al. [2009] at Ny-Alesund-Zeppelin, NOAA Earth System Research Lab at Barrow, and Dutkiewiczet al. [2014] at Kevo.
Journal of Geophysical Research: Atmospheres 10.1002/2016JD025321
BREIDER ET AL. THE 1980–2010 TRENDS IN ARCTIC AEROSOL RF 3583

Tustervatn (65.5°N, 13.5°E) also has long-term (1980–2010) records of both surface sulfate and sulfate inprecipitation. As at Kevo, GEOS-Chem captures trends in annual surface sulfate concentrations and sulfatein precipitation at Tustervatn within 30–35%. In Europe, the overestimate in surface sulfate and the
Figure 8. Trends in annual mean sulfate and BC concentrations in surface air and in precipitation, as well as in annual meanand April–May–June (AMJ) AOD. Circles indicate observed trends at a range of sites over different time periods: smallwhite circles denote trends at sites with greater than 25 years of observations; large white circles show average long-termtrends across multiple sites in Europe and North America; yellow circle, 1976–2002; and red circles 1990–2009. At Ifaross,Iceland, we remove the influence of volcanic sulfate as described in Figure 5. Observed AOD at Resolute Bay, Canada,indicates the mean April–May–June value. GEOS-Chem results are shown as background contours. White indicates regionswhere the 1980–2010 trend is statistically insignificant or is less than 0.5% yr�1.
Journal of Geophysical Research: Atmospheres 10.1002/2016JD025321
BREIDER ET AL. THE 1980–2010 TRENDS IN ARCTIC AEROSOL RF 3584

underestimate in nss sulfate in precipitation indicate that the aerosol scavenging is too weak in the regionand imply excessive transport of sulfate to the Arctic.
Figure 7 shows the observed mean spring and summer mass concentrations of BC during 1980–2010 at fourArctic sites [Sharma et al., 2004, 2013; Eleftheriadis et al., 2009; Dutkiewicz et al., 2014]. As with sulfate, BC con-centrations are higher in spring than summer, when anthropogenic BC from northern midlatitudes is effi-ciently transported to the Arctic. The observed BC concentrations during spring at the three sites withlong-term records (>20 years) show a decreasing trend of between �1.9% yr�1 and �2.2% yr�1, consistentwith the estimated decline in anthropogenic BC emissions in Russia and FSS + EBLOC (�2.1% yr�1). In sum-mer, observed trends in BC are weaker or not significant. BC concentrations at Kevo are a factor of 2 higher inspring and a factor of 5 higher in summer relative to other Arctic sites, reflecting the close proximity of thissite to pollution sources in western Eurasia. The large drop in BC after 1988 at Kevo has been attributed tothe economic contraction in FSS + EBLOC countries at that time [Dutkiewicz et al., 2014]. At Kevo, observedtrends are underestimated in all seasons except spring, while at Alert, simulated absolute trends are overes-timated by 42% in winter (Table 3). Simulated summertime BC at Barrow shows large interannual variabilitydue to the effect of fire activity, an effect not seen in the observations. This mismatch may be explained bythe filtering of observations at Barrow, which removes data points when the hourly average wind direction isbetween 131 and 359°, or due to inaccurate representation of boreal fire emissions between the boundarylayer and free troposphere. The updates to the BC emissions and the Arctic summer scavenging processesreduce the disparities between the model and observations. The normalized mean bias improves from�45%to +13% and the R2 value from 0.37 to 0.57.
Ice core records in the Arctic provide a valuable constraint on historical trends in sulfate and BC deposition[Goto-Azuma and Koerner, 2001;McConnell et al., 2007]. In Figure 8 we compile the observed long-term trendsin sulfate and BC in Greenland ice cores and compare these with the observed trends at Arctic surface sitesand monitoring stations in Europe and North America. Long-term observations show decreases in annualmean sulfate at all sites of between 2 and 3% yr�1. The largest observed surface air trends are found overEurope (�3.0% yr�1), and these are consistent with trends in the remote Arctic at Alert (�2.9% yr�1).Trends in ice core sulfate in southern Greenland are similar to those observed in surface air in AcadiaNational Park, USA, and in Ifaross, Iceland, ~2% yr�1. Arctic BC observations show decreasing trends of1.7–2.8% yr�1 at all locations, with the exception of the ice core at D4 in central Greenland, where there isno significant trend.
Consistent with these observations, GEOS-Chem shows 1980–2010 decreases of 2–3% yr�1 in both surfaceconcentrations and deposition fluxes of sulfate and BC over much of the high northern latitudes and theArctic (Figure 8). The strongest trends occur over Europe, FSS + EBLOC, and Russia. Simulated concentrationsof both sulfate and BC increase by ~1% yr�1 over the Pacific due to increasing anthropogenic emissions inEast Asia. Simulated AOD also decreases over much of the Arctic, especially in spring, but at much slowerrates than the observations, which decrease at about 1% yr�1. GEOS-Chem shows a decrease in AMJ AODat Resolute Bay of �0.6% yr�1 for 1980–2010, slightly less than the observed trend of �0.8% yr�1
(Figure 5). The model yields no significant trend in BC concentrations over Canada or Alaska, where increas-ing emissions from boreal fire activity appear to cancel out the effect of decreasing anthropogenic emis-sions. The lack of a trend in modeled BC over boreal North America stands in contrast to observations ofBC in the wider Arctic, which shows decreases over the last three decades. Insufficient knowledge of trendsin boreal wildfires in North America may explain the lack of significant trend in the simulated BC depositionin the south of Greenland, where observations show that BC deposition decreased at a rate of 2.7% yr�1
between 1980 and 2010. At the high altitudes on top of the Greenland ice sheet, additional uncertaintymay arise due to the larger influence of more distant sources at lower latitudes than is typically observedat the Arctic surface stations. Given the many uncertainties in deposition fluxes and the challenge inherentin comparing point measurements with model grid cell averages, our view is that the match between ourmodel and measurements is reasonable.
3.5. Observed Aircraft Observations
Aircraft observations have provided sporadic measurements of trace species in the Arctic since the early1980s. Figure 9 compiles observations of sulfate aerosol over Arctic Canada and Alaska from the Arctic
Journal of Geophysical Research: Atmospheres 10.1002/2016JD025321
BREIDER ET AL. THE 1980–2010 TRENDS IN ARCTIC AEROSOL RF 3585

Boundary Layer Expedition [Talbotet al., 1992], the Arctic Haze cam-paign (1995), the TroposphericOzone Production about the SpringEquinox experiment [Scheuer et al.,2003] and the Arctic Research of theComposition of the Tropospherefrom Aircraft and Satellites campaign[Jacob et al., 2010]. We compareGEOS-Chem with ARCTAS observa-tions by sampling the model alongthe aircraft flight track. Comparisonwith earlier campaigns is not possiblesince some campaigns collected justone or two filter samples per flight.
Below 2 km across all time periods,springtime sulfate concentrationsare 20% higher over Alaska than overArctic Canada, and GEOS-Chem attri-butes two thirds of this enhancementto a larger influence from naturalsources in Alaska. In June–July, air-craft observations of sulfate in thelower troposphere show similarvalues over Alaska in 1988 andArctic Canada in 2008, in agreementwith surface observations at Alertand VRS.
Model median BC concentrationsduring ARCTAS are within a factor of2–3 of observed values. In spring,model median BC concentrationssampled along the aircraft flighttracks north of 70°N are 97 ngm�3
below 3 km and 75 ngm�3 above3 km. In summer, model median BCconcentrations during ARCTAS flightsare 21 ngm�3 below 3 km, and14 ngm�3 above 3 km, within a fac-tor of 2 of the observed values.
Simulated sulfate concentrations in spring 2008 are captured to within 15% of the observations at all alti-tudes, while surface sulfate in summer 2008 is overestimated by a factor of 2. Given that column concentra-tions are more closely associated with RF than surface concentrations, the overestimate in the aircraft BCobservations in spring and summer indicates that the BC RF may be overestimated.
3.6. Reconciling Observed Trends in Surface and Column Aerosol
Observed sulfate concentrations in surface air in spring show decreases of 2–3% yr�1 throughout the Arcticfrom 1980 to 2010, while AOD decreases by only about 0.5% yr�1 (Figure 4). To understand the difference inthe observed surface and column trends, we use GEOS-Chem to calculate the contributions of regionalchanges in anthropogenic emissions to the total change in AOD as a function of altitude for the1980–2010 time frame for the Arctic as a whole. For each layer of AOD, we aggregate the changes intotwo regional categories: (1) regions where SO2 emissions have decreased since 1980 (West Eurasia, Russia,and North America) and (2) all other regions including China, where SO2 emissions have increased since 1980.
Figure 9. Aircraft profile observations of sulfate in the Arctic in spring andsummer. Sulfate observations are shown for ARCTAS in 2008 [Fisher et al.,2011], TOPSE in 2000 [Scheuer et al., 2003], Arctic Haze in 1995 [Jaeschke et al.,1999], and ABLE-3A in 1988 [Talbot et al., 1992]. ARCTAS-A sampled in April,and so only TOPSE April flights are used in the comparison. For ARCTAS andTOPSE, we remove outliers that are more than 1.5 interquartile ranges belowthe first quartile or above the third quartile in each altitude bin. The filteringremoves 6% of the 2656 available observations. The box-whisper plotsshow the minimum, 25th percentile, median, 75th percentile, and maximumvalues for ARCTAS and TOPSE. The Arctic Haze campaign provides data col-lected during only three flights from Deadhorse, Alaska, in April [Jaeschkeet al., 1999]. For the Arctic Haze and ABLE-3A campaigns, we show only themean and ±1 standard deviation.
Journal of Geophysical Research: Atmospheres 10.1002/2016JD025321
BREIDER ET AL. THE 1980–2010 TRENDS IN ARCTIC AEROSOL RF 3586

We find that the 1980–2010 modeleddecrease in total AOD in the Arctic isdriven by a combination of stronglydecreasing aerosol load at low alti-tudes and increasing aerosol load athigh altitudes (Figure 10). Over the30 year period, emissions changes inWest Eurasia, Russia, and NorthAmerica yield a ~30% decrease inAOD specific to these regions in thelower troposphere, with less pro-nounced decreases aloft. In contrast,emissions changes in China and else-where yield ~20% increases inregion-specific AOD in the upper tro-posphere, with little effect in the mid-dle to lower troposphere. Thealtitude dependence of these trendsreflect the transport pathways ofaerosol from source regions, withthe dominant influence from thenorthern high latitudes at the surfaceand from lower latitudes aloft [Stohl,2006; Fisher et al., 2010]. The netAOD change in each layer of the tro-posphere reflects the competitionbetween these two trends, with~25% decreases in the lower tropo-sphere and ~15% increases in theupper troposphere. The absolutechange in total AOD is stronglyweighted toward changes in thelower troposphere (Figure 10).
Figure 10. Simulated 1980–2010 changes in annual mean layer AOD as a function of altitude, averaged over the Arctic(>60°N). The panels show (left) percent change and (right) absolute change in AOD resulting only from trends inanthropogenic aerosol. The AOD layers correspond to model layers and range in thickness from 125m at the surface to1000m in the upper troposphere. Dark blue curves indicate AOD changes due to sources in West Eurasia, Russia, and NorthAmerica, and red curves denote changes due to sources in China and elsewhere. Light blue curves represent the netchange of AOD in each layer, and the light blue triangle is the simulated percent change in total Arctic AOD.
Figure 11. Seasonal and annual mean top-of-atmosphere radiative forcings(TOA RFs) due to aerosol, averaged over the Arctic. (top) RFs due toanthropogenic aerosol calculated by this study for 2005–2010 (black) andas reported by Quinn et al. [2008] for 2003 (red). (bottom) The sulfate andBC contributions to the RFs in Figure 11 (top) as calculated by this studyand by Quinn et al. [2008]. Error bars represent ±1 standard deviation ofthe mean.
Journal of Geophysical Research: Atmospheres 10.1002/2016JD025321
BREIDER ET AL. THE 1980–2010 TRENDS IN ARCTIC AEROSOL RF 3587

4. Arctic Aerosol RadiativeForcing Between 1980and 2010
Applying GEOS-Chem aerosols tothe Fu-Liou radiative transfer code,we can estimate for the aerosol RFfrom aerosol-radiation interactionsin the Arctic. We do not considerRF due to BC deposition to snowand ice or due to aerosol-cloudinteractions. Our results show thatanthropogenic aerosol cools theArctic troposphere (net negativeRF from aerosol). Average 2005–2010 top-of-atmosphere (TOA) RFis �0.19 ± 0.05Wm�2 (Figure 11),reflecting the balance betweennegative RF from sulfate(�0.60 ± 0.02Wm�2) and positiveRF from BC (+0.44 ± 0.04Wm�2).Average TOA forcing fromanthropogenic OC is small,�0.03 ± 0.003Wm�2 and is consis-tent with results in Myhre et al.[2013]. The TOA RF due to OCreflects the small Arctic anthropo-genic OC load, which is almost anorder of magnitude less than sul-fate (Table 1). Surface RF fromatmospheric anthropogenic aero-sol averaged over the Arctic during
2005–2010 is �1.20 ± 0.05Wm�2, due to roughly equivalent negative RF from sulfate and BC. Our resultsstand in contrast to Quinn et al. [2008], who found that the interaction of radiation with present-day, anthro-pogenic aerosol warms the Arctic by 0.92 ± 0.04Wm�2 in spring. The difference between these two resultscan be traced to the smaller sulfate forcing in Quinn et al. [2008], leading to the dominance of BC in total RF.In the model used by Quinn et al. [2008], the springtime sulfate burden is enhanced by 40% compared tosummer (K. Tsigaridis, personal communication, 2015), while we find a doubling of sulfate at that time ofyear (Figure 2). The higher Arctic sulfate burden in spring in our work is explained by the lower aerosolscavenging efficiency in cold clouds (T< 258 K) in GEOS-Chem as described in Wang et al. [2011]. ARCTASaircraft observations in 2008 indicate a factor of 2 enhancement in the Arctic sulfate burden in spring com-pared to summer. The measurements over Arctic Canada in spring are consistently enhanced by greaterthan a factor of 2 compared to summer throughout the 25th, 50th, and 75th percentile ranges.
To assess the contribution of aerosol trends to recent Arctic climate change, we examine the net 1980–2010 RF due to anthropogenic aerosol, calculated as the difference between the mean 2005–2010 for-cings and mean 1980–1985 forcings. At TOA, we calculate a change in annual mean, net positiveArctic aerosol RF of +0.48 ± 0.06Wm�2 over this time period (Figure 12), reflecting the trend from strongnegative aerosol RF (�0.67 ± 0.06Wm�2) in the 1980s to more moderate negative aerosol RF in the pre-sent day (�0.19 ± 0.05Wm�2). The 1980–2010 decline in anthropogenic sulfate contributes a net TOA RF of+0.51 ± 0.05Wm�2, while the net TOA RF due to changes in anthropogenic BC is small (�0.04 ± 0.04Wm�2).At the surface, the net 1980–2010 Arctic RF from anthropogenic aerosol is even larger, +0.70 ± 0.05Wm�2.Previous studies have suggested that Arctic climate may respond not just to local forcings but also toremote TOA forcing [Shindell, 2007]. For the 1980–2010 period over midlatitudes (28–60°N), we estimate anet TOA forcing +0.31 ± 0.04Wm�2 due to anthropogenic sulfate and, +0.14 ± 0.03Wm�2 due to
Figure 12. Comparison of the seasonal and annual mean TOA RFs due toanthropogenic aerosol during 1980–1985 and 2005–2010, averaged overthe Arctic. (bottom) The net RFs due to the trends in sulfate and BCanthropogenic aerosol, calculated as the difference between the mean2005–2010 and 1980–1985 forcings. Error bars represent ±1 standarddeviation of the mean.
Journal of Geophysical Research: Atmospheres 10.1002/2016JD025321
BREIDER ET AL. THE 1980–2010 TRENDS IN ARCTIC AEROSOL RF 3588

anthropogenic BC. The net Arctic TOA RF from anthropogenic OC is +0.01 ± 0.003Wm�2 and reflects thesmall change in anthropogenic OC over the period 1980–2010 (Table 1).
A rough assessment of the contribution of aerosol trends to the observed Arctic warming since 1980 requiresknowledge of the climate sensitivity (λ) in the Arctic to both local and remote TOA forcings. Climate sensitiv-ity provides a measure of the response in surface temperatures (°K) to a given change in TOA RF (Wm�2).Here we follow Shindell and Faluvegi [2009], who used a global model to derive climate sensitivities in theArctic due to aerosol-radiation interactions for different aerosol species. For local forcings, Shindell andFaluvegi [2009] estimated sensitivities of +0.36 K (Wm�2)�1 for sulfate and �0.08 K (Wm�2)�1 for BC. Formidlatitude (28–60°N) forcings, they estimated sensitivities of +0.20 K (Wm�2)�1 for sulfate and +0.15 K(Wm�2)�1 for BC. These sensitivities include aerosol-cloud interactions.
We apply the Shindell and Faluvegi [2009] sensitivities to the values reported here for Arctic and midlatitudeTOA RF from anthropogenic sulfate and BC. These sensitivities are applied uniformly through the column, andwe do not consider any changes in the climate sensitivity with altitude as suggested by Flanner [2013]. Weestimate that between 1980 and 2010, trends in anthropogenic aerosols contribute +0.27 ± 0.04 K warmingto average Arctic surface temperatures, or approximately 25% of the observed Arctic warming during thistime period. Changes in Arctic RF contribute +0.19 ± 0.03 K of this warming, while changes in midlatitudeRF provide +0.08 ± 0.02 K additional warming. The temperature response due to changes in sulfate is+0.18 ± 0.02 K for Arctic sulfate and +0.06 ± 0.01 K midlatitude sulfate. For BC, changes in the midlatitudesprovide an Arctic temperature response of +0.02 ± 0.01 K, while changes in BC in the Arctic contribute awarming of +0.01 K.
4.1. Increased BC RF Efficiency in the Arctic Between 1980 and 2010
Annual BC TOA RF in the Arctic showed no significant change between the early 1980s and late2000s (�0.04 ± 0.04Wm�2), while the annual Arctic anthropogenic BC load declined by 33%, from0.42 ± 0.02mgm�2 to 0.28 ± 0.04mgm�2 over the same period. The larger relative decrease in annual BCload compared to the TOA RF from BC indicates that the BC forcing efficiency increased over this period.We find that Arctic BC forcing efficiency increased from 1.07 ± 0.05Wm�2 (mgm�2)�1 in the early 1980sto 1.57 ± 0.09Wm�2 (mgm�2)�1 in the late 2000s.
This increase in Arctic BC forcing efficiency is explained by the shifting influence of regional sources. High-latitude sources, particularly those within the polar dome, are efficiently transported to the Arctic surfacein winter and early spring, while lower-latitude sources in Asia influence the Arctic free troposphere in middleto late spring [Stohl, 2006]. Declining BC emissions at high latitudes have contributed to a lower BC load at theArctic surface in winter when incident solar radiation is small, while growing BC emissions in East Asia havecontributed to a higher BC load in middle to late spring when there is ample incident solar radiation. Thisredistribution of BC in the Arctic from winter to spring and from lower to higher altitudes explains the largerBC forcing efficiency per unit mass in the present day compared to 1980.
In Arctic spring, we estimate that the redistribution of BC from lower altitudes in the 1980s to higher altitudestoday has increased the BC forcing efficiency by approximately 20%. Our results are consistent with Samsetand Myhre [2015] who showed that Arctic BC RF efficiency increases strongly with altitude. We find no changein the sulfate Arctic TOA RF efficiency. Formation of sulfate aerosol from high-latitude sources is inefficient inwinter, due to limited availability of oxidants [Gong et al., 2010].
5. Discussion and Conclusions
We have used the chemical transport model GEOS-Chem to construct a 3-D representation of Arctic aerosolsthat is consistent with observed distributions and 1980–2010 aerosol trends. Our goal was to quantify thepotential contribution of trends in anthropogenic aerosols to the rapid Arctic warming (>1 K) observed overthis time frame. We focused only on the climate response to aerosol-radiation interactions and used theFu-Liou radiative transfer model together with published estimates of the sensitivity of surface temperaturesto regional aerosol radiative forcings [Shindell and Faluvegi, 2009].
We find that most Arctic surface and ice core observations show decreases in sulfate and BC concentrationsof 2–3% yr�1, consistent with estimated emissions reductions in Eurasia and North America. Observed
Journal of Geophysical Research: Atmospheres 10.1002/2016JD025321
BREIDER ET AL. THE 1980–2010 TRENDS IN ARCTIC AEROSOL RF 3589

springtime (April to June) Arctic AOD at Resolute Bay, Canada, decreases over 1975–2010, but the trend isrelatively weak (�0.8% yr�1). The weakness of this trend can be traced to the competing influences ofdecreasing aerosol load in the lower troposphere, driven by emissions trends at high northern latitudes,and increasing aerosol in the middle to upper troposphere, driven by trends in China and other developingcountries at lower latitudes.
Our results show that anthropogenic aerosol yields a negative forcing over the Arctic, with a TOA RF of�0.19 ± 0.05Wm�2 in the present day (2005–2010) and even greater forcing (�0.67 ± 0.06 Wm�2) in theearly 1980s. We find that the 1980–2010 emission reductions in anthropogenic aerosols in the developedworld may have contributed +0.27 ± 0.04 K warming to present-day Arctic temperatures at the surface orapproximately 25% of the observed Arctic warming. About two thirds of the warming can be attributedto forcing from anthropogenic aerosols over the Arctic, with the rest from forcing over midlatitudes.
Our results differ from those of Quinn et al. [2008] and the multimodel average in the AMAP [2015] report,in which both reported a net positive forcing due to aerosol-radiation interactions in the present day. TheQuinn et al. [2008] model, however, yields a relatively small enhancement of sulfate load in spring comparedto summer, in contradiction with the strong seasonality inferred from aircraft and AOD observations. Ourestimate of ARI RF from Arctic BC of +0.44 ± 0.04Wm�2 is within the multimodel range in AMAP [2015] of0.30–0.66Wm�2. The present-day Arctic ARI RF from sulfate (�0.60 ± 0.02Wm�2) in our study is outsidethe range of estimates in AMAP [2015] of �0.10 to �0.50Wm�2 and greater than the multimodel mean inAEROCOM of less than �0.40Wm�2 [Myhre et al., 2013].
Uncertainties in our estimates of aerosol RF may be traced to model mismatches with observations. Forexample, modeled Arctic sulfate RF may be overestimated in the Eurasian Arctic due to excessive transportof sulfate from Europe, as suggested by Figure 3. In the high Arctic (>70°N), GEOS-Chem overestimatesARCTAS BC observations by factors of 2–3 (Figure 6), indicating that the positive BC forcing in our studymay actually be weaker than our estimate of +0.44Wm�2 for the present day. On the other hand, comparisonwith site data suggests that we underestimate sulfate and BC net RF over Alert in spring and overestimatethese RFs in summer (Table 3). The net RF estimate is also dependent on the capability of the model to repro-duce the observed trends. Our study suggests that the sign of the observed trends in Arctic BC and sulfate isconsistent with the estimated decreases in emissions in Europe, North America, and Russia. However, weemphasize that BC trends from Russian gas flaring trends have not been included in our study.
BC emissions in our work are double those used in previous work for the present day [e.g.,Wang et al., 2014a,2014b]. Scaling down our BC emissions would result in weaker BC TOA RF over the Arctic. A factor of 2decrease in the BC Arctic RF would result in a stronger negative total aerosol TOA RF, increasing by more thana factor of 2 in the late 2000s, but by just 30% in the early 1980s. Using lower BC emissions would have a smalleffect on our estimate of the net Arctic warming since 1980 because changes in BC contribute less than 10%of the total net aerosol Arctic warming over this time period.
Our results do not take into consideration RF from aerosol-cloud interactions (indirect effects) or depositionof BC to snow or ice surfaces. As context for our results, we note that AMAP [2015] estimated RFs from aerosol-cloud interactions considering both anthropogenic and natural sources of +0.10–0.13Wm�2 for BC and�0.40–0.75Wm�2 for sulfate over the Arctic. In another multimodel study, Jiao et al. [2014] reported an RFfrom BC deposition to Arctic snow and ice of +0.17Wm�2.
By using surface reflectance climatology, we have not considered changes in surface albedo. In the Arctic,higher surface albedo in the 1980s due to greater sea ice coverage would reduce sulfate RF but increaseBC RF, while lower surface albedo in the late 2000s would have the opposite result, with higher sulfate RFand lower BC RF. Our neglect of climate feedbacks from aerosol in GEOS-Chem may also lead to an over-prediction in the estimated total net aerosol warming. Shindell and Faluvegi [2009] and Sand et al. [2013a,2013b] found a negative Arctic surface temperature response to BC in the atmosphere column due to aweakening of meridional heat transport. As shown by Flanner [2013] and Sand et al. [2013a], BC in thelower Arctic atmosphere strongly warms the Arctic surface. Our study shows that most of the change inArctic BC load since 1980 has taken place in the lower atmosphere (Figure 2), indicating that changesin anthropogenic BC since 1980 may have cooled the Arctic surface, thus offsetting some of the warmingdue to changes in sulfate.
Journal of Geophysical Research: Atmospheres 10.1002/2016JD025321
BREIDER ET AL. THE 1980–2010 TRENDS IN ARCTIC AEROSOL RF 3590

In their multimodel study, Shindell and Faluvegi [2009] reconstructed the influence on Arctic climate of the1976–2007 trends in both local and midlatitude aerosol loads. They found that aerosols may have warmedthe Arctic surface over this time frame by as much as 1.09 ± 0.81 K, or about 3 times what we calculate for1980–2010. Their study, however, inferred zonally averaged, midlatitude aerosol forcings as large as +1 to+5 Wm�2 for the 1976–2007 time frame, values that seem inconsistent with observed aerosol trends.Finally, Yang et al. [2014] found significant warming over the European Arctic in response to recent aerosoltrends, but no significant trend in surface temperatures over the Arctic as a whole. Their study, which focusedon the 1975–2005 period, estimated similar declines in sulfate AOD over the Arctic to our study, and unlikeour study reported slight increases in Arctic BC AOD during this time frame.
Our study provides a comprehensive analysis of observed long-term trends in Arctic BC and sulfate particu-late pollution. We have shown that GEOS-Chem is capable of reproducing observed Arctic aerosol seasonalityand trends at surface sites to within 30%. We note that modeling observed sulfate and BC concentrationsover broad spatial and temporal scales is challenging. Better representation of observations requiresimproved understanding of historical emissions and deposition processes.
Our use of a simple, offline method to estimate the temperature response to TOA forcing yields only a roughestimate of the influence of aerosol trends on Arctic surface temperatures. Our approach also focuses only onaerosol-radiation interactions and does not take into account aerosol-cloud interactions, the BC-albedoeffect, or changes in greenhouse gases. Within these limitations, our study suggests that air quality measuresaimed at reducing particulate pollution have inadvertently accelerated warming of the Arctic over thepast 30 years.
ReferencesAlexander, B., R. J. Park, D. J. Jacob, and S. Gong (2009), Transitionmetal-catalyzed oxidation of atmospheric sulfur: Global implications for the
sulfur budget, J. Geophys. Res., 114, D02309, doi:10.1029/2008JD010486.AMAP (2011), The Impact of Black Carbon on Arctic Climate (2011), By: P.K. Quinn, A. Stohl, A. Arneth,T. Berntsen, J. F. Burkhart, J. Christensen,
M. Flanner, K. Kupiainen, H. Lihavainen, M. Shepherd, V. Shevchenko,H. Skov, and V. Vestreng, AMAP Tech. Rep., 4, 72 pp., ArcticMonitoring and Assessment Programme (AMAP), Oslo.
AMAP (2015), AMAP Assessment 2015: Black carbon and ozone as Arctic climate forcers, Arctic Monitoring and Assessment Programme(AMAP), Oslo, Norway, vii + 116 pp.
Ancellet, G., J. Pelon, Y. Blanchard, B. Quennehen, A. Bazureau, K. S. Law, and A. Schwarzenboeck (2014), Transport of aerosol to the Arctic:Analysis of CALIOP and French aircraft data during the spring 2008 POLARCAT campaign, Atmos. Chem. Phys., 14(16), 8235–8254,doi:10.5194/acp-14-8235-2014.
Andreae, M. O., and P. Merlet (2001), Emission of trace gases and aerosols from biomass burning, Global Biogeochem. Cycles, 15(4), 955–966,doi:10.1029/2000GB001382.
Bond, T. C., E. Bhardwaj, R. Dong, R. Jogani, S. Jung, C. Roden, D. G. Streets, and N. M. Trautmann (2007), Historical emissions of black andorganic carbon aerosol from energy-related combustion, 1850–2000, Global Biogeochem. Cycles, 21, GB2018, doi:10.1029/2006GB002840.
Bond, T. C., C. Zarzycki, M. G. Flanner, and D. M. Koch (2011), Quantifying immediate radiative forcing by black carbon and organic matterwith the Specific Forcing Pulse, Atmos. Chem. Phys., 11(4), 1505–1525, doi:10.5194/acp-11-1505-2011.
Breider, T. J., L. J. Mickley, D. J. Jacob, Q. Wang, J. A. Fisher, R. Y.-W. Chang, and B. Alexander (2014), Annual distributions and sources of Arcticaerosol components, aerosol optical depth, and aerosol absorption, J. Geophys. Res. Atmos., 119, 4107–4124, doi:10.1002/2013JD020996.
Charlson, R. J., S. E. Schwartz, J. M. Hales, R. D. Cess, J. A. Coakley, J. E. Hansen, and D. J. Hofmann (1992), Climate forcing by anthropogenicaerosols, Science, 255(5043), 423–430, doi:10.1126/science.255.5043.423.
Clarke, A. D., and K. J. Noone (1985), Soot in the Arctic snowpack: A cause for perturbations in radiative transfer, Atmos. Environ., 19(12),2045–2053, doi:10.1016/0004-6981(85)90113-1.
Cohen, J. B., and C. Wang (2014), Estimating global black carbon emissions using a top-down Kalman Filter approach, J. Geophys. Res. Atmos.,119, 307–323, doi:10.1002/2013JD019912.
Cooke, W. F., C. Liousse, H. Cachier, and J. Feichter (1999), Construction of a 1° × 1° fossil fuel emission data set for carbonaceous aerosol andimplementation and radiative impact in the ECHAM-4 model, J. Geophys. Res., 104, 22,137–22,162.
Croft, B., R. V. Martin, W. R. Leaitch, P. Tunved, T. J. Breider, S. D. D’Andrea, and J. R. Pierce (2016), Processes controlling the annual cycle ofArctic aerosol number and size distributions, Atmos. Chem. Phys., 16, 3665–3682, doi:10.5194/acp-16-3665-2016.
Di Pierro, M., L. Jaeglé, E. W. Eloranta, and S. Sharma (2013), Spatial and seasonal distribution of Arctic aerosols observed by the CALIOPsatellite instrument (2006–2012), Atmos. Chem. Phys., 13(14), 7075–7095, doi:10.5194/acp-13-7075-2013.
Diehl, T. (2009), A global inventory of volcanic SO2 emissions for hindcast scenarios. [Available at http://www.lscedods.cea.fr/aerocom/AEROCOM_HC/volc/ (Documents updated in subsequent years after 2009). Last accessed February 2013.]
Drury, E., D. J. Jacob, R. J. D. Spurr, J. Wang, Y. Shinozuka, B. E. Anderson, A. D. Clarke, J. Dibb, C. McNaughton, and R. Weber (2010), Synthesisof satellite (MODIS), aircraft (ICARTT), and surface (IMPROVE, EPA-AQS, AERONET) aerosol observations over eastern North America toimprove MODIS aerosol retrievals and constrain surface aerosol concentrations and sources, J. Geophys. Res., 115, D14204, doi:10.1029/2009JD012629.
Duncan, B. N., R. V. Martin, A. C. Staudt, R. Yevich, and J. A. Logan (2003), Interannual and seasonal variability of biomass burning emissionsconstrained by satellite observations, J. Geophys. Res., 108(D2), 4100, doi:10.1029/2002JD002378.
Dutkiewicz, V. A., A. M. DeJulio, T. Ahmed, J. Laing, P. K. Hopke, R. B. Skeie, Y. Viisanen, J. Paatero, and L. Husain (2014), Forty-seven years ofweekly atmospheric black carbon measurements in the Finnish Arctic: Decrease in black carbon with declining emissions, J. Geophys. Res.Atmos., 119, 7667–7683, doi:10.1002/2014JD021790.
Journal of Geophysical Research: Atmospheres 10.1002/2016JD025321
BREIDER ET AL. THE 1980–2010 TRENDS IN ARCTIC AEROSOL RF 3591
AcknowledgmentsThis material is based upon worksupported by the National ScienceFoundation under grant NSF ARC-1049021. The authors wish to acknowl-edge the contributions of the fieldscientists and organizations that makethe observations and maintain researchstations. We thank the Canadian Forceservices Alert for maintenance of theAlert site, Dan Veber for aerosol instru-ment maintenance, and Desi Toom forproviding inorganic analyses. We wishto thank Eric Scheuer for providingTOPSE aircraft sulfate data. We thankthe principal investigators Brent Holben,Victoria E. Cachorro Revill, MichaelGausa, Bruce McArthur, Norm O’Neill,Piotr Sobolewski, Kerstin Stebel, RickWagener, and their staff for establishingand maintaining the Arctic AERONETsites used in this investigation. The dataused are listed in the references andtables. The measurements at VillumResearch Station were financially sup-ported by the Danish EnvironmentalProtection Agency with means from theMIKA/DANCEA funds for EnvironmentalSupport to the Arctic Region, which ispart of the Danish contribution to“Arctic Monitoring and AssessmentProgram” (AMAP). The data used in thispaper can be accessed at dataverse.harvard.edu using doi:10.7910/DVN/Q1FNUH.

Eckhardt, S., et al. (2015), Current model capabilities for simulating black carbon and sulfate concentrations in the Arctic atmosphere: Amulti-model evaluation using a comprehensive measurement data set, Atmos. Chem. Phys., 15(16), 9413–9433, doi:10.5194/acp-15-9413-2015.
Eleftheriadis, K., S. Vratolis, and S. Nyeki (2009), Aerosol black carbon in the European Arctic: Measurements at Zeppelin station, Ny-Ålesund,Svalbard from 1998–2007, Geophys. Res. Lett., 36, L02809, doi:10.1029/2008GL035741.
Fisher, J. A., et al. (2010), Source attribution and interannual variability of Arctic pollution in spring constrained by aircraft (ARCTAS, ARCPAC)and satellite (AIRS) observations of carbon monoxide, Atmos. Chem. Phys., 10(3), 977–996, doi:10.5194/acp-10-977-2010.
Fisher, J. A., et al. (2011), Sources, distribution, and acidity of sulfate–ammonium aerosol in the Arctic in winter–spring, Atmos. Environ.,45(39), 7301–7318, doi:10.1016/j.atmosenv.2011.08.030.
Flanner, M. G. (2013), Arctic climate sensitivity to local black carbon, J. Geophys. Res. Atmos., 118, 1840–1851, doi:10.1002/jgrd.50176.Flanner, M. G., C. S. Zender, P. G. Hess, N. M. Mahowald, T. H. Painter, V. Ramanathan, and P. J. Rasch (2009), Springtime warming and reduced
snow cover from carbonaceous particles, Atmos. Chem. Phys., 9(7), 2481–2497, doi:10.5194/acp-9-2481-2009.Gong, S. L., T. L. Zhao, S. Sharma, D. Toom-Sauntry, D. Lavoué, X. B. Zhang, W. R. Leaitch, and L. A. Barrie (2010), Identification of trends and
interannual variability of sulfate and black carbon in the Canadian High Arctic: 1981–2007, J. Geophys. Res., 115, D07305, doi:10.1029/2009JD012943.
Goto-Azuma, K., and R. M. Koerner (2001), Ice core studies of anthropogenic sulfate and nitrate trends in the Arctic, J. Geophys. Res., 106(D5),4959–4969, doi:10.1029/2000JD900635.
Granier, C., et al. (2011), Evolution of anthropogenic and biomass burning emissions of air pollutants at global and regional scales during the1980–2010 period, Clim. Change, 109(1–2), 163–190, doi:10.1007/s10584-011-0154-1.
Gu, Y., K. N. Liou, S. C. Ou, and R. Fovell (2011), Cirrus cloud simulations using WRF with improved radiation parameterization and increasedvertical resolution, J. Geophys. Res., 116, D06119, doi:10.1029/2010JD014574.
Heidam, N. Z., J. H. Christensen, H. Skov, and P. Wåhlin (2004), Monitoring and modelling of the atmospheric environment in Greenland.A review, Sci. Total Environ., 331(1–3), 5–28.
Heintzenberg, J., and S. Larssen (1983), SO2 and SO4 = in the Arctic: Interpretation of observations at three Norwegian Arctic-Subarcticstations, Tellus B, 35B(4), 255–265, doi:10.1111/j.1600-0889.1983.tb00028.x.
Hirdman, D., J. F. Burkhart, H. Sodemann, S. Eckhardt, A. Jefferson, P. K. Quinn, S. Sharma, J. Ström, and A. Stohl (2010), Long-term trends ofblack carbon and sulphate aerosol in the Arctic: Changes in atmospheric transport and source region emissions, Atmos. Chem. Phys.,10(19), 9351–9368, doi:10.5194/acp-10-9351-2010.
Huang, K., and J. S. Fu (2016), A global gas flaring black carbon emission rate dataset from 1994 to 2012, Sci. Data, 3, 160104, doi:10.1038/sdata.2016.104.
Huang, K., J. S. Fu, V. Y. Prikhodko, J. M. Storey, A. Romanov, E. L. Hodson, J. Cresko, I. Morozova, Y. Ignatieva, and J. Cabaniss (2015), Russiananthropogenic black carbon: Emission reconstruction and Arctic black carbon simulation, J. Geophys. Res. Atmos., 120, 11,306–11,333,doi:10.1002/2015JD023358.
Isaksson, E., et al. (2001), A new ice-core record from Lomonosovfonna, Svalbard: Viewing the 1920–97 data in relation to present climateand environmental conditions, J. Glaciol., 47(157), 335–345, doi:10.3189/172756501781832313.
Jacob, D. J., J. H. Crawford, H. Maring, A. D. Clarke, J. E. Dibb, L. K. Emmons, R. A. Ferrare, C. A. Hostetler, P. B. Russell, and H. B. Singh (2010), TheArctic Research of the Composition of the Troposphere from Aircraft and Satellites (ARCTAS) mission: Design, execution, and first results,Atmos. Chem. Phys., 10(11), 5191–5212.
Jaeglé, L., P. K. Quinn, T. S. Bates, B. Alexander, and J.-T. Lin (2011), Global distribution of sea salt aerosols: New constraints from in situ andremote sensing observations, Atmos. Chem. Phys., 11(7), 3137–3157, doi:10.5194/acp-11-3137-2011.
Jaeschke, W., T. Salkowski, J. P. Dierssen, J. T. Trümbach, U. Krischke, and A. Günther (1999), Measurements of trace substances in the Arctictroposphere as potential precursors and constituents of Arctic haze, J. Atmos. Chem., 34(3), 291–319, doi:10.1023/A:1006277230042.
Jiao, C., et al. (2014), An AeroCom assessment of black carbon in Arctic snow and sea ice, Atmos. Chem. Phys., 14(5), 2399–2417, doi:10.5194/acp-14-2399-2014.
Kaiser, J. W., et al. (2012), Biomass burning emissions estimated with a global fire assimilation system based on observed fire radiative power,Biogeosciences, 9(1), 527–554, doi:10.5194/bg-9-527-2012.
Koch, D., and J. Hansen (2005), Distant origins of Arctic black carbon: A Goddard Institute for Space Studies ModelE experiment, J. Geophys.Res., 110, D04204, doi:10.1029/2004JD005296.
Koch, D., et al. (2009), Evaluation of black carbon estimations in global aerosol models, Atmos. Chem. Phys., 9(22), 9001–9026, doi:10.5194/acp-9-9001-2009.
Koch, D., et al. (2011), Coupled aerosol-chemistry–climate twentieth-century transient model investigation: Trends in short-lived species andclimate responses, J. Clim., 24(11), 2693–2714, doi:10.1175/2011JCLI3582.1.
Koelemeijer, R. B. A., J. F. de Haan, and P. Stammes (2003), A database of spectral surface reflectivity in the range 335–772 nm derived from5.5 years of GOME observations, J. Geophys. Res., 108(D2), 4070, doi:10.1029/2002JD002429.
Laing, J. R., P. K. Hopke, E. F. Hopke, L. Husain, V. A. Dutkiewicz, J. Paatero, and Y. Viisanen (2013), Long-term trends of biogenic sulfur aerosoland its relationship with sea surface temperature in Arctic Finland, J. Geophys. Res. Atmos., 118, 1–7, doi:10.1002/2013JD020384.
Lamarque, J.-F., T. C. Bond, V. Eyring, C. Granier, A. Heil, Z. Klimont, D. Lee, C. Liousse, A. Mieville, and B. Owen (2010), Historical (1850–2000)gridded anthropogenic and biomass burning emissions of reactive gases and aerosols: Methodology and application, Atmos. Chem. Phys.,10(15), 7017–7039.
Lana, A., et al. (2011), An updated climatology of surface dimethlysulfide concentrations and emission fluxes in the global ocean,Global Biogeochem. Cycles, 25, GB1004, doi:10.1029/2010GB003850.
Li, S.-M., and J. W. Winchester (1989), Arctic air chemistry resolution of ionic components of late winter Arctic aerosols, Atmos. Environ, 23(11),2387–2399, doi:10.1016/0004-6981(89)90251-5.
Liou, K. N., Y. Gu, Q. Yue, and G. McFarguhar (2008), On the correlation between ice water content and ice crystal size and its application toradiative transfer and general circulation models, Geophys. Res. Lett., 35, L13805, doi:10.1029/2008GL033918.
Liss, P. S., and L. Merlivat (1986), Air-sea gas exchange rates: Introduction and synthesis, in The Role of Air-Sea Exchange in GeochemicalCycling, edited by P. Buat-Ménard, pp. 113–127, Springer, Netherlands.
Liu, H., D. J. Jacob, I. Bey, and R. M. Yantosca (2001), Constraints from210
Pb and7Be on wet deposition and transport in a global three-
dimensional chemical tracer model driven by assimilated meteorological fields, J. Geophys. Res., 106, 12,109–12,128, doi:10.1029/2000JD900839.
Maenhaut, W., P. Cornille, J. M. Pacyna, and V. Vitols (1989), Arctic air chemistry trace element composition and origin of the atmosphericaerosol in the Norwegian Arctic, Atmos. Environ., 23(11), 2551–2569, doi:10.1016/0004-6981(89)90266-7.
Journal of Geophysical Research: Atmospheres 10.1002/2016JD025321
BREIDER ET AL. THE 1980–2010 TRENDS IN ARCTIC AEROSOL RF 3592

McConnell, J. R., R. Edwards, G. L. Kok, M. G. Flanner, C. S. Zender, E. S. Saltzman, J. R. Banta, D. R. Pasteris, M. M. Carter, and J. D. W. Kahl (2007),20th-century industrial black carbon emissions altered Arctic climate forcing, Science, 317(5843), 1381–1384, doi:10.1126/science.1144856.
McGuffie, K., and J. G. Cogley (1985), Climatological analysis of arctic aerosol quality and optical properties at Resolute, N. W. T,Atmos. Environ., 19(5), 707–714, doi:10.1016/0004-6981(85)90058-7.
McLinden, C. A., S. C. Olsen, B. Hannegan, O. Wild, M. J. Prather, and J. Sundet (2000), Stratospheric ozone in 3-D models: A simple chemistryand the cross-tropopause flux, J. Geophys. Res., 105(D11), 14,653–14,665, doi:10.1029/2000JD900124.
Mickley, L. J., D. J. Jacob, B. D. Field, and D. Rind (2004), Climate response to the increase in tropospheric ozone since preindustrial times: Acomparison between ozone and equivalent CO2 forcings, J. Geophys. Res., 109, D05106, doi:10.1029/2003JD003653.
Mitchell, M. (1956), Visual range in the polar regions with particular reference to the Alaskan Arctic, J. Atmos. Terr. Phys. Spec. Suppl.,195–211.
Myhre, G., et al. (2013), Radiative forcing of the direct aerosol effect from AeroCom Phase II simulations, Atmos. Chem. Phys., 13(4), 1853–1877,doi:10.5194/acp-13-1853-2013.
Nguyen, Q. T., H. Skov, L. L. Sørensen, B. J. Jensen, A. G. Grube, A. Massling, M. Glasius, and J. K. Nøjgaard (2013), Source apportionment ofparticles at Station Nord, North East Greenland during 2008–2010 using COPREM and PMF analysis, Atmos. Chem. Phys., 13(1), 35–49,doi:10.5194/acp-13-35-2013.
National Snow and Ice Data Center (NSIDC), (2015), Arctic sea ice extent settles at fourth lowest in the satellite record, National Snow and IceData Center. [Available at http://nsidc.org/news/newsroom/PR_2015meltseason (Accessed 3 December 2015).]
Quinn, P. K., G. Shaw, E. Andrews, E. G. Dutton, T. Ruoho-Airola, and S. L. Gong (2007), Arctic haze: Current trends and knowledge gaps,Tellus B, 59(1), 99–114, doi:10.1111/j.1600-0889.2006.00238.x.
Quinn, P. K., et al. (2008), Short-lived pollutants in the Arctic: Their climate impact and possible mitigation strategies, Atmos. Chem. Phys., 8(6),1723–1735, doi:10.5194/acp-8-1723-2008.
Quinn, P. K., T. S. Bates, K. Schulz, and G. E. Shaw (2009), Decadal trends in aerosol chemical composition at Barrow, Alaska: 1976–2008,Atmos. Chem. Phys., 9(22), 8883–8888, doi:10.5194/acp-9-8883-2009.
Radke, L. F., P. V. Hobbs, and I. H. Bailey (1984), Airborne observations of Arctic aerosols. III: Origins and effects of air masses, Geophys. Res.Lett., 11(5), 401–404, doi:10.1029/GL011i005p00401.
Rahn, K. A., and R. J. McCaffrey (1979), Long-range transport of pollution aerosol to the Arctic: A problem without borders, in ProceedingsWMO Symposium on the Long Range Transport of Pollutants, vol. 538, pp. 25–35, WMO, Sofia.
Rahn, K. A., and R. J. McCaffrey (1980), On the origin and transport of the winter Arctic aerosol*, Ann. N. Y. Acad. Sci., 338(1), 486–503,doi:10.1111/j.1749-6632.1980.tb17142.x.
Randerson, J. T., Y. Chen, G. R. van der Werf, B. M. Rogers, and D. C. Morton (2012), Global burned area and biomass burning emissions fromsmall fires, J. Geophys. Res., 117, G04012, doi:10.1029/2012JG002128.
Ridley, D. A., C. L. Heald, J. R. Pierce, and M. J. Evans (2013), Toward resolution-independent dust emissions in global models: Impacts on theseasonal and spatial distribution of dust, Geophys. Res. Lett., 40, 2873–2877, doi:10.1002/grl.50409.
Samset, B. H., and G. Myhre (2015), Climate response to externally mixed black carbon as a function of altitude, J. Geophys. Res. Atmos., 120,2913–2927, doi:10.1002/2014JD022849.
Samset, B. H., et al. (2014), Modelled black carbon radiative forcing and atmospheric lifetime in AeroCom Phase II constrained by aircraftobservations, Atmos. Chem. Phys., 14, 12,465–12,477, doi:10.5194/acp-14-12465-2014.
Sand, M., T. K. Berntsen, Ø. Seland, and J. E. Kristjánsson (2013a), Arctic surface temperature change to emissions of black carbonwithin Arcticor midlatitudes, J. Geophys. Res. Atmos., 118, 7788–7798, doi:10.1002/jgrd.50613.
Sand, M., T. K. Berntsen, J. E. Kay, J. F. Lamarque, Ø. Seland, and A. Kirkevåg (2013b), The Arctic response to remote and local forcing of blackcarbon, Atmos. Chem. Phys., 13(1), 211–224, doi:10.5194/acp-13-211-2013.
Scheuer, E., R. W. Talbot, J. E. Dibb, G. K. Seid, L. DeBell, and B. Lefer (2003), Seasonal distributions of fine aerosol sulfate in the North AmericanArctic basin during TOPSE, J. Geophys. Res., 108(D4), 8370, doi:10.1029/2001JD001364.
Schultz, M. G., A. Heil, J. J. Hoelzemann, A. Spessa, K. Thonicke, J. G. Goldammer, A. C. Held, J. M. C. Pereira, and M. van het Bolscher (2008),Global wildland fire emissions from 1960 to 2000, Global Biogeochem. Cycles, 22, GB2002, doi:10.1029/2007GB003031.
Seinfeld, J. H., and S. N. Pandis (2006), Atmospheric chemistry and physics: From air pollution to climate change, John Wiley Hoboken, N. J.Sharma, S., D. Lavoué, H. Cachier, L. A. Barrie, and S. L. Gong (2004), Long-term trends of the black carbon concentrations in the Canadian
Arctic, J. Geophys. Res., 109, D15203, doi:10.1029/2003JD004331.Sharma, S., E. Andrews, L. A. Barrie, J. A. Ogren, and D. Lavoué (2006), Variations and sources of the equivalent black carbon in the high Arctic
revealed by long-term observations at Alert and Barrow: 1989–2003, J. Geophys. Res., 111, D14208, doi:10.1029/2005JD006581.Sharma, S., M. Ishizawa, D. Chan, D. Lavoué, E. Andrews, K. Eleftheriadis, and S. Maksyutov (2013), 16-year simulation of Arctic black
carbon: Transport, source contribution, and sensitivity analysis on deposition, J. Geophys. Res. Atmos., 118, 943–964, doi:10.1029/2012JD017774.
Shaw, G. E. (1995), The Arctic haze phenomenon, Bull. Am. Meteorol. Soc., 76(12), 2403–2413, doi:10.1175/1520-0477(1995)076<2403:TAHP>2.0.CO;2.
Shindell, D. (2007), Local and remote contributions to Arctic warming, Geophys. Res. Lett., 34, L14704, doi:10.1029/2007GL030221.Shindell, D., and G. Faluvegi (2009), Climate response to regional radiative forcing during the twentieth century, Nat. Geosci., 2(4), 294–300,
doi:10.1038/ngeo473.Shupe, M. D., T. Uttal, S. Y. Matrosov, and A. S. Frisch (2001), Cloud water contents and hydrometeor sizes during the FIRE Arctic Clouds
Experiment, J. Geophys. Res., 106(D14), 15,015–15,028, doi:10.1029/2000JD900476.Shupe, M. D., V. P. Walden, E. Eloranta, T. Uttal, J. R. Campbell, S. M. Starkweather, and M. Shiobara (2011), Clouds at arctic atmospheric
observatories. Part I: Occurrence and macrophysical properties, J. Appl. Meteorol. Climatol., 50(3), 626–644, doi:10.1175/2010JAMC2467.1.Sirois, A., and L. A. Barrie (1999), Arctic lower tropospheric aerosol trends and composition at Alert, Canada: 1980–1995, J. Geophys. Res.,
104(D9), 11,599–11,618, doi:10.1029/1999JD900077.Smith, S. J., J. van Aardenne, Z. Klimont, R. J. Andres, A. Volke, and S. Delgado Arias (2011), Anthropogenic sulfur dioxide emissions:
1850–2005, Atmos. Chem. Phys., 11(3), 1101–1116, doi:10.5194/acp-11-1101-2011.Stohl, A. (2006), Characteristics of atmospheric transport into the Arctic troposphere, J. Geophys. Res., 111, D11306, doi:10.1029/
2005JD006888.Stohl, A., Z. Klimont, S. Eckhardt, K. Kupiainen, V. P. Shevchenko, V. M. Kopeikin, and A. N. Novigatsky (2013), Black carbon in the Arctic:
The underestimated role of gas flaring and residential combustion emissions, Atmos. Chem. Phys., 13(17), 8833–8855, doi:10.5194/acp-13-8833-2013.
Journal of Geophysical Research: Atmospheres 10.1002/2016JD025321
BREIDER ET AL. THE 1980–2010 TRENDS IN ARCTIC AEROSOL RF 3593
Stone, R. S., Sharma, S., A. Herber, K. Eleftheriadis, and D. W. Nelson (2014), A characterization of Arctic aerosols on the basis of aerosol opticaldepth and black carbon measurements. [Available at: http://www.elementascience.org/articles/27.]
Talbot, R. W., A. S. Vijgen, and R. C. Harriss (1992), Soluble species in the Arctic summer troposphere: Acidic gases, aerosols, and precipitation,J. Geophys. Res., 97(D15), 16,531–16,543, doi:10.1029/91JD00118.
Tomasi, C., et al. (2012), An update on polar aerosol optical properties using POLAR-AOD and other measurements performed during theInternational Polar Year, Atmos. Environ., 52, 29–47, doi:10.1016/j.atmosenv.2012.02.055.
Tørseth, K., W. Aas, K. Breivik, A. M. Fjæraa, M. Fiebig, A. G. Hjellbrekke, C. Lund Myhre, S. Solberg, and K. E. Yttri (2012), Introduction tothe European Monitoring and Evaluation Programme (EMEP) and observed atmospheric composition change during 1972–2009,Atmos. Chem. Phys., 12(12), 5447–5481, doi:10.5194/acp-12-5447-2012.
Trenberth, K. E., P. D. Jones, P. Ambenje, R. Bojariu, D. Easterling, A. K. Tank, D. Parker, F. Rahimzadeh, J. A. Renwick, andM. Rusticucci (2007), inObservations: Surface and Atmospheric Climate Change, Chap. 3 of Climate Change 2007: The Physical Science Basis. Contribution of WorkingGroup I to the Fourth Assessment Report of the Intergovernmental Panel on Climate Change, edited by S. Solomon et al., pp. 235–336,Cambridge Univ. Press, Cambridge, U. K., and New York.
Twomey, S. (1974), Pollution and the planetary albedo, Atmos. Environ., 8(12), 1251–1256, doi:10.1016/0004-6981(74)90004-3.van der Werf, G. R., J. T. Randerson, L. Giglio, G. J. Collatz, P. S. Kasibhatla, and A. F. Arellano Jr. (2006), Interannual variability in global biomass
burning emissions from 1997 to 2004, Atmos. Chem. Phys., 6(11), 3423–3441, doi:10.5194/acp-6-3423-2006.Wang, H., P. J. Rasch, R. C. Easter, B. Singh, R. Zhang, P.-L. Ma, Y. Qian, S. J. Ghan, and N. Beagley (2014a), Using an explicit emission tagging
method in global modeling of source-receptor relationships for black carbon in the Arctic: Variations, sources, and transport pathways,J. Geophys. Res. Atmos., 119, 12,888–12,909, doi:10.1002/2014JD022297.
Wang, J., D. J. Jacob, and S. T. Martin (2008), Sensitivity of sulfate direct climate forcing to the hysteresis of particle phase transitions,J. Geophys. Res., 113, D11207, doi:10.1029/2007JD009368.
Wang, J., S. Park, J. Zeng, C. Ge, K. Yang, S. Carn, N. Krotkov, and A. H. Omar (2013), Modeling of 2008 Kasatochi volcanic sulfate directradiative forcing: Assimilation of OMI SO2 plume height data and comparison with MODIS and CALIOP observations, Atmos. Chem. Phys.,13(4), 1895–1912, doi:10.5194/acp-13-1895-2013.
Wang, Q., et al. (2011), Sources of carbonaceous aerosols and deposited black carbon in the Arctic in winter-spring: Implications for radiativeforcing, Atmos. Chem. Phys., 11(23), 12,453–12,473, doi:10.5194/acp-11-12453-2011.
Wang, Q., D. J. Jacob, J. R. Spackman, A. E. Perring, J. P. Schwarz, N. Moteki, E. A. Marais, C. Ge, J. Wang, and S. R. H. Barrett (2014b), Globalbudget and radiative forcing of black carbon aerosol: Constraints from pole-to-pole (HIPPO) observations across the Pacific, J. Geophys.Res. Atmos., 119, 195–206, doi:10.1002/2013JD020824.
Westerling, A. L., H. G. Hidalgo, D. R. Cayan, and T. W. Swetnam (2006), Warming and earlier spring increase western U.S. forest wildfireactivity, Science, 313(5789), 940–943, doi:10.1126/science.1128834.
Yang, Q., C. M. Bitz, and S. J. Doherty (2014), Offsetting effects of aerosols on Arctic and global climate in the late 20th century, Atmos. Chem.Phys., 14(8), 3969–3975, doi:10.5194/acp-14-3969-2014.
Zhou, C., J. E. Penner, M. G. Flanner, M. M. Bisiaux, R. Edwards, and J. R. McConnell (2012), Transport of black carbon to polar regions:Sensitivity and forcing by black carbon, Geophys. Res. Lett., 39, L22804, doi:10.1029/2012GL053388.
Journal of Geophysical Research: Atmospheres 10.1002/2016JD025321
BREIDER ET AL. THE 1980–2010 TRENDS IN ARCTIC AEROSOL RF 3594