Embed Size (px)
Citation preview

The Many Faces of Poverty (Volume 5)
65
For many years, Marikina has been lacking concrete and definitebaseline information, particularly those relating to poverty.
Realizing the urgency of such a requirement, the city has adoptedthe Community-Based Monitoring System (CBMS), which has given usvaluable information to make information-driven decisions, to plan, and toidentify priorities. The CBMS baseline data benefit both the local governmentand the nongovernment organizations that generally target the poor as projectbeneficiaries.
Evidence-based planning and decision making ensure that gapsare filled, challenges and targets are met, and appropriate interventionsare undertaken. Thus, resources are put to maximum use to impact thesocioeconomic well-being of our constituents who expect no less than thebest from government.
This is what CBMS is all about. It underlines the importance of reliable, accurate, and updated baselineinformation that is necessary for better governance.
Republic of the PhilippinesCity of Marikina
Office of the Mayor
Message
DEL R. DE GUZMANDEL R. DE GUZMANDEL R. DE GUZMANDEL R. DE GUZMANDEL R. DE GUZMANMayorMayorMayorMayorMayor

66
The Many Faces of Poverty (Volume 5)
Faces of Poverty in the City of Marikina
POPULAPOPULAPOPULAPOPULAPOPULATIONTIONTIONTIONTIONCBMS covered a total population of 314,085 living in 79,077 householdsCBMS covered a total population of 314,085 living in 79,077 householdsCBMS covered a total population of 314,085 living in 79,077 householdsCBMS covered a total population of 314,085 living in 79,077 householdsCBMS covered a total population of 314,085 living in 79,077 householdsThe CBMS census conducted in 2012 covered all of the city�s 16 barangays and results showed a total populationof 314,085 living in 79,077 households. The average size is 4 persons per household. Barangay Malanday hasthe largest population at 40,416 and having 9,582 households. Barangay Sta. Elena has the smallest populationat only 4,254 and having 1,112 households.
HEALHEALHEALHEALHEALTH AND NUTRITIONTH AND NUTRITIONTH AND NUTRITIONTH AND NUTRITIONTH AND NUTRITIONOne in everOne in everOne in everOne in everOne in ever y 1,000 childry 1,000 childry 1,000 childry 1,000 childry 1,000 children under 5 years old dieden under 5 years old dieden under 5 years old dieden under 5 years old dieden under 5 years old diedThe CBMS census revealed that, on average, 0.1 percent of children under 5 years old died during the referenceperiod. This translates to a total of 33 death cases among children under 5 years old. Barangay Sta. Elena has thehighest proportion of deaths at 0.5 percent while Barangay Tumana had the highest magnitude with a total of 14cases.
Only two cases of death due to pregnancy-related causesOnly two cases of death due to pregnancy-related causesOnly two cases of death due to pregnancy-related causesOnly two cases of death due to pregnancy-related causesOnly two cases of death due to pregnancy-related causesResults also showed only two cases of death due to pregnancy-related causes. This represents just 0.03 percentof pregnant women during the reference period. Only Barangay Tumana and Barangay Fortune recorded one caseeach while the rest of the barangays reported zero case of death due to pregnancy�related causes.
Among children 0�5 years old, 1.8 percent were malnourishedAmong children 0�5 years old, 1.8 percent were malnourishedAmong children 0�5 years old, 1.8 percent were malnourishedAmong children 0�5 years old, 1.8 percent were malnourishedAmong children 0�5 years old, 1.8 percent were malnourishedInformation on the nutritional status of children 0�����5 years old showed that 1.8 percent of the children weremoderately or severely malnourished based on their weights. This accounts for a total of 606 malnourishedchildren among 0�����5 years old. Barangay Industrial Valley Complex recorded the highest proportion at 5.1 percent.The highest number�at 139 malnourished children�was recorded in Barangay Tumana. Records from the CityHealth Office of Marikina showed that among children who are 0�����5 years old, 616 or 1.8 percent were malnourishedin 2012.
HOUSINGHOUSINGHOUSINGHOUSINGHOUSINGOf the city residents, less than 1 percent lived in makeshift housing while 6.6 percent wereOf the city residents, less than 1 percent lived in makeshift housing while 6.6 percent wereOf the city residents, less than 1 percent lived in makeshift housing while 6.6 percent wereOf the city residents, less than 1 percent lived in makeshift housing while 6.6 percent wereOf the city residents, less than 1 percent lived in makeshift housing while 6.6 percent wereclassified as informal settlersclassified as informal settlersclassified as informal settlersclassified as informal settlersclassified as informal settlersSurvey results showed that 517 households or 0.7 percent of all households in the city were living in makeshifthousing. Among all barangays, Barangay Tumana had the highest magnitude (at 325 households) and proportion(at 3.8%) of households living in makeshift housing.
Survey results also showed that 6.6 percent of the households in the city were classified as informal settlers. Thiswas highest in Barangay Tumana where more than half (57.6%) of the households were recorded as informalsettlers. The Marikina Settlement Office reported that in 2012�����2013, 12.4 percent or 9,791 of the households incity were classified as informal settlers.

The Many Faces of Poverty (Volume 5)
67
1 �Waterless barangays� refer to villages with less than 50 percent (safe) water supply coverage.
WWWWWAAAAATER AND SANITTER AND SANITTER AND SANITTER AND SANITTER AND SANITAAAAATIONTIONTIONTIONTIONAt least 1 in everAt least 1 in everAt least 1 in everAt least 1 in everAt least 1 in ever y 100 households in the city had no access to impry 100 households in the city had no access to impry 100 households in the city had no access to impry 100 households in the city had no access to impry 100 households in the city had no access to improved water souroved water souroved water souroved water souroved water source while lessce while lessce while lessce while lessce while lessthan 1 perthan 1 perthan 1 perthan 1 perthan 1 percent had no access to sanitarcent had no access to sanitarcent had no access to sanitarcent had no access to sanitarcent had no access to sanitar y toilet facilitiesy toilet facilitiesy toilet facilitiesy toilet facilitiesy toilet facilitiesCBMS data revealed that 1,000 households in the city or 1.3 percent had no access to improved water source.This translates to at least 1 in every 100 households having no access to improved water source. The highestestimate was recorded in Barangay Tumana with a total of 701 households (8.3%) having no access to improvedwater source. It can be noted that there were no recorded �waterless�1 barangays in the city.
Less than 1 percent of all households in the city lacked access to sanitary toilet facilities. Only 15 households inseven barangays were recorded to have no access to sanitary toilet. All households in 9 barangays had access tosanitary toilet facilities. Barangay Tumana had five households with no access to sanitary toilet facility, whichaccounted for 0.01 percent of the total households.
BASIC EDUCABASIC EDUCABASIC EDUCABASIC EDUCABASIC EDUCATIONTIONTIONTIONTIONAt least 4 in everAt least 4 in everAt least 4 in everAt least 4 in everAt least 4 in ever y 100 childry 100 childry 100 childry 100 childry 100 children 6�15 years old weren 6�15 years old weren 6�15 years old weren 6�15 years old weren 6�15 years old were not attending schoole not attending schoole not attending schoole not attending schoole not attending schoolAmong children who were 6�����15 years old, 4.1 percent were not attending school, which translates to a total of2,412 children. The highest proportion of children not attending school is recorded in Barangay Sta. Elena at 6.5percent, which translates to 49 children. Barangay Tumana had the most number of out-of-school youths with 474or 6.2 percent.
INCOME AND LIVELIHOODINCOME AND LIVELIHOODINCOME AND LIVELIHOODINCOME AND LIVELIHOODINCOME AND LIVELIHOODPoverPoverPoverPoverPover ty incidence is at 11.6 perty incidence is at 11.6 perty incidence is at 11.6 perty incidence is at 11.6 perty incidence is at 11.6 percentcentcentcentcentResults from the survey revealed that at least 11 in every 100 households had incomes below the povertythreshold. This represents a total of 9,169 income-poor households in the city. Barangay Tumana had the mostnumber of income-poor households at 1,797 households and also had the highest poverty rate at 21.3 percent.
Of the households, 5.4 perOf the households, 5.4 perOf the households, 5.4 perOf the households, 5.4 perOf the households, 5.4 percent had no sufcent had no sufcent had no sufcent had no sufcent had no sufficient income to satisfy their basic nutritional rficient income to satisfy their basic nutritional rficient income to satisfy their basic nutritional rficient income to satisfy their basic nutritional rficient income to satisfy their basic nutritional requirequirequirequirequirementsementsementsementsementsSurvey results showed that 5.4 percent or 4,303 households are considered food-poor. This translates to at least5 in every 100 households had income below the food threshold. Across all barangays in the city, BarangayTumana recorded the highest rate of subsistence poverty at 10.4 percent and having the highest magnitude at882 households living below the food threshold.
Of the households, 0.1 perOf the households, 0.1 perOf the households, 0.1 perOf the households, 0.1 perOf the households, 0.1 percent experienced hunger due to food shorcent experienced hunger due to food shorcent experienced hunger due to food shorcent experienced hunger due to food shorcent experienced hunger due to food shor tagetagetagetagetageSome 0.1 percent or 79 of the households were reported to have experienced hunger due to food shortage in thelast three months prior to the survey. Barangay Tañong had the highest proportion of households that experiencedhunger at 0.4 percent while Barangay Tumana had 12 households or the most number of households that experiencedhunger (equivalent to 0.1%). Barangay Marikina Heights had zero household reported to have experienced hunger.
Unemployment in the city was at 11.7 percentUnemployment in the city was at 11.7 percentUnemployment in the city was at 11.7 percentUnemployment in the city was at 11.7 percentUnemployment in the city was at 11.7 percentResults showed that 13,879 persons were considered unemployed, translating to 11.7 percent unemploymentrate. Across the barangays, Barangay Sto. Niño had the highest unemployment rate at 14.1 percent. In terms ofmagnitude, Barangay Malanday had the highest number of unemployment at 1, 804 or 12.5 percent of its laborforce.

68
The Many Faces of Poverty (Volume 5)
PEACE AND ORDERPEACE AND ORDERPEACE AND ORDERPEACE AND ORDERPEACE AND ORDEROf the total population, 0.3 percent was a victim of crimesOf the total population, 0.3 percent was a victim of crimesOf the total population, 0.3 percent was a victim of crimesOf the total population, 0.3 percent was a victim of crimesOf the total population, 0.3 percent was a victim of crimesOf the total population, 0.3 percent or 1,070 persons were victims of crime. The highest recorded magnitude andproportion of victims of crime was at Barangay Malanday at 0.7 percent or 299 individuals who were victims ofcrime.
CBMS COMPOSITE INDICACBMS COMPOSITE INDICACBMS COMPOSITE INDICACBMS COMPOSITE INDICACBMS COMPOSITE INDICATOR AND MULTOR AND MULTOR AND MULTOR AND MULTOR AND MULTIDIMENSIONAL POVERTYTIDIMENSIONAL POVERTYTIDIMENSIONAL POVERTYTIDIMENSIONAL POVERTYTIDIMENSIONAL POVERTYMost households have met the 13 basic needsMost households have met the 13 basic needsMost households have met the 13 basic needsMost households have met the 13 basic needsMost households have met the 13 basic needs22222 on the average on the average on the average on the average on the averageMarikina City recorded an average CBMS composite indicator (CCI) of 0.8. This means that on the average,households were able to meet the 13 basic needs during the reference period. However, at the barangay level,Barangay Tumana recorded a slightly higher composite index of 1.2. This means that households in this barangay,on average, were not met able to meet at least one of the basic needs.
Of the households, 4.6 perOf the households, 4.6 perOf the households, 4.6 perOf the households, 4.6 perOf the households, 4.6 percent sufcent sufcent sufcent sufcent suf ferferferferfered fred fred fred fred from multiple deprivationsom multiple deprivationsom multiple deprivationsom multiple deprivationsom multiple deprivations33333
Based on the results of the CBMS census, 21.6 percent of the households were deprived in one dimension, butonly 4.6 percent experienced deprivations in at least two dimensions. In par ticular, 3.8 percent were deprived intwo dimensions, 0.7 percent deprived in three dimensions, and 0.1 percent deprived in four or five dimensions. Ofthe total households, 73.9 percent was not deprived in any dimension.
Looking into the different dimensions of poverty, results showed that 1.3 percent of the households were deprivedin income and jobs at the same time. At the same time, 457 households were deprived in income and tenure, and404 households were deprived in income and education. In three dimensions, 107 households experiencedsimultaneous deprivations in income, tenure, and job.
22222 This refers to household basic needs as reflected in the 13 CBMS core indicators that cover the following: (1) children 0-4 years old who died; (2)women who died due to pregnancy-related causes; (3) malnourished children 0-5 years old; (4) households living in makeshift housing; (5) households whoare informal settlers; (6) households without access to safe water supply; (7) households without access to sanitar y toilet facilities; (8) children 6�15 yearsold not in school; (9) households with income below the pover ty threshold; (10) households with income below the food threshold; (11) households thatexperienced hunger due to food shor tage; (12) unemployment; and (13) victims of crime. A higher index would mean more unmet needs and hence, worsecondition for the households.
33333 A household is considered to experience multiple deprivations if it is poor in at least two of the following dimensions: health, nutrition, tenure,housing, water, sanitation, education, income, job, and security.

The Many Faces of Poverty (Volume 5)
69
The Many Faces of Povertyin the City of Marikina
INDICATOR
DEMOGRAPHYPopulationAverage household sizeChildren under 1 year oldChildren under 5 years oldChildren 0-5 years oldChildren 6-11 years oldMembers 12-15 years oldMembers 6-15 years oldMembers 10 years old and aboveMembers of the labor force
HEALTH AND NUTRITIONChildren under 5 years old who diedWomen who died due to pregnancy related-causesMalnourished children 0-5 years old
HOUSINGHouseholds living in makeshift housingHouseholds who are informal settlers
WATER AND SANITAT IONHouseholds without access to improved water source1
Households without access to sanitary toilet facilities
BASIC EDUCATIONChildren 6-11 years old not attending elementary schoolChildren 12-15 years old not attending high schoolChildren 6-15 years old not attending schoolChildren 6-11 years old not attending schoolChildren 12-15 years old not attending school
INCOME AND LIVEL IHOODHouseholds with income below poverty thresholdHouseholds with income below food thresholdHouseholds who experienced hunger due to food shortageUnemployment rate (15 years old and above)
PEACE AND ORDERVictims of crime
Magnitude Proportion
Households Population
CBMS Core Indicators, City of Marikina, 2012
Propo r t ionMagnitude
5,81128,89034,36234,81924,16058,979
256,833 118,761
314,085
332
606
0.10.031.8
1,070 0.3
1,3879 11.7
CBMS Composite Indicator, City of Marikina, 2012
CBMS Composite IndicatorAvera ge
0.8
9,1694,303
79
11.65.40.1
3,2447,7732,412
9.332.24.1
1,0821,330
3.15.5
79,0774
5175,245
1,00015
0.76.6
1.30.02
1Considered as improved water sources are piped water into dwelling/yard/plot, public tap/stand pipe, tube well/borehole, protected orsemi-protected dug well, protected water from spring, rainwater and bottled water provided that the source of water used for otherhousehold needs are also from those mentioned above.

70
The Many Faces of Poverty (Volume 5)
Total Number of Households and Population, by Barangay, City of Marikina, 2012
B aran ga y Tota l households Tota l populat ion
BarangkaConcepcion DosConcepcion UnoFortuneIndustrial Valley ComplexJesus dela PeñaKalumpangMalandayMarikina HeightsNangkaParangSan RoqueSta. ElenaSto. NiñoTañongTumana
4,3193,8926,6806,8412,9391,6242,7719,5826,6277,6956,6293,3131,1125,2221,3768,455
15,23214,28726,34928,35011,4826,236
10,59140,41626,27231,30624,83112,0434,254
21,4975,203
35,736

The Many Faces of Poverty (Volume 5)
71
CBMS Poverty Maps: City of Marikina
Map 1. Proportion of Children under 5 Years Old who Died, by Barangay, 2012
B a ranga y Magn i t ude Pro po r t ion
B ot tom 10 Ba rangays
Sta. ElenaTumanaSto. NiñoMalandayConcepcion UnoBarangkaSan RoqueMarikina HeightsNangkaParang
21454311111
0.50.30.30.10.10.10.10.00.00.0

72
The Many Faces of Poverty (Volume 5)
Map 2. Proportion of Women who Died Due to Pregnancy-Related Causes,by Barangay, 2012
B a ranga y Magn i t ude Pro po r t ion
Bo ttom 2 B aranga ys
CBMS Poverty Maps: City of Marikina
FortuneTumana
11
0.20.1

The Many Faces of Poverty (Volume 5)
73
Map 3. Proportion of Children 0-5 Years Old who are Malnourished,by Barangay, 2012
B a ranga y Magn i t ude Pro po r t ion
B ot tom 10 Ba rangays
CBMS Poverty Maps: City of Marikina
Industrial Valley ComplexTumanaMarikina HeightsTañongSto. NiñoNangkaKalumpangSta. ElenaParangJesus dela Peña
6813970155482219346
5.12.92.72.62.42.32.12.11.31.3

74
The Many Faces of Poverty (Volume 5)
Table 1. Health and Nutrition Indicators, by Barangay, City of Marikina, 2012
B aran ga y Number ofch i ld ren
(0 -5 years old)
Malnour ishedch i ld ren
(0 -5 years old)
Propo r tion
Chi ld ren under5 years old
who died
Number ofch i ld ren( un de r
1 year old)
Women deaths dueto pregnancy- re lated
cau ses
Magn i tude Magn i tude Propor t ion Magn i tude Propor tion
Number ofch i ld ren( un de r
5 years old)
1,325870
2,3002,9041,099380826
4,2362,2062,9102,265785362
1,903493
4,026
1,5591,0672,7393,4311,327470993
5,0242,6213,5052,702925429
2,245573
4,752
12515386862132708234695415139
0.80.50.51.15.11.32.10.62.72.31.30.62.12.42.62.9
10300004111125014
0.10
0.10000
0.10.00.00.00.10.50.30
0.3
2671834506162298015583548256742615478364102823
0001000000000001
000
0.200000000000
0.1
BarangkaConcepcion DosConcepcion UnoFortuneIndustrial Valley ComplexJesus dela PeñaKalumpangMalandayMarikina HeightsNangkaParangSan RoqueSta. ElenaSto. NiñoTañongTumana

The Many Faces of Poverty (Volume 5)
75
CBMS Poverty Maps: City of Marikina
Map 4. Proportion of Households Living in Makeshift Housing, by Barangay, 2012
B a ranga y Magn i t ude Pro po r t ion
B ot tom 10 Ba rangays
TumanaSto. NiñoConcepcion DosParangKalumpangSta. ElenaConcepcion UnoNangkaJesus dela PeñaSan Roque
325634831114
121233
3.81.21.20.50.40.40.20.20.20.1

76
The Many Faces of Poverty (Volume 5)
Map 5. Proportion of Households who are Informal Settlers, by Barangay, 2012
B a ranga y Magn i t ude Pro po r t ion
Bo ttom 7 B aranga ys
CBMS Poverty Maps: City of Marikina
TumanaParangSto. NiñoConcepcion UnoConcepcion DosMalandayIndustrial Valley Complex
4,874191905313231
57.62.91.70.80.30.20.0

The Many Faces of Poverty (Volume 5)
77
CBMS Poverty Maps: City of Marikina
Map 6. Proportion of Households without Access to Safe Improved Source of Water,by Barangay, 2012
B a ranga y Magn i t ude Pro po r t ion
B ot tom 11 Ba rangays
TumanaSto. NiñoNangkaFortuneConcepcion UnoSta. ElenaParangMarikina HeightsConcepcion DosMalandayBarangka
701586451415
211911157
8.31.10.80.70.60.40.30.30.30.20.2

78
The Many Faces of Poverty (Volume 5)
Map 7. Proportion of Households without Access to Sanitary Toilet Facilities,by Barangay, 2012
B a ranga y Magn i t ude Pro po r t ion
Bo ttom 7 B aranga ys
CBMS Poverty Maps: City of Marikina
TumanaSta. ElenaMalandayConcepcion UnoFortuneIndustrial Valley ComplexNangka
5132211
0.10.10.00.00.00.00.0

The Many Faces of Poverty (Volume 5)
79
Table 2. Housing, Water and Sanitation Indicators, by Barangay, City of Marikina, 2012
Households l iv ing inmakeshi f t housing
Households who areinformal sett le rs
Households wi thout accessto improved source of
water
Households wi thout accessto san itar y to ilet facil it ies
B aran ga y
Pro po r t ionPro po r t ion Pro po r t ion Pro po r t ionMagn i tude Magn i tude Magn i tude Magn i tude
BarangkaConcepcion DosConcepcion UnoFortuneIndustrial Valley ComplexJesus dela PeñaKalumpangMalandayMarikina HeightsNangkaParangSan RoqueSta. ElenaSto. NiñoTañongTumana
048121131121123134630
325
01.20.20.00.00.20.40.00.00.20.50.10.41.20
3.8
0135301002300
19100900
4874
00.30.80
0.000
0.200
2.900
1.70
57.6
71141511101519642145581
701
0.20.30.60.70.00.10
0.20.30.80.30.10.41.10.18.3
0022100301001005
00
0.00.00.000
0.00
0.000
0.100
0.1

80
The Many Faces of Poverty (Volume 5)
Map 8. Proportion of Children 6-11 years old Not Attending ElementarySchool, by Barangay, 2012
B a ranga y Magn i t ude Pro po r t ion
B ot tom 10 Ba rangays
CBMS Poverty Maps: City of Marikina
Industrial Valley ComplexSta. ElenaSto. NiñoKalumpangSan RoqueMalandayFortuneBarangkaConcepcion DosJesus dela Peña
17962
30113313349832714111253
14.114.112.312.311.910.39.59.39.29.0

The Many Faces of Poverty (Volume 5)
81
CBMS Poverty Maps: City of Marikina
Map 9. Proportion of Children 12-15 years old Not Attending High School,by Barangay, 2012
B a ranga y Magn i t ude Pro po r t ion
B ot tom 10 Ba rangays
FortuneSta. ElenaConcepcion DosTumanaMarikina HeightsSan RoqueKalumpangIndustrial Valley ComplexMalandaySto. Niño
885112329
1,054661271243255
1,068523
38.436.435.034.132.832.732.732.132.031.7

82
The Many Faces of Poverty (Volume 5)
Map 10.A. Proportion of Children 6-15 years old Not Attending School,by Barangay, 2012
B ot tom 11 Ba rangays
B a ranga y Magn i t ude Pro po r t ion
CBMS Poverty Maps: City of Marikina
Sta. ElenaTumanaFortuneMarikina HeightsKalumpangMalandaySan RoqueNangkaIndustrial Valley ComplexJesus dela PeñaTañong
4947428221478
34275
223703430
6.56.24.94.54.34.23.83.63.43.33.3
The Many Faces of Poverty (Volume 5)
83
CBMS Poverty Maps: City of Marikina
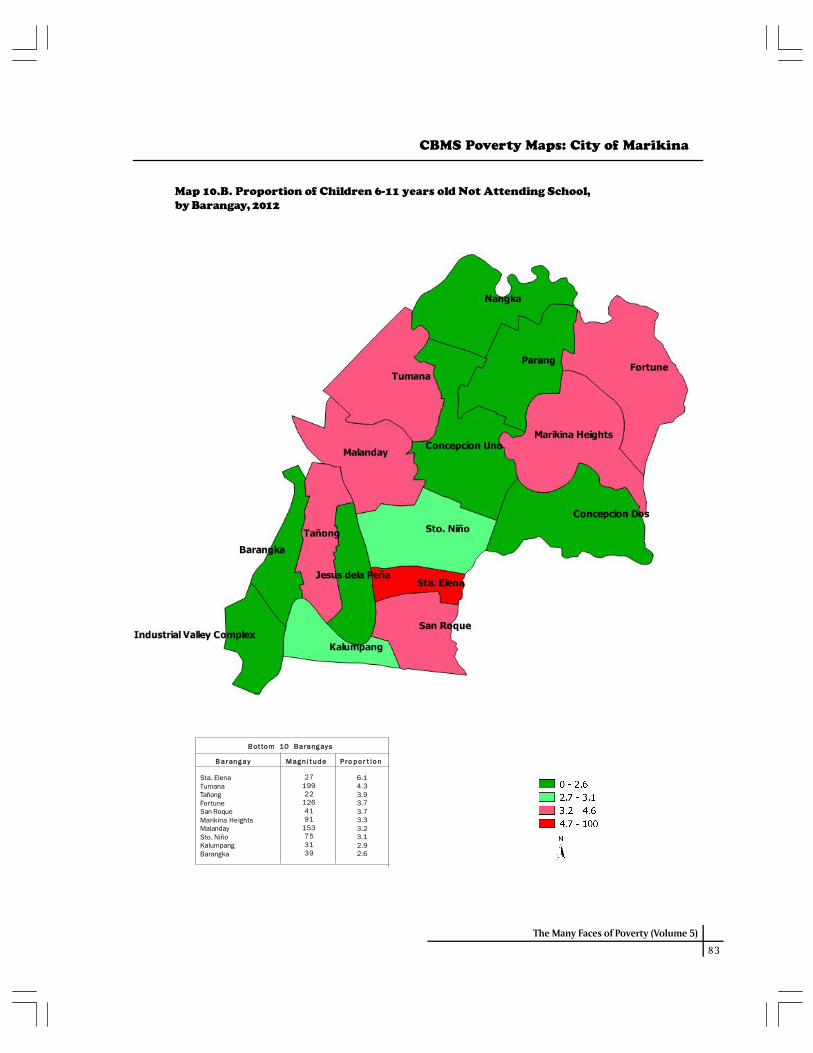
Map 10.B. Proportion of Children 6-11 years old Not Attending School,by Barangay, 2012
B ot tom 10 Ba rangays
B a ranga y Magn i t ude Pro po r t ion
Sta. ElenaTumanaTañongFortuneSan RoqueMarikina HeightsMalandaySto. NiñoKalumpangBarangka
2719922
1264191
153753139
6.14.33.93.73.73.33.23.12.92.6

84
The Many Faces of Poverty (Volume 5)
Map 10.C. Proportion of Children 12-15 years old Not Attending School,by Barangay, 2012
CBMS Poverty Maps: City of Marikina
B a ranga y Magn i t ude Pro po r t ion
B ot tom 10 Ba rangays
TumanaSta. ElenaFortuneKalumpangMarikina HeightsMalandayIndustrial Valley ComplexNangkaJesus dela PeñaConcepcion Uno
27522
15647
12318943
1352284
8.97.16.86.36.15.75.45.25.04.4

The Many Faces of Poverty (Volume 5)
85
Table 3. Education Indicators, by Barangay, City of Marikina, 2012
Number ofch i ld ren
(6 -11 years old)
Chi ldren not attend inge lementar y schoo l
(6-11 years old)
Number ofch i ld ren
(12-15 yea rs old)
Chi ldren not attend inghigh schoo l
(12-15 years old)
Number ofch i ld ren
(6 -15 years old)
Chi ldren notattend ing schoo l(6-15 years old)
B aran ga y
Magn i tude Magn it ude Magni tudePro po r t ion Pro po r t ion Pro po r t ion
BarangkaConcepcion DosConcepcion UnoFortuneIndustrial Valley ComplexJesus dela PeñaKalumpangMalandayMarikina HeightsNangkaParangSan RoqueSta. ElenaSto. NiñoTañongTumana
1,5101,2122,7193,4301,267586
1,0854,8422,7543,6072,6371,122441
2,442567
4,598
141112208327179531334982402441871336230150376
9.39.27.69.514.19.012.310.38.76.87.111.914.112.38.88.2
989939
1,9312,306794436742
3,3402,0142,5861,852830308
1,652352
3,089
260329587885255111243106866179954027111252375
1054
26.335.030.438.432.125.532.732.032.830.929.232.736.431.721.334.1
2,4992,1514,6505,7362,0611,0221,8278,1824,7686,1934,4891,952749
4,094919
7,687
7560145282703478342214223128754913330474
3.02.83.14.93.43.34.34.24.53.62.93.86.53.23.36.2

86
The Many Faces of Poverty (Volume 5)
Table 3.A. Education Indicators, by Barangay, City of Marikina, 2012
Number of children(6 -11 years old)
Chi ld ren not attending schoo l(6-11 years old)
Number of children(12-15 yea rs old)
Chi ld ren not attending schoo l(12-15 years old)
B aran ga y
Magn i tude Magn it udePro po r t ion Pro po r t ion
BarangkaConcepcion DosConcepcion UnoFortuneIndustrial Valley ComplexJesus dela PeñaKalumpangMalandayMarikina HeightsNangkaParangSan RoqueSta. ElenaSto. NiñoTañongTumana
39276112627123115391886341277522199
2.62.22.23.72.12.02.93.23.32.42.43.76.13.13.94.3
1,5101,2122,7193,4301,267586
1,0854,8422,7543,6072,6371,122441
2,442567
4,598
989939
1,9312,306794436742
3,3402,0142,5861,852830308
1,652352
3,089
363384156432247189123135653422588
275
3.63.54.46.85.45.06.35.76.15.23.54.17.13.52.38.9

The Many Faces of Poverty (Volume 5)
87
CBMS Poverty Maps: City of Marikina
Map 11. Proportion of Households with Income Below the Poverty Threshold,by Barangay, 2012
B a ranga y Magn i t ude Pro po r t ion
B ot tom 10 Ba rangays
TumanaMalandayFortuneNangkaJesus dela PeñaSta. ElenaKalumpangSto. NiñoMarikina HeightsTañong
1,,7971,,431
917939193126308575688143
21.314.913.412.211.911.311.111.010.410.4

88
The Many Faces of Poverty (Volume 5)
Map 12. Proportion of Households with Income Below the Food Threshold,by Barangay, 2012
CBMS Poverty Maps: City of Marikina
B a ranga y Magn i t ude Pro po r t ion
B ot tom 10 Ba rangays
TumanaMalandayJesus dela PeñaSta. ElenaKalumpangFortuneTañongSto. NiñoNangkaMarikina Heights
88268411566
15738475
278402330
10.47.17.15.95.75.65.55.35.25.0

The Many Faces of Poverty (Volume 5)
89
Map 13. Proportion of Households who Experienced Hunger due to FoodShortage, by Barangay, 2012
B ot tom 11 Ba rangays
B a ranga y Magn i t ude Pro po r t ion
CBMS Poverty Maps: City of Marikina
TañongBarangkaSto. NiñoSan RoqueJesus dela PeñaSta. ElenaTumanaMalandayNangkaConcepcion UnoFortune
6109842127754
0.40.20.20.20.20.20.10.10.10.10.1

90
The Many Faces of Poverty (Volume 5)
Households with incomebelow the pover ty th reshold
Households with incomebelow the food thresho ld
Households who exper iencedhunger due to food shor tage
Table 4. Income Indicators, by Barangay, City of Marikina, 2012
B aran ga y
Magn i tude Magn i t ude Magn i t udePro po r t ion Pro po r t ion Pro po r t ion
BarangkaConcepcion DosConcepcion UnoFortuneIndustrial Valley ComplexJesus dela PeñaKalumpangMalandayMarikina HeightsNangkaParangSan RoqueSta. ElenaSto. NiñoTañongTumana
305146519917269193308
1,431688939534279126575143
1,797
7.13.87.813.49.211.911.114.910.412.28.18.411.311.010.421.3
154621983841341151576843304022321506627875882
3.61.63.05.64.67.15.77.15.05.23.54.55.95.35.510.4
101541417072829612
0.20.00.10.10.00.20.00.10
0.10.00.20.20.20.40.1

The Many Faces of Poverty (Volume 5)
91
Map 14. Unemployment Rate (15 years old and above), by Barangay, 2012
CBMS Poverty Maps: City of Marikina
B a ranga y Magn i t ude Pro po r t ion
B ot tom 10 Ba rangays
Sto. NiñoTumanaTañongMalandayParangBarangkaConcepcion UnoNangkaFortuneIndustrial Valley Complex
1,1711,669290
1,8041,149748
1,2001,3021,162516
14.113.713.512.512.412.112.011.511.311.3

92
The Many Faces of Poverty (Volume 5)
Map 15. Proportion of Persons who are Victims of Crime, by Barangay, 2012
CBMS Poverty Maps: City of Marikina
B ot tom 12 Ba rangays
B a ranga y Magn i t ude Pro po r t ion
MalandaySan RoqueJesus dela PeñaSto. NiñoTumanaSta. ElenaConcepcion UnoNangkaParangMarikina HeightsBarangkaConcepcion Dos
2997438
10916019887561493423
0.70.60.60.50.40.40.30.20.20.20.20.2

The Many Faces of Poverty (Volume 5)
93
Table 5. Unemployment and Victims of Crime Indicators, by Barangay, City of Marikina, 2012
Unemployment rate(15 years old and above)
Persons who are victims ofcr imes
Number o f personsin the labor force
(15 years old and above)
B aran ga y
Pro po r t ionPro po r t ion Magn i t udeMagn i t ude
6,1746,0609,960
10,2894,5862,6304,361
14,45010,20311,2919,2725,0521,7798,2762,154
12,224
BarangkaConcepcion DosConcepcion UnoFortuneIndustrial Valley ComplexJesus dela PeñaKalumpangMalandayMarikina HeightsNangkaParangSan RoqueSta. ElenaSto. NiñoTañongTumana
748442
1,2001,162516293439
1,8041,1091,3021,149483102
1,171290
1,669
12.17.312.011.311.311.110.112.510.911.512.49.65.714.113.513.7
342388208381029949756174191093
160
0.20.20.30.10.10.60.10.70.20.20.20.60.40.50.10.4

94
The Many Faces of Poverty (Volume 5)
Map 16. CBMS Composite Indicator, by Barangay, 2012
B a ranga y Av e ra ge
Bo ttom 7 B aranga ys
CBMS Poverty Maps: City of Marikina
TumanaSto. NiñoMalandayFortuneJesus dela PeñaTañongNangka
1.20.40.40.40.40.40.4

The Many Faces of Poverty (Volume 5)
95
Table 6. CBMS Composite Indicator, by Barangay, City of Marikina, 2012
B aran ga y CBMS Composite Indicator
BarangkaConcepcion DosConcepcion UnoFortuneIndustrial Valley ComplexJesus dela PeñaKalumpangMalandayMarikina HeightsNangkaParangSan RoqueSta. ElenaSto. NiñoTañongTumana
0.30.20.30.40.30.40.30.40.30.40.30.30.30.40.41.2