Embed Size (px)
Citation preview

FED
ER
AL
EN
ER
GY
MA
NA
GE
ME
NT
PR
OG
RA
M
FEDERAL FACILITIES
SUSTAINABLE DESIGN
The Business Case for
IN
US Department of Energy
Energy Efficiency and Renewable Energy Bringing you a prosperous future where energy is clean abundant reliable and affordable
RESOURCE DOCUMENT
The Business Case for
SUSTAINABLE DESIGN IN FEDERAL FACILITIES We at the Department of Energy believe there can be a sound business
case for the use of sustainable design options and we encourage all
Federal agencies to incorporate these options whenever possible
ndash David Garman
Assistant Secretary
Office of Energy Efficiency and Renewable Energy
U S Department of Energy
The Federal government has many leaders in this field already and
together we can demonstrate that a sustainable building is healthier
more environmentally sound operationally and economically viable
and the way we should be doing business
ndash John L Howard Jr
Federal Environmental Executive
October 2003
On the cover National Institutes of Health Louis Stokes LaboratoriesBuilding 50 Bethesda MD Sandia National Laboratories Process and Environmental Technology Laboratory Albuquerque NM Zion National Park Visitors Center Springdale UT
Preface
Sustainable design is becoming a mainstream movement in the US architecture and construction industry and US government agencies have been both joining that movement and leading the way In the summer of 2001 the US Department of Energyrsquos Federal Energy Management Program (FEMP) and the US Navy initiated the Interagency Sustainability Working Group as a forum for Federal agency representatives located in the Washington DC area to share sustainable design experiences and information The government members of this group include
bull Coast Guard bull Department of Agriculture bull Department of Commerce
National Oceanic and Atmospheric Administration
bull Department of Defense Department of the Air Force Department of the Army Army Corps
of Engineers Army Environmental Center
Department of the Navy Naval Facilities Engineering Command
bull Department of Energy Lawrence Berkeley National Laboratory National Renewable Energy Laboratory Oak Ridge National Laboratory Pacific Northwest National Laboratory
bull Department of the Interior Fish and Wildlife Service National Park Service
bull Department of State bull Environmental Protection Agency bull Executive Office of the President
Office of the Federal Environmental Executive
Office of Management and Budget White House Task Force on Waste
Prevention and Recycling bull General Accounting Office bull General Services Administration bull Indian Health Service bull National Aeronautics and Space
Administration bull Postal Service bull State of California State and Consumer
Services Agency bull Tennessee Valley Authority
The group expressed a strong interest in communicating the business case for sustainable design In response FEMP initiated the effort documented in this report which focuses on providing solid arguments supported by defensible data to further justify the application of sustainable design principles in Federal agency construction projects Sustainable design is a natural extension of FEMPrsquos established role as an energy-efficiency renewable-energy and water-efficiency advocate in the Federal sector
Although the analysis in this document was targeted toward US government facilities the findings also have relevance to private-sector architects and engineers developers and contractors and building owners In a recent survey conducted by the US Green Building Council members of the Council said that better understanding the costs and benefits of sustainable design was a high priority Architectural and engineering firms that promote sustainable design have also expressed a need to communicate the business case
This document is a technical resource report containing cost information research results case studies and other quantitative and qualitative information pertaining to the business case for sustainable design It serves as a companion document to another shorter publication that summarizes the business case for sustainable design and construction Both documents can be found on the FEMP website httpwwweereenergygovfemp
iii
Executive Summary
What is Sustainable Design and Construction
Sustainability means choosing paths of social economic and political progress that meet the needs of the present without compromising the ability of future generations to meet their own needsi The concept of sustainability includes three key goals sometimes called the triple bottom line
bull Environmental stewardship ndash Protecting air water EEccononomomiicc PPrrososppeerriittyy land and ecosystems and conserving resources including fossil fuels thus preserving the Earthrsquos resources for future generations
bull Social responsibility ndash Improving the quality of life for individuals communities and society as a whole
bull Economic prosperity ndash Reducing costs adding value and creating economic opportunity for individuals organizations and communities
EEnnvviirroonnmmenenttaall SSttewewaarrddsshhiipp SSocociiaall RReessppononssiibbiilliittyy When designers apply these concepts to architecture they take a holistic look at all aspects of the design to minimize the use of energy materials and natural resources as well as the environmental impacts of the building and site Designers also try to maximize the quality of life inside the building and its positive effects on the surrounding community The principles of sustainable building design and construction include optimizing site potential minimizing energy consumption protecting and conserving water using environmentally preferable products enhancing indoor environmental quality and optimizing operational and maintenance practicesii
The Business Case for Sustainable Design and Construction
Many Federal designers and planners embrace the goals of environmental stewardship and social responsibility but capital budget constraints often stand in the way of smart design choices Federal managers need hard facts and figures to help articulate the business case for sustainable design Without clear information about the lifecycle costs and other benefits of design alternatives Federal decision-makers are likely to continue favoring traditional design choices
This document serves as a resource for people working on Federal and private-sector sustainable construction projects By providing significant financial evidence from research and case studies this document can help Federal designers make the case that sustainable design is a smart business choice
Sustainable Design and Construction in the Federal Sector
The Federal government has been leading by example in the field of sustainable design Many Federal agencies have developed policies to promote sustainable design concepts and their buildings are achieving prestigious silver and gold ratings from the Leadership for Energy and Environmental Design (LEEDtrade) rating system developed by the US Green Building Counciliii Federal laws and Executive Orders have established goals and provide guidance to building designers in the Federal sector for example government agencies are required to apply sustainable design principles and install energy and water conservation measures that have a payback period of less than 10 years Laws and Executive Orders also mandate that Federal managers use lifecycle cost analysis for all projects This approach supports the use of many sustainable design features because the annual cost savings from these features over their lifetimes can offset their sometimes-higher first costs However because capital budgets are usually preset for Federal construction projects government-building designers sometimes find it difficult to increase the capital budget to include the incremental first costs of some sustainable design features Nevertheless Federal agencies have found many creative ways to stay within their capital budgets while making their buildings green In fact sustainable design does not have to increase the cost of constructing a facility and in some cases may actually lower first costs as well as operating costs
v
The Benefits of Sustainable Design and Construction
A growing body of evidence shows that sustainable buildings reap rewards for building owners and operators building occupants and society The business case for sustainable design can be described using the triple bottom line framework The three categories of benefits are shown in the box below
At Zion National Park Visitors Center in Utah designers moved exhibit space outdoors and introduced natural cool-ing and lighting The building cost 30 less to build and reduces energy cost by 70 compared with a conventional facility that just meets code
When designers of the Penn-sylvania Department of Envi-ronmental Protectionrsquos Cambria Office Building first proposed an upgrade to triple-glazed double low-e windows the developer balked at the $15000 increase in cost However he was won over when the designers were able to demonstrate that the upgrade would allow them to eliminate the perimeter heating zone for a savings of $15000 downsize the heat pumps for another $10000 savings and increase floor space because of the smaller equipment and ducts for a gain of $5000 in rent
Laboratories are energy-intensive The Process and Environmental Technology Laboratory at Sandia National Laboratories in New Mexico spent just 4 more in their capital budget for energy-efficient technolo-gies saving enough energy to pay off that investment in about three years with continued savings for many years to come
Economic Benefits bull Lower (or equal) first costs bull Decreased annual energy costs bull Reduced annual water costs bull Lower maintenance and repair
costs bull Better productivity and less
absenteeism bull Indirect economic benefits to the
building owner eg lower risk ease of siting and improved image
bull Economic benefits to society eg decreased environmental damage costs lower infrastructure costs and local economic growth
Social Benefits bull Health comfort and well-
being of building occupants bull Building safety and security bull Commmunity and societal
benefits
Environmental Benefits bull Lower air pollutant emissions bull Reduced solid-waste
generation bull Decreased use of natural
resources bull Lower ecosystem impacts
Economic Benefits
Economic benefits of sustainable design can include both capital and operating cost savings as well as benefits such as productivity improvements and lower permitting costs derived indirectly from the very environmental and social benefits that sustainable buildings provide To realize the full benefits sustainable design must begin at the conceptual stage of a project and should be developed using an interdisciplinary team that examines integration of and tradeoffs among design features When the team chooses to include sustainable features often they can downsize or eliminate other equipment resulting in lower ( or equal) first costs for the sustainable design Renovating older buildings eliminating unnecessary features avoiding structural over-design and construction waste and decreasing the size of site infrastructure such as parking lots roads and sewers can also reduce first costs while providing environmental and social benefits Some sustainable features such as recycled carpet concrete with fly ash and no-water urinals can cost less than their traditional counterparts
Sustainable design also reduces annual operating costs Case studies show that energy use can be reduced by as much as 70 by incorporating energy-efficient and renewable energy systems with payback periods below 10 yearsiv Water-saving devices such as low-flow faucets and showerheads and no-water urinals can reduce water consumption significantly (eg from 25 gallons per minute to 10 gallons per minute for low-flow faucets) Payback periods for these devices are typically short ndash from immediate for no-water urinals to less than 3 years for low-flow showerheads
vi
Another key tenet of sustainable design is increased durability and ease of maintenance Concrete with fly ash is more durable than normal concrete potentially decreasing future repair costs and low-emitting (low-VOC) paint is also reported to be more durable than regular latex paint Sustainable landscaping typically decreases maintenance costs (eg for lawn care fertilizers and irrigation) and has a short payback period (eg less than a year)
Use of raised floors and underfloor HVAC and telecommunications systems as well as moveable wall partitions can reduce the churn cost (cost to reconfigure space and move people within the building) by over $2000 per person moved Given that an estimated 27 of people in a government building move each year reducing churn costs can save over $1 millionyr in a large building with 2000 workstations
Personnel costs in the US government far exceed construction energy or other annual costs Sustainable buildings potentially lower absenteeism and increase productivity A recent study estimated potential annual cost savings on the order of $25000 per 100 employees resulting from a one-time investment in better ventilation systems of $8000 per 100 employeesv Another study estimated that the value of improved productivity (including lower absenteeism) of office workers could be as high as $160 billion nationwidevi
Other indirect and longer-term economic benefits to the building owner include the following
bull Better worker retention and recruitment The environmental image associated with an employer that builds a sustainable building and the improved indoor environment within the building may reduce turnover improve morale and help create a more positive commitment to the employer as well as lower recruiting and training costs
bull Lower cost of dealing with complaints A recent study showed that increased occupant comfort could result in a 12 decrease in labor costs for responding to complaintsvii
bull Decreased risk liability and insurance rates Some insurance companies offer lower rates for buildings with energy-efficiency and other sustainable features Sustainable buildings also reduce the risk of liability from sick building syndrome and natural disasters
bull Greater building longevity If buildings do not have to be demolished and replaced the governments construction costs will be lower over the long run Some strategies for prolonging building use include selecting durable materials designing photovoltaic-ready roofs building foundations that will accept additional floors later and designing with classic and regionally appropriate styles
When workers at the West Bend Mutual Insurance Company moved into their new building with personal controls for their workstations and other sustainable features productivity increased 16
Some insurance companies offer insurance premium credits when the insured implement selected energy-savings strategies For example the nationrsquos largest professional liability insurer ndash DPIC ndash offers 10 credits for firms that practice commis-sioning and Hanover Insur-ance offered 10 credits for earth-sheltered or solar build-ings on the basis that their fuel-based heating system has fewer operating hours thus reducing fire risks
A study of the new headquarters for the Herman Miller furniture company indicates that the new sustainable building had positive impacts on occu-pants well-being job satisfaction feelings of belonging and other aspects of work life that affect indivi-dual job performance Productivity measured by the companyrsquos own total quality metrics increased when employees moved into the new space
vii
bull Better resale value In 1998 the US General Services Administrashytion sold over 1500 properties at a total selling price of about $250 million Investing in sustainable design features can considerably increase a propertys resale value because it lowers annual costs and makes a building more profitable for the new owner
bull Ease of siting Gaining early support from a community can greatly speed up approvals for a project For example the
Picture Kahujku Ranch Hawaii developers of Central Market a store in the town of Poulsbo Washington say that their decision to enhance an onsite wetland Although some would say that some-
thing like a unique ecosystem is and offer it to the city as a park not only reduced maintenance priceless certain groups within costs but also avoided project delays by generating strong American society do place economic community supportviii value on and are willing to pay for environmental and natural resources Benefits of sustainable design accrue not only to the building owner but For instance the Nature Conservancy
also to society at large For example energy-efficiency measures reduce is planning to invest $1 billion to save 200 of what they call the worlds ldquoLast public costs from pollution damages Studies estimate the costs to society Great Places of air pollutant emissions to be $100 to $7500 per metric ton for sulfur
dioxide (SO2) $2300 to $11000 per metric ton for nitrogen oxides (NOx) and $6 to $11 per metric ton for carbon dioxide (CO2)ix Sustainable development may also reduce taxpayerrsquos costs for municipal infrastructure (eg decreased need for landfills watersewage treatment plants and roads) and may foster regional economic growth through emerging businesses associated with sustainable buildings
Social Benefits
Sustainable buildings can improve the health and well-being of building occupants Sick building syndrome symptoms can be reduced by increased ventilation personal control over thermal conditions improvements in ventilation system maintenance and cleaning reduced use of pesticides and good maintenance Studies also show that building features such as stable and comfortable temperature operable windows views out usable controls and interfaces and places to go at break time have positive psychological and social benefits The benefits include reduced stress improved emotional functioning increased communication and an improved sense of belonging
Certain features of sustainable buildings can also foster occupant safety and security For instance improving control of building air distribution systems ndash including periodic calibration of sensors
ldquoIn the process of renovating the Pentagon weve found that sev-eral of the force protection mea-sures we are taking to protect the Pentagon against terrorist attacks are complementary to our sus-tainable construction efforts These are all examples of building security and energy efficiency working hand in handrdquo
Teresa Pohlman Special Assistant for Sustainable Construction US Department of Defense
adjustment of dampers and other system maintenance ndash is essential for rapid response to an emergency and contributes to energy-efficient operation under normal conditions Tighter building envelopes have the dual benefits of reducing energy losses from infiltration and making it easier to pressurize a building thus reducing entry of an airborne hazard that was released outside
Buildings that incorporate sustainable features also become models for others to follow and can improve the communities in which they are located For example the Herman Miller Corporationrsquos Green House regularly provides tours and outreach programs for design and construction professionals as well as for businesses that are planning their own sustainable buildings Communities may experience better environmental and aesthetic quality of life and less traffic congestion (when sustainable buildings make public transportation and bicycle storage accessible)
viii
Environmental Benefits
Many sustainable design strategies reduce disturbance of the natural environment Sustainable buildings emit lower levels of air pollutants and CO2 emissions due to decreased energy use achieved through energy-efficient design use of renewables and building commissionshying Waste reduction and reduced strain on landfills can be achieved by storing and collecting recyclables managing construction waste At the US Environmental Protection using recycled-content materials eliminating unnecessary finishes Agency campus in Research Triangle and using standard-sized or modular materials and durable products Park the design team justified the choice
to spend considerably more to build an Sustainable siting preserves woodlands streams and other natural aboveground garage instead of ground-
areas Using rapidly renewable materials (bamboo cork wheat straw level paved parking lot The team placed boards etc) and certified wood decreases the use and depletion of a high value on the 15 acres of natural long-cycle renewable materials and fosters better forest management woodlands that would have been
destroyed by the paved lot and biodiversity
The Costs and Benefits of Sustainable Design A Prototype Building Analysis
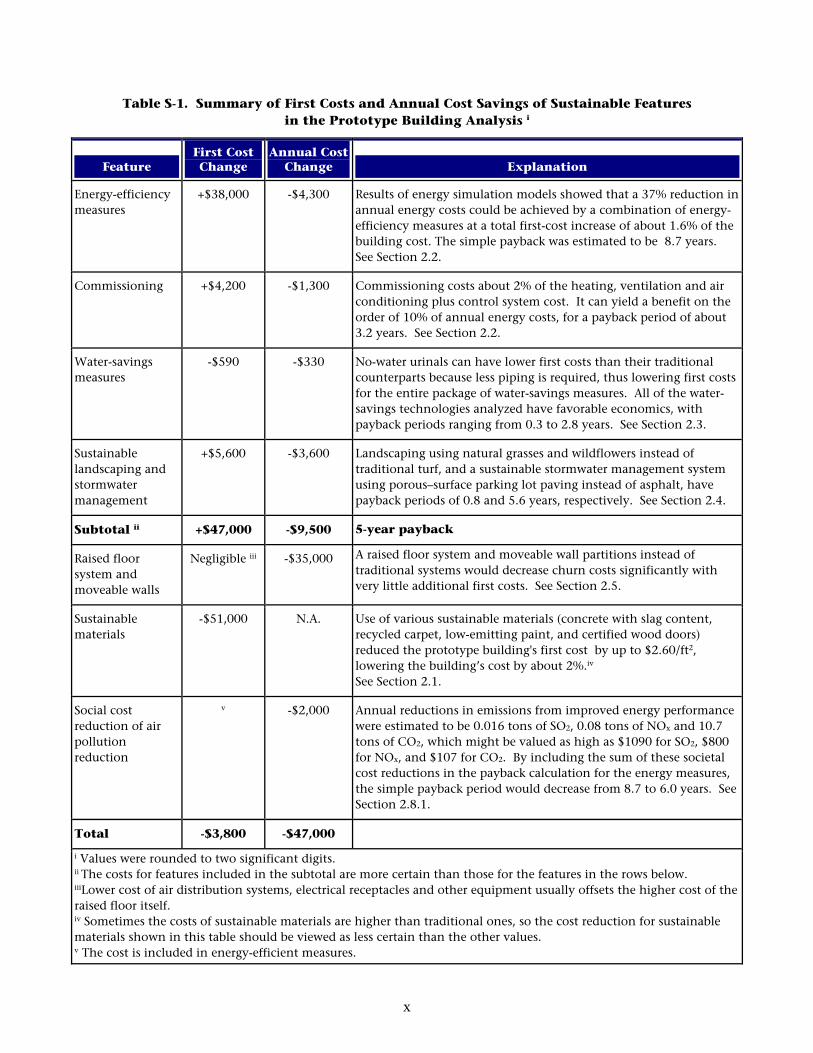
During this study analyses were conducted to evaluate the cost savings associated with various sustainable building features in a prototype two-story 20000-ft2 building hypothetically located in Baltimore Marylandx The total construction cost of the base- case building to
which the sustainable building was compared was estimated to be about $24 million The cost implications of adding sustainable features to this building were modeled using Energy-10 and DOE-2 supplemented by vendor quotes and other cost estimation techniques The results are summarized in Table S-1 which also shows which sections of the report discuss each feature
Although some features such as energy efficiency commissioning sustainable landscaping and storm-water management systems added about $47000 (2) to the original first cost of the building the annual cost savings associated with the sustainable features are significant Annual energy and water costs were reduced by $5900 and annual maintenance and repair costs for the landscaping and parking lot were reduced by $3600 compared with costs for the base-case building A reduction in churn costs (by using a raised floor) could lower annual costs by an additional $35000xi When the societal benefits of reducing air pollution are factored in the total annual cost reduction could be about $47000 comshypletely offsetting the first cost increase in the initial year of operation The first cost increase potentially could be further offset by using sustainable materials such as recycled carpet and concrete with fly ash
Building a Stronger Business Case for Sustainable Design and Construction
This document presents a sound business case for incorporating the principles of sustainability in the design and construction of Federal facilities In November 2002 the Federal Energy Management Program hosted a workshop to explore the information that would be needed to make this case even stronger The participants concluded that collecting data on a wide range of projects using consistent protocols for data collection reporting and use would help to more definitively assess the costs of sustainable building projects They also highlighted the need to develop a better understanding of the health well-being and other benefits to building occupants Because worker productivity is so important the workshop participants called for a better understanding of how productivity can be measured especially for knowledge workers who do not conduct routine tasks that are easily quantified The participants concluded that further dialogue is needed on methods to better understand the strategic business advantages of sustainable design
ix
Table S-1 Summary of First Costs and Annual Cost Savings of Sustainable Features in the Prototype Building Analysis i
Feature First Cost Change
Annual Cost Change Explanation
Energy-efficiency measures
+$38000 -$4300 Results of energy simulation models showed that a 37 reduction in annual energy costs could be achieved by a combination of energy-efficiency measures at a total first-cost increase of about 16 of the building cost The simple payback was estimated to be 87 years See Section 22
Commissioning +$4200 -$1300 Commissioning costs about 2 of the heating ventilation and air conditioning plus control system cost It can yield a benefit on the order of 10 of annual energy costs for a payback period of about 32 years See Section 22
Water-savings measures
-$590 -$330 No-water urinals can have lower first costs than their traditional counterparts because less piping is required thus lowering first costs for the entire package of water-savings measures All of the water-savings technologies analyzed have favorable economics with payback periods ranging from 03 to 28 years See Section 23
Sustainable landscaping and stormwater management
+$5600 -$3600 Landscaping using natural grasses and wildflowers instead of traditional turf and a sustainable stormwater management system using porousndashsurface parking lot paving instead of asphalt have payback periods of 08 and 56 years respectively See Section 24
Subtotal ii +$47000 -$9500 5-year payback
Raised floor system and moveable walls
Negligible iii -$35000 A raised floor system and moveable wall partitions instead of traditional systems would decrease churn costs significantly with very little additional first costs See Section 25
Sustainable materials
-$51000 NA Use of various sustainable materials (concrete with slag content recycled carpet low-emitting paint and certified wood doors) reduced the prototype buildings first cost by up to $260ft2 lowering the buildingrsquos cost by about 2iv
See Section 21
Social cost reduction of air pollution reduction
v -$2000 Annual reductions in emissions from improved energy performance were estimated to be 0016 tons of SO2 008 tons of NOx and 107 tons of CO2 which might be valued as high as $1090 for SO2 $800 for NOx and $107 for CO2 By including the sum of these societal cost reductions in the payback calculation for the energy measures the simple payback period would decrease from 87 to 60 years See Section 281
Total -$3800 -$47000
i Values were rounded to two significant digits ii The costs for features included in the subtotal are more certain than those for the features in the rows below iiiLower cost of air distribution systems electrical receptacles and other equipment usually offsets the higher cost of the raised floor itself iv Sometimes the costs of sustainable materials are higher than traditional ones so the cost reduction for sustainable materials shown in this table should be viewed as less certain than the other values v The cost is included in energy-efficient measures
x
Executive Summary Endnotes
i Brundtland Commission 1987 Our Common Future United Nations World Commission on Economic Development ii Principles are from the Whole Building Design Guide developed by a consortium of US government agencies See httpwwwwbdgorg
iii LEED has four ratings ndash platinum gold silver and certified The rating for a building is determined by adding the number of points the building achieves through its sustainable features See httpwwwusgbcorg
iv US DOE High Performance Buildings website See URL httpwwweereenergygovbuildingshighperformance
v Milton DK PM Glencross and MD Walters 2000 Risk of Sick Leave Associated with Outdoor Air Supply Rate Humidification and Occupant Complaints Indoor Air 2000 10212-221
vi Fisk WJ 2001 Estimates of potential nationwide productivity and health benefits from better indoor environments an update In Indoor Air Quality Handbook eds JD Spengler JM Samet and JF McCarthy McGraw-Hill New York
vii Federspiel C 2000 Costs of Responding to Complaints In Indoor Air Quality Handbook eds JD Spengler JM Samet and JF McCarthy McGraw-Hill New York
viii Rocky Mountain Institute website httpwwwrmiorgsitepagespid221php
ix National Research Council 2001 Energy Research at DOE Was It Worth It National Academy Press Washington DC p29
x Baltimore was chosen because it has both a moderately high heating and cooling load A moderately small office building was chosen because that size represents the 75th percentile within the current stock of office buildings in the US government and a similarly large percentage of private-sector buildings The base-case building used standard construction and met the ASHRAE 901-1999 standard for energy efficiency (this is also the baseline for LEED energy-efficiency credits)
xi This summary uses the conservative (low) end of the cost-savings range that was estimated
xi
Acknowledgements
The Federal Energy Management Program (FEMP) would like to acknowledge many organizations and individuals who contributed to this resource document
The work was conducted under the direction of Beverly Dyer and Anne Sprunt Crawley of FEMP Marylynn Placet of Pacific Northwest National Laboratory (PNNL) served as the Principal Investigator Other people who made contributions to analysis and writing of the report include David Winiarski Judith Heerwagen Steve Shankle Kate McMordie-Stoughton Kimberly Fowler John Hail Bing Liu Dave Hunt Donna Hostick and Kathy Poston of PNNL Andrew Walker of the National Renewable Energy Laboratory Jeffrey Harris William Tschudi and Evan Mills of Lawrence Berkeley National Laboratory David Zimmerman Tennessee Valley Authority (TVA) Joseph Fiksel of Eco-Nomics LLC and James Toothaker (consultant)
Support for development of various case studies was provided by Ralph Wrons Sandia National Laboratories Steve Dorer Phil Wirdzek Bob Beane Christopher Long and Peter Shubert US Environmental Protection Agency Roy Sieber ERG Ken Trychta Argonne National Laboratory James Toothacker consultant and Janice Lin PowerLight Corporation
Vicki Lee of Lee Scientific Communications in Richland Washington served as the editor Carl Costello and Jennifer Landsman-Ayres of Greening America developed a shorter version of this report (available on the FEMP website httpwwweereenergygovfemp) and provided support for graphics in this longer resource document
Members of the Interagency Sustainability Working Group offered useful review and comments on early versions of the report Arun Jhaveri US Department of Energy-Seattle Jonathan Herz and Don Horn US General Service Administration Fredrik Wiant Army Corps of Engineers Cathy Berlow and Alison Kinn US Environmental Protection Agency David Zimmerman TVA John Moresko US Department of the Interior Michael Chapman Navy Facilities Command Anila Strahan National Aeronautic and Space Administration Jeffrey Harris Rick Diamond and Satish Kumar Lawrence Berkeley National Laboratory Andrew Nicholls PNNL and staff members at Oak Ridge National Laboratory
This report is dedicated to the memory of Fredrik (Rik) Wiant an active member of the Interagency Sustainability Working Group who demonstrated his dedication to sustainable design principles during his career at the Army Corps of Engineers
xiii
Acronyms and Initialisms
AC air changes ACH air changes per hour ASHRAE American Society of Heating Refrigerating and Air Conditioning Engineers BEES Building for Environmental and Economic Sustainability BGE Baltimore Gas and Electric Company BIDS Building Investment Decision Support CFC chlorofluorocarbon cfm cubic feet per minute CO2 carbon dioxide COP coefficient of performance CSC Customer Service Center DEP Department of Environmental Protection DOE US Department of Energy DWP Department of Water and Power (Los Angeles) ECM energy conservation measure EE energy efficient EER energy-efficiency ratio EPA US Environmental Protection Agency EPAct Energy Policy Act of 1992 ESPC Energy Services Performance Contract FEMP Federal Energy Management Program gpf gallons per flush gpm gallons per minute GSA US General Services Administration HCFC hydrofluorocarbon HVAC heating ventilation and air conditioning IFMA International Facility Management Association kWh kilowatt-hour Ls literssecond LEEDtrade Leadership in Energy and Environmental Design NERL New England Regional Laboratory NOx nitrogen oxides NOI net operating income NPDES National Pollutant Discharge Elimination System NREL National Renewable Energy Laboratory OampM operations and maintenance PECI Portland Energy Conservation Inc PNNL Pacific Northwest National Laboratory ppm parts per million psi pounds per square inch PV photovoltaic RCSOB Rachel Carson State Office Building SAD Seasonal Affective Disorder SBS sick building syndrome SCROB South Central Regional Office Building SO2 sulfur dioxide TQM Total Quality Management
xv
TVA Tennessee Valley Authority USPS US Postal Service UV ultraviolet VOC volatile organic compound WBDG Whole Building Design Guide
xvi
Contents
Preface iii
Executive Summary v
Acknowledgements xiii
Acronyms and Initialisms xv
1 Introduction 1-1
11 What is Sustainable Design and Construction 1-1 12 Sustainable Design and Construction in the Federal Government Sector 1-3 13 A Framework for Understanding the Benefits of Sustainable Design and
Construction 1-4
2 The Economic Benefits of Sustainable Design 2-1
21 Lower (or Equal) First Costs 2-1 22 Annual Energy Cost Savings 2-7 23 Annual Water Cost Savings 2-12 24 Lower Costs of Facility Maintenance and Repair 2-16 25 Lower Churn Costs 2-17 26 Lower Absenteeism and Improved Productivity2-20 27 Other Economic Benefits to the Building Owner 2-27 28 Indirect Economic Benefits to Society 2-32
3 The Social Benefits of Sustainable Design 3-1
31 Better Health of Building Occupants 3-1 32 Improved Comfort Satisfaction and Well-Being of Building Occupants 3-4 33 Occupant Safety and Security 3-5 34 Community and Societal Benefits 3-8
4 The Environmental Benefits of Sustainable Design 4-1
41 Lower Air Pollutant and Greenhouse Gas Emissions 4-2 42 Reduced Volumes of Solid Waste4-5 43 Decreased Use of Natural Resources and Lower Ecosystem Impacts 4-7
5 Strengthening The Business Case Research and Data Needs 5-1
6 References 6-1
List of Appendixes
Appendix A Matrix of Benefits of Sustainable Design A-1
Appendix B Energy and Construction Cost Estimates B-1
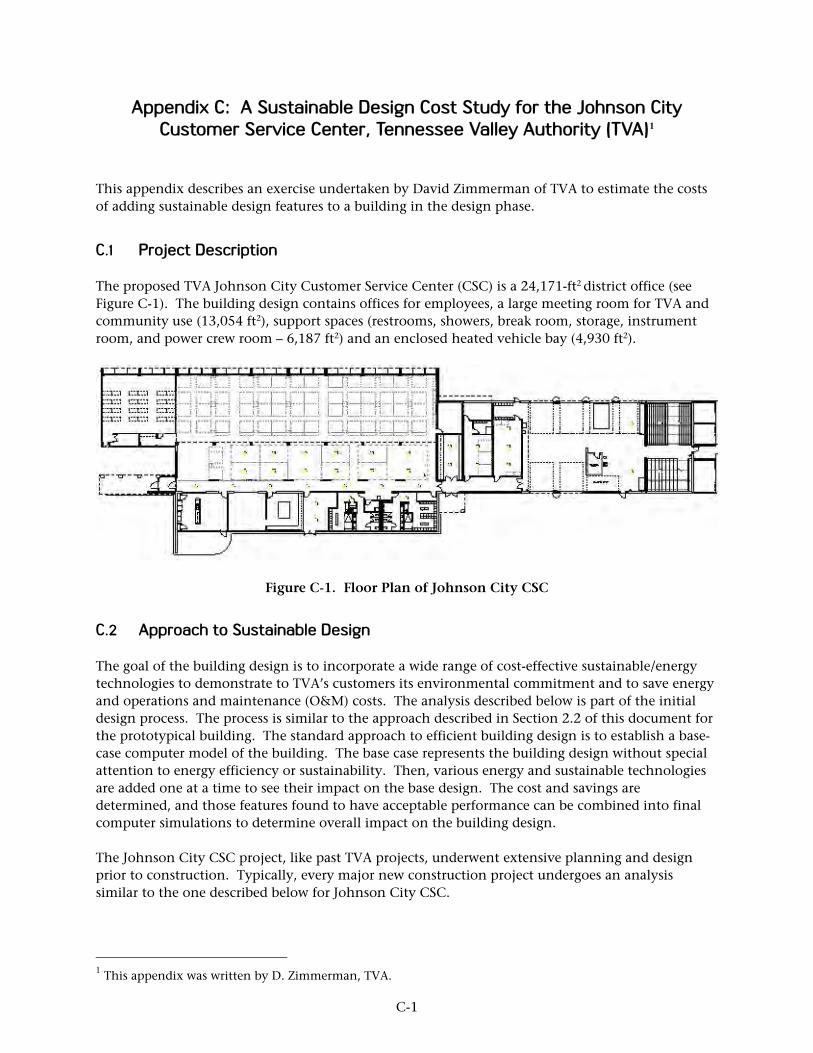
Appendix C A Sustainable Design Cost Study for the Johnson City Customer Service Center Tennessee Valley Authority (TVA) C-1
Appendix D Documentation of the Sustainable Siting and Water-Savings Features Included in the Prototype Building AnalysisD-1
xvii
Appendix E Documentation of the Sustainable Materials Features Included in the Prototype Building Analysis E-1
Appendix F Detailed Discussion of Research Studies on Occupant Health Comfort and Productivity F-1
List of Case Studies and Research Summaries
Case Study 2-1 Zion National Park Visitors Center Reduces Energy Consumption While Cutting Construction Costs 2-5
Case Study 2-3 US Environmental Protection Agency (EPA) Facility in Michigan
Case Study 2-4 Argonne National Laboratorys Central Supply Facility Reduces Costs
Research Summary 2-1 Pennsylvanias Department of Environmental Protection
Research Summary 2-3 Personal Environmental Controls at West Bend Mutual
Research Summary 3-1 Improved Ventilation Rates and Lower CO2 Concentrations
Research Summary 3-3 Energy-Efficiency Upgrades Offer Opportunities for
Case Study 4-2 Construction Waste Management and Other Recycling Measures Reduce
Case Study 2-2 Facility at Sandia National Laboratories Reduces Energy Costs2-11
Reduces Water Consumption by 80 2-14
Through Sustainable Landscaping 2-18
Estimates the Cost of Churn 2-21
Research Summary 2-2 Improved Indoor Air Quality Reduces Absenteeism Costs 2-23
Insurance Company Improve Worker Productivity 2-25
Reduce Illness Symptoms in Office Workers 3-3
Research Summary 3-2 Herman Miller Improves Worker Satisfaction and Productivity 3-6
Improved Building Security 3-10
Case Study 4-1 Post Office in Marina Del Rey Improves Air Quality 4-4
Costs and Waste at EPAs New England Regional Laboratory 4-6
Case Study 4-3 EPAs Campus Protected Natural Resources at No Additional First Cost 4-10
List of Figures
1-1 Triple Bottom Line Benefits of Sustainable Design 1-5
2-1 Energy-Efficiency Measures Examined in the Prototype Building Analysis 2-8
xviii
List of Tables
S-1 Summary of First Costs and Annual Cost Savings of Sustainable Features in the Prototype Building Analysis x
1-1 Benefits of Sustainable Design and Construction 1-7
2-1 Prototype Building Analysis Energy-Efficiency Features Reduce Annual Energy Costs by 37 2-8
2-2 Prototype Building Analysis Costs and Benefits of Energy-Efficiency Measures 2-9
2-3 Costs of Commissioning for New Construction 2-10
2-4 Prototype Building Analysis Cost Data for Water-Efficiency Features 2-12
2-5 Prototype Building Analysis Costs for Sustainable Siting Features 2-16
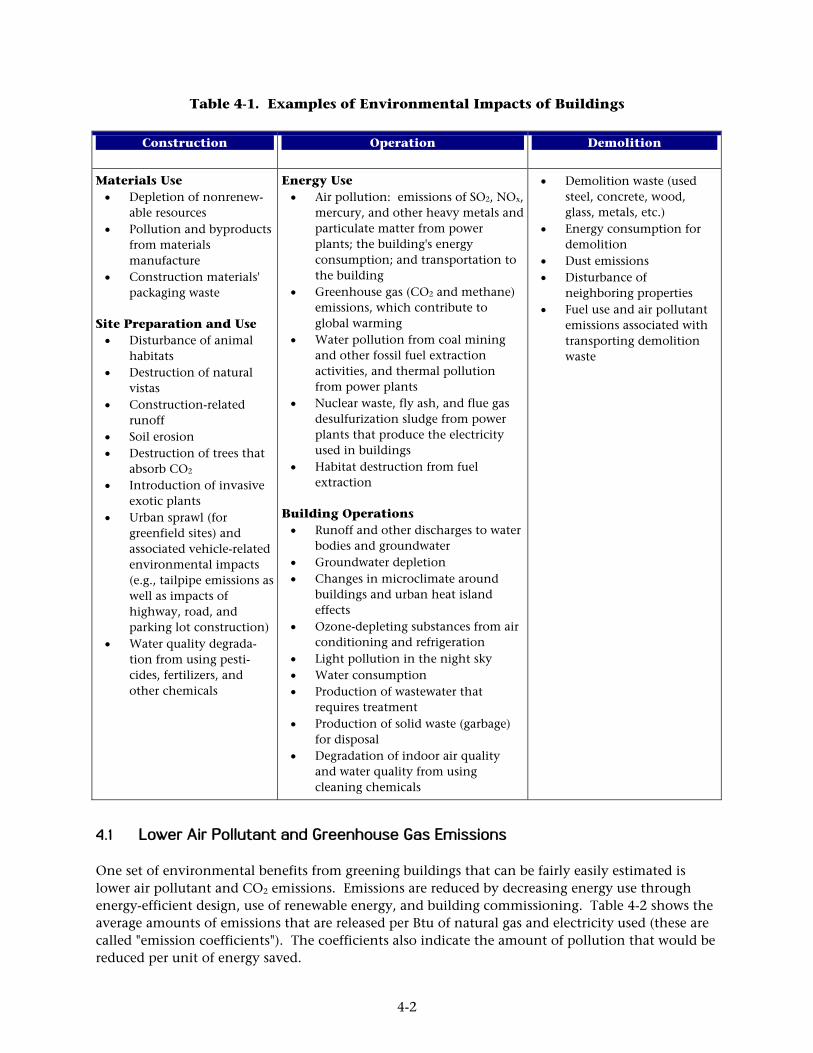
4-1 Examples of Environmental Impacts of Buildings 4-2
4-2 Emission Coefficients for Energy Consumption in Commercial Buildings4-3
5-1 Status of Business Case Information 5-2
5-2 Key Recommendations from Participants in the Sustainable Design Business Case Workshop 5-5
xix
A Strong Energy Portfolio for a Strong America
Energy efficiency and clean renewable energy will mean a stronger economy a cleaner environment and
greater energy independence for America By investing in technology breakthroughs today our nation can look
forward to a more resilient economy and secure future
Far-reaching technology changes will be essential to Americas energy future Working with a wide array of
state community industry and university partners the US Department of Energys Office of Energy Efficiency
and Renewable Energy invests in a portfolio of energy technologies that will
- Conserve energy in the residential commercial industrial government and transportation sectors
- Increase and diversify energy supply with a focus on renewable domestic sources
- Upgrade our national energy infrastructure
- Facilitate the emergence of hydrogen technologies as vital new energy carriers
THE OPPORTUNITIES
Biomass Program Using domestic plant-derived resources to meet our fuel power and chemical needs
Building Technologies Program Homes schools and businesses that use less energy cost less to operate and ultimately generate as much power as they use
Distributed Energy amp Electric Reliability Program A more reliable energy infrastructure and reduced need for new power plants
Federal Energy Management Program Leading by example saving energy and taxpayer dollars in federal facilities
FreedomCAR amp Vehicle Technologies Program Less dependence on foreign oil and eventual transition to an emissions-free petroleum-free vehicle
Geothermal Technologies Program Tapping the Earths energy to meet our heat and power needs
Hydrogen Fuel Cells amp Infrastructure Technologies Program Paving the way toward a hydrogen economy and net-zero carbon energy future
Industrial Technologies Program Boosting the productivity and competitiveness of US industry through improvements in energy and environmental performance
Solar Energy Technology Program Utilizing the suns natural energy to generate electricity and provide water and space heating
Weatherization amp Intergovernmental Program Accelerating the use of todays best energy-efficient and renewable technologies in homes communities and businesses
Wind amp Hydropower Technologies Program Harnessing Americas abundant natural resources for clean power generation
US Department of Energy
Energy Efficiency and Renewable Energy Bringing you a prosperous future where energy is clean abundant reliable and affordable
Federal Energy Management Program
For more information or to order materials contact the FEMP Help Desk at
800-363-3732 or visit us at
wwweereenergygovfemp
October 2003
US Department of Energy
Energy Efficiency and Renewable Energy
FEMP works to reduce the cost and environmental impact of the Federal gover
Feder management decisions at
nment by advancing energy efficiency and water conservation promoting the use of distributed and renewable energy and improving utility
al sites
Introduction
As concern for the environmental and societal impacts of modern development increases Federal decision-makers are being faced with a challenge how can the government build operate and maintain facilities that minimize impacts on the environment and provide a healthy productive and secure work places without increasing costs This document serves as a resource to parties involved in both Federal government and private-sector construction projects to help them dispel mistaken assumptions and to better defend the decision to incorporate the principles of sustainability in their projects The business case for sustainable design and construction focuses on economic benefits but as the document reveals some economic benefits are actually derived indirectly from the very environmental and social benefits that sustainable buildings provide
This section explains the basic philosophical underpinnings of the sustainable design and construction movement provides some background on sustainable design in a Federal context and introduces the triple bottom line framework ndash economic social and environmental ndash that is used in this document for examining the benefits of sustainable design and construction
What is Sustainable Design and Construction
The concept of sustainable development grew from the concern that the world populationrsquos consumption of resources and production of wastes could exceed the earthrsquos capacity to produce those resources and absorb those wastes In 1987 the United Nations World Commission on the Environment (the Brundtland report) defined sustainable development as those paths of social economic and political progress that meet the needs of the present without compromising the ability of future generations to meet their own needs
The concept of sustainability includes three goals or cornerstones
bull Environmental stewardship ndash protecting air water land and ecosystems as well as conserving resources including fossil fuels thus preserving the earthrsquos resources for future generations
bull Social responsibility ndash improving the quality of life and equity for individuals communities and society as a whole
bull Economic prosperity ndash reducing costs adding value and creating economic opportunity for individuals organizations communities and nations
This triple bottom line framework as it is often called shows the three cornerstones as separate components to make sure all three are emphasized Advocates believe that only by pursuing all three of these interrelated goals will the earth return to a sustainable path Organizations that apply this framework in their decision-making recognize that by considering the environmental and social impacts of their actions as well as traditional short-term financial indicators they may increase their prospects of sustainable long-term success
To achieve tangible results the principles of sustainable development must be translated into practical guidelines that can be applied in the real world Sustainable design involves shifting away from processes and products that pollute use nonrenewable resources and have other negative consequences for society and moving toward products and processes with minimal environmental and natural resource impact and that provide benefits to society Several frameworks have been developed to help designers of all kinds of products including buildings and facilities take steps toward the goals of improving societal well-being and minimizing pollution and natural resource depletion
1-1
One of the important sustainable design frameworks for buildings is called Leadership in Energy and Environmental Design (LEEDtrade) Developed by the US Green Building Council LEED is a voluntary consensus-based rating system that awards different levels of green building certification based on total credit points earned 1 LEED gives credits for incorporating specific sustainable design strategies into a building The design strategy categories (and their potential points out of a possible total of 69) include the following
bull Sustainable sites (14) bull Water efficiency (5) bull Energy and atmosphere (17) bull Materials and resources (15) bull Indoor environmental quality (13) bull Innovation and design process (5)
The US Green Building Council plans to update the rating system periodically and add new categories of buildings (the currently approved system is for commercial buildings)2
The Federal government has also developed various tools and guidelines for increasing the sustainability of buildings and facilities A major contribution was the development of the Whole Building Design Guide (WBDG) a web-based resource providing information and resources to support sustainable design 3 This guidance was produced and is updated through an interagency effort Similar to the LEED principles the fundamental strategies for sustainable design in the WBDG include the following
bull Optimizing site potential bull Minimizing energy consumption bull Protecting and conserving water bull Using environmentally preferable products and materials bull Enhancing indoor environmental quality bull Optimizing operations and maintenance (OampM) practices
Another concept that underpins sustainable design is integrating the architectural and mechanical features of the facility to minimize energy and resource use and reduce cost while maintaining comfort When project developers commit early to a high level of building integration they can more effectively By the time 1 of project costs are exploit cost-effective tradeoffs Integrating sustainable design spent roughly 70 of the life-cycle principles early in the process is also important because that cost of the building has been deter-
is when the project-defining decisions (and major design mined by the time 7 of costs have been spent up to 85 of life-cycle mistakes) are made (Lotspeich et al 2002) Sustainable design costs have been determined considerations should be included in solicitations for
architectural and engineering services the Program of Lotspeich et al (2002) Requirements and the contracts as well as in the value engineering process (See Case Study 4-3 in Section 4)
1 To become certified a building must earn between 26 and 32 points to obtain a silver rating ndash 33 to 38 points a gold rating ndash 39 to 51 points and a platinum rating ndash 52 or more points 2 More information about the rating system can be obtained from httpwwwusgbcorg 3 See httpwwwwbdgorgindexasp
1-2
Sustainable Design and Construction in the Federal Government Sector
The business case for sustainable design takes on special meaning when discussed in the context of the Federal government whose mission is to protect the well-being of the nation As a rule the government wants to provide an example for others to follow by reducing environmental impacts lowering energy and resource use and having positive social impacts on its employees and the communities surrounding its facilities
Government efforts to implement sustainable design have potentially large impacts The Federal government owns about 500000 facilities worldwide valued at more than $300 billion (National Research Council 1998) It spends over $20 billion annually on acquiring or substantially renovating Federal facilities and it uses over $35 billion annually for energy to power heat and cool its buildings (Federal Facilities Council 2001) In addition the government spends almost $200 billion for personnel compensation and benefits for the civilian employees occupying these buildings (US Office of Personnel Management 2003) Building designs that reduce energy consumption while also providing a healthy and pleasant environment for occupants will result in more cost-efficient government operations and lower environmental impacts that affect the public
The Federal governmentrsquos building-related energy costs have The Federal government has many
dropped over 23 per square foot between 1985 and 2001 leaders in this field already and saving taxpayers $14 billion annually 4 These savings are the together we can demonstrate that a
sustainable building is healthier direct result of a number of Federal laws and Executive more environmentally sound Orders The Energy Policy Act (EPAct) of 1992 was the latest operationally and economically in a series of laws since 1975 that have recognized the Federal viable and the way we should be governmentrsquos own role as a very large consumer of energy doing business and other products EPAct provided guidance on how to
improve energy performance and set goals for Federal energy John L Howard Jr
and water use and required all government buildings to Federal Environmental Executive install energy and water conservation measures that have a payback period of less than 10 years
The Federal commitment to green buildings was further advanced by the promulgation of several key Executive Orders later in the 1990s In June 1999 the White House promulgated Executive Order 13123 requiring agencies to apply sustainable design principles to the design and construction of new facilities and setting goals for reducing energy use beyond EPAct levels lowering greenhouse gas emissions and water consumption and increasing renewable energy and green power purchasing It also mandated that agencies build showcase facilities with advanced energy-efficiency technologies
Executive Order 13123 and EPAct emphasize the need for lifecycle5 cost-effective solutions In other words government agencies were asked to compare options based on costs over the lifetime of the facility and its equipment not just on initial capital outlays Lifecycle-cost analysis often supports adding sustainable design features because the annual cost savings associated with these features over their lifetimes often offset higher first costs On the other hand the cost-effectiveness requirement can be an impediment to some sustainable design features that are more expensive on a lifecycle basis than their traditional counterparts
4 Personal communication with C Tremper McNeil Technologies Springfield Virginia 5 Lifecycle cost represents the first cost plus the replacement costs (discounted to present value)that occur over the lifetime of the equipment minus the discounted present value of the stream of cost savings
1-3
Despite the lifecycle costing requirements government project managers still find it hard to include all the sustainable design features they would like to see in building projects Because OampM costs are appropriated and managed separately from capital expenditures agencies find it difficult within their normal budgeting process to use lifecycle cost analysis which intertwines capital and OampM into one comprehensive metric Capital budgets are usually preset for construction projects so increasing the budget to include the extra cost of sustainable design features is difficult Interpretations of how lifecycle costs should be considered in government construction projects vary between agencies and even within agencies
Nevertheless as this report documents Federal agencies have found creative ways to stay within capital budgets while making their buildings green and many Federal agencies have developed policies and programs to support sustainable design Although policies vary from agency to agency most encourage the use of LEED or some similar system For example the Army worked with the US Green Building Council to develop the Sustainable Project Rating Tool (SPiRit) an adaptation of LEED that meets the specific needs of the Army
A Framework for Understanding the Benefits of Sustainable Design and Construction
Questions raised about sustainable design often include the following What does it cost What are the benefits To help answer these questions this document uses the triple bottom line benefits framework described in Section 11 and applies it to sustainable building design and construction as depicted in Figure 1-1 The three categories of benefits ndash economic social and environmental ndash were fully explored and each type of benefit was documented with hard evidence to the extent possible
Economic benefits to the building owner include first-cost and operating-cost savings In addition as Figure 1-1 indicates environmental and social benefits can lead to economic benefits for building owners For example sustainable design efforts to improve the quality of the indoor environment can result in lower absenteeism and higher productivity of building occupants and hence lower personnel costs and the buildingrsquos better environmental profile can reduce the time for and cost of permitting the facility In addition to the building owner other stakeholders such as neighbors local and state governments and society as a whole may reap economic benefits including lower damage costs from pollution reduced municipal infrastructure costs and localregional economic growth due to the emerging businesses related to sustainable design and construction
A principal social benefit of sustainable design is the improved health satisfaction and well-being of building occupants Sustainable design features can also go hand in hand with improved building safety and security Federal facilities designed using the principles of sustainability can also have positive social impacts on the surrounding community such as the transfer of pollution prevention and recycling practices to the private sector increased use of public or alternative transportation and improved brownfield sites 6
6 Brownfields are abandoned idled or underused industrial and commercial facilities where expansion or redevelopment is complicated by real or perceived environmental contamination (httpwwwepagovebtpagescleabrownfieldshtml)
1-4
Ease of siting and improved image as an environmentally conscious organization lead to economic benefits
Increased and lower turnover rates lead to economic benefits
Economic Benefits
Cost savings and economic benefits for the organization and its stakeholders
Improved quality of life for facility occupants and society as a whole
Environmental protection and resource conservation on a local regional and global scale
productivity
Environmental Benefits Social Benefits
Figure 1-1 Triple Bottom Line Benefits of Sustainable Design
Environmental benefits have been a main driver behind the sustainable design movement Sustainable facilities typically use lower amounts of fossil fuels create less air pollution and greenhouse gas emissions result in less waste for disposal in landfills consume less water and other natural resources use fewer virgin building materials disturb less land and are more sensitive to existing ecosystems
Three principal forms of evidence of the benefits of sustainable design form the basis for the documentation presented in this document
bull First under Federal Energy Management Programrsquos (FEMPs) direction the Pacific Northwest National Laboratory (PNNL) and the National Renewable Energy Laboratory (NREL) conducted engineering cost analyses to estimate the potential cost savings associated with various sustainable features in buildings One challenge encountered when developing the business case is that there is no comprehensive source of data on the costs of sustainable design features To address this challenge this study developed typical costs based on available data from various sources including vendors of sustainable building products Cost savings were estimated for a prototype two-story 20000-ft2 office building hypothetically located in Baltimore Maryland7 The analysis estimated lifecycle cost savings associated with improving energy-efficiency commissioning the building reducing water consumption using sustainable landscaping approaches using underfloor systems to reduce churn costs and choosing sustainable building materials
7 Baltimore was chosen because it has both a moderately high heating and cooling load A moderately small office building was chosen because that size represents the 75th percentile within the current stock of office buildings in the US government and a similarly large percentage of private-sector buildings
1-5
In Sections 2 3 and 4 of this document the portions of the text that discuss this prototype building analysis are identified with the green building icon (left)
bull Second the document contains numerous real-world case studies that illustrate the benefits of sustainable design These case studies document benefits achieved in both government and private-sector building projects
bull Third the document includes summaries of research studies that rigorously examined benefits such as improved occupant productivity health and well-being associated with various sustainable design features
The results of this data-gathering exercise show that a strong business case for sustainable design exists Table 1-1 summarizes the economic social and environmental benefits of the six principal elements of sustainable design which correspond closely to the categories in the LEED rating system and the WBDG
The next three sections of this document expand on each of the columns in the figure and provide the available evidence for the economic (Section 2) social (Section 3) and environmental (Section 4) benefits shown in Table 1-1 The table indicates which subsection discusses each type of benefit The final section of the main body of the document (Section 5) describes the kind of data and information that could be gathered to make the business case for sustainable design and construction even stronger than it is today Section 6 lists the references cited in this study
Several appendixes provide additional detail and data and are included at the end of the document Appendix A expands Table 1-1 into a much more detailed list of sustainable design features and their economic social and environmental benefits Appendix B provides details on the energy analysis conducted for the prototype building analysis Appendix C describes the results of an exercise similar to the prototype building analysis which examined the costs and benefits of the range of sustainable design features in a building at the Tennessee Valley Authority Appendixes D and E summarize the analysis of sustainable siting and water-saving features and the sustainable materials analysis respectively Appendix F contains a detailed discussion of the body of research conducted on occupant productivity health and comfort and satisfaction
1-6
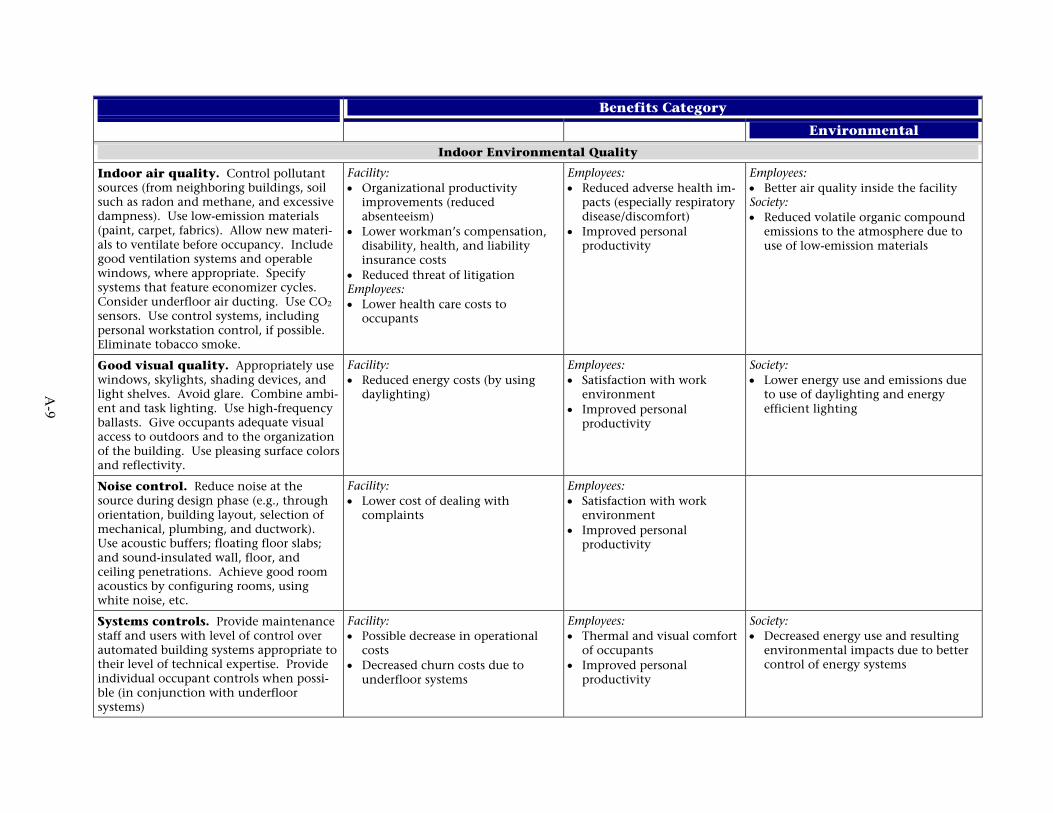
Table 1-1 Benefits of Sustainable Design and Construction
Element Economic Benefits Social Benefits Environmental Benefits
Sustainable Reduced costs for site preparashy Improved aesthetics (eg Land preservation Lower siting tion and clear-cutting and
parking lots and roads See Section 21 Lower energy system cost due to optimal orientation See Section 21 Less landscape maintenance costs See Section 24
better appearance of site to neighbors) transportation options for employees See Section 34
Increased resource use Protection of ecological resources and water conservation Reduced energy use and air pollution See Sections 41 and 43
Soil
Water Lower first cost (for some fixshy Preservation of water Lower potable water use and efficiency tures) See Section 21 Reduced
annual water costs See Section 23 Lower municipal costs for wastewater treatment See Section 28
resources for future genershyations and for recreational and agricultural uses Fewer wastewater treatshyment plants and associated annoyances See Section 34
pollution discharges to waterways ess strain on aquatic ecosystems in water-scarce areas reservation of water resources for wildlife and agriculture See Section 43
L
P
Energy efficiency Lower first costs when systems can be downsized as the result of integrated energy solutions See Section 21 Up to 70 lower annual fuel and electricity costs reduced peak power demand See Section 22 Reduced demand for new energy infrashystructure lowering energy costs to consumers See Section 28
Improved thermal condishytions and occupant comshyfort satisfaction See Section 32 Fewer new power plants and transshymission lines and associshyated annoyances See Section 34 Improved safety and security See Section 33
Lower electricity and fossil fuel use and the accomshypanying reduced air pollushytion and carbon dioxide emissions See Section 41 Decreased impacts of fossil fuel production and distribution Section 43See
Materials and Decreased first costs due to Fewer landfills and associshy Reduced strain on landfills resources material reuse and use of recyshy
cled materials See Section 21 Lower costs for waste disposal and decreased replacement cost for more durable materials See Section 24 Lower municipal costs for new landfills See Section 28
ated nuisances Expanded market for environmentshyally preferable products Decreased traffic due to use of localregional materials See Section 34
Reduced use of virgin resources althier forests due to better management Lower energy use for material transportation Increased local recycling market See Sections 42 and 43
He
Indoor Organizational productivity Reduced adverse health Better air quality inside the environmental improvements from improved impacts Improved occushy facility including reduced quality worker performance lower
absenteeism and reduced staff turnover See Section 26 Lower disabilityhealth insurance costs and reduced threat of litigation See Section 27
pant satisfaction and comfort etter individual productivity See Sections 31 and 32
B volatile organic emissions carbon dioxide and carbon monoxide Discussed in the context of health impacts in Section 31
Commissioning Reduced energy costs See Increased occupant Lower energy consumption and OampM Section 22 Reduced costs of
dealing with complaints See Section 27 Longer building and equipment lifetimes See Section 27
productivity satisfaction and health See Sections 31 and 32
as well as air pollution and carbon dioxide emissions and other environmental impacts of energy producshytion and use See Section 41
1-7
The Economic Benefits of Sustainable Design
Evidence is growing that sustainable buildings provide financial rewards for building owners operators and occupants Sustainable buildings typically have lower annual costs for energy water maintenancerepair churn (reconfiguring space because of changing needs) and other operating expenses These reduced costs do not have to come at the expense of higher first costs Through integrated design and innovative use of sustainable materials and equipment the first cost of a sustainable building can be the same as or lower than that of a traditional building Some sustainable design features have higher first costs but the payback period for the incremental investment often is short and the lifecycle cost typically lower than the cost of more traditional buildings
In addition to direct cost savings sustainable buildings can provide indirect economic benefits to both the building owner and society For instance sustainable building features can promote better health comfort well-being and productivity of building occupants which can reduce levels of absenteeism and increase productivity Sustainable building features can offer owners economic benefits from lower risks longer building lifetimes improved ability to attract new employees reduced expenses for dealing with complaints less time and lower costs for project permitting resulting from community acceptance and support for sustainable projects and increased asset value Sustainable buildings also offer society as a whole economic benefits such as reduced costs from air pollution damage and lower infrastructure costs eg for avoided landfills wastewater treatment plants power plants and transmissiondistribution lines
Section 21 explains how using integrated design and various low-cost sustainable features reduces first costs Sections 22 through 25 discuss the other direct economic benefits annual operating cost savings for energy water maintenance and repair and churn Sections 26 and 27 discuss the indirect benefits of sustainable buildings for building owners and Section 28 discusses the indirect benefits of sustainable buildings for society Case studies and research summaries illustrating various benefits are included in each section
Lower (or Equal) First Costs
Sustainable design must begin at the conceptual stage of a project to realize the full benefits The first step is to form a design team ndash including the owners architects engineers sustainable design consultants landscape designers OampM staff health safety and security experts the general contractor and As the green design field matures it becomes
ever more clear that integration is the key to key subcontractors cost consultants and value achieving energy and environmental goalsengineers and occupant representatives This team especially if cost is a major driverneeds to work together from the start seeking an
integrated design The team develops innovative Building Green Inc (1999)solutions that meet energy environmental and social goals while keeping costs within budget
Using their collective interdisciplinary analytical capability the team can incorporate many strategies that taken alone would increase first costs For example by improving the building envelope the design team can often eliminate the heating ventilation and air conditioning (HVAC) system around the perimeter of the building (and the associated ducting) and also downsize the primary HVAC system Downsizing the HVAC system and eliminating ducting release money to pay for the envelope improvements A good example of this phenomenon occurred during the
2-1
design of the Pennsylvania Department of Environmental Protectionrsquos Cambria Office Building When designers of this building first proposed an upgrade to triple-glazed double low-e windows the developer balked at the $15000 increase in cost However the developer was won over when it was demonstrated that this upgrade would allow the perimeter-heating zone to be eliminated for a savings of $15000 the heat pumps to be downsized for an additional $10000 savings and additional space to be gained because of the smaller equipment and ducts for additional rent of $50008 Also by eliminating unnecessary features (eg expensive finishes) the team can add some more expensive sustainable features that not only meet environmental goals but that also reduce operating costs
In a sustainable design project the design team conducts a tradeoff exercise ndash trading off the cost of optional features against the cost of features that will result in energy environmental or social improvements Focusing on integrated solutions and explicitly evaluating tradeoffs can result in a sustainable facility built for the same (or an even lower) cost than a more traditional building In most of the government case studies of sustainable buildings included in this document the first costs were not higher than the original budgeted amount The following are some design and construction strategies that a team can use to reduce first costs9
bull Optimize site and orientation One obvious strategy to reduce first costs is to apply appropriate siting and building orientation techniques to capture solar radiation for lighting and heating in winter and shade the building using vegetation or other site features to reduce the summer cooling load Fully exploiting natural heating and cooling techniques can lead to smaller HVAC systems and lower first costs
bull Re-userenovate older buildings and use recycled materials Re-using buildings as well as using recycled materials and furnishings saves virgin materials and reduces the energy required to produce new materials Re-using buildings may also reduce time (and therefore money) associated with site planning and permitting
bull Reduce project size A design that is space-efficient yet adequate to meet the building objectives and requirements generally reduces the total costs although the cost per unit area may be higher Fully using indoor floor space and even moving certain required spaces to the exterior of the building can reduce first costs considerably
bull Eliminate unnecessary finishes and features One example of eliminating unnecessary items is choosing to eliminate ornamental wall paneling doors (when privacy isnt critical) and dropshyped ceilings In some cases removing unnecessary items can create new opportunities for designers For example eliminating dropped ceilings might allow deeper daylight penetration and reduce floor-to-floor height (which can reduce overall building dimensions)
bull Avoid structural overdesign and construction waste Optimal value engineering and advanced framing techniques reduce material use without adversely affecting structural performance10 Designing to minimize construction debris (eg using standard-sized or modular materials to avoid cutting pieces and generating less construction waste) also minimizes labor costs for cutting materials and disposing of waste
8 Pennsylvania Department of Environmental Protections Cambria Office (DEP Cambria) a case study in DOEs High Performance Buildings Database at httpwwweereenergygovbuildingshighperformancecase_studiesoverviewcfmProjectID=47 9 Many of these concepts were outlined in Building Green on a Budget Article found at httpwwwbetterbrickscom which cites Environmental Building News (May 1999) a newsletter published by Building Green at httpwwwbuildinggreencom 10 These techniques are explained at httpwwwtoolbaseorgtertiaryTaspTrackID=ampCategoryID=70ampDocumentID=2021
2-2
bull Fully explore integrated design including energy system optimization As discussed above integrated design often allows HVAC equipment to be downsized Models such as DOE-2 allow energy performance of a prospective building to be studied and sizing of mechanical systems to
be optimized Using daylighting and operable windows for natural ventilation can reduce Discovering the DOE-2 model was invaluable
I cant imagine doing this kind of project the need for artificial lighting fixtures and without it ever again With this technique mechanical cooling lowering first costs we can actually prove to our clients how much Beyond energy-related systems integrated money they will be saving design can also reduce construction costs and
shorten the schedule For example by Robert Fox Principal Fox amp Fowle involving the general contractor in early Architect of Four Times Square
planning sessions the design team may httpwwwbetterbrickscom identify multiple ways to streamline the construction process
bull Use construction waste management approaches In some locations waste disposal costs are very high because of declining availability of landfill capacity For instance in New York City waste disposal costs about $7500 per ton11 In such situations using a firm to recycle construction waste can decrease construction costs because waste is recycled at no cost to the general contractor thereby saving disposal costs12 (For an example see case Study 4-2 in Section 4)
bull Decrease site infrastructure Costs can be reduced if less ground needs to be disturbed and less infrastructure needs to be built Site infrastructure can be decreased by carefully planning the site using natural drainage rather than storm sewers minimizing impervious concrete sideshywalks reducing the size of roads and parking lots (eg by locating near public transportashy When you dont have all these manicured tion) using natural landscaping instead of landscapes and paved roads you end up with traditional lawns and reducing other manmade enormous reductions in infrastructure
investmentinfrastructure on the site when possible For example land development and infrastructure
John Knott Chief Executive of Island costs for the environmentally sensitive developshyPreservation Partnership Dewee Islands
ment on Dewees Island off the coast of developer Charleston South Carolina were 60 below Source Rocky Mountain Institute website average because impervious roadway surfaces httpwwwrmiorgsitepagespid221php
and conventional landscaping were not used
In addition to these strategies certain materials and fixtures that reduce environmental impact have lower first costs than their traditional counterparts (the costs for these products are described in more detail in Appendixes D and E)
bull Concrete with slag content or fly ash This product is made with a mix of Portland cement and either iron mill slag (a waste product from blast furnaces that produce iron)13 or fly ash (a waste product from coal-fired power plants) Vendor quotes gathered during this study indicate that this type of concrete can be slightly less expensive ($050 to $100 per ton less) than concrete made with 100 Portland cement and is purportedly more durable
11 High Performance Building Guidelines httpwwwcinycnyushtmlddchtmlhighperfhtml 12 See httpwwwepagovepaoswernon-hwdebrisreducehtm 13 The slag is recycled into ground-granulated blast furnace slag cement by grinding the iron blast furnace slag to cement fineness
2-3
bull Carpet with recycled content A range of environmentally preferable carpet products is currently available on the market including refurbished used carpet and new carpet made from various combinations of old carpet carpet scraps carpet backing auto parts soda bottles and flooring materials The quotes gathered for this study indicate that such sustainable carpet options can cost as much as $15 less per yard than traditional carpet (although some price quotes indicated the recycled carpet was more expensive)
bull Low-emitting paint and recycled paint Low-emitting paint has very low or no emissions of volatile organic compounds (VOCs) when it is applied For building occupants the paint significantly reduces negative reactions that normal latex paint often causes and allows buildings to be occupied during or shortly after the paint is applied Price quotes gathered for this study vary but some indicate that low-emitting paint can cost $3 per gallon less than normal paint and can cover more surface area per gallon14
Recycled paint is left-over paint collected from construction sites or the paint manufacturing process That paint is then sorted by type color and finish and reprocessed for resale Price quotes collected for this study indicate that recycled paint can sometimes be $15 per gallon less expensive than comparable virgin contractor-grade latex paint
bull Certified wood products Such products comply with Forest Stewardship Council Guidelines indicating that wood producers have applied all regional laws and international treaties respect long-term tenure and use rights on the land from which the wood is harvested Price quotes indicate that some certified wood doors are $150 less expensive than traditional doors (although some are more expensive)
bull No-water urinals Urinals that use no flushing water often cost less to install than traditional water-using urinals because of the reduced need for pipes (no intake water is required) Price quotes indicate that some brands of no-water urinals cost over $280 less (per urinal installed) than their water-using counterparts (Also see Section 23 for annual water cost savings)
Implementing all of the sustainable features discussed above (concrete with slag content recycled carpet low-emitting paint certified wood doors and no-water urinals) reduced the first costs of the prototype building that was examined in this study (see Section 1) by up to $260ft2 and the total first cost of the building construction by as much as $51000 lowering the total building cost by about 2
Case Study 2-1 shows how reducing project size and using integrated design principles can significantly reduce first costs Focusing only on strategies that keep first costs low may not be in the best long-term interest of the building owner Some features that increase first costs can significantly reduce lifecycle costs Some of these lifecycle cost reduction strategies are discussed in Sections 22 through 25
14 Various brands of low-emitting paint were compared with their traditional counterparts To provide reasonable points of comparison with the low-emitting paint costs for both normal contractor-grade and high-end products were included The cost of the low-emitting paint varied depending on location of the purchase volume of the paint purchased and the ability of the local distributor to offer special rates
2-4
This case study shows that an integrated design team can apply fairly simple natural principles in innovative ways to significantly reduce energy consumption A high-performance building does not necessarily cost more to build than a more typical building One way to reduce first costs is to consider making changes to the general building program (overall concept scope and requirements) In this case study exhibit space was moved outdoors
Project Description The Zion National Park Visitors Center in Springdale Utah is a small building (7600 ft2) designed to allow park visitors access to park information interpretation and trip-planning assistance The facility provides both indoor and outdoor exhibit spaces
Approach to Sustainable Design The design team used a whole building design process from the onset of the conceptual design through completion of the commissioning process Instead of using a two-staged design approach in which the building design is developed first followed by the engineering design of the heating lighting and other mechanical systems this design team viewed the building project as a single system The team worked to ensure that the building envelope and systems complemented each other Extensive whole-building energy and lighting computer simulations were conducted throughout the design process
Sustainable Features The building includes features such as natural ventilation and evaporative cooling passive solar heating daylighting and sunshading computerized building controls and an uninterruptible power supply integrated with a photovoltaic system The natural ventilation and cooling are facilitated by a cooltower a passive solar approach that has been used for hundreds of years Water is pumped onto a honeycomb media at the top of the tower cooling the air by evaporation This cool air descends naturally (without fans) through the tower and into the building Strategically placed windows help evacuate hot air and circulate the air The buildings envelope and general form including overhangs clerestories roofline and massive building materials help reduce energy consumption
After the building envelope was designed the small amount of remainshying heating required was met with electrically powered radiant heating panels which were estimated to be the most cost-effective solution and elimishynated the need for a central heating system that would have required a hot-air furnace or boiler and associated ductwork or piping Daylighting (provided by clerestory windows and windows six feet above the floor) meets the primary lighting needs but a high-efficiency electric lighting sysshytem and related controls were designed to complement the daylighting design The uninterruptible power supply system was included in the original Energy-Related Features of the Visitors Center
2-5
plan for the buildings electrical system because of poor power reliability at the site The design team specified an inverter that could handle input from a solar-electric system so the building was ready to be outfitted with a solar-electric system Later in the design process when additional funding was available a 72-kW solar-electric system was installed The figure (previous page) shows the designs main features
Financial Considerations The project construction cost was estimated to be about 30 less than that of a conventional visitors center This lower cost is primarily the result of a decision made early in the design process to move many of the exhibit spaces outdoors under permanent shade structures to decrease building size To ensure that the outdoor exhibits were noticed the designers separated the visitors center from the restrooms (comfort station) so visitors would walk through the outdoor exhibit space
In addition the floor space required for the building support functions (ie the mechanical room) was smaller than in a conventional visitors center because eliminating ducts large blowers chillers and boilers reduced the size of the mechanical room Eliminating the need for fuel storage (by using electrically powered radiant heat) also reduced infrastructure costs The figure below summarizes annual energy costs based on measured performance (NREL monitored the performance) The building was designed to use most of its power during offpeak periods when power is cheaper The buildings operating costs is only $045ft2 ($484m2) to operate The NREL team found that the Zion Visitors Center Complex is using 70 less energy compared with facilities built to the applicable Federal codes15 This energy use is equivalent to a total annual savings of about 250000 kilowatt-hours (kWh) (870 million Btu)
Measured Energy Cost Performance of the Visitors Center (Torcellini et al 2002)
Sources Torcellini et al (2002) DOEs High Performance Buildings Database at URL httpwwwerendoegovbuildingshighperformancecase_studiesoverview and personal communication with P Torcellini NREL Golden Colorado
15 The 70 reduction was calculated from a theoretical base-case building which was modeled to provide a starting point for the analysis and as a metric for evaluating the projects energy-savings success The base-case model has the same footprint area as the as-built building The base-case building is solar neutral (equal glazshying areas on all orientations) and meets the minimum requirements of the Federal Energy Code (10 CFR 34) Electric lights provided all lighting for the base-case building and were set to retail and exhibit lighting levels More detail on the base-case versus as-built building is available from Torcellini et al (2002) on DOEs Energy High Performance Buildings website httpwwwerendoegovbuildingshighperformancecase_studiesoverview
2-6
Annual Energy Cost Savings
A wide range of building design approaches and commercially available technologies can help effectively minimize a buildings energy costs As Section 21 discussed an important concept in energy-efficient design is integrating the buildings architectural and mechanical features to minimize energy use and reduce cost while maintaining comfort This integration is best done during the very early stages when the most cost-effective holistic system can be designed Although some energy-efficiency strategies result in slightly higher first costs the resulting annual cost savings result in lower lifecycle costs
To illustrate this concept PNNL and NREL analyzed the energy costs that could be saved by using an integrated design approach to alter architectural elements and mechanical systems in the prototype two-story building of 20000 ft2 hypothetically located in
Baltimore Maryland The base-case building to which the sustainable building was compared is assumed to meet the levels of energy efficiency in the American Society of Heating Refrigerating and Air Conditioning Engineers (ASHRAE) 901-1999 standard (this is also the baseline for LEED energy-efficiency credits) The total construction cost of this base-case building was estimated at $24 million Using two energy simulation models (Energy-10 and DOE-21e) and standard costing approaches (see Appendix B for details) the analysis team calculated the incremental first cost16 and annual energy cost savings as well as lifecycle costs17 and payback periods for a combination of energy-saving features optimized for lowest energy use and lifecycle cost (see Figure 2-1)
The results indicate that annual energy costs could be reduced 37 below the base case18 by incorporating various energy-saving features at a total first cost increase of about $38000 (adding 16 to total first costs) The overall simple payback19 for the changes was estimated to be 87 years and the sustainable building had a net lifecycle savings of over $23000 during the assumed 25-year lifetime The savings-to-investment ratio20 was estimated to be 15 Table 2-1 shows the breakout of the savings For example the added skylights combined with lower overall lighting intensity and lighting controls decreased the lighting energy consumption by about 48 and saved over $2900 in annual energy costs Table 2-2 compares some additional values between the base case and the sustainable option (prototype building)
The energy-efficiency analysis of the prototype building indicates that significant amounts of energy can be reduced within an acceptable payback period and that energy-efficient buildings can have lower lifecycle costs than their traditional counterparts The cost analysis of the Johnson City Customer Service Center being designed by the Tennessee Valley Authority (Appendix C) provides another example
16 Incremental first cost is the additional capital expenditure needed to include the sustainable design feature (a negative incremental first cost indicates a capital cost savings)17 Lifecycle cost represents the first cost plus the replacement costs (discounted to present value) that occur over the lifetime of the equipment minus the discounted present value of the stream of cost savings18 This value excludes plugloads the energy use by equipment and machines in buildings 19 Simple payback equals the incremental first cost divided by the annual cost savings 20 The savings-to-investment ratio is similar to a benefit-cost ratio and equals the discounted present value of the stream of annual cost savings over the lifetime of the investment divided by the incremental first cost plus the discounted value of future replacement costs A savings-to-investment ratio greater than 10 indicates that the present value of the savings exceed the present value of any additional capital outlays
2-7
Energy-Efficiency Measures Examined in the Prototype Building Analysis
Lighting Measures bull Increased daylighting Skylights were added increasing daylight to the top floor bull Reduced lighting intensity Lighting power densities recommended by the Illuminating Engineering
Society of North America and ASHRAE as a proposed addenda to the 901 standard were adopted The lighting level was reduced from 40 to 35 footcandles in the office area with some increase in task lighting
bull Perimeter daylighting controls with dimmers Daylight sensors (six per floor) control stepped ballast controls so that electric lighting is dimmed when sufficient daylight exists In the base case no dimming of electric lighting occurs
Envelope Measures bull Window distribution The square footage of the windows was redistributed to optimize solar gain with
heating and cooling costs he optimized window-to-wall ratio is 15 window for the north wall 10 window for the east and west walls and 30 window for the south wall is 20 for all walls
bull Additional wall insulation On the outside face of the exterior wall framing R-10 rigid insulation was added compared with only R-13 batt insulation in the base-case walls The resulting insulation in the sustainable building was R-23
bull Additional roof insulation The R-15 rigid insulation was increased to R-20 bull White roof A white roof finish material with low solar radiation absorptance of 030 was used
compared with the base cases absorptance of 070
bull Highly energy-efficient windows The sustainable option balances window performance with the low lighting levels and the use of daylighting controls he result is a cost-optimized window with a U-factor of 031 and a shading coefficient of 039
Mechanical Systems bull High-efficiency air conditioner The air conditioning unit has an energy-efficiency ratio of 13
compared with 10 for the base case
bull High-efficiency water heater A 90 thermal efficiency condensing water heater was used compared with a commercial gas water heater with 80 thermal efficiency for the base case
bull Low-pressure ducts The fan external static pressure was reduced from 10 inch water column to 05 inch water column by enlarging the duct sizes
bull Economizers An integrated economizer including an outside air enthalpy sensor with a high-limit enthalpy setpoint was used the setpoint was set at 25 Btulb in conjunction with a dry bulb temperature high limit of 74degF
T The base-case ratio
T
Figure 2-1 Energy-Efficiency Measures Examined in the Prototype Building Analysis
Table 2-1 Prototype Building Analysis Energy-Efficiency Features Reduce Annual Energy Costs by 37
Base-Case Building Annual Energy Cost
Sustainable Building Annual Energy Cost Percent Reduction
Lighting $6100 $3190 477
Cooling $1800 $1310 271
Heating $1800 $1280 289
Other $2130 $1700 201
Total $11800 $7490 367
Values are rounded to three significant digits
2-8
Table 2-2 Prototype Building Analysis Costs and Benefits of Energy-Efficiency Measures
Base Case Sustainable Building
Total first cost of building (thousand $) $2400 $2440
Annual energy cost
Dollar amount $11800 $7490
Percent change from base case NA -367
Economic metrics
Simple payback period (yr) NA 865
Lifecycle cost (thousand $) $2590 $2570
Percent change in lifecycle cost from base case NA -085
Savings-to-investment ratio NA 147
Energy use
Million Btu 730 477
Percent change from base case NA -346
Values have been rounded to three significant figures NA = not applicable
In addition to integrating architectural elements and high-efficiency mechanical systems to reduce annual energy use various measures can be taken to lower the energy use by equipment and machines in buildings (plug loads) For instance the marketplace now offers Energy Star computers office machines and appliances 21 and the Federal government mandates the purchase of these energy-efficient machines for its facilities In addition innovative entrepreneurs have begun introducing new products that help reduce unnecessary energy consumption and have short paybacks For example one commercially available device reduces the electricity consumed by vending machines by up to 46 with a payback period of 1 to 2 years while maintaining the proper temperature of the beverages or other products22
Another important aspect of achieving energy efficiency in a new building is commissioning which refers to the validation and checking process undertaken before the building is occupied to ensure that the performance of the building and its systems satisfies both the design intent and occupants needs In sustainable building design and construction the need to commission is greater than ever because of the interactive synergies between the various mechanical and electrical systems and the buildings architectural features (US General Services Administration [GSA] and US Department of Energy [DOE] 1998) Data substantiating the benefits of commissioning new buildings are difficult to obtain because benefits must be estimated against a modeled baseline or compared with a similar building However a database of 175 commissioning case studies by Portland Energy Conservation Inc (PECI) (1997) of various types of commercial buildings ranging from new to 74 years old consistently demonstrated significant energy savings and improvements in thermal comfort indoor air quality and overall OampM Table 2-3 shows the estimated costs of commissioning a new building
21 This study did not include a thorough analysis of reducing plug loads The LEED system does not apply points to this category In some cases energy-efficiency improvements depend on the behavior of building occupants and therefore cannot be guaranteed The plug load in the prototype building represents about 25 of the energy consumption22 wwwbayviewtechcom
2-9
Table 2-3 Costs of Commissioning for New Construction (PECI 1997)
Scope of Commissioning Cost
Whole building 05-15 of total construction cost
HVAC and automated controls systems only 15-25 of mechanical system cost
Electrical systems commissioning 10-15 of electrical system cost
The first cost for the HVAC and control system in the prototype building analyzed in this study was about $212000 (out of a total cost of $24 million) and the annual energy costs of the base case were modeled to be $11800 Using the values in Table 2-3 comshy
missioning the HVAC and control system would cost from $3180 to $5300 (15 to 25 of HVAC and control system costs) Assuming that the commissioning would reduce energy costs by 1023
the annual costs savings would be about $1310 resulting in payback period from 24 to 40 years
In addition to commissioning the building before it is occupied a building designed for sustain-ability must also be operated and maintained with the same goal in mind OampM activities include 1) controlling and optimizing procedures and systems and 2) performing routine preventive scheduled and unscheduled actions to prevent equipment failure or decline and to meet efficiency reliability and safety goals
In a sustainable design environment OampM requirements must be identified and addressed in a buildings planning stage to ensure that control systems are installed that the building and equipment are designed for ease of OampM and that sufficient OampM resources (staff materials replacement parts etc) are included in the annual budgets Studies of commercial buildings estimate potential OampM-related energy savings to be from 5 to 30 (Hunt and Sullivan 2002) Buildings designed for sustainability need to focus on maximizing savings through a proactive OampM program that focuses on operational efficiency
One component of such a program is the periodic recommissioning of equipment which involves rechecking and recalibrating the original equipment Examples of typical OampM and recommisshysioning activities include calibrating sensors checkingresetting temperature setpoints maintaining proper building operating schedules balancingrebalancing the HVAC systems changing filters meteringsubmetering energy with analysis and followup action as appropriate and training and certifying operators for building mechanicalelectrical equipment and systems PECI (1997) estimates $017ft2 as the average cost to recommission existing buildings Applying this cost rate to the Federal building inventory and assuming a 10 resulting reduction in energy use yield a simple payback for recommissioning of 14 years for energy savings alone (Hunt and Sullivan 2002)
Case Study 2-2 demonstrates how significant energy was saved using many of the techniques just described including energy-efficient mechanical equipment and commissioning
23 This is within the range of 5 to 30 estimated for savings associated with sound OampM To estimate the cost reduction of $1310 the energy cost was assumed to have been 10 higher had no commissioning occurred ie it would have been $118009 or about $13100 A 10 savings based on an original annual energy cost of about $13100 is $1310
2-10
This case demonstrates that a significant amount of energy can be saved by analyzing energy consumption using models and choosing technologies with favorable lifecycle costs
Project Description 151000-ft2 Process and Environmenshytal Technology Laboratory in Albuquerque New Mexico houses 180 people in a central core of labs with offices on the perimeter By carefully considering cooling heating and processelectrical loads and revising the design the team increased energy effishyciency by over 20 between the preliminary and final designs
Approach to Sustainable Design The design for this building focused only on the energy aspects of sustainability The efforts began when energy modeling during the first phase of the design process showed consumption that exceeded by 20 the average annual energy use of Sandias most energy-intensive facilities he design team evaluated a wide range of advanced energy-efficiency technologies using energy modeling and lifecycle cost analysis
Sustainable Features The largest energy consumer in the building is the ventilation air system that is required to maintain a safe laboratory environment therefore the laboratory HVAC system was a major focus of the redesign design features included in this building were variable-frequency drives for fan volume and pump control a heat pipe energy recovery system with evaporative cooling a chilled water thermal energy storage system premium efficiency motors a premium efficiency multiple boiler system variable-air-volume fume hoods energy management control systems (full direct digital control) sunshades and reflective glass energy-efficient lighting metering and commissioning
Financial Considerations The table below shows the principal systems that added to first costs the estimated cost savings and simple paybacks tal building cost was $285 million features described in the table added about 4 to the total cost but will quickly be returned in annual cost savings st about $300000 (about 1 of the building design cost) including internal staff time and the contractors test engineers of operation the annual energy consumption was 269000 Btuft2 which was even lower than the 341000 Btuft2 predicted by energy modeling studies
The
T
Sustainable
The to The additional
Commissioning the building co After one year
Principal Systems Adding to First Costs and Estimated Cost Savings and Simple Paybacks
Energy-Efficiency Technology
Added Cost ($)
Added Cost
($1000 ft2)
Energy Savings ($yr)
Energy Savings ($ft2)
Payback Period
(yr)
Variable-frequency drives instead of inlet vanes for fan variable-volume control
109600 726 61700 259 18
Heat pipe energy recovery system with evaporative cooling
329600 2182 31800 211 104
Chilled water thermal energy storage system 239500 1586 104000 689 23
Premium efficiency motors 6930 45 3200 21 22
Premium efficiency multiple-boiler system 8750 58 8200 54 11
Sources Personal communication with R Wrons Sandia and Laboratories for the 21st Century (2001)
2-11
Annual Water Cost Savings
Water efficiency can be achieved using a number of technologies that lower indoor water consumption (compared with the standard technologies available on the market) such as ultra-lowshyflow showerheads and faucet aerators no-water urinals and dual-flush toilets Facilities can also lower potable water consumption by using nonpotable water for productive uses (eg using technologies that harvest rainwater or treat wastewater for re-use in various other applications in the buildings or on the site) better energy systems recirculating water systems (instead of once-through cooling) leak detection and repair and sustainable landscaping
The costs for several water-saving features were estimated for the 20000-ft2 prototype building (see Table 2-4) All of the water-saving strategies analyzed have favorable economics with payback periods from 28 to 03 years If all the strategies in Table 2-4
were implemented the total reduction in the annual cost of water for the building would be about $330 and the first-cost savings would be $590 These measures would reduce water consumption within the building by approximately 57
Table 2-4 Prototype Building Analysis Cost Data for Water-Efficiency Features
Incremental First Cost Per Unit
Incremental First Cost
Per 1000 ft2
Annual Cost Savings
Per 1000 ft2 Simple
Payback (yr)
Ultra-low-flow showerhead
$499 per showerhead $050 $033 15
Ultra-low-flow faucet aerators
$587 per faucet $235 $814 03
Dual-flush toilets $5000 per toilet $1000 $358 28
No-water urinals -$282 per urinal -$4230 $453 Immediate
Costs were converted to a dollar value per 1000 ft2 of gross building floor space to compare types of features Cost values were rounded to three significant digits although the convention of showing two numbers to the right of the decimal place (for cents) was maintained Simple payback periods are shown in tenths of a year
The following features were examined
bull Ultra-low-flow showerheads and faucets The sustainable features examined in this study exceed the current standards required under EPAct The current standards say showerheads cannot exceed 25 gallons per minute (gpm) at the typical building pressure between 40 and 80 pounds per square inch (psi) A more sustainable showerhead that uses 20 gpm was chosen for analysis in this document Under current standards kitchen faucets cannot exceed 25 gpm at 80 psi and restroom faucets cannot exceed 22 gpm at 80 psi For both the kitchen and restroom faucets a 10 gpm model was chosen as the sustainable option for analysis in this document
bull Dual-flush toilets Regulations mandate that toilets not exceed 16 gallons per flush (gpf) A dual-flush toilet has two flushing options liquid flushing at 08 gpf and solid flushing at 16 gpf
bull No-water urinals A no-water urinal that treats the waste chemically was compared with a typical water-using urinal
Many Federal sites (military bases national parks US Post Offices and GSA buildings) have installed no-water urinals and other water-saving devices with great success For example the
2-12
North Island Naval Air Station in San Diego California installed over 200 no-water urinals and the National Aeronautics and Space Administrations Jet Propulsion Laboratory in Pasadena California installed 250 units The University of California Los Angeles (2000) performed a study examining the performance of a urinal that uses no water compared with a urinal that uses 3 gpf The study compared the following parameters to determine how well the no-water urinal performed usage bacterial growth and odor and lifecycle cost The study concluded that the no-water urinal performed better than its specifications In the tests conducted no odors were detected24
Many other water-saving approaches are available including process-oriented technologies and site-specific techniques for which costs are difficult to quantify generically as was done for the low-flow appliances described above However these measures are often very cost effective
bull Cooling towers are often one of the largest water users for large office buildings hospitals and industrial facilities As water is evaporated through the tower dissolved solids remain in the system and build up over time requiring water to be purged from the system through what is known as bleed-off Maintaining water quality is key to saving water in cooling towers and reducing bleed-off Chemical treatment side stream filtration and ozonation can help maintain proper water quality and reduce bleed-off and water consumption
bull Single-pass cooling equipment can also be a major water user in Federal facilities When the equipment is modified to a closed loop system the water can be recycled rather than discharged down the drain saving up to 40 times the water required for heat removal from the equipment
bull Boiler and steam systems are often found in large Federal facilities such as central plants hospitals large office buildings barracks and industrial process plants Proper maintenance of steam traps and condensate return and reduction of blow-down by maintaining proper water quality in the system can help reduce water use in these systems
bull Leak detection and repair of water distribution systems can provide large water savings with very quick payback especially for military bases that have old (pre-1940s) systems Such systems can reduce water losses and operating costs and can increase understanding of system operating characteristics Typically leak detection is done as part of a comprehensive water audit to help determine the source of unaccounted for water consumption at the site
bull Sustainable landscaping using plants native to a region (including drought-resistant plants) reduces (or eliminates) the need for irrigation water This is discussed further in Section 24
Case Study 2-3 discusses the water savings achieved at a facility in Ann Arbor Michigan by using closed-loop cooling and other measures Although this example demonstrates savings in a retrofit situation many of these techniques can be used in constructing new facilities especially those housing laboratory or other process equipment with high water and energy needs
24 The chemical cartridge (a device in the urinals drain that traps odors while allowing urine to pass through) performed with no maintenance problems over 7000 uses (the guaranteed number of uses for each cartridge) and did not clog during the testing period The no-water urinal did not have a greater bacterial growth level than the conventional urinal The study measured concentrations of ammonia the chemical that produces the offensive odors in urinals No significant difference existed between ammonia levels in the vicinity of the two urinals and neither approached the level that can be detected by humans In a retrofit scenario the economic analysis performed for the no-water urinal indicated a simple payback of less than three years and an annual internal rate of return from 37 to 61 (the range is based on population densities of different types of buildings)
2-13
________________________
The National Vehicle and Fuel Emissions Laboratory underwent a major retrofit to reduce energy and water consumption using an Energy Services Performance Contract (ESPC) The facility reduced its water consumption by 80 over baseline conditions saving about $140000 annually through a complete upgrade of the facility HVAC system installation of chilled and hot water recycle loops and use of other conservation measures
Project Description This water-intensive facility is a 30-year-old 175000-ft2 building in Ann Arbor Michigan and is owned and operated by the EPA The building houses offices testing laborashy tories and support spaces The EPA with support from DOEs FEMP awarded an ESPC to NORESCO in 1998 for a comprehensive upgrade of the energy systems this upgrade also significantly reduced water consumption and costs
Approach to Sustainable Design The buildings main functional space is a high-bay research space where vehicles and engines are tested Testing activities consume a high level of both energy and water Before the retrofit the facility had an annual utility bill of over $1 million and annual water consumption averaged 31 million gallons from 1993 to 1995 During that time single-pass cooling water (for the engine test cells air compressors and process chillers) accounted for about 75 of total facility water use Cooling tower makeup water accounted for an additional 10 of the facilitys water use
The facility engaged in an ESPC with the following objectives reduce energy consumption emissions and energy costs through energy conservation measures (ECMs) exceed Federal energy reduction mandates eliminate chlorofluorocarbons (CFCs) reduce water consumption and provide a simple payback of less than 10 years on the contractors capital expenditure Analysis and audits resulted in 11 individual ECMs Although most of the ECMs focused on energy savings many of the energy-savings measures also significantly reduced water use One ECM specifically focused on water conservation by converting once-through cooling systems to closed-loop systems recirculating chilled water to cool process loads at the facility and significantly reducing water consumption
Sustainable Features Key components of the ESPC included replacing 36 rooftop air-handling units replacing existing equipment in the central heating and cooling plant with two new direct-fired chiller-heater absorbers one new high-efficiency condensing boiler and two new cooling tower cells with variable frequency fan drives and adding a new pumping system The upgraded chilled water system was sized to replace the once-through cooling water with recirculated chilled water
Before the ESPC the single-pass cooling system used about 23 million gallons of water per year the upgraded cooling plant with the recirculated chilled water loop reduced water consumption by over 95 to fewer than 1 million gallons In addition before the ESPC boiler makeup water accounted for about 1 million gallons of facility water per year but after replacing the old system with high-efficiency condensing boilers and installing a new hot water piping distribution system the hot water loop makeup now accounts for only 7200 gallons of water per year In addition to the ESPC the facility has used other water-saving best management
An ESPC is a contracting method that allows a contractor (instead of the building owner) to incur the cost of implementing energy savings at a facility The contractor is paid back during the term of the contract from a share of the energy savings resulting from the measures that were implemented
2-14
practices including public information and education programs to educate employees on water conservation topics audits for leak detection and repair a water-efficient landscape that uses no irrigation water and low-flow fixtures and faucets
Financial Considerations The figure below shows water consumption before the measures were implemented (averaged over 1993 to 1995) and after the implementations (in 2002) About 25 million gallons (33 million ft3) of water were saved annually Because water and sewer costs combined are about $420 per 100 cubic feet in Ann Arbor the measures reduced total water and sewer costs by about $140000 annually Associating a precise capital cost directly to this annual water cost savings is difficult because of the synergy between the energy and water savings For example the ESPC replaced 36 rooftop air-handling units that before the retrofit operated in a single-pass mode The new units use enthalpy recovery wheels and recirculate 80 of the air This change reduced water consumption because central plant heating and cooling requirements have been dramatically reduced This reduction created the opportunity to replace the cooling tower with two smaller cells significantly reducing water use in the tower In addition the plant no longer has to humidify single-pass air in the winter
The ECM that was directly related to water reduction (implementing the recirculating chilled water loop) cost about $129000 in first costs and saved over $48000 in water costs in 2002 If these savings are achieved each year the payback period will be 27 years
4500 4000 3500 3000
Baseline
2002 100
ft3 2500
2000 1500 1000 500
0
aJn
Feb
Mar AprMay Ju
n Ju
lA
gSu ep
Oct NovDec
Month
Water Consumption Before and After ECM Implementation
Sources Personal communication with S Dorer Facility Manager at the National Vehicle and Fuel Emissions Laboratory Ann Arbor Michigan R Sieber ERG (consultant) and P Wirdzek EPA Labs21 Program Manager
2-15
Lower Costs of Facility Maintenance and Repair
Sustainable design aims to increase durability and ease of maintenance For example the service areas within sustainable buildings should be designed with enough space to allow easy access to mechanical equipment Easy access will reduce the cost of scheduled maintenance repair and eventual replacement Other approaches can also reduce annual maintenance costs using sustainable design
bull Using durable long-lasting sustainable materials can decrease maintenance and repair costs For instance cement companies have tested fly ash and slag concretes and found that if properly cured they have greater strength and durability than concrete made from normal Portland
25cementbull Using low-emitting paints offers excellent durability according to some vendors26
bull Designing buildings with areas for efficient and convenient collection of recyclable materials such as paper plastic and glass can reduce annual waste disposal costs (if recycling costs are lower than normal charges for municipal solid waste)
bull Using fluorescent lamps reduces labor costs for maintenance These lamps last about 10000 hours as opposed to 1000 hours for incandescent lamps Therefore about 10 lamp changes (and the associated labor costs) are avoided by using fluorescent lamps
bull Lightening roof color can prolong a roofs lifetime (in addition to reducing summertime heat gains and air conditioning costs) (Rosenfeld et al 1995)
bull Using recycled carpet tiles which can be removed and replaced individually reduces the need to replace carpet
bull Using sustainable landscaping techniques typically decreases lawn mowing fertilizer use and irrigation and has short payback periods (eg in the prototype building example below the payback was less than one year)
bull Managing stormwater through natural methods such as drainage ponds that also serve as habitats for wildlife rather than storm sewers often exhibits favorable lifecycle costs
Table 2-5 shows the first costs and annual cost savings of two specific site-related strategies that reduce annual maintenance costs using the same prototypical building described in the previous sections Together the strategies increase first costs by about
$5600 which is quickly repaid through maintenance cost savings of about $3600 annually
Table 2-5 Prototype Building Analysis Costs for Sustainable Siting Features
Incremental First Cost
Incremental First Cost
Per 1000 ft2
Annual Cost Savings
Per 1000 ft2
Simple Payback
(yr)
Sustainable stormwater management
$3140 $157 $2820 56
Sustainable landscape design $2449 $122 $152 08
Costs were converted to a dollar value per 1000 ft2 of gross building floor space so types of features could be compared ly costs per 1000 ft2 by 20 to obtain total costs for the building ere rounded to three significant digits although the convention of showing two numbers to the right of the decimal place (for cents) was maintained ayback periods are shown in tenths of a year
Multip Cost values w
Simple p
25 For example see httpwwwlafargenorthamericacomlafargeNAnsfCementSplashOpenForm 26 For example see httpwwwduroncomproducts-generalinfo-interior-genesishtml
2-16
The two site-related strategies shown in Table 2-5 are described as follows
bull Sustainable stormwater management An integrated stormwater management system combines a porous gravel parking area with a rainwater collection system where rainwater is stored for supplemental irrigation of native landscaping This porous gravel-paved parking area is a heavy load-bearing structure that is filled with porous gravel allowing stormwater to infiltrate the porous pavement (reducing runoff) and to be moved into an underground rainwater collection system The water can be used to supplant fresh water from the public supply for uses that do not require potable water This sustainable system is compared to a conventional asphalt parking area and a standard corrugated pipe stormwater management system without rainwater harvesting
bull Sustainable landscape design A mixture of native warm weather turf and wildflowers is used to create a natural meadow area This strategy is compared with traditional turf landscaping of Kentucky blue grass which requires substantially more irrigation maintenance and chemical application
Although the particular sustainable stormwater system used for the prototype increases the total construction cost by a little over $3000 (about 01 of total building construction cost) it saves over $500 annually in maintenance costs because less labor is required for patching potholes and conducting other maintenance on an asphalt lot The resulting payback period is less than six years The sustainable landscaping approach shows even more favorable economics the incremental first cost is nearly $2500 but this is repaid in less than one year with an annual OampM costs savings of $3045 in avoided maintenance chemical and irrigation costs (See Appendix D for more information on how these costs were calculated) Case Study 2-4 shows a real-world example of the cost savings associated with sustainable landscaping
Lower Churn Costs
In todays work environment employees are increasingly relocated within existing buildings to improve organizational effectiveness or as a result of downsizing reorganization of the business or business growth A survey conducted by the International Facility Management Association (IFMA) and published in 1997 determined that on average 44 of building occupants move within a given year This is called the churn rate27 In government buildings the churn rate appears to be somewhat lower ndash 27 (The survey included 20 government respondents) The survey found that the churn rate has been increasing over time
Moves are expensive According to IFMA (1997) the average move in the government cost $1340 (per person) The cost of a move depends on the extent to which the facility must be modified to accommodate the changes IFMA found that if new walls new or additional wiring new telecommunications systems or other construction is needed to complete the move the average cost in a government setting is $3640 (IFMA calls this a construction move) However if no furniture is moved no wiring or telecommunication system changes are required and only files and supplies are moved the average cost in a government building dropped to $166 (IFMA calls this a
27 The churn rate is defined as the total number of moves made in a 12-month period divided by the total number of occupants multiplied by 100 (to obtain a percentage)
2-17
This case study demonstrates how native landscaping can reduce both installation and OampM costs of landscaping a Federal facility The cornerstone of this design is the native trees which require no irrigation system provide shade to the building and require very little maintenance compared with a traditional landscape of sod and large non-native trees
Project Description The facility ndash built in 2001 in Argonne Illinois ndash is Argonnes shipping and receiving warehouse It was built onto an existing structure
Approach to Sustainable Design The design and integration team for the facility began incorporating design review early to ensure that all technical aspects were properly evaluated Other aspects vital to the projects success included educating the building occushypants about sustainable features and training the maintenance staff
Sustainable Features Argonne incorporated many sustainable design features into the facilshyity One hundred immature native trees were planted in small groups surrounding the facility The trees were much smaller than the larger mature trees traditionally planted on Argonne grounds Planting smaller trees helps reduce both the stress on the trees at planting and their long-term water requirements Native turf was seeded on the grounds instead of planting traditional sod thereby eliminating the need for an irrigation system
Other sustainable features included recycled building materials such as concrete block carpet structured steel lumber ceiling tiles partitions and gypsum board In addition efficient water fixtures in the rest-rooms low VOC paint an energy-efficient mechanical system high-performance windows and a rooftop rain catchment system were integrated in the sustainable design The facility was LEED-certified in spring 2002
Financial Considerations The native landscaping significantly reduced installation and OampM costs Installation costs were reduced because smaller holes were required to plant smaller trees The 100 native trees that were planted on the grounds had the same estimated cost as 40 mature trees Seeding native grass on the grounds was a much less labor-intensive practice than laying sod Sod also requires large amounts of water to saturate the ground so the sod can adapt to the new environment Seeding with native grass and eliminating the irrigation system saved Argonne about $11000 in first costs
In one growing season the trees and seeded grass became well established and currently do not require supplemental water to remain healthy If large non-native trees and sod had been used regular watering would have been required for two growing seasons and supplemental water would have been required during droughts The native landscaping reduced water requirements by an estimated 40 within the first two growing seasons and reduced the need to mow and fertilize the native grass Overall the native landscape reduces OampM costs by an estimated 50 compared with more traditional landscape
Sources Personal communication with K Trychta Argonnes Pollution Prevention Coordinator
2-18
box move)28 If existing furniture is reconfigured or furniture is moved or purchased but only minimal telecommunication reconfiguration is needed the government cost averaged $613 (a furniture move)
To reduce churn costs many high-performance sustainable buildings include a raised floor system that creates an underfloor plenum used for HVAC air distribution and modular power cabling and telecommunicationsdata systems The HVAC system and cables in the underfloor plenum typically are accessible through individual movable floor tiles These raised-floor systems also enable personal controls to be used allowing each occupant to control the level of ventilation temperature and lighting levels at his or her own workstation (the benefits of personal controls on occupant productivity health and well-being are discussed in Section 3) In addition sustainable buildings often use removable partitions in place of permanent walls
Using raised floor systems and removable partitions When using underfloor air systems local
can significantly reduce churn costs No ductwork workstation air conditioning control devices can revisions or other complex construction is needed be relocated in less than five minutes with a to alter workstation configurations The access floor screwdriver being the only tool required system together with floor diffusers allows the layout of the space to be modified with very little Source Shute (1992)
lost work time The move costs in a building with a raised floor and movable partitions would be closer to the box or furniture moves described above ($166 to $613 per person) than to the construction move ($3640 per person)
The first costs of a building with a raised floor system and underfloor HVACcabling will depend on the many factors specific to the building but estimates documented by Loftness et al (2002) indicate that the first costs are about the same as (or only slightly higher than) those in a building with a traditional acoustical tile or drywall ceiling system29 The major additional cost of such a building is the raised floor itself ndash from $3 to $10ft2 depending on manufacturer quality and integrated components (Loftness et al 2002) compared with installed acoustical ceiling tile which typically costs $149 to $231ft2 (RS Means Company Inc 2002) However the additional costs for the raised floor would most likely be offset by a lower first cost of the underfloor air-handling system compared with the traditional ceiling air-handling systems Milam (1992) states Most HVAC equipment installation occurs below the raised floor therefore laborers perform little work on ladders platforms or hoists This allows substantial increases in laborer productivity that corresponds to savings in labor costs These underfloor air-handling systems also usually have smaller piping pumps and refrigeration equipment and most of the ductwork is eliminated
In addition to HVAC savings the underfloor system also reduces first costs of power distribution receptacles data communication devices and labor for installing cabling Some evidence exists
28 Using the entire population of buildings surveyed by IFMA (1997) including various types of private-sector enterprises the average cost per move was $1207 the average cost of a construction move was $4194 the average cost of a box move was $149 and the average cost of a furniture move was $523 29 One study (Wilson 1998) of a private-sector office building in California estimated a $270ft2 decrease in first cost for the access floor system (compared with an overhead system) Part of the estimated cost reduction in this study was from using carpet tiles in the building with the access floor versus rolled goods in the traditional building which decreased the cost of the access floor by almost $100000 However given that the traditional building could also use carpet tiles the cost differential of $270 seems somewhat overstated If the carpet difference were eliminated from the estimate the cost of the building with the access floor would have been about equal to that of the standard ceiling HVAC distribution system Thus even though these data do not necessarily show that the access from system is less expensive than an overhead system the data do indicate that the differences in cost between the two kinds of systems are negligible
2-19
that underfloor HVAC systems also reduce annual energy costs by 20 to 35 (Loftness et al 2002) See the comprehensive report by Loftness et al (2002) for a complete explanation of the costs and benefits of these underfloor systems In addition to churn cost savings the use of
underfloor systems and movable partitions also saves materials and material costs during moves
For the prototype 20000-ft2 office building which hypothetically houses about 100 occupants building owners could save from $35000 to $81000 in churn costs 30 if the building were outfitted with an
The cost of an intelligent building with a good underfloor system and moveable wall partitions quality access floor a modular electrical
instead of traditional systems These savings likely distribution system and under-floor air is very could be achieved with little additional first cost close to the cost of a traditional poke-through
building (less than 1 greater) Research Summary 2-1 provides data on churn costs in an actual government office building with 1500 Source York 1994 (cited in Loftness 2002)
work stations (the Rachel Carson State Office Building in Harrisburg Pennsylvania) This study indicates that a high-performance green building with a raised floor could save over $800000 annually (compared with one without the raised floor) in a large building that has a 25 annual churn rate (a savings of $2250 per person moved) The costs of churn are often neglected when the lifecycle costs of a building are estimated This evidence indicates that such costs should be more seriously considered
Lower Absenteeism and Improved Productivity
Many studies which will be described in $35B Ene rgy $05B Wate r and S e we r this section have shown that building occupants respond to some of the $20B Faci l i ty Constructi on features of sustainable buildings by working more productively making fewer errors and being absent less often thus reducing labor costs
Figure 2-1 shows that as a fraction of total expenditures labor costs in the government far exceed construction energy or other annual costs31 so measures that positively influence worker performance and absenteeism rates could have a much higher financial impact than energy efficiency or other
Figure 2-1 Annual Federal Government Costs measures affecting operating costs
30 These figures assume 27 moves at a savings per person of about $1300 (the difference between the average government move and the box move) to $3500 per move (the rough difference between a construction move and a box move) Although Loftness et al (2002) estimate somewhat lower cost savings of $100 to $500 per move the cost savings of $2250 per move estimated for the case study of the Rachel Carson State Office Building is at about the midpoint of the estimated range used in these figures 31 Sources for data in Figure 2-1 include Office of Personnel Management website httpwwwopmgovfeddata02factbkpdf and Federal Facilities Council (2001) Note that personnel costs are for civilians only (including civilian employees of US Department of Defense) Energy and other costs include military facilities
$194B S al ari e s and Be ne fi ts
and Re novati on
2-20
The Pennsylvania Department of Environmental Protection (DEP) took advantage of its need to relocate 700 of the 1500 employees in the Rachel Carson State Office Building (RCSOB) in Harrisburg Pennsylvania to estimate the cost of churn The actual cost of the moves in RCSOB which did not have a raised floor system was compared with the estimated churn cost in a new high-performance green technology office ndash South Central Regional Office Building (SCROB) ndash where employees had similar functions and space requirements The comparison shows that using raised floor systems in sustainable buildings can reduce churn costs by 90
Research Team Staff members of the Pennsylvania DEP J Toothaker Lead
Research Setting The RCSOB is a traditional 16-story office structure with a central service core It is equipped with carpet tile a cellular floor for electrical and telephonedata distribution modular furniture full-height demountable walls and mechanized central file systems on all floors However it does not have a raised floor Its dropped ceiling contains drop-in fluorescent light fixtures sprinklers and a variable-airshyvolume HVAC ceiling distribution system the building also has a hot water perimeter heating system Exterior walls are glass and the central core provides restrooms elevators electrical rooms telephonedata rooms and communicating stairways on each floor
The opportunity to study churn costs in this building resulted from a requirement to reconfigure and reloshycate 700 of the 1500 employees in this facility to reorganize one agency into two agencies Workshystations and common areas had to be reconfigured Two floors were completely reconfigured to accomshymodate about 240 work areas with the remaining 460 workstations scattered throughout the remaining twelve floors This involved the following bull Dismantling and reconstructing private offices bull Unwiring cleaning and reconfiguring the
modular furniture and cleaning the chairs bull Reconfiguring variable-air-volume boxes lights
and sprinkler heads in the ceilings bull Reconfiguring central file equipment and the
electrical and telephonedata connections on each floor
bull Cleaning or painting all surfaces in the reconfigured areas
bull Relocating personal computers and peripherals
Components within the SCROBs Raised Floor System
The photo shows the plenum space below the floor surface and the air diffuser phone modemfax mounting and power strip on top of the carpet tile
All of this work was done using competitively bid contracts with about 50 of the labor performed at straight time during the workday and the remainder at premium pay at night and on weekends
DEP had just completed SCROB a high-performance green technology office with a raised floor system This project allowed the team to compare churn costs between the two types of offices The primary difference in the churn costs between the two buildings is the use of a raised floor system to create a floor plenum for HVAC air distribution which also houses the modular power and telephonedata distribution systems This raised floor plenum system with its individual floor tiles which are movable and easy to relocate allows easy access to the floor HVAC diffusers and power telephonedata cables When the raised
2-21
floor system is used systems furniture and demountable walls are no longer wired together which further reduces cost and lapse time for churn
Methodology The comparative evaluation consisted of a methodical review of the actual unit costs and elapsed time needed for each contracted activity for the RCSOB moves Then the DEP estimated the cost and time needed for each of the same activities for a comparable move in the SCROB
Results The cost for the RCSOB project which reconfigured 700 workspaces (including both offices and open workstations) was about $1777 million or $2538 per person ojects actual renovations and reconfigurations were completed in about three months
DEP conducted a detailed analysis of the move costs including all materials and labor for each contracted activity ach contracted activity in the new building with the raised floor (SCROB) was estimated The cost and length of time to physically reconfigure work spaces were estimated to be about 90 lower in SCROB than in RCSOB The table below shows the calculations (for ease of presentation numbers and percentages were rounded)
Comparison Analysis of the Moving Costs in RCSOB
Actual Costs in the RCSOB
Hypothetical Costs Had A Raised Floor Been Installed in RCSOB
Building type Conventional office facility High-performance green building (raised floor)
Number of work spaces 1500 1500
Annual churn rate 25 25
Number of work spaces reconfigured annually
375 375
Cost per reconfiguration $2500 (based on actual data) $250 (estimated based on situation in SCROB)
Annual cost of churn $937500 $93750
Churn cost savings Not applicable $843750
The RCSOB was completed in 1993 at a constructed cost slightly over $40 million If the facility had been designed and built with a raised floor lower churn costs equal to over 2 of its constructed cost per year could have saved DEP about $76 million since the buildings occupancy in 1993
Source Personal communication with JS Toothaker former Bureau Director DEP Commonwealth of Pennsylvania Mr Toothaker managed the 700-employee move in the RCSOB and compared the actual and estimated costs between the two facilities based on his personal participation and knowledge of the facilities Mr Toothaker was the principal developer of the Building Green in Pennsylvania Program
The pr
E
2-22
One key research study (Milton et al 2000) that examined the relationship between absenteeism and ventilation rates is highlighted in Research Summary 2-2 This study assigned dollar values to the benefits of better ventilation and estimated potential annual cost savings of about $25000 per 100 employees resulting from a one-time investment in better ventilation systems of $8000 per 100 employees This research strongly implies that designers should pursue the goal of good indoor air quality simultaneously with the goal of energy efficiency
A research study assessed sick leave for 3720 hourly workers in a large manufacturing firm in Massachusetts to determine the relationship between absenteeism and factors such as ventilation humidity and indoor air quality The study showed that $24444 per 100 employees could be saved annually with a one-time investment in improved ventilation of $8050 per 100 employees
Research Team The research team included DK Milton of the Harvard School of Public Health PM Glencross of the Harvard School of Public Health and Polaroid and MD Walters of Polaroid
Research Setting The research setting was 40 buildings and 115 independently ventilated work areas
Methodology Sick leave data were gathered from corporate records (excluding extended sick leave or short-term disability) Other data gathered on employees included age gender race shift job code years of employment and the employees primary work area (building and floor)
The final analysis focused on clerical workers to control for the potential effects of occupational factors The analysis also used existing corporate records to identify building characteristics and indoor environmental quality complaints The study gathered the following data on each building in the study bull Presence of devices to humidify supply air such as steam spray and finfill humidifiers bull Formal complaints to the corporate environmental health and safety office and remediation efforts bull Ventilation ratings for each floor ndash categories as either moderate (about 12 Ls) or high (about 24
Ls) bull Additional air quality data including endotoxin and total airborne bacteria counts culturable
bacteria culturable fungi spore counts and VOCs
Key Findings The studys results included the following bull Moderate ventilation and use of humidifiers were associated with more total sick leave as well as more
short-term sick leave bull Of the short-term sick leave 35 was attributed to lower ventilation rates translating to 12 to 19
days of increased sick leave per person per year bull Reductions in sick leave from improved ventilation were similar to reductions during flu season due to
influenza vaccination bull Respiratory illnesses caused by airborne viruses or bacteria could be effectively reduced with ultraviolet
irradiation of air near the ceiling and with increased ventilation bull Economic analysis showed that investing $8050 per 100 employees in improved ventilation could
reduce sick leave by $24444 per 100 employees (from $39950 to $15506 per 100 employees)
Source Milton et al (2000)
2-23
Another study of 11000 workers in the Netherlands found that absenteeism from sick building syndrome is likely to be 34 lower when workers have control over their thermal conditions (Preller et al 1990) A comprehensive study of methods to improve indoor environmental conditions estimated that the value of improved productivity (including lower absenteeism) of office workers could be as high as $160 billion nationwide (Fisk 2000)
Measuring productivity is relatively straightforward for simple information processing tasks such as data entry and forms processing For most knowledge workers however productivity is more difficult to measure because the outcomes are highly variable often elusive and difficult to document32 Furthermore much knowledge work is valued for its impact rather than its output Impact refers to the value of the work (as indicated by an idea concept plan or policy) to the organization Because of these difficulties the building blocks or precursors of productivity are often measured rather than work output These blocks or precursors include specific kinds of tasks associated with knowledge work performance such as attention reading comprehension creativity and logical thinking
Performance benefits resulting from sustainable building features are described below The evidence presented on performance benefits is drawn primarily from research conducted on occupants of actual buildings rather than from laboratory studies The studies cited are from peer-reviewed publications or conference proceedings and include publications in building science lighting environmental psychology and human factors Taken as a whole the studies show a cluster of building factors associated with improved performance good ventilation glare-free lighting personal control over temperatures and ventilation and good maintenance and cleaning especially of the HVAC system These factors appear to influence performance by reducing illness symptoms that interfere with work by increasing alertness and reducing fatigue and by reducing visibility problems
bull Performance on clerical and word processing tasks Much of the research on work perforshymance has been conducted in experimental settings where stimuli can be carefully controlled although a few studies have been conducted in actual work settings For example a field simulation study tested performance on a word processing task in an office with and without a 20-year-old carpet (Wargocki et al 2000) The study found that workers performance was 65 better without the carpet All other factors such as ventilation and temperatures were held constant Therefore the results are due to air quality differences associated with the old carpet A frequently cited field study (see Research Summary 2-3) conducted in an insurance agency building found a 16 increase in performance on forms processing when the company moved into a new building (Kroner et al 1992) The measure was actual work productivity not performance on simulated tasks Of the overall 16 increase in productivity 3 was attributed to using personal controls over temperature and ventilation and 13 was attributed to generally improved building quality and interior design including improved daylight views of a natural landscape better access to windows by workers and increased visual openness of the environment In a review of building studies Wyon (1996) estimated that providing workers with temperature control of just three degrees (plus or minus) would result in productivity increases of 7 for typical clerical tasks
32 In some cases researchers have attempted to associate a dollar figure on the absenteeism and other occupant benefits The Center for Building Performance and Diagnostics within the School of Architecture at Carnegie Mellon University has collated a large body of research into a tool called the Building Investment Decision Support This tool allows a user to generalize the results of a particular research studies to estimate potential dollar benefits at the users facility
2-24
This study assessed the impact of workstation personal controls and other features typically associated with sustainable buildings on worker productivity using an existing performance monitoring system When the organization moved into the new building overall productivity increased by 16 Of that 3 was associated with the system that provided personal control over temperature air velocitydirection task lighting and sound masking
Research Team Rensselaer Polytechnic University
Research Setting The research took place in an existing building and a new building that had personal controls at most of the workstations
Features of the Old Building bull 61800 ft2 for 400 workers (considered crowded) bull No task lights ceiling lights were 4-ft recessed
fluorescent fixtures bull Three different air distribution strategies bull Located in the center of town bull Managers located along window wall workers in
central core
Features of the New Building bull 149800 ft2 for 400 occupants and many amenities
(conference rooms instructional rooms auditorishyum cafeteria exercise room and outdoor patio)
bull Skylights bull Indirect lighting bull 370 workstations with personal control over
temperatures air velocity and direction task lighting and sound masking
bull 92 of workers on the perimeter with access to daylight and views (versus 30 in old building)
Personal Control System
bull Location in a prairie landscape setting with trees and a pond
Methodology Data were gathered for workers in the accounting and underwriting departments for 27 weeks before they moved into the new building and 51 weeks after the move files of each type that each employee processed during the week ly account for the effect of the personal controls (versus the potential impacts of other building or organizational changes) components of the control system were randomly disabled during the last 24 weeks of the study ndash air velocity air temperature and the radiant panel
Data included the number of To separate
Key Findings The studys results included the following bull The combined effect of the new building and the personal controls produced a median increase in
productivity of about 16 Personal controls accounted for a 3 increase and the new building and setting accounted for 13
bull Overall satisfaction increased from 46 in the old building to 75 in the new building bull Satisfaction with the new buildings temperatures air quality noise and lighting all improved
Sources Kroner et al (1992)
2-25
bull Attention and concentration Studies have also found that certain sustainable design features improve performance on tasks requiring high levels of attention For instance a study by Nunes et al (1993) found performance increases from 7 to 30 depending on the task The variability in performance was attributed to differences in ventilation levels and the consequent impact on illness symptoms Lower levels of ventilation were linked to higher reports of symptoms which in turn were associated with poorer performance Workers reporting symptoms worked 72 slower on a vigilance task and made 30 more errors on a digit substitution task
Numerous studies show performance problems from increases in noise distractions and interruptions (Fried et al 2001 Jones and Norris 1992) Decreased performance is more likely for complex creative tasks and tasks relying heavily on short-term memory such as writing and computational work Many of the factors that increase noise distractions (eg smaller workstation sizes increased densities and reduced use of carpeting or other sound-absorbing materials) are commonly used to achieve sustainable goals such as increased access to daylight and views and improved flexibility Therefore sustainability-oriented designers should consider both positive and negative impacts of various design features in the final design
bull Complex cognitive performance Improved performance on logical thinking tasks has also been reported in a review of interior environmental quality (Wyon 1996) Wyon cites studies in Sweden showing a 27 increase in logical thinking associated with personal control over temperatures The impact of temperature conditions on performance is complex with some studies showing improved performance on creativity and memory tasks with slightly elevated temperatures and with the opposite shown for concentration and logical thinking which may benefit from slightly cool temperatures (Wyon 1996)
bull Organizational level performance Most productivity studies focus on individual level work However there is evidence that building design can influence high-level organizational outcomes An analysis of the Total Quality Management (TQM) metrics data used by Herman Miller to assess its performance shows small increases of 022 in overall productivity and increases of 1 to 2 on other indicators after the organization moved into a new sustainable building (Heerwagen 2000) (This study is described in Section 32)
bull Self-ratings of productivity Research in office settings often resorts to employees rating their own productivity (ie self-rating) because of the difficulty of obtaining actual work outputs Although self-measures tend to be overestimated when the measure is used in a comparative manner to assess responses to baseline environments and change initiatives they provide useful information (Leaman and Bordass 2001) They also are fairly easy to administer
Studies using self-assessments of productivity have found strong relationships to thermal and air quality factors in line with studies of actual performance as noted above In a review of occupant surveys over a 20-year period in the United Kingdom Leaman (1999) reports that comfort and perceived productivity are greater in buildings where occupants have more control over the environment and in mixed-mode buildings that have both natural ventilation and air conditioning Two studies of more than 11000 workers in 107 buildings in Europe also found increases in perceived productivity in buildings that provided workers with control over temperature and ventilation conditions (Preller et al 1990)
Similar results are reported for an intervention study in Canada (Menzies et al 1997) The study consisted of two groups of workers in a mechanically ventilated building The intervention
2-26
group was given control over the ventilation at the workstation with a handheld infrared device that could regulate the amount and direction of air flow from four-inch air outlets in the ceiling The control group was not given any control over ventilation Workers in the intervention group said their productivity increased by 11 at 16 months after the study In contrast workers in the control group said their productivity decreased by 4 Environmental assessments of the two spaces showed that air velocity in the intervention space tripled and that both temperature and ventilation variability across the space increased also (an indication that workers were making adjustments according to their personal preferences and needs)
A field study of electric lighting systems found increased self-ratings of performance with indirect lighting due to decreased glare on computer screens as well as reduced eye problems (Hedge et al 1995)
Other Economic Benefits to the Building Owner
Federal agencies as well as sustainable building owners in the private sector are likely to accrue economic benefits as a consequence of a sustainable facilitys environmentally and socially conscious image and its positive impacts on building occupants prospective employees the community surrounding the facility and society as a whole
Research has been conducted on a few important topics related to sustainable buildings from which inferences can be drawn about the building owners economic benefits which are sometimes less direct andor longer term than the benefits described in Sections 21 through 26 This section discusses several of these somewhat indirect or longer-term economic benefits
bull Better worker retention and recruitment bull Lower cost of dealing with complaints bull Decreased risk liability and insurance rates bull Greater building longevity bull Better resale value bull Ease of siting bull Strategic and economic value of an improved image
Better Worker Retention and Recruitment
The environmentally conscious image associated with an agency that builds or occupies sustainable buildings may result in employee pride satisfaction and well-being that translate into reduced turnover improved morale and a more positive commitment to the employer These effects may have a big financial impact by reducing labor replacement and training costs In addition these effects transfer to the building owner a reputation as a desirable employer which in turn creates valuable leverage for attracting recruiting and retaining talented employees Moreover developing a high-caliber workforce ultimately results in additional long-term performance benefits described above While rigorous statistical studies on employee retention and attraction in sustainable facilities have not been conducted many studies have shown increased feelings of well-being associated with sustainable buildings (see Section 32) The retention and attraction aspects are a logical (although not fully proven) extension of feelings of well-being
In his recent book The Sustainable Advantage Willard (2002) argues that sustainability as a corporate strategy will become more common if it can be linked more convincingly to business value As Willard argues organizations that make sustainability a core value may benefit by being
2-27
able to attract and retain young workers who also value the environment and who will therefore be more willing to work harder to ensure that the organizations environmental values are realized Willard also acknowledges that the work environment itself may influence attraction retention and productivity by creating better working conditions
Lower Cost of Dealing with Complaints
When building occupants are uncomfortable ndash typically from a room temperature that is too hot or too cold ndash building maintenance engineers spend hours dealing with complaints In a study of the costs of dealing with discomforts researchers estimated that efforts to increase comfort could decrease the labor costs of responding to complaints by 12 (Federspiel 2001) The data from the study show that it takes 14 hours on average to diagnose a hot complaint and 17 hours to diagnose a cold complaint The data also suggest that complaints are not due to differences among individuals but rather to HVAC faults or poor control performance Sustainable buildings that have well-designed HVAC and control systems that have been commissioned are less likely to experience these problems
Another study reports that personal controls for HVAC systems reduce complaints to as low as 10 calls per 1000 employees per year (Loftness et al 2002) (Those controls can be installed only in conjunction with underfloor air distribution systems)
Less time dealing with complaints leads to more time to complete preventive maintenance tasks increasing equipment longevity and lowering operating costs overall
Decreased Risk Liability and Insurance Rates33
Building owners and operators face a wide range of risks (described below) which are particularly disruptive and costly in mission-critical governmental activities (civilian or military) Those risks may be partially mitigated by sustainable building design
bull Property loss prevention Various green-building technologies reduce the likelihood of physical damages and losses in facilities (American Insurance Association 1999 Vine et al 1998 and 1999 and Mills 2003b) For example sustainable siting reduces the likelihood of property damage from flooding mudslides and soil subsidence Efficient thermal envelopes and reduction in losses from recessed lighting or thermal distribution systems located above ceilings reduce the risk of ice-dam formation on roofs Using efficient torchiere light fixtures eliminates the fire risk posed by halogen versions
bull Business interruption loss prevention Unplanned power outages and improperly designed or maintained HVAC systems can cause temporary closure of facilities resulting in disruption of operations and relocation costs (Brady 1995 Eto et al 2001 and Mills 2001) These business interruption risks can be reduced by using onsite energy generation resources and energy-efficiency features
bull Hedge against energy price and cost increases Energy is a significant part of facility operating costs The likelihood of budget overruns from unanticipated energy price spikes can be reduced by energy-efficient design that lowers overall consumption
bull Natural disaster preparedness and recovery Various energy-efficient and renewable technologies make facilities less vulnerable to natural disaster events such as heat catastrophes which are a particularly high risk for federally operated low-income housing (Deering and
33 Dr E Mills of Lawrence Berkely National Laboratory contributed portions of this section
2-28
Thornton 1998 Mills 2003a) Well-insulated attics natural ventilation and heat-reflective roofing materials can considerably reduce indoor temperatures during heat waves averting hospitalization or loss of life Using multipane (eg triple-glazed) windows can reduce the threat of fire-related losses
bull Worker health and safety and risk of lawsuits Various benefits result from improved indoor environmental quality reduced likelihood of moisture damage and other factors enhancing occupant health and safety (Chen and Vine 1998 Vine et al 1998) Owners may face lawsuits when their buildings cause illness among occupants According to a study by the American Medical Association and the US Army health problems caused by poor indoor air quality cost 150 million workdays and about $15 billion in lost productivity each year in the United States 34
Increasingly the issue of sick building syndrome ends up in the courts with either builders designers or building owners being held liable for design flaws or improper operation For example in 1995 a jury awarded Polk County Florida almost $26 million to correct the con-tractors health-related design and construction flaws in the Countys eight-year-old courthouse In 1996 a jury found Dupage County Illinois responsible ndash as the building owner ndash for health-related complaints at its $53 million courthouse calling the problems a result of improper OampM34
Risk (and associated losses) has a cost even when organizations are insured Customer-side costs that occur when insurance is used include deductibles premiums (and premium increases or policy cancellations due to losses) and possible excess costs if the insurance or reinsurance coverage is capped If commercial insurance is not used (as is often but not universally the case in the government sector) the costs of risk are even higher because the facility owner is either formally or informally self-insured Formal self-insurance implies that a predefined premium is set aside from internal budgets and accumulated in the form of an earmarked loss reserve If self-insurance is informal (typically the case in the public sector) then the risks are not explicitly anticipated or otherwise reserved Where formal or informal self-insurance is used in the public sector risk management takes on particularly high value because there is no upper limit against loss costs and because losses would usually have to be absorbed in general operating budgets without guaranty of reimbursement
When Federal facilities do have insurance coverage some insurance companies are willing to offer lower insurance premiums for buildings or sites that have incorporated features that not only improve safety but that also have positive environmental effects For instance insurance companies have lowered premiums for buildings with high mass walls because they reduce the risk of fire These walls can also save energy and enhance comfort by storing heat and evening out temperature fluctuations In another example of lower premiums the Federal Emergency Management Agency reduced the premium on flood insurance by 5 for all buildings in unincorporated areas of Charleston County South Carolina based on voluntary efforts on the part of the developers of Dewees Island to improve the countys flood management capabilities by taking actions to reduce the chance of flooding on the island34
A number of forward-looking insurers have endorsed or otherwise supported energy-efficient and renewable energy technologies by initiating various types of programs or policies (Mills 2003b) In some cases insurance companies have offered premium credits of about 10 when the insured implemented selected energy-saving strategies For example the nations largest professional liability insurer ndash DPIC ndash offers 10 credits for firms that practice commissioning and the former
34 Rocky Mountain Institute website httpwwwrmiorgsitepagespid221php
2-29
Hanover Insurance Company offered 10 credits for earth-sheltered or solar buildings on the basis that lower fuel-based heating system operating hours reduce fire risk (Mills 2003b)
Greater Building Longevity
Many of the principles of sustainable design lead If our buildings are not designed to last at least 250 to longer building lifetimes and better adaptabishyto 300 years were not asking the right questions
lity of the building for future uses that cannot always be foreseen If buildings do not have to John Abrams South Mountain Company be frequently demolished and replaced total (quoted in Building Green Inc 2003) construction costs will be lower over the long run For instance keeping a buildings initial form simple will make it easier to change as needs evolve Using open-web joists and modular access flooring systems makes refitting buildings for new uses less complicated Designing rooms as multipurpose spaces allows them to be adapted for future changes in use (eg from residential to commercial space) Other strategies for adaptability include selecting durable materials that age well designing roofs to be photovoltaic-ready designing the building foundation and structure to accept additional floors at a later date avoiding partitions and leaving as much open space as possible and designing with classic and regionally appropriate styles 35
Better Resale Value
Although turnover of Federal government buildings is not as frequent as in the commercial real estate market the Federal government does sometimes sell unneeded facilities For instance in 1998 the GSA sold over 1500 properties for a total of about $250 million In subsequent years the GSA has sold between 130 and 300 buildings per year for a total price per year of $312 million to $479 million 36
Research shows that investing in sustainable design features such as energy- and water-efficiency measures can considerably increase the resale value of a property because it lowers annual costs and therefore makes a building more profitable for the new owner (Chou and Parker 2000) Real estate investors evaluate building values based on cash flow and net operating income (NOI) which is the pretax operating income minus operating expenses excluding debt service Reducing utility costs increases NOI A case study showed that a one-time investment in energy- and water-efficiency upgrades that cost $095ft2 (18 of the purchase price) saved $066ft2 in annual operating costs (equal to 15 of NOI) (Mills 2002) These savings increased the estimated resale value of the property (a small apartment building) by $36000 to $46000 (for prevailing capitalization rates of 9 and 7 respectively) ndash about ten times the initial investment for the improvements 37
Ease of Siting
The inherent environmental benefits of a sustainable building will reduce its adverse environmental impacts and enhance its acceptability to regulatory bodies the surrounding communities environshymental groups and other interested parties These benefits will tend to lower both the time delays and the cost associated with siting the building including obtaining permits and performing
35 Many strategies for making buildings adaptable for new uses are outlined in a recent article in Building Green Inc (2003)36 Personal communication from R Rice GSA 37 The capitalization or CAP rate (also knows as return on assets ROA) is defined as the ratio of NOI to the property value The ratio NOICAP provides an approximation of property value
2-30
environmental impact studies Gaining early respect and support from a community can greatly speed up project approvals For example the developers of Central Market a grocery store in the town of Poulsbo Washington say that the decision to enhance an onsite wetland and offer it to the city as a park not only reduced maintenance costs but also avoided delays by generating strong community support The developer Sam Clarke Executive Partner of the Hattaland Partnership stated The city of Poulsbo and key community leaders are well aware of our work [to enhance the environment] mdashthis establishes trust and respect which translate eventually into financial advantages38
Strategic and Economic Value of an Improved Image
An organization that owns and operates a sustainable building will tend to capture intangible value through stakeholder awareness and respect While difficult to quantify precisely this effect undoubtedly creates strategic advantage in dealing with various stakeholders eg nongovernshymental organizations other agencies and the public In essence the sustainable nature of the building can be considered a symbolic message to building visitors as well as community members and passers-by who recognize its distinctive character For example innovative sustainable buildings in the private sector including the headquarters buildings of The Gap and Herman Miller as well as the Ford Motor Company Rouge Plant have received extensive positive media coverage
Key aspects of the message conveyed by a sustainable or green building include technological advancement architectural innovation and concern for humanity and the environment The building owners can promote this message through various awareness-building techniques including posters brochures organized tours and media publicity When the sustainability of the building reinforces the primary mission of a Federal agency (eg environmental management energy efficiency and technological innovation) this image value will be particularly powerful Community groups elected representatives nongovernmental organizations and others involved in the political process may view the Federal agency owner of a sustainable building as a supporter of their interests and this positive view can translate into improved political support
Some research has been conducted to evaluate indirect financial benefits of corporate sustainability efforts While these efforts have not been directed specifically at sustainable building projects they do have some relevance to understanding the value of the improved image associated with an organizations sustainability-related activities For example a number of environmental accounting techniques have been developed using economic value added and other shareholder value measures to estimate the likely future cash flows related to the environmental impacts of capital investments and facility siting decisions (Epstein and Young 1999)
One ongoing project by SustainAbility a strategic management consultancy and think tank based in Europe has established a mapping between business value measures and dimensions of corporate sustainable development performance with documented examples that will be expanded through continued updating (SustainAbility and United Nations Environmental Program 2001) The SustainAbility project found strong evidence linking access to capital and shareholder value to a companys commitment to environmental process improvement They also found strong evidence linking corporate revenue to good workplace conditions These results indicate that both environmental and social aspects of sustainable design may impact a companys economic performance Although the government is not motivated by revenue and shareholder value per se
38 Excerpted from Rocky Mountain Institute website httpwwwrmiorgsitepagespid221php
2-31
some government analogs to these metrics exist (eg revenue and access to capital in the private sector could be viewed as analogous to higher budget allocations in a government setting)
In another effort the American Institute for Chemical Engineers (1999) developed a total cost assessment methodology for managerial decision-making that identifies the full range of environmental- and health-related costs associated with the lifecycle of a business decision including indirect contingent and intangible costs The World Resources Institute recently published a critical survey of the available methods for quantifying the business case for sustainability (Reed 2001) The greatest impediment to applying these types of quantitative methods is the absence of sufficient empirical data Not enough experience exists yet with sustainable business decision-making to satisfy the needs of financial analysts However as this section has discussed in detail research has been conducted on many important economic benefits of sustainable buildings from which good inferences can be drawn about the strategic and financial advantages of sustainable design and construction
Indirect Economic Benefits to Society
Building construction operation and demolition have a variety of environmental impacts including air pollution emissions greenhouse gas emissions associated with climate change solid waste generation water pollution natural resource depletion and habitat disturbance (see Section 4) Sustainable design aims to significantly reduce these impacts These improvements will reduce the health effects and costs associated with environmental pollution and will have other less tangible economic value to society In addition by reducing energy consumption and waste generation widespread application of sustainable design principles to new construction and renovations will over time reduce the need for new infrastructure required to support buildings ndash eg power plants transmission and distribution lines and landfills ndash and may foster local and regional growth in emerging businesses related to sustainable design The economic aspects of these societal benefits ndash decreases in environmental pollution reduced infrastructure needs and localregional business growth ndash are discussed in the sections below
The Value to Society of Environmental Preservation and Pollution Reduction
Sustainable design strives to lower energy consumption and the resulting air pollution and greenhouse gas emissions as well as to preserve natural resources wildlife habitats (eg forests and wetlands) water bodies scenic vistas and other environmental assets Economic values placed on such environmental goods are currently used for various purposes (mostly legal and policy issues) and natural resource economists have developed various means to estimate the value of natural resources and environmental impacts Although some would say that something like a unique ecosystem is priceless certain groups within American society place economic value on and are willing to pay for environmental and natural resources For instance the Nature Conservancy is planning to invest $1 billion to save 200 of what they call the worlds Last Great Places39
Various approaches have been applied to place a dollar value on reductions in air pollution emissions One way is to examine the price firms pay to buy pollution credits The Clean Air Act established a program by which power plants were required to reduce their emissions of sulfur dioxide (SO2) to a specific emission cap The program allowed companies that could reduce emissions below their caps to sell the extra reductions (credits) to other firms allowing those other
39 httpnatureorgaboutuscampaign
2-32
firms to emit above their caps As time progressed firms with high costs of SO2 control have chosen to buy credits from those with lower costs of control
These emission credits are openly traded in the market Recent prices have ranged from $90 to $272 per ton (National Research Council 2001) In addition New Jersey and five other states in ozone nonattainment zones 40 have developed open market emission trading programs whereby building owners can generate emission credits by investing in energy efficiency measuring the electricity saved and determining (based on a prescribed formula) the amount of air pollution emissions that were avoided by not generating the electricity These credits have been sold for about $1000 per ton for nitrogen oxide (NOx) (New York City Department of Design and Construction 2000) However the current market value of air pollution credits does not necessarily reflect the full cost of pollution damages eg negative health and welfare impacts
A number of research studies using a variety of methods 41 have estimated the societal cost of a pollution The cost ranges are wide because the methods and assumptions are diverse The studies estimate the costs as follows (National Research Council 2001)
bull Emissions of SO2 at $100 to $7500 per metric ton ($91 to $6800 per ton) bull Emissions of NOx at $2300 to $11000 per metric ton ($2090 to $10000 per ton) bull Emissions of carbon dioxide (CO2) at $6 to $11 per metric ton ($550 to $10 per ton)
These values could be used especially within a Federal government context to estimate the societal benefit that reduced energy consumption in sustainable buildings has on reducing emissions
In the prototype building analysis described in previous sections the energy-efficiency measures led to the following emission reduction estimates 016 tons of SO2 008 tons of NOx and 107 tons of CO2
42 Using the maximum values in the ranges above these emission reductions might be valued as high as $1090 (for SO2) $800 (for NOx) and $107 (for CO2) with a total annual cost reduction to society of $2000 This value ($2000) could be used to represent the annual benefit to society that would partially offset the incremental first cost of the energy-efficiency measures (which in this case was $38000) Including these societal cost reductions in the payback calculation lowers the payback period from 87 to 60 years
40 Nonattainment zones area areas with ambient concentrations of air pollutants that exceed the standards set to protect health and welfare 41 Some of these methods include indirect observed behaviors direct hypothetical behavior and indirect hypothetical behavior (for an overview see descriptions by Randall [1987] Freeman [1992]) The indirect observed behavior method tries to relate the value of a nonmarketed good (such as the price people would pay for a clean environment) to a marketed good (such as the price people would pay for recreational fishing) Economists commonly use the travel cost method or the hedonicimplicit price method The travel cost method uses travel expenditure as the price paid to access a site such as a natural park to estimate a demand for that site The hedonicimplicit price method investigates how a nonmarket good influences the value of a market good hypothetically this method could be used to estimate how a pristine environment surrounding a building might influence the rent or market price for that real estate Direct and indirect hypothetical behavior uses hypothetical questions to elicit the value of a nonmarket good from a respondent (contingent valuation method)42 Expressed in tons of carbon in CO2
2-33
Reduction in Municipal Infrastructure Requirements
Taxpayers and localregional governments benefit financially when they are required to invest in fewer new infrastructure projects Some ways infrastructure needs are reduced through sustainable design include the following
bull Siting buildings near public transportation and including other features that encourage public and bicycle transportation rather than use of personal vehicles not only can reduce air pollution but also can reduce regional road and highway infrastructure requirements
bull Redeveloping brownfield sites or locating new buildings in downtown areas rather than suburban or rural greenfield sites reduces the associated development costs for new transmissiondistribution systems sewer systems roads and other infrastructure systems
bull Using recycled materials and construction waste management reduces demand for landfill capacity and therefore landfill construction costs
bull Reducing water use lowers the need for new wastewatersewage treatment plants
Local and Regional Economic Growth
Long-term socioeconomic benefits to a community and region may be realized if enough builders and building owners adopt sustainable design practices For example the sustainable buildings industry could foster a market for recycled materials and energy-efficient systems creating sufficient economies of scale to reduce the price of these types of products to be more competitive with conventional products In addition surrounding communities and the region may experience economic development (including job creation) through emergence of businesses that make sustainable materials produce energy-efficient technologies and provide sustainable design construction and commissioning services A region prone to practicing sustainable design and construction is an attractive place for these companies to locate This potentially produces additional local jobs and income Government sustainable design projects can be a seed for growth of sustainable communities and regions
Sustainable building design also tends to Building on the many laudatory accomplishments of past favor local sources of materials and labor generations I want my generation and my administration further stimulating the economy adjacent to ensure that following generations can flourish and leave to the building site and providing to their children a healthy and stable Oregon We can and economic benefits that are particularly must reduce the pressures on our environment while
important in areas that are economically increasing economic growth and community health
disadvantaged For instance the State of Oregon Governor Ted Kulongoski Rally for the Oregon recently passed legislation and the Environment Remarks March 24 2003 SeeGovernor signed an Executive Order to httpwwworegonsolutionsnetoregonindexcfm
promote sustainability in various government functions One aspect of the initiative involves improving contracting practices to ensure that local contractors and businesses have competitive opportunities in rural and distressed communities 43
Another potential impact of sustainable design is an increase in property values adjacent to the sustainable building site The characteristics cited above that contribute to quality of life will also tend to enhance the desirability of the neighborhood for developing other economic enterprises including residential housing
httpwwworegonsolutionsnetgovtgroupcfm
2-34
43
The Social Benefits of Sustainable Design
The social benefits of sustainable design are related to improvements in the quality of life health and well-being These benefits can be realized at different levels ndash buildings the community and society in general At a building level research on the human benefits of sustainable design has centered on three primary topics health comfort and satisfaction Although these outcomes are clearly interrelated they have different scholarly roots and employ different methodologies Health issues are the domain of epidemiologists and public health professionals Comfort is studied by researchers with expertise in building science and physiology while well-being and psychosocial processes are studied by environmental and experimental psychologists The research described in this section integrates findings from these diverse areas with a focus on studies that assess the health comfort and well being outcomes associated with the presence or absence of sustainable building components
The building environment can have both negative and positive impacts on the occupants quality of life Negative impacts include illness absenteeism fatigue discomfort stress and distractions resulting from poor indoor air quality thermal conditioning lighting and specific aspects of interior space design (eg materials selections furnishings and personnel densities) Reducing these problems through sustainable design often improves health and performance Improved indoor air quality and increased personal control of temperatures and ventilation have strong positive effects In addition to reducing risks and discomforts buildings should also contain features and attributes that create positive psychological and social experiences Although less research has been done on health-promoting environments emerging evidence shows that certain sustainable building features including increased personal control over indoor environmental conditions access to daylight and views and connection to nature are likely to generate positive states of well- being and health
Another emerging social issue affecting buildings is security Since September 11 2001 Federal agencies have experienced heightened concern about how a buildings features affect its ability to thwart or withstand hostile actions The relationships between sustainable design and building security are important topics that will be discussed in this section
At a community or societal level the social benefits of sustainable design include knowledge transfer improved environmental quality neighborhood restoration and reduced health risks from pollutants associated with building energy use Although more research has been conducted on the benefits of sustainable design features to building occupants interest is growing in the community benefits of sustainable design and several potential areas of value to the Federal government are discussed at the end of this section
The first two sections below describe research results indicating positive impacts of sustainable buildings on occupant health (Section 31) and comfort satisfaction and well-being (Section 32) (Appendix F discusses these topics in more detail) Section 33 describes the potential benefits of energy efficiency and other sustainable design features to occupant safety and security Section 34 describes potential positive community impacts
Better Health of Building Occupants
Studies of the health benefits of sustainable design focus primarily on indoor environmental quality especially air quality Health effects result from environmental stimuli interacting with the
3-1
bodyrsquos physical systems especially respiratory skin neural and visual pathways Illness symptoms occur because environmental agents (such as chemicals or airborne microbials) affect the operation of the bodyrsquos physical systems in vulnerable persons
Many studies have found high levels of air-quality problems and occupant illnesses in office buildings (eg Brightman and Moss 2001) Studies have begun to assess the causal relationships between the building environment and illness symptoms in three areas (1) sick building syndrome (SBS) (2) asthma and allergies and (3) communicable and respiratory diseases (Fisk 2001) Research Summary 3-1 shows an example of such a study The findings of this research show that the three types of illnesses are affected by different components of the environment
bull Sick building syndrome SBS symptoms include headache fatigue dizziness irritations of the skin eyes and nose and difficulty breathing A large review study of the links between health perceived air quality absenteeism and ventilation found that ventilation rates lower than 10 Ls per person were associated with statistically significant worsening of symptoms in a range of building types44 Increases in ventilation rate above 10 Ls up to 20 Ls per person were associated with decreased symptoms and improvements in perceived air quality A ventilation increase of 5 Ls per person could reduce the proportion of workers with these respiratory symptoms from 26 to 16 and those with eye irritations from 22 to 14 (Seppanen et al 1999) SBS symptoms are also reduced by personal control over thermal conditions (Preller et al 1990 Hedge et al 1993) improvements in ventilation system maintenance and cleaning reduced use of pesticides and daily vacuuming (Sieber et al 1996)
bull Allergy and asthma symptoms Several building factors ndash moisture problems molds and dust mites ndash are strongly associated with asthma and allergy symptoms (Fisk 2002) Reducing the concentrations of allergens and irritants reduces symptoms Successful strategies for reducing such concentrations include improving HVAC maintenance and cleaning and using building practices that reduce moisture buildup (Sieber et al 1996) Other strategies include air filtration humidity control and elimination of indoor smoking Asthma symptoms were found to more likely occur in the presence of new drywall and in building interiors with cloth partitions (Sieber et al 1996)
bull Transmission of infectious diseases Infectious diseases can be transmitted by airborne microbes (viruses bacteria) Airborne transmissions can be reduced significantly through ultraviolet irradiation of air near the ceiling improved ventilation and reduced crowding (Fisk 2000b Seppanen et al 1999) One study found that workers with one or more officemates were 20 more likely to have two colds during the year than workers who did not share an office (Jakkola and Heinonen 1993) Studies showing reduced risk with lower crowding do not identify what level of density is desirable for health reasons
Health problems can be linked to absenteeism A study of absenteeism among office workers in a large East Coast company found that the absenteeism rate was 35 lower in offices with higher
44 Ventilation and air circulation are important but sometimes overlooked features of sustainable buildings Ventilation refers to the air exchange between the outside and the inside of the building Circulation refers to the air movement within and between the interior spaces of the building Both ventilation and circulation can be achieved through mechanical means (eg fans within air ducts) or by utilizing natural principles (eg warm air naturally rises) In either case a well-designed system should provide sufficient ventilation to dilute contaminants generated within the building space (by either building components or occupants) as well as adequate air circulation within and between building spaces to disperse built-up air contaminants locally while not adversely affecting the occupantsrsquo perception of temperature (eg creating drafts) It is particularly important that measures to increase energy efficiency by ldquotightening uprdquo a building take into consideration the need to maintain adequate ventilation rates Good ventilation and energy efficiency can be achieved simultaneously by using sustainable building measures such as heat recovery devices
3-2
ventilation rates (about 24 Ls per person) compared with moderate rates of 12 Ls ((Milton et al 2000) The use of humidification and complaints about air quality were also associated with increased sick leave The study analyzed sick leave of 3720 hourly workers in 40 buildings The study controlled for gender age seniority hours of nonillness absence shift ethnicity crowding and type of job (See Section 26 for additional information about absenteeism)
2
Researchers conducted a critical review and synthesis of research on the associations between ventilation rates and occupant health to provide a scientific basis for setting health-related ventilation standards The review shows that illness symptoms are often associated with low ventilation rates high CO2
concentrations and perceptions of poor air quality
Research Team The research team included OA Seppanen from Helsinki University of Technology WJ Fisk from Lawrence Berkeley National Laboratory and MJ Mendell from the National Institute for Occupational Safety and Health
Methodology Both cross-sectional and experimental studies were reviewed The following criteria were used for including cross-sectional studies
bull The study included at least three buildings or ventilation zones bull Results were statistically analyzed and included controls for other factors that can influence health
outcomes
The following criteria were used for including experimental studies
bull No changes occurred in the air-handling system and occupants did not move to a different building bull A control group or multiple applications of experimental conditions were used bull The subjects were not aware of the timing of changes in the ventilation rates bull Results were statistically analyzed
These criteria resulted in the selection of 20 studies with 30000 subjects for investigating the association between ventilation rates and human responses and 21 studies with over 30000 subjects for investigating the relationship between CO2 concentrations and human responses
Key Findings Some of the key results of the review are as follows
bull All studies assessing respiratory illness found a significant increase in the risk of illness with lower ventilation rates
bull Of the 27 studies dealing with SBS 20 found a significantly higher prevalence of at least one symptom with lower ventilation rates
bull Findings of illness symptoms were especially consistent with ventilation rates of less than 10 Ls per person
bull Lower ventilation is also associated with increased perceptions of poor air quality bull CO2 studies supported the ventilation findings in half of the studies symptoms improved
significantly when CO2 concentrations were below 800 parts per million (ppm) bull Studies did not find a definitive ventilation rate that prevented symptoms bull Only 5 of the studies were conducted in hot humid climates Results may therefore apply primarily to
moderate and cool climates
Source Seppanen et al (1999)
3-3
Improved Comfort Satisfaction and Well-Being of Building Occupants
Psychological effects (eg comfort satisfaction and well-being) are generated through perceptual and sensory processes that interpret environmental information in terms of its effect on current needs activities and preferences The psychological interpretation of the environment has consequences for work performance and productivity (as discussed in Section 26) stress and wellshybeing Because of the inherent variability in psychological responses the same environmental conditions can affect different people in different ways as well as affect the same person differently over time depending on the context
Occupant comfort and satisfaction with building conditions are a primary focus of post-occupancy evaluations The research generally shows that occupants satisfaction with lighting and air quality is higher than their thermal and acoustic satisfaction (Leaman and Bordass 2001) Efforts to improve comfort and satisfaction are important because discomfort has negative consequences for work effectiveness job satisfaction and quality of work life
A number of studies indicate that certain building features such as daylight views connection to nature and spaces for social interaction appear to have positive psychological and social benefits The benefits include reduced stress improved emotional functioning increased communication and an improved sense of belonging
Occupants satisfaction with several building features has been examined in a number of studies described below
bull Satisfaction with daylighting and electric lighting A study of seven energy-efficient buildings in the Pacific Northwest found that 70 of the occupants were satisfied with lighting overall (Heerwagen et al 1991) Factors that most influenced lighting satisfaction were access to windows and daylight some degree of control over lighting and the occupants location in the building (those on the east and in corner spaces were most satisfied) Workers in windowed areas were 25 to 30 more satisfied with lighting and with the indoor environment overall compared with workers having reduced access to windows The Pacific Northwest study found that occupants valued daylight for its variability both across the day and across seasons (Heerwagen et al 1991) Several reviews have also found that satisfaction with electric lighting improves with reduced glare problems and with increased brightness of vertical surfaces including walls and cubicle partitions (Collins et al 1990 Collins 1993)
bull Thermal satisfaction Thermal satisfaction is consistently lower than lighting satisfaction in most building studies partly because of the high variability in thermal comfort Occupant responses to the thermal environment are influenced by activity clothing levels stress age gender and individual preferences The most effective way to improve thermal comfort and satisfaction is by using individual controls for temperature and ventilation (Wyon 1996) The responsiveness of building management to complaints also improves comfort and satisfaction (Leaman and Bordass 2001)
bull Perceptions of air quality Negative perceptions of air quality are common and are associated with low ventilation rates (Seppanen et al 1999) In six cited studies 50 of occupants said the air quality in their buildings was unacceptable even though the building itself was not considered a complaint building (Seppanen et al 1999) Increased ventilation improves perceptions of air quality if the intake air itself is located at least 25 feet from an irritant source (eg an exhaust vent traffic or a trash dumpster) (Sieber et al 1996) Air quality is also
3-4
associated with food and its odor problems especially when the food is eaten by workers at their desks (Heerwagen et al 1991)
bull Overall satisfaction A recent large-scale study (Leeman and Bordass 2001) of 16 buildings in England identified several features that were consistently associated with higher levels of overall satisfaction ࠃ Shallower plan forms and depths of space (buildings and rooms that are long and narrow) ࠃ Thermal mass ࠃ Stable and comfortable temperature conditions ࠃ Operable windows ࠃ Views out ࠃ Usable controls and interfaces ࠃ Places to go at break time ࠃ A well-informed and responsive building management
bull Psychosocial well-being Although sunlight can create glare and heat gain in buildings if it is not controlled properly evidence suggests that a modest level of sunlight indoors (sun spots) significantly enhances psychological functioning and job satisfaction compared with spaces lacking daylight and sun (Leather et al 1998) Although people prefer being in windowed rather than windowless spaces the view itself has consequences for well-being Studies have found that views of nature are especially beneficial and reduce stress provide mental relief improve perceived quality of life and improve emotional functioning (Ulrich 1984 Clearwater and Coss 1990) A case study (Heerwagen 2000) of the Herman Miller building in Holland Michigan shows improvements in social functioning and sense of belonging associated with including break areas a centrally located cafeteria an interior daylit and tree-lined street and high levels of internal glazing that offered views into the street and interior spaces (see Research Summary 3-2)
Occupant Safety and Security
In the wake of the September 2001 attacks every Federal agency faces a heightened concern for providing safe and secure workplaces and public spaces in Federal office buildings military facilities and other public facilities At first it might seem that features aimed at improving security will inevitably require some sacrifice of energy efficiency or other sustainable design characshy teristics For example sustainability principles might be considered inconsistent with using additional steel and concrete to increase blast resistance eliminating natural ventilation reducing window areas (daylight passive solar heating) to minimize danger from flying glass and increasing energy use from ventilation fans associated with high-performance air filters
In the process of renovating the Pentagon weve found that several of the force protection measures we are taking to protect the Pentagon against terrorist attacks are complementary to our sustainable construction efforts These are all examples of building security and energy efficiency working hand in hand
Teresa Pohlman Special Assistant for Sustainable Construction US Department of Defense
While such tradeoffs may be required in specific cases a careful examination of the options for integrated design at both the individual building level and at the site (or campus) as a whole has led many designers to conclude that improved building security and improved energy efficiencysustainability not only can coexist but can even be complementary
3-5
This study examined occupant satisfaction as well as productivity (based on Herman Millerrsquos own TQM metrics) Results indicate that the new sustainable building had positive impacts on occupants well-being job satisfaction feelings of belonging and other aspects of work life that affect individual job performance The study also found that a small increase in organizational productivity occurred after the move to the new building
Research Team PNNL J Heerwagen lead
Research Setting The Green House designed by William McDonough and Partners of Charshylottesville Virginia is a 290000-ft2 building that combines a manufacturing plant and office facilitiesshowroom for Herman Miller Inc a furniture manufacturing company This facility is located in Holland Michigan The building has the following sustainable features
bull Extensive daylighting including an interior daylit street windows skylights and roof monitors in the manufacturing plant
bull Operable windows in both the manufacturing plant and office bull Views to the surrounding countryside from all locations bull Energy-efficient glazing and lighting bull Lighting controls that dim electric lighting when daylight is sufficient bull Occupancy sensors bull Increased filtration of particulates and increased air changeshour in the manufacturing plant bull Nontoxic adhesives and a separately ventilated painting area in the manufacturing plant bull Restored prairie landscape and wetland on the site bull Extensive recycling of waste from the cafeteria office and manufacturing plant bull Siting to reduce the visual impact of the building from the road bull In-house fitness center
Methodology A research team from PNNL conducted a pre- and post-occupancy study that included occupant surveys and analysis of organizational TQM data The data included overall productivity on-time delivery product quality and efficient use of materials DOEs Office of Building Technology State and Community Programs funded the study
Key Findings After moving into the new facility the occupants experienced the following
bull Increased sense of well-being belonging and work spirit bull Increased job satisfaction bull Increased feeling of looking forward to work and being in good spirits at work bull Higher satisfaction overall with the building especially the daylight windows electric lighting air
quality and connection to nature
The responses of the manufacturing workers varied across the shifts with the daytime workers responding most positively The night workers showed little difference between the buildings possibly because the environment changed the least for them (daylight views and connection to the outdoors are greatly diminished at night)
3-6
Analysis of the pre- and post-occupancy results related to Herman Millerrsquos TQM led to the following conclusions
bull A small increase of 022 occurred in overall productivity and small increases of 1 to 2 occurred in other TQM metrics These increases were small but are still significant because the organizashytion was already performing at 98 to 99 on all of the TQM metrics
bull No dip in productivity occurred following the move to the new facility Most moves or major changes are followed by a period of slowdown but this did not occur
bull No differences occurred in any of the TQM metrics across the manufacturing shifts despite the differences in perceptions and subjective outcomes This result suggests that the link between performance and subjective experiences is more complicated than is currently believed
Source Heerwagen (2000)
Examples of the synergy between building security and sustainability features can be seen from the Pentagon renovation project45 A spray-on wall coating selected to improve blast-resistance also helps improve the air tightness of the building envelope The tighter envelope not only saves heating and cooling energy but also provides added protection against outside releases of airborne chemical or biological agents The US Department of Defense reports that new blast-resistant windows chosen to replace the original ones at the Pentagon are also 50 more energy efficient Another feature is the choice of photo-luminescent signage to mark evacuation routes these require no standby power and are also easier to see through smoke caused by a fire or explosion than conventional exit signs A final example from the Pentagon project is the use of zoned climate control systems that not only reduce heating and cooling energy use and improve indoor air quality but also make it easier to control smoke and manage the spread of chemical or biological toxins in response to an emergency
The US Department of State is actively researching innovative structural and glazing systems that provide both daylightview and ndash because they are designed to yield to an external blast ndash better protection for building occupants Planners responsible for overseas Embassy compounds also maintain that the greater setbacks required for new buildings also provide important opportunities for sustainable landscaping solar access and other highly desirable features as a valuable by-product of security requirements
The National Aeronautics and Space Administration incorporated both building security guidelines and sustainable design in their criteria for new facilities They have found that certain standard design criteria such as structural requirements for wind and seismic loads can also help improve blast-resistance
Ideally projects targeted at improving building security should also consider opportunities to piggyback energy-efficiency and renewable energy measures because the energy cost savings could make security improvements more affordable A few other examples of positive interactions between security and efficiency measures in buildings include the following (Harris et al 2002)
45 Personal communication with T Pohlman US Department of Defense Washington DC
3-7
bull Improving control of air distribution systems ndash including periodic calibration of sensors adjustment of dampers and other system maintenance ndash is essential for rapid response to an emergency and also contributes to energy-efficient operation under normal conditions
bull Tighter building envelopes have the dual benefits of reducing energy losses from air infiltration and making it easier to pressurize a building and therefore reducing entry of airborne hazards released outside the building
bull Daylit spaces may be easier to evacuate quickly in the event of an attack or threat accompanied by a power outage
bull Onsite power systems can be very attractive considering their improved reliability during utility system outages (either natural or human-caused) in addition to any cost savings that might be associated with reduced electricity or peak power demand
bull Upgrading existing windows for blast resistance may create opportunities to improve thermal and optical (daylighting) performance if the window system or add-on film is selected carefully For example in planning for a recent retrofit project DOE evaluated several blast-resistant films with varying thermal and optical properties and then pilot-tested the samples on windows in several offices
bull Redesigning security lighting along with automated sensing and surveillance systems may actually reduce the need for constant high nighttime lighting levels while improving detection capabilities
bull Improving particle air filtration has several potential benefits In addition to protecting buildings from biological agent attack the benefits include reducing indoor particle concentrations from other sources thereby improving occupant health (and productivity) and helping reduce HVAC coil fouling which in turn improves heat exchange efficiency Some high-performance filters have significantly lower pressure drop than others that do the same job so a careful choice of filter systems and products can produce cleaner and safer air with less energy penalty
bull Site planning that provides a wide buffer zone to keep vehicles away from the exterior of a public building can also provide opportunities for better solar access and for climate-appropriate landscaping Trees can directly shade the building and both channel prevailing summer breezes toward the building and temper the effect of cold winter winds on space heating loads In addition trees and other vegetation cool the building site due to evaporation that occurs during the plantsrsquo normal biological processes (evaporation causes cooling)
More examples can be found in Research Summary 3-3 at the end of Section 3
Community and Societal Benefits
The effects of sustainable building practices on occupants are the primary social benefits that have been researched however various secondary and indirect quality-of-life benefits for which anecdotal evidence exists can accrue to other societal groups
From a public health perspective quality of life can be measured in terms of individual life expectancy and state of wellness More generally quality of life at a community level can include such issues as environmental quality aesthetics educational and recreational opportunities accessibility and quality of public services and even psychological characteristics such as community satisfaction and pride
3-8
Sustainable building practices can contribute to quality of life in a number of ways
bull Occupants who experience increased job satisfaction health and productivity will carry these experiences back to their families and friends in the community thus influencing overall wellshybeing
bull Occupants may also enjoy more pleasant and productive commutes to work and less traffic congestion in their communities if public or alternative transportation methods are made available at their workplace
bull Benefits can potentially diffuse beyond the workplace and lead to increased use of sustainable design practices and behavioral change in the community at large Behavioral changes might include increased recycling purchasing green products and investing in energy-efficient technologies
bull Buildings that include sustainable features also become models for others to follow For example the Herman Miller Green House regularly provides tours and outreach programs for local and national design and construction professionals as well as for businesses that are planning their own sustainable buildings
bull Environmentally conscious construction practices will tend to generate lower amounts of dust pollution noise traffic congestion and other community disturbances These improvements will likely contribute to improved public health safety and well-being (The environmental benefits of sustainable buildings are discussed in greater detail in Section 4)
bull Construction practices and building operation practices that foster recycling and reduce waste generation energy use and water consumption will eventually reduce the demand for new landfills electric utility plants transmission and gas pipelines and wastewater treatment facilities (see Section 27) and will decrease the public nuisance associated with them
bull Use of locally produced and manufactured products in sustainable buildings bolsters the local economy and provides jobs in the community (as well as reducing energy use and emissions caused by long-range transportation of goods)
bull If sustainable design involves cleanup and use of a brownfield site the community may benefit from the improved environmental conditions associated with the cleanup It may also experience economic development associated with productive use of a previously unused site and the presence of a new set of workers who make financial transactions in the community (The socioeconomic effects of sustainable buildings on community development improved health due to lower pollution loads and reduced infrastructure needs were discussed in Section 27)
3-9
The following table is the result of a recent effort by Lawrence Berkeley National Laboratory to assess the security implications of energy-efficiency measures (Harris et al 2002)
Efficiency Opportunities Security
Issue
Project Planning and Management
Integrated design process
Design objectives Clearly define goals and minimum requirements for sustainabilityefficiency and security as part of an organizations architectural programming
Con Air Ex RR
Architectural and engineering solicitation and contracting
Specify required expertise in sustainability and security when issuing the solicitation and use explicit criteria for selecting an architectural and engineering firm include integrated design tasks in the contract
Design charrette Allocate time and resources for integrated design charrette(s) at an early stage of design including a broad range of participants
Architectural Considerations
Building envelope
Airtight barrier Appropriately seal buildings to both resist chemical biological penetration and provide weather-tightness
Air
Insulation Insulate walls to provide a secondary barrier and thermal savings
Air Ex
Impact-absorbing walls
Use innovative walls systems (multiple layers openings crumple zones) designed to absorb blast effects that can also reduce envelope heat transfer and control solar gain
Ex
Thermal mass Design earth berms for blast deflection which can also provide thermal buffering
Ex
Specify high-mass (concrete) construction which allows active or passive use of thermal mass to reduce heatingcooling loads
Ex
Shading devices Design shading devices that can double as blast protection
Ex
Vestibules Use vestibules to help control building access while reducing infiltration of unconditioned outside air
Con Air
Windows Laminate films Apply blast-damage-resistant laminate films to interior surface of windows with appropriate emissivity and visible light transmittance
Air
Operable windows Analyze appropriate response to threat (httpsecurebuildingslblgov)
Air RR
Protective screens Use external protective screens that may also control unwanted solar gain
Ex
Storm windows Consider retrofitting storm windows with efficient (low-e solar control) films
Air Ex
3-10
Security Efficiency Opportunities Issue
HVAC Considerations
Air systems System design Consider separating ventilation air systems from Air RR thermal distribution Radiant coolingheating with hydronic distribution offers added efficiency smaller ventilation-only fresh-air supply and dedicated exhaust systems are easier to control in an emergency
Provide larger ducts and efficient fans for rapid venting Air RR and energy savings in normal operation
Use efficient ventilation systems (displacement Air RR ventilation large ducts etc) to reduce space and energy requirements for upgraded filters
Variable-speed Provide capability for normal operation and rapid Air RR drives venting (variable-speed drives also allow for dynamic
braking to stop fans faster in an emergency)
Dedicated Provide separate additional exhaust for emergency Air RR exhaust venting or for economizer operation especially in
high-risk areas such as entry vestibules loading docks and mail rooms
Whole-building Consider dual use of building purging systems (for Air RR ventilation smoke and also chemical contaminants) to provide
nighttime ldquofree coolingrdquo during normal building operation
Duct leakage Specify install and commission (test) ductwork for low Air RR leakage
Dampers Provide dampers with rapid closure and low leakage Air RR
Filtration Use low-pressure drop filters at the filtration level Air RR needed
Tightly seal around in-line filters Air RR
Security barriers Review impact of security barriers such as additional Con Air doors on normal air distribution
Water Physical layout Provide secure enclosures and minimize run lengths of Air Ex systems piping
Increase pipe size Ex
Control System Considerations
Window Operable window Provide automatic and operator control for Air RR controls controls chemicalbiological isolation and thermal comfort
Shading control Provide automatic and operator control for blast Ex RR protection and shading
Integrated Interoperable Use interoperable systems to integrate security controls Con Air Ex controls systems with other building controls (HVAC lighting access RR
surveillance firesmoke)
Plan for future additions as new sensing capability is Con Air Ex developed RR
3-11
Security Efficiency Opportunities Issue
Control System Considerations (contd)
HVAC Individual control Provide for pressurized safety zones when needed Air RR controls of fans dampers
Alternate filtration Provide parallel path through filter banks during Air RR path chemicalbiological attack
Wireless Remote Provide secure and redundant controls using wireless Con Air Ex systems monitoring and and web-based systems RR
control
Monitoring System status Provide whole-building system monitoring to improve Con Air Ex monitoring maintenance normal operation and critical RR
monitoring during events
Elevator Integrate elevator Integrate elevator controls for emergency response to Con Air Ex controls controls with fire or chemicalbiological events and for efficient RR
building control operation Make elevators controllable to allow systems implementation of peak-load strategies
Lighting Considerations
Interior Security lighting Provide efficient lighting and lighting controls such as Con exterior motion sensors lighting Integrate lighting into overall building controls Con RR
Interior Daylight access Minimize interior spaces without daylight access to RR improve visibility in daytime emergency evacuations
Distributed Generation
Backup Combined heat To reduce power and fuel costs during non-emergency RR generation and power periods upgrade emergency backup generation from
renewable fuels diesel to renewable onsite power (photovoltaics wind biofuels) or a gas turbine combined with heat recovery for space heat or hot water
Site Planning
Building site Site design and Add protective open space around structures to allow Con Ex landscaping to buildings to be oriented for passive solar features reduce heating and cooling loads
Use larger setbacks to allow trees and plantings to directly shade buildings and buffer or channel prevailing winds to provide evapotranspiration cooling and to reduce urban heat-island effects
Physical barriers Add berms and water features to provide blast protection and access control as well as stormwatererosion management
Campus Sustainable site Plan for larger multi-use sites to enhance security Con Ex layout planning and create opportunities for efficient water userecovery
management recharge and ground-source heat pumps and allow better load matching for onsite combined heat and power etc
3-12
Efficiency Opportunities Security Issue
Other
Cyber ndash security
Computer standby power
Physically shut off power to computers at night and during unoccupied periods to save energy while reducing risk of unauthorized access to data and systems
Con
Con = control of access air = airborne (chembio) threat Ex = explosive threat RR = response and recovery For more details examples and useful links see wwwwbdgorgdesign
3-13
The Environmental Benefits of Sustainable Design
Buildings consume a significant amount of our natural resources and have a wide range of environmental impacts These environmental concerns are a key driver behind the sustainable design movement Various estimates indicate that buildings use 30 of the raw materials consumed in the United States (EPA 2001) Considering what buildings are made of ndash steel concrete glass and other energy-intensive materials ndash buildings have a high level of embodied energy Based on lifecycle assessments the structural and envelope material of a typical North American office building has 2 to 4 gigajoules per square meter (175 to 350 kBtuft2) of embodied energy (Building Typically embodied energy [in a
building] is equivalent to five to ten Green Inc 2003) Producing these materials depletes years of operational energynonrenewable resources and has environmental effects and
these impacts intensify the more frequently buildings are William Bordass quoted in
demolished and replaced Building Green Inc (2003)
Building operations also contribute significantly to environmental pollutant levels in the United States and abroad As a whole US buildings use 36 of US energy demand 68 of the countryrsquos electricity (more than half of which is generated from coal) and nearly 40 of US natural gas consumption (DOE 2002) As a result US buildings are accountable for 48 of the nationrsquos SO2 emissions 20 of the NOx and 36 of the CO2 (DOE 2002) Buildings also produce 25 of the solid waste use 24 of the water create 20 of the water effluents and occupy 15 of the land (EPA 2001) In addition US builders produce between 30 and 35 million tons of construction renovation and demolition waste (DOE 2002)
Federal facilities contribute a notable portion of these building impacts for example Federal buildings are estimated to emit 105 million metric tons of CO2 (in carbon equivalents) (DOE 2001) which is about 2 of the total emissions from US buildings and is equivalent to the total emissions of Peru46
From a complete lifecycle assessment perspective construction operation and demolition or reuse of buildings involve a chain of economic activities that provide the goods and services necessary to build maintain and eventually retire or convert the asset Each of these activities carries an implicit ecological footprint of resource consumption and waste generation For example the footprint associated with a ton of steel includes impacts of mining transportation and manufacshy turing operations including a considerable amount of energy consumed in converting iron ore to steel and transporting the steel to its point of use Table 4-1 lists the sources of pollution and other negative environmental impacts related to constructing operating and demolishing buildings
Applying sustainable design principles can significantly reduce these impacts The following sections describe three categories of environmental benefits attributable to sustainable buildings lower air pollutant and greenhouse gas emissions to the atmosphere (Section 41) reduced volumes of waste (Section 42) and decreased use of natural resources and lower impacts on ecosystems (Section 43) Each section is illustrated with a case study
httpcdiacesdornlgovtrendsemisperhtm
4-1
46
Table 4-1 Examples of Environmental Impacts of Buildings
Construction Operation Demolition
Materials Use bull Depletion of nonrenewshy
able resources bull Pollution and byproducts
from materials manufacture
bull Construction materials packaging waste
Site Preparation and Use bull Disturbance of animal
habitats bull Destruction of natural
vistas bull Construction-related
runoff bull Soil erosion bull Destruction of trees that
absorb CO2
bull Introduction of invasive exotic plants
bull Urban sprawl (for greenfield sites) and associated vehicle-related environmental impacts (eg tailpipe emissions as well as impacts of highway road and parking lot construction)
bull Water quality degradashytion from using pestishycides fertilizers and other chemicals
Energy Use bull Air pollution emissions of SO2 NOx
mercury and other heavy metals and particulate matter from power plants the buildings energy consumption and transportation to the building
bull Greenhouse gas (CO2 and methane) emissions which contribute to global warming
bull Water pollution from coal mining and other fossil fuel extraction activities and thermal pollution from power plants
bull Nuclear waste fly ash and flue gas desulfurization sludge from power plants that produce the electricity used in buildings
bull Habitat destruction from fuel extraction
Building Operations bull Runoff and other discharges to water
bodies and groundwater bull Groundwater depletion bull Changes in microclimate around
buildings and urban heat island effects
bull Ozone-depleting substances from air conditioning and refrigeration
bull Light pollution in the night sky bull Water consumption bull Production of wastewater that
requires treatment bull Production of solid waste (garbage)
for disposal bull Degradation of indoor air quality
and water quality from using cleaning chemicals
bull
bull
bull bull
bull
Demolition waste (used steel concrete wood glass metals etc) Energy consumption for demolition Dust emissions Disturbance of neighboring properties Fuel use and air pollutant emissions associated with transporting demolition waste
Lower Air Pollutant and Greenhouse Gas Emissions
One set of environmental benefits from greening buildings that can be fairly easily estimated is lower air pollutant and CO2 emissions Emissions are reduced by decreasing energy use through energy-efficient design use of renewable energy and building commissioning Table 4-2 shows the average amounts of emissions that are released per Btu of natural gas and electricity used (these are called emission coefficients) The coefficients also indicate the amount of pollution that would be reduced per unit of energy saved
4-2
Table 4-2 Emission Coefficients for Energy Consumption in Commercial Buildings
SO2 Million Short Tons Per Quad
NOx Million Short Tons Per Quad
CO2 Million Short Tons Per Quad
Natural gas Negligible 008 158
Electricity (per delivered quad) 097 045 5562
Source DOE (2002) (1 short ton equals about 091 metric ton)
In the hypothetical prototype building annual emissions would be reduced by 016 short tons of SO2 008 tons of NOx and 107 short tons of CO2
47 (based on site electricity reduction of 167 million Btu and a natural gas savings of 86 million Btu) This
reduction is small compared with national emission levels48 or even emission levels in a city such as Baltimore However given that buildings contribute 48 of SO2 20 of NOx and 36 of CO2
nationwide (DOE 2002) a widespread adoption of sustainable design techniques in new and retrofit buildings would eventually affect national and regional pollution levels
Reducing SO2 and NOx is particularly important in areas (such as Baltimore) that are not achieving air quality standards Large urban areas with intense traffic and areas affected by emissions from large industrial sources and power plants can have ambient air pollution levels that exceed the amounts determined by the EPA to protect human health and welfare (National Primary and Secondary Ambient Air Quality Standards 40 CFR 50) Although buildings are not typically a target of specific emission regulations some states such as New York encourage emission reductions from nonregulated sources through a program of emission reduction credits Through this program a regulated source can pay a nonregulated source for emission credits earned by reducing emissions through energy-efficiency measures fuel switching or other means 49 When aggregated the lower emissions from small sources of NOx (such as gas-fired heating systems in buildings) in cities can help reduce ozone-related pollution (smog) In addition cutting electricity consumption helps decrease emissions of NOx and SO2 from power plants (usually located in rural areas) thereby helping to reduce regional environmental problems such as acid rain
Reducing fuel and electricity consumption also lowers CO2 emissions a greenhouse gas that is linked to climate change Decreased use of natural gas should also reduce methane emissions to the atmosphere (methane is another greenhouse gas) The effects of the buildup of greenhouse gases in the atmosphere may include sea level rise weather changes (eg increase in violent weather patterns) and impacts on agriculture Although climate change is likely to occur gradually over a long time period energy-efficiency measures implemented now will slow the pace of the greenhouse gas buildup and its potential effects
Case Study 4-1 describes how a photovoltaic energy system has lowered air pollution emissions in an area with serious air quality problems ndash the Los Angeles Basin
47 Expressed in tons of carbon in CO2 48 National emissions of SO2 NOx and CO2 from buildings were about 9 million tons 5 million tons and 564 million tons (carbon equivalents) respectively49 See httpwwwdecstatenyuswebsitedarbossercindexhtml
4-3
This case study demonstrates how innovative energy systems can reduce emissions The area in which this facility is located ndash the Los Angeles Basin ndash is plagued with high ozone levels (smog) The project demonstrates one of the innovative technologies that produce electricity without any emissions Incentive programs available in some locations from various sources can reduce the first costs of advanced technologies resulting in very reasonable economics
Project Description The US Postal Service (USPS) recently installed a large-scale photovoltaic (PV) sysshy tem at its Marina Del Rey Processing and Distribution Center in Los Angeles The center has over 400000 ft2
of floor area and high energy consumption and costs
Approach to Sustainable Design This facility is proactively seeking solutions to energy management especially given Californias volatile energy situation over the past two years The USPS worked with Lawshy rence Berkeley Laboratory (in a technical advisory role) the Los Angeles Department of Water and Power (DWP) and DOErsquos FEMP to examine costs energy savings and key financial incentives from using PV systems at this site The team determined that a rooftop solar power array would generate significant electricity to help offset peak demand utility costs
The system was attractive not only because it saves energy but because it is also expected over its lifetime to reduce emissions 2600 lb of NOx emissions and 4075 tons of CO2 equivalent to removing emissions from over 1000 cars or planting over 200000 trees The USPS is also considering PV for other postal facilities
Sustainable Features The PV technology installed at the facility consists of a 127-kW system from 845 modules that are lightweight and integrated in the buildings roof over an existing roof membrane The solar array is 50 ft by 300 ft and covers most of the facilitys flat roof The system produces clean power silently and is not visible to people on the ground
The PV system uses silicon technology to convert sunlight directly into electricity The output from the PV modules is direct current which is converted to the required alternating current using an inverter and transformer The system allows the current to be directly connected to the buildingrsquos electric service panel In addition to producing electricity the PV panels provide R-20 value thermal insulation to decrease the buildingrsquos energy consumption and reduce heating and air conditioning costs The panels also extend the roofrsquos life by protecting the roof membrane from ultraviolet rays and thermal conditions
The system is linked to a new energy management system that monitors power output from the solar cells When the system detects a decline in power output for example during cloud cover it automatically modifies the operation of the buildingrsquos chiller to compensate without affecting employee comfort
Financial Considerations The systems original first cost was about $1 million The Los Angeles DWP provided a $684000 rebate and FEMP provided a Distributed Energy Resources Grant of $125000 The net system cost to the USPS was about $226000 The estimated annual cost savings are $25000 to $28000 resulting in a simple payback period of about 8 years
Sources Personal communication with J Lin PowerLight Corporation Berkeley CA FEMP (2002)
4-4
Reduced Volumes of Solid Waste
The United States produces more than 230 million tons of municipal solid waste per year consisting of paper yard waste plastics metals etc 50 The 30 to 35 million tons of construction renovation and demolition waste that US builders produce include wood (27 of total) and other materials such as cardboard and paper drywallplaster insulation siding roofing metal concrete asphalt masonry bricks and dirt rubble waterproofing materials and landscaping materials (DOE 2002) As much as 95 of building-related construction waste is recyclable and most materials are clean and unmixed (DOE 2002)51
In addition building occupants produce municipal solid waste every day in the form of used paper plastic and glass containers food waste etc Much of this can be recycled
Several sustainable design principles reduce waste which in turn reduces the strain on landfills In addition using recycled materials in building construction encourages development of new industries that produce recycled products further reducing waste disposal needs and the use of virgin materials
The main sustainable design principles that reduce waste include the following
bull Storage and collection of recyclables The building design should provide space for collecting and storing materials such as paper glass plastic and metals that will be recycled
bull Construction waste management During construction the contractor can recycle or productively use construction demolition and land-clearing wastes and divert these wastes from landfill disposal
bull Recycled content Designers can select environmentally preferable materials that include recycled materials (Designers should use standards developed by government agencies or other reliable sources)
bull Waste prevention Designers can eliminate unnecessary finishes and make choices that use standard-sized or modular materials In addition designers should consider product durability in the design process When products need to be replaced less frequently less demolition waste is produced and fewer virgin resources are needed for replacements
Case Study 4-2 describes how both the volume of waste and construction costs were reduced through an effective construction waste management program
50 httpwwwepagovepaoswernon-hwmuncplfactshtm 51 Original sources cited in DOE (2002) include First International Sustainable Construction Conference Proceedings Construction Waste Management and Recycling Strategies in the US Nov 1994 p 689 Fine Homebuilding Construction Waste FebMar 1995 pp 70-75 National Association of Home Builders Housing Economics Mar 1995 pp 12-13 and Cost Engineering Cost-Effective Waste Minimization for Construction Managers Jan 1995 Vol 37No 1 pp 31-39
4-5
This case study demonstrates that using construction waste management other recycling efforts during construction and central recycling during building operation not only reduces the strain on local landfills but lowers construction costs
Project Description The New England Regional Laboratory (NERL) located in North Chelmsford Massachusetts is one of ten EPA regional laboratories that conducts environmental monitoring analytical support and data assessment The 71000-ft2 building incorporates an environmental testing laboratory as well as office and meeting spaces This facility won a Closing the Circle Award and a US Green Building Council LEED Gold Rating
Approach to Sustainable Design The new laboratory which opened in September 2001 was designed and built using sustainshyable principles The lab was supported by government agency sustainability advocates GSA and EPA as well as a sustainabilityshyconscious developer and contractor The goal was to use the best commercially available materials and technologies to minimize consumption of energy and resources and maximize use of natural recycled and nontoxic materials
The design construction team diverted more than 50 of its construction and demolition debris from the waste stream by recycling processing excavated rock outcroppings into crushed stone that was also used on site and reusing furniture and laboratory equipment from the former facility to furnish the new building while redistributing unused supplies to other buildings and organizations The facility used fly-ash content concrete and many other recycled-content materials (insulation carpet floor tiles mulch compost made from yard trimmings or food waste and recycled plastic benches and picnic tables)
Sustainable Features The team maximized the use of natural site features such as solar energy natural shading and drainage The teams principal goals were achieving energy efficiency and maximizing renewable energy sources so they incorporated a wide range of technologies and strategies including lighting controls skylights light tubes extra insulation high-efficiency chillers and motors green power and PV awnings that supply 2 kW of electricity to the electric grid Water-efficiency measures included Xeriscape concepts for landscaping an onsite well for laboratory uses and low-flow sinks with electronic sensors
Commercial power is provided by Green Mountain Power of Vermont via 100 renewable energy sources Green Mountain Power has committed to generating or purchasing wind-powered electricity that matches the electrical consumption of NERL an estimated 2 million kWh per year Using green power will reduce pollution by an estimated 346 million lbyr of CO2 17600 lbyr of SO2 and 6200 lbyr NOx over conventional power sources
Financial Considerations The project team documented the cost savings from the construction waste management program A concerted effort was made to minimize construction debris and to maximize recycling and reuse of anything that would become a waste stream The team hired Graham Waste Services a licensed hauler and processor of recyclables and solid waste
4-6
Any waste that was generated during construcshytion was carefully segregated into separate clearly labeled bins that Graham Waste Services supplied Bins were checked regularly for extrashyneous materials that could contaminate any of the loads The estimated amounts of materials recycled during construction the percent of the total waste stream recycled (by volume) and the associated cost savings (resulting from avoided disposal costs) were as follows bull Clean wood 330 cubic yards 21 of the
recycled waste stream volume for a $2200 savings
bull Cardboard 10 cubic yards 6 of the recycled waste stream volume for a $250 savings bull Gypsum wallboard 210 cubic yards 13 of the recycled waste stream volume for a $1400 savings bull Metal 90 cubic yards 6 of the recycled waste stream volume for a $600 savings bull Concrete 80 cubic yards 5 of the recycled waste stream volume for a $5760 savings bull Total savings $10210
Note general refuse were recycled but this did not lead to any cost savings In addition 780 cubic yards of
Sources Personal communication with B Beane EPA Region 1 in North Chelmsford Massachusetts and the documentation supporting the White House Closing the Circle Awards 2002 Nominations for Recycling Affirmative Procurement and Model Facility Awards
Decreased Use of Natural Resources and Lower Ecosystem Impacts
Many sustainable design principles help reduce impacts on natural resources and ecosystems Some key examples are as follows
bull Sustainable siting approaches consider alternatives to greenfield construction including using existing facilities (eg urban redevelopment) and brownfield sites and avoid building on prime agricultural land floodplains and habitats for threatened species or near wetlands parklands and cultural or scenic areas The principles also include designing to reduce potentially detrimental conditions such as slopes that can erode avoiding adverse impacts on adjacent properties and carefully considering the building placement amid existing trees on the site Sustainable siting may also consider reducing the buildings (or the sites) footprint to preserve the amount of open space These measures ࠃ Protect threatened species wetlands cultural areas and pristine natural areas ࠃ Remediate contaminated land (when a brownfield is used) ࠃ Preserve soil resources trees and open space in already developed areas
bull Siting near public transportation involves locating the facility near rail stations or bus lines and providing covered wind-sheltered seating or waiting areas for public transport Use of public and alternative transportation also can be fostered by installing bicycle storage and showers alternative-fuel refueling stations and preferred parking for carpools In addition to reducing
4-7
air pollution from personal vehicles these measures ࠃ Reduce land disturbance for new roads ࠃ Use less material for new roads
bull Erosion and sedimentation control stormwater management and sustainable landscaping involve developing a sediment and erosion control plan to prevent soil loss during construction using natural water management approaches instead of traditional sewers and designing a self-sustaining landscape This approach can involve planting watershed buffers using drought-resistant plants native to the region avoiding plants needing chemical treatment and fertilizers or causing allergic reactions designing natural drainage systems and using techniques that allow water infiltration through surfaces (eg using porous paving surfaces for parking lots) which allows stormwater to filter through plantings and soil These measures ࠃ Prevent sedimentation of streams ࠃ Reduce dust and particulate matter emissions during construction ࠃ Reduce disruption of natural water flows ࠃ Reduce runoff into natural water systems ࠃ Restore natural plant species to the region
bull Light pollution reduction is achieved by reducing dependence on high-wattage electrical lighting at night by using solar lighting and light-colored or reflective edges along driveways and walks and by designing night lighting to prevent direct-beam illumination from leaving the building site These measures preserve nighttime habitats for nocturnal species
bull Water reduction measures include using low-flow faucets and showerheads and improved fixtures and fittings that reduce water use (eg pressure-assisted or composting toilets and no-water urinals) low-water landscaping improved cooling towers that use closed-loop cooling approaches captured rain water for landscaping toilet flushing and other appropriate uses and treatment and use of graywater excess groundwater and steam condensate The water-efficiency and sustainable siting approaches for the prototype building described in Section 21 and 22 which included use of low-flow faucets no-water urinals dual-flush toilets and sustainable landscaping would save over 233000 gallons of water annually (equal to 70 of the base case buildingrsquos consumption including water used both inside the building and outside for landscape maintenance) Water reduction measures in buildings ࠃ Decrease extraction of potable water from groundwater reserves (eg aquifers) water
bodies and reservoirs ࠃ Reduce strain on aquatic ecosystems in water-scarce areas ࠃ Preserve water resources for wildlife and agriculture ࠃ Decrease impacts from wastewater treatment plants (eg effluent discharges)
bull Energy efficiency measures not only reduce air pollution emissions associated with energy use (discussed in Section 41) but also decrease the need for nuclear and fossil fuels These measures ࠃ Reduce the need for on-land disposal of nuclear waste fly ash and flue gas desulfurization
sludge from power plants ࠃ Reduce habitat destruction and other environmental impacts from fuel extraction
processing and transportation (eg coal mines typically disturb large tracts of land)
bull Rapidly renewable materials (eg bamboo cork and wheat straw boards) and certified wood ࠃ Reduce the use and depletion of long-cycle renewable materials ࠃ Improve forest management and biodiversity
4-8
bull Design for reuse means designing a flexible building that can have many uses and that can be reconfigured in the future as needs change As time progresses this practice should reduce the need to demolish old buildings and construct new ones These measures lower resource consumption (eg building materials such as steel concrete and glass which are energy-intensive commodities)
Case Study 4-3 describes the efforts undertaken to develop a new multibuilding campus in a way that minimized disruption of the natural environment
4-9
This case study shows how a state-of-the-art lab and office complex can be a model for environmental stewardship without increasing costs By forming a multidisciplinary design team and integrating environshymental principles into the value engineering process EPA created a 100-year building with estimated 40 energy savings 80 construction waste recovery 100 stormwater treatment through native plants and wetlands on site daylight in offices clean indoor air flexible labs and more ndash all with no extra budget for building green The case also shows that conserving energy and water using a low-impact site design minimizing materials and making other substantive choices have clear economic benefits and that sustainable design features with little financial payback can be afforded by making tradeoffs in other areas
Project Description The laboratoryoffice complex is located on over 130 acres of land in Research Trianshygle Park in central North Carolina The new facilities have one million gross square feet of floorspace including 635000 net square feet of office and laborashy tory space for 2200 employees The complex has four 5-story lab buildings connected by three 30-foot atria to three 3-story office buildings The main building also includes a central five-story office tower with cafeteria conference center auditoriums and a library The lab and office buildings are situated alongside a lake and follow the curve of the shore The campus also includes a computer center and child-care facility
Approach to Sustainable Design Because it had not undertaken a project of this magnitude before the EPA looked to the GSA and the Army Corps of Engishy neers for design assistance and construction management Working with these agencies and the chosen architecture firm (Hellmuth Obata + Kassabaum) the Clark Construction Group and the Gillbane Building Company (a GSA contractor providing construction administration and quality assurance) EPA developed a team approach to defining environmental objectives and tracking progress toward them Project leaders made a clear commitment to design and build a green building They felt the EPA facility should symbolize the EPArsquos environmental mission Green design criteria were written into the solicitations for the architectural and engineering services the Program of Requirements and the contracts Working together green advocates architects engineers and building users developed innovative approaches after systematically reviewing a wide range of options At every step along the way the team raised questions about and re-evaluated assumptions
Sustainable Features The sustainability of the buildings and sites designs was studied in depth The designers used natural methods for landscaping and stormwater treatment To protect more than 9 acres of onsite wetland areas designers used a buffer zone about 100-feet wide along the lake edge and allowed no development except for a network of walking and jogging trails A tree survey resulted in redesigned roads saving large oak trees that have been there since the early part of the 20th century Also the size of the road was decreased from four to two lanes to minimize disruption to the natural areas and reduce costs A parking structure was built instead of disrupting acres of natural woodland for an onsite paved parking lot
The building design includes sunshading tight building envelopes high-performance glass a high level of daylighting occupancy sensors and daylight dimming high-efficiency chillers and boilers variable frequency drives an outside air economizer cycle and high-efficiency fume hoods The buildings also used low-flush toilets and urinals low-flow aerators and showerheads and water-efficient cooling towers Many recycled materials were used recycled-content asphalt rubber flooring ceramic tiles insulation wood fiberboard
4-10
gypsum wallboard and more Materials were also selected to be durable (the building was designed to last 100 years) About 80 of all construction waste was recycled which diverted about 10000 tons of material from local landfills Careful attention was paid to ventilation selection of materials and finishes and construction procedures to minimize air quality degradation inside the building
Financial Considerations Throughout the project the team examshyined the cost of green design and the cost of various options For exshyample multiple skylight options for the atrium in the buildings were considered and the options first costs and energy costs over a 20-year life were compared EPA also chose to engage in focused value engishyneering reviews Although value engineering is often seen as the enemy of good design in general and green design in particular EPA transformed the traditional value engineering process into an exercise in balancing cost function and environmental performance by including designers and sustainability advocates on the value engineershying review team and encouraging interdisciplinary brainstorming
The value engineering process was especially important at this site because during the appropriations process the US Senate asked EPA to review the project again to see if the total cost could be reduced Working with the designers the value engineering team not only reduced the total project cost by about $30 million (resulting in a final cost of $225 million) but also produced a greener building Given the pressure to reduce costs many of the environmental features that
required a first-cost increment (eg the above-ground parking garage designed to minimize disruption to 15 acres of natural woodlands) could have easily been eliminated However the team reviewed the project budget as a whole and chose to eliminate other features that were not considered critical to meet their environmental goals For instance over 200 doors were eliminated to save costs To lower the cost increment of the above-ground parking garage the amount of onsite parking was reduced by 25 and alternative transportation methods were encouraged In effect the design team put a higher value on the 15 acres of natural woodland than on building design features they considered less important to quality of life
Some of the environmentally motivated strategies that reduced cost included the following bull Replacing four-lane roads with two-lane roads (and burying the electrical and communication lines
under the road) greatly decreased the road and utility footprint preserved the site woodlands and wetlands reduced construction cost by $2 million and lowered maintenance and repair costs
bull Replacing curb and gutter and oil-grit separators with grassy swales and water quality and bio-retention ponds reduced construction costs by $500000
bull Changing the atrium skylight from all glass to one-third glass one-third insulated translucent panels and one-third solid panels to improve energy performance indoor environmental comfort and light quality saved $500000 in construction costs and $500000 in annual energy costs
bull Installing 250 specialized fume hoods and exhaust systems that reduce total air flow demand by 50 and eliminating dozens of fans lowered construction cost by $15 million and annual energy costs by $1 million
When benchmarked against other laboratoryoffice buildings the annual energy use in the facility was estimated to be 40 lower than a similar facility with a savings of more than $1 million per year
Sources Communication with C Long and P Schubert EPAs Research Triangle Park EPA (1997 2001) and DOEs High Performance Buildings Database at httpwwweereenergygovbuildingshighperformancecase_studiesoverviewcfmProjectID=30
4-11
Strengthening the Business Case Research and Data Needs
The research results and case studies that were presented in the preceding sections show that a strong business case for sustainable design and construction can be made today Case studies described in Section 2 indicate that a well-designed building which integrates sustainable design features in the early stages of design can be built at about the same cost as a more typical building without those features because creative building design teams can incorporate sustainable features by reducing costs in other parts of the project Even when first costs increase slightly lifecycle cost reductions and short payback periods can make sustainable design very cost effective A number of studies also show that sustainable buildings have positive impacts on occupants Because the annual salary and benefit costs of building occupants far outweigh the annualized capital costs or the yearly costs of energy and OampM occupant productivity gains can have a considerable impact on business costs
Other stakeholders such as neighbors and local and state governments may also realize benefits such as increased protection of local natural resources lower pollution loadings better regional employment opportunities and lower infrastructure needs (eg water and waste treatment facilities) These in turn can result in economic benefits to the building owneroperator in the form of easier siting of the next facility less time to deal with complaints from the neighbors and other indirect benefits For government agencies the public good value associated with these benefits should in theory be more important than it is in the private sector Unfortunately some of these benefits are supported mainly by a few research studies or anecdotal evidence
Table 5-1 summarizes the status of the business case information in the various cells of the matrix presented in Section 1 (also presented in more detail in Appendix A)
The arguments supporting sustainable design will gain strength as more data and information are collected on the effects of sustainable design and construction on first costs annual energy and other operating costs occupant health productivity and well-being environmental impacts and other social and business impacts Some of the areas for which data gathering may prove useful to the business case are as follows
bull First costs Because projects evolve over time there is usually no clearly defined before and after picture that would allow the costs of various features that were added or taken out of the design to be estimated Case studies aimed at tracking cost estimates as the project evolves would be useful First-cost information could be more widely disseminated by adding more case studies and detail to the cost information in databases such as DOEs High Performance Buildings Database In addition for many types of sustainable design features very little generic cost information has been gathered For sustainable materials some reliable data have been collected into databases such as the Building for Environmental and Economic Sustainability developed by the National Institute of Standards and Technology 52 but further work to develop similar databases for other types of sustainable design features may be warranted The ability to examine various classes of features (materials energy efficiency water etc) through one access point (eg a single website) could be very useful
52 Available at httpwwwbfrlnistgovoaesoftwarebeespleasebees_pleasehtml
5-1
Table 5-1 Status of Business Case Information
Category Economic Benefits Social Benefits Environmental Benefits
Sustainable Some information is avail- This study found no compreshy No comprehensive research siting able on the cost and cost
savings associated with siting approaches This study estishymated cost savings associated with natural landscaping (resulting from reduced water and fertilizer consumpshytion) More data like this could be gathered through case studies or analysis of vendor information
hensive research done on the value society places on susshytainable siting However some survey work or other research may have been done (eg in an envishyronmental impact statement process) to examine benefits of specific sustainable design strategies such as siting on brownfields
has been done on the envishyronmental benefits of siting strategies These would be site-specific It would be feasible to estimate benefits such as CO2 and air pollution benefits of lower energy use due to better passive solar strategies
Water efficiency Some information is available on the cost and cost savings of various water-saving strategies This study estimated first costs and cost savings associated with specific water-efficiency technologies but a wider range of technologies could be investigated The water and cost savings in this study are based on theoretical estimates no water monitoring studies have been incorporated into the business case report to date
Impacts of building water consumption on current and future water supplies have not been studied in any comshyprehensive way (according to the research done for this study) Information on local water supply impacts may be available in cases where envishyronmental impact statements must be completed
This study estimated impacts on water consumption of some specific technologies A wider range of technologies could be investigated (such as those applicable to larger buildings than those examined in this study) Also projections of Federal facility water use and potential for reduction using sustainable design strategies would be useful
Energy efficiency Costs for a wide variety of energy-efficiency measures are available from various sources This study estimated first costs and annual cost savings associshyated with a combination of those technologies Some case study information has also been gathered Further work would involve gathering costs of a wider range of technologies especially those that should be used in larger building Also most of the estimates in this document have been based on models not measured energy savings More measured data could be gathered
Some research results show positive effects on building occupants of certain building features such as daylighting which also reduce energy consumption Although thermal comfort effects on productivity have been studied data are sparse on the impact of particular HVAC systems and other energy-efficiency measures on occupants One exemption is the study by Loftness et al (2002) which compiled research results on occupant benefits of underfloor HVAC systems This area of research might be of interest to the energy-efficiency community
The direct air pollution and CO2 emission impacts of energy-reducing strategies are fairly easy to estimate Other environmental impacts of energy efficiency are site-specific and more difficult to estimate
5-2
Category Economic Benefits Social Benefits Environmental Benefits
Sustainable Some databases of sustain- Some research results indishy The full lifecycle impacts of materials able materials exist (eg the
National Institute of Stanshydards and Technology maintains the Building for Environmental and Econoshymic Sustainability ndash BEES ndash database) This study estimated first costs and estimated cost savings associated with specific sustainable materials
cate that the use of low-emitting material such as carpeting paint etc can reduce occupants illness symptoms
sustainable materials could be investigated Some effort has been undertaken by various research groups to do this kind of work
Indoor environmental quality
Some costs have been gathered in databases such as BEES (see above) Cost differentials for low-VOC paint are included in the document Cost estimates of improved ventilation are available Further refinement and data gathering may be warranted for other features related to indoor environmental quality
Much research has been done in this area (see Appendix F) but gaps exist Gaps could potentially be prioritized based on the business impact of the effects
Very little coverage of this topic is in this document or elsewhere
Commissioning Quite a few case studies of Based on the limited search Estimating air pollution and OampM building commissioning
have been compiled by PECI This document includes a very cursory examination of the costs and cost savings of commissioning and OampM
for information conducted for this study it appears that little work has been done to estimate the positive impacts of commisshysioning and OampM on building occupants This topic has been discussed only qualitatively in this business case report This is a potentially important area for business case research because occupant health impacts have potentially large financial consequences
impacts of reducing energy use through commissioning and OampM is feasible Genshyeral information on energy savings associated with commissioning and OampM has been included in this document
bull Annual energy cost data Most information about cost savings associated with sustainable buildings is based on estimates made in the design phase For instance energy savings are modeled using tools such as Energy-10 and DOE-2 (discussed in Section 2 and Appendix B) But once built the building may not perform as simulated Meters can be used to measure actual performance and compare that against the modeled results but metering studies can be costly and often are not performed because of budget constraints Even when meters are present some building operators report that they do not have the time and resources to analyze the data This document provides information from a few case studies where actual performance has been measured and analyzed A more widespread program to monitor energy consumption and costs by end use in both sustainable and traditional buildings could bolster the business case for sustainable design in Federal facilities
5-3
bull Non-energy operating costs In addition to energy costs annual watersewer costs as well as general maintenance and repair costs could be monitored in sustainable buildings to help determine whether these costs are lower than those in their traditional counterparts
bull Occupant benefits A number of studies indicate that sustainable buildings improve occupant productivity and have other positive impacts that can affect the bottom line but more research is needed to quantify these effects in a way that allows decision makers to translate them into cost savings for every type of building The Center for Building Performance and Diagnostics within the School of Architecture at Carnegie Mellon University has collated a large body of research into a tool called the Building Investment Decision Support (BIDS) BIDS allows a user to generalize the results of particular research studies to estimate potential benefits at the users facility Given the differences between the buildings studied in the research and each users specific building BIDS can provide only a hypothetical estimate of dollar benefits More research on building occupants health satisfaction and productivity in a wide range of buildings would help strengthen the business case In particular a better understanding is needed on how to quantify impacts on the productivity of knowledge workers In addition the sustainable design community would benefit from more research that links specific sustainable design features to the corresponding occupant benefits
bull Other benefits to the building owner and the public Aside from the impacts of indoor environmental quality on occupants very little research has been conducted on the social impacts of other aspects of sustainable design Many hypothesized relationships between sustainable design features and impacts on both occupants and society at large described in the previous sections are supported by only a few studies or by anecdotal evidence Data-gathering methods could be developed to investigate the validity of the following arguments for sustainable design ࠃ Employee turnover is substantially lower in sustainable buildings ࠃ Green buildings experience lower occupant complaints and less on-call maintenance costs ࠃ Property values increase in the vicinity of green buildings ࠃ Sustainable building improves the market for recycled products ࠃ Green buildings are a factor in attracting the most desirable employees
These factors may be as important to the business case as first costs and energy savings so further research to gather data on these topics through surveys and other means may be warranted
bull Environmental benefits Some of the potential research activities on environmental benefits of sustainable design in Federal facilities might include the following ࠃ Develop a better profile of the environmental impacts of Federal facilities ࠃ Benchmark best practices with regard to environmental impacts so comparisons can be
made across facilities ࠃ Improve monitoring and analysis of energy and water consumption in Federal facilities
especially new green buildings and quantitatively assess the environmental improvements (eg reductions in energy air emissions and water consumption)
ࠃ Share lessons learned and case studies that quantify environmental improvements ࠃ Continue to track studies assessing the environmental impacts of buildings and methods
to place economic values on environmental improvements
In November 2002 FEMP convened a workshop of individuals knowledgeable about the business case for sustainable design from various government agencies academia and the private sector
5-4
-
The purpose was to discuss data and research needed to make a stronger business case for sustainable design (FEMP is expected to publish a report on this workshop in the near future) Small groups of workshop participants discussed research needs in three areas direct cost savings associated with sustainable design and construction occupant productivity and well-being and strategic business considerations Some of the recommendations of the participants summarized in Table 5-2 overlap with and build on the suggestions described above
Table 5-2 Key Recommendations from Participants in the Sustainable Design Business Case Workshop
Direct Costs Productivity and Well Being Strategic Business
Considerations
bull Gather cost data (eg dollars per ft2 normalized by building type and location) for many sustainable design projects so that analysts can estimate statistically signify-cant differences in first costs between traditional and sustainable buildings
bull Use DOEs High Performance Buildings website to compile case studies
bull Understand the differences between the costs for incremental improvements that marginally improve a buildings environmental performance versus costs for sustainable buildings derived from integrated design
bull Develop consistent protocols for data collection reporting and use
bull Develop a better understandshying of productivity and how it can be measured for a whole variety of job types including knowledge workers as well as the impacts of sustainable design and construction on productivity
bull Better define the critical building features (both sustainable and other features) that impact health well-being and productivity to be included in controlled studies
bull Focus on causal links between building features and health (eg disease transmission) using controlled studies (perhaps using methods data and results from other fields of research)
bull Develop a more definitive understanding of the relationshyship between daylight natural ventilation and views on health well-being and productivity
bull Conduct cross-sectional studies of high-performance buildings compared with conventional buildings using survey tools
bull Identify methods to better understand risk and liability occupant health effects employee retention and other key impacts of sustainable design
bull Develop a common standard for assessing environmental (broadly defined) impacts of sustainable facilities
bull Develop a method to allow all levels of managers to build their own business case for sustainable projects (within the context of their agencies and management priorities)
bull Work with a broad range of stakeholders to develop ways to better understand the strashytegic benefits of sustainable design and consider ways to study the market-transforming effects of systems such as LEED
5-5
References
10 CFR 434 Energy Code for New Federal Commercial and Multi-Family High Rise Residential Buildings US Code of Federal Regulations as amended
10 CFR 435 Energy Conservation Voluntary Performance Standards for New Buildings Mandatory For Federal Buildings Code of Federal Regulations as amended
40 CFR Part 50 National Primary and Secondary Ambient Air Quality Standards Code of Federal Regulations as amended
American Insurance Association 1999 PropertyCasualty Insurance and the Climate Change Debate A Risk Assessment Washington DC
American Institute of Chemical Engineers 1999 Total Cost Assessment Methodology American Institute of Chemical Engineersrsquo Center for Waste Reduction Technologies Washington DC
ASHRAE 901-1999 Energy Standard for Buildings Except Low-Rise Residential Buildings American Society of Heating Refrigeration and Air Conditioning Engineers Atlanta Georgia
ASHRAE 901-2001 Energy Standard for Buildings Except Low-Rise Residential Buildings American Society of Heating Refrigeration and Air Conditioning Engineers Atlanta Georgia
Beauchemin KM and P Hays 1996 Sunny hospital rooms expedite recovery from severe and refractory depressions Journal of Affective Disorders 4049-51
Belojevic G V Slepcevic and B Jakovljevic 2001 Mental performance in noise the role of introversion Journal of Environmental Psychology 21 277-207
Bornehag CG G Blomquist F Gyntelberg B Jarvholm P Malmberg L Nordvall G Pershagen and J Sundell 2001 Dampness in buildings and health Indoor Air 11(2)71
Boubekri M RB Hulliv and LL Boyer 1991 Impact of window size and sunlight penetration on office workers mood and satisfaction a novel way of assessing sunlight Environment and Behavior 23(4)474-493
Brady R 1995 Commissioning Services Can Reduce Professional Liability Losses In Proceedings of the Third National Conference on Building Commissioning Portland Energy Conservation Inc Portland Oregon
Brager GS and R deDear 2000 A Standard for Natural Ventilation ASHRAE Journal p 21-28
Brightman HS and N Moss 2001 Sick building syndrome studies and the compilation of normative and comparative values In Indoor Air Quality Handbook eds JD Spengler JM Samet and JF McCarthy McGraw-Hill New York
Brown SK 1999 Assessment of pollutant emissions from dry-process photocopiers Indoor Air 9(4)259-267
Brundtland Commission 1987 Our Common Future United Nations World Commission on Economic Development Oxford University Press Oxford England
Building Green Inc February 2003 Environmental Building News 12(2) published by Brattleboro Vermont [online newsletter available by subscription] URL httpwwwbuildinggreencom
6-1
Building Green Inc May 1999 Environmental Building News 8(9) published by Brattleboro Vermont [online newsletter available by subscription] URL httpwwwbuildinggreencom
Butler D and PM Biner 1989 Effects of setting on window preferences and factors associated with those preferences Environment and Behavior 2117-31
Chen A and EL Vine 1998 A Scoping Study on the Costs of Indoor Air Quality Illnesses An Insurance Loss Reduction Perspective Report No 41919 Lawrence Berkeley National Laboratory Berkeley California A briefer version is published in Environmental Science amp Policy 2 (1999) 457-464 Available at URL httpeetdlblgovinsuranceLBNL-41919html
Chou M and G Parker 2000 Recognition of Energy Costs and Energy Performance in Commercial Property Valuation Institute for Market Transformation prepared for the New York State Energy Research and Development Authority New York Energy $martSM Program Available at URL httpwwwimtorg
Clean Air Act Amendments of 1990 42 USC 7401 et seq
Clearwater Y and RG Coss 1990 Functional aesthetics to enhance well-being in isolated and confined settings In From Antartica to Outer Space Life in Isolation and Confinement eds AA Harrison YA Clearwater and CP McKay Springer-Verlag New York
Collins BL 1975 Windows and People US Department of Commerce Washington DC
Collins BL 1993 Evaluation of Subjective Responses to Lighting Distributions A Literature Review US Department of Commerce NISTIR 5119 National Institute of Standards and Technology Gaithersburg Maryland
Collins BL WS Fisher GL Gillette and RM Marans 1990 Second level post occupancy evaluation analysis Journal of the Illuminating Engineering Society 1921-44
deDear RJ M Fountain S Popovic S Watkins G Brager E Arens and C Benton 1993 A Field Study of Occupant Comfort and Office Thermal Environments in a Hot-Humid Climate ASHRAE Report No RPshy702 American Society of Heating Refrigerating and Air Conditioning Engineers Atlanta Georgia
Deering A and JP Thornton 1998 Solar Technology and the Insurance Industry Issues and Applications NRELMP 520-25866 National Renewable Energy Laboratory Golden Colorado
DOE ndash See US Department of Energy
Dziegielewski B J Kiefer E Opitz G Porter G Lantz W DeOreo P Mayer and J Olaf Nelson 2000 Commercial and Institutional End Uses of Water American Water Works Association Denver Colorado
Energy Information Administration 1995 Commercial Buildings Energy Consumption Survey US Department of Energy Energy Information Administration Washington DC
Energy Policy Act of 1992 Public Law 102-486
EPA ndash See US Environmental Protection Agency
Epstein MJ and SD Young 1999 Greening with EVA Management Accounting pp45-49
Eto J J Koomey B Lehman N Martin E Mills C Webber and E Worrell 2001 Scoping Study on Trends in the Economic Value of Electricity Reliability to the US Economy Report No 47911
6-2
Prepared for the Electric Power Research Institute by Lawrence Berkeley National Laboratory Berkeley California Available at URL httpeetdlblgoveaEMSreports47911pdf
Eysenck MW 1982 Attention and Arousal Springer Berlin Germany
Executive Order 13123 June 3 1999 Greening the Government Through Efficient Energy Management The White House Washington DC
Federal Energy Management System MarchApril 2002 Postal Service Installs Largest Federal Roof-Integrated Solar Photovoltaic System In FEMP Focus Federal Energy Management System Distributed Energy Resources Case Study Available at URL wwwerendoegovfemp
Federal Facilities Council 2001 Sustainable Federal Facilities A Guide to Integrating Value Engineering Life-Cycle Costing and Sustainable Development National Academy Press Washington DC
Federspiel CC 2001 Costs of Responding to Complaints Indoor Air Quality Handbook eds JD Spengler JM Samet and JF McCarthy McGraw-Hill New York
Fisk WJ 2000 Health and productivity gains from better indoor environments and their implications for the US Department of Energy E-Vision 2000 Conference Rand Corporation Santa Monica California
Fisk WJ 2001 Estimates of potential nationwide productivity and health benefits from better indoor environments an update In Indoor Air Quality Handbook eds JD Spengler JM Samet and JF McCarthy McGraw-Hill New York
Fisk WJ May 2002 How IEQ Affects Health Productivity ASHRAE Journal pp 56-58
Freeman AM 1993 The Measurement of Environmental and Resource Values Resources for the Future Washington DC
Fried Y LH Slowik HA Ben-David and RB Tiegs 2001 Exploring the Relationship Between Workspace Density and Employee Attitudinal Reaction An Integrative Model Journal of Occupational and Organizational Psychology 74359-372
Gabarro JJ 1987 The Development of Working Relationships Handbook of Organizational Behavior ed J Lorsch Prentice-Hall Englewood Cliffs New Jersey
Geen RG 1984 Preferred stimulation levels in introverts and extroverts The Handbook of Organizational Behavior Prentice-Hall Englewood Cliffs New Jersey
Geen RG and JJ Gange 1977 Drive theory and social facilitation twelve years of theory and research Psychological Bulletin 84 1267-1288
Gutwin L and S Greenberg 2001 A descriptive framework of workspace awareness for real time groupware Proceedings of Computer Supported Collaborative Work lsquo01 Kluwer Academic Press New York
Harris J B Dyer and W Tschudi 2002 Securing Buildings and Saving Energy Opportunities in the Federal Sector Presented at the US Green Building Conference Austin Texas US Green Building Council Washington DC
Hartig T M Mang and G Evans 1991 Restorative effects of natural environment experiences Environment and Behavior 233-26
6-3
Hedge A 2000 Where Are We in Understanding the Effects of Where We Are Ergonomics 43(7)1019-129
Hedge A GE Mitchell and J McCarthy 1993 Effects of a Furniture-integrated Breathing Zone Filtration System on Indoor Air Quality Sick Building Syndrome Productivity and Absenteeism Indoor Air 3328-336
Hedge A WR Sims and FD Becker 1995 Effects of lensed-indirect and parabolic lighting on satisfaction visual health and productivity of office workers Ergonomics 38(2)260-280
Heerwagen J 1990 Affective functioning light hunger and room brightness preferences Environment and Behavior 22(5)608-635
Heerwagen J 2000 Do Green Buildings Enhance the Well Being of Workers Environmental Design+Construction 3(4)24-30
Heerwagen J and B Hunt 2002 Post Occupancy Evaluation of Region 10 Office of the Future US General Services Administration Washington DC
Heerwagen J and G Orians 1986 Adaptations to windowlessness a study of the use of visual deacutecor in windowed and windowless offices Environment and Behavior 18(5)623-630
Heerwagen J J Loveland and R Diamond 1991 Post Occupancy Evaluation of Energy Edge Buildings Center for Planning and Design University of Washington Seattle Washington
Heerwagen J and R Diamond 1992 Adaptations and Coping Occupant Response to Discomfort in Energy Efficient Buildings In Proceedings of ACEEE 1992 Summer Study on Energy Efficiency in Buildings 101083-1090
Heerwagen JH and JA Wise 1998 Green Building Benefits Differences in Perceptions and Experiences Across Manufacturing Shifts HeatingPipingAir Conditioning 57-63
Heschong-Mahone Group 1999 Daylighting in Schools An Investigation into the Relationship between Daylighting and Human Performance Pacific Gas and Electric Company San Francisco California
Hunt WM and GP Sullivan 2002 Assessing the Potential for a FEMP Operations and Maintenance (OampM) Program to Improve Energy Efficiency PNNL-14076 Pacific Northwest National Laboratory Richland Washington
International Facility Management Association 1997 Benchmarks III Research Report 18 Houston Texas
Jakkola JJK and OP Heinonen 1993 Shared office space and the risk of the common cold European Journal of Epidemiology 11(2)213-216
Jones DM and N Norris 1992 Irrelevant Speech and Cognition In Handbook of Human Performance Vol 1 The Physical Environment eds DM Jones and AP Smith Academic Press London
Kaplan R 1992 Urban forestry and the workplace In Managing Urban and High-Use Recreation Settings ed PH Gobster USDA Forest Service General Technical Report NC-163 North Central Forest Experiment Station Chicago Illinois
Kroner W JA Stark-Martin and T Willemain 1992 Using Advanced Office Technology to Increase Productivity Rensselaer Polytechnic Institute Center for Architectural Research Troy New York
6-4
Laboratories for the 21st Century Case Studies 2001 Case Studies Process and Environmental Technology Laboratory at Sandia National Laboratories New Mexico US Department of Energy Available at URL httplabs21lblgovdocsPETL30810pdf
Lamberg-Allardt C 1984 Vitamin D Intake Sunlight Exposure and 25-Hydroxyvitamin D levels in the Elderly During One Year Annals of Nutrition and Metabolism 28144-150
Leaman A 1999 UK study links productivity to ventilation systems HPAC Magazine 71(11)14
Leaman A and B Bordass 2001 The Probe occupant surveys and their implications Building Research and Information 29(2)129-143
Leather P M Pyrgas D Beale and C Lawrence 1998 Windows in the Workplace Sunlight View and Occupational Stress Environment and Behavior 30(6)739-762
Loftness V R Brahme M Mondazzi E Vineyard and M MacDonald 2002 Energy Savings Potential of Flexible and Adaptive HVAC Distribution Systems for Office Buildings Air-Conditioning and Refrigeration Technology Institute (ARTI) Arlington Virginia Available at URL httpwwwarti-21crorgresearchcompletedfinalreports30030-finalpdf
Lotspeich C P Rumsey and S Van der Ryn NovemberDecember 2002 Renovating the Design and Construction Process for Sustainable Success Part 1 Environmental Design+Construction Business News Publishing Company II LLC Available at URL wwwEDCmagcom
MS Addison and Associates October 2002 User-Friendly Building Life-Cycle Cost Analysis Tempe Arizona
Marshall HE and SR Petersen 1995 Life-Cycle Costing Mechanical Estimating Guidebook for Building Construction 6th edition McGraw Hill New York
Menzies D J Pasztor F Nunes J Leduc and C-H Chan 1997 Effect of a new ventilation system on health and well-being of office workers Archives of Environmental Health 52(5)360-368
Milam JA 1992 Underfloor Air Distribution HVAC System Analysis Prepared for USG Interiors Inc and published by Environmental Design International Atlanta Georgia
Mills E 2001 When the Lights Go Out Bests Review AM Best Company Oldwick New Jersey Available at URL httpwwwbestreviewcom2001-07pc_lightshtml
Mills E 2002 Amplifying Real Estate Value Through Energy amp Water Management draft paper available at URL httpeetdlblgovemillsPUBSPDFMills_RE_and_EE(draft)pdf
Mills E 2003a Climate Change Buildings and the Insurance Sector Technological Synergisms between Adaptation and Mitigation Building Research and Information [In Press] Available at URL httpeetdlblgovemillsPUBSMitigation_Adaptationhtml
Mills E 2003b The Insurance and Risk Management Industries New Players in the Delivery of Energy-Efficient Products and Services Energy Policy LBNL-43642 Lawrence Berkeley National Laboratory Berkeley California Available at URL httpeetdlblgovemillsPUBSInsurance_Case_Studieshtml
Milton DK PM Glencross and MD Walters 2000 Risk of Sick Leave Associated with Outdoor Air Supply Rate Humidification and Occupant Complaints Indoor Air 2000 10212-221
6-5
Morgenstern ES RJ Hodgson and L Law 1994 Work efficiency and personality A comparison of introverted and extroverted subjects exposed to conditions of distraction and distortion of stimulus in a learning task Ergonomics 17211-220
National Research Council 1998 Stewardship of Federal Facilities A Proactive Strategy for Managing the Nationrsquos Public Assets National Academy Press Washington DC
National Research Council 2001 Energy Research at DOE Was It Worth It National Academy Press Washington DC
New York City Department of Design and Construction 2000 High Performance Building Guidelines Available at URL httpwwwcinycnyushtmlddchtmlhighperfhtml
Nunes R R Menzies RM Tamblyn E Boehm and R Letz 1993 The effect of varying level of outdoor air supply on neurobehavioral performance function during a study of sick building syndrome In Proceedings Indoor Air 1993 the 6th International Conference on Indoor Air Quality and Climate 153-58 Indoor Air 1993 Helsinki Finland
PECI ndash See Portland Energy Conservation Inc
Pejtersen J H Brohus CD Hyldgaard JB Nielsen O Valbjorn P Hauschildt SK Kjaergaaard and P Wolkoff 2001 Effect of renovating an office building on occupantsrsquo comfort and health Indoor Air 11(1)10-25
Portland Energy Conservation Inc (PECI) 1997 What Can Commissioning Do For Your Building Portland Oregon
Preller LT T Zweers B Brunekreef and JSM Bolej 1990 Sick Leave Due to Work-Related Health Complaints Among Office Workers in the Netherlands Indoor Air rsquo90 1227-230
Randall A 1987 Resource Economics An Economic Approach to Natural Resource and Environmental Policy Wiley New York
Reed DJ 2001 Stalking the Elusive Business Case for Corporate Sustainability World Resources Institute Sustainable Enterprise Program Washington DC
Rosenfeld AH H Akbari S Bretz BL Fishman DM Kurn D Sailor and H Taha 1995 Mitigation of Urban Heat Islands Materials Utility Programs Updates Energy and Buildings 22255-265
Rosenthal NE and MC Blehar (eds) 1989 Seasonal Affective Disorders and Phototherapy Guilford New York
RS Means Company Inc 1999 Building Construction Cost Data Construction Publishers and Consultants Kingston Massachusetts
RS Means Company Inc 2002 Green Building Project Planning and Cost Estimating Construction Publishers and Consultants Kingston Massachusetts
Rubin HR AJ Owens and G Golden 1998 An Investigation to Determine Whether the Built Environment Affects Patientsrsquo Medical Outcomes Center for Health Design Martinez California
Sandia National Laboratories and Laboratories for the 21st Century Case Studies 2001 Process and Environmental Technology Laboratory at Sandia National Laboratories New Mexico US Department of Energy Available at URL httplabs21lblgovcshtml
6-6
Sensharma NP JE Woods and AK Goodwin 1998 Relationship between the indoor environment and productivity a literature review ASHRAE Transactions 104 Part 2
Seppanen OA WJ Fisk and MJ Mendell 1999 Association of ventilation rates and C02
concentrations with health and other responses in commercial and institutional buildings Indoor Air 9226-256
Shute RW 1992 Integrated Access Floor HVAC ASHRAE Transactions 1992 98(1)730-737
Sieber WK LT Stayner R Malkin MR Petersen MJ Mendell KM Wallingford MS Crandall TG Wilcox and L Reed 1996 The National Institute for Occupational Safety and Health Indoor Environmental Evaluation Experience Part Three Associations between environmental factors and self-reported health conditions Applied Occupational and Environmental Hygiene 11(12)1387shy1392
Smedbold HT A Ahlen D Norback and B Hilt 2001 Sign of eye irritation in female hospital workers and the indoor environment Indoor Air 11(4)223-231
Stansfield W and P Shine 1993 Noise sensitivity and psychophysiological responses to noise in the laboratory ed MVallet Proceedings of the 6th International Congress on Noise as a Public Health Problem Nice France INRETS 481-484
Sundstrom E JP Town DW Brown A Forman and C McGee 1982 Physical Enclosure Type of Job and Privacy in the Office Environment and Behavior 14(5)543-559
SustainAbility and the United Nations Environmental Program 2001 Buried Treasure Uncovering the business case for corporate sustainability [report] Available at URL httpwwwsustainabilitycomstoreengagingasp
Szilagyi A and W Holland 1980 Changes in social density relationships with functional interaction and perceptions of job characteristics role stress and work satisfaction Journal of Applied Psychology 65 28-33
Taffalla R and G Evans 1997 Noise Physiology and Human Performance The Potential Role of Effort J of Occupational Health Psychology 2(2)144-155
Teasley S L Covi MS Krishnan and J Olson 2000 How does radical collocation help a team succeed Conference on Computer Supported Collaborative Work 00 Philadelphia Pennsylvania Association for Computing Machinery New York
Torcellini P R Judkoff and S Hayter 2002 Zion National Park Visitor Center Significant Energy Savings Achieved through a Whole-Building Design Process National Renewable Energy Laboratory Golden Colorado Available at URL httpwwwerendoegovbuildingshighperformancecase_studiesoverview
Ulrich R 1984 View through a window may influence recovery from surgery Science 224420-421
Uniform Building Code 1997 International Conference of Building Officials Whittier California
University of California Los Angeles 2000 Waterfree Urinal Study Department of Civil and Environmental Engineering Los Angeles California
University of South Alabama 1999 Comparison of Maintenance GrasspaveGravelpave vs Conventional Asphalt Parking Lots Mobile Alabama
6-7
US Department of Energy 2001 Annual Report to Congress on Federal Government Energy Management and Conservation Programs Washington DC
US Department of Energy 2002 2002 Buildings Energy Databook Washington DC Available at URL httpbuildingsdatabookerendoegov
US Environmental Protection Agency 1989 Report to Congress on Indoor Air Quality In Assessment and Control of Indoor Air Pollution Volume II Office of Air and Radiation (ANR-445) Washington DC
US Environmental Protection Agency 1997 Leading by Example Two Case Studies Documenting How the Environmental Protection Agency Incorporated Environmental Features into New Buildings EPA 742-Rshy97-006 Washington DC
US Environmental Protection Agency 2001 The Greening Curve Lessons Learned in the Design of the New EPA Campus in North Carolina Research Triangle Park North Carolina
US General Services Administration and US Department of Energy 1998 Building Commissioning Guide Version 22 [report] Available at URL httpwwwerendoegovfemptechassistbldgcomgdhtml
US Office of Personnel Management 2003 The Fact Book Federal Civilian Workforces Statistics Available at URL httpwwwopmgovfeddata02factbkpdf
Veitch J and SL McColl 1994 Full spectrum fluorescent lighting effects on people a critical review In Full Spectrum Lighting Effects on Performance Mood and Health Internal Report ed JA Veitch 65953-111 National Research Council of Canada Institute for Construction Research Ottawa Canada
Vine E E Mills and A Chen 1998 Energy-Efficiency and Renewable Energy Options For Risk Management and Insurance Loss Reduction An Inventory of Technologies Research Capabilities and Research Facilities at the US Department of Energys National Laboratories Report No 41432 Lawrence Berkeley National Laboratory Berkeley California (Technical appendixes are bound separately) A briefer version is published in Energy 25 (2000)131-147 Available at URL httpeetdlblgovinsuranceLBNLshy41432html
Vine E E Mills and A Chen 1999 Tapping Into Energy New Technologies and Procedures that Use Energy More Efficiently or Supply Renewable Energy Offer a Largely Untapped Path to Achieving Risk Management Objectives Bests Review - PropertyCasualty Edition Available at URL httpeetdlblgovInsuranceBestReviewbestreviewarthtml
WW Grainger 2000 Industrial Supply Lighting Catalog 2000-2001 Lake Forest Illinois
Wargocki P DP Wyon J Sundell G Clausen and PO Fanger 2000 The effects of outdoor air supply rate in an office on perceived air quality sick building syndrome (SBS) symptoms and productivity Indoor Air 10(4)222-236
Wargocki P DP Wyon YK Baik G Clausen and PO Fanger 1999 Perceived air quality sick building syndrome (SBS) symptoms and productivity in an office with two different pollution loads Indoor Air 9(3)165-179
Wilkins AJ L Nimmo-Smith A Slater and L Bedoes 1989 Fluorescent lighting headaches and eyestrain Lighting Research and Technology 21 11-18
Willard B 2002 The Sustainability Advantage Seven Business Case Benefits of a Triple Bottom Line New Society Publishers Gabriola Island British Columbia
6-8
Wolkoff P CR Johnsen C Franck P Wilhardt and O Albrechtsen 1992 A study of human reactions to office machines in a climatic chamber Journal of Exposure Analysis and Environmental Epidemiology Suppl 171-96
Wyon DP 1996 Indoor Environmental Effects on Productivity In Proceedings of IAQ 96 Paths to Better Building Environments American Society of Heating Refrigerating and Air Conditioning Engineers Atlanta Georgia
Wyon DP 2000 Thermal Effects on Performance In Indoor Air Quality Handbook eds JD Spengler JM Samet and JF McCarthy McGraw-Hill New York
Zijlstra FRH RA Roe AB Leonora and I Krediet 1999 Temporal Factors in Mental Work Effects of Interrupted Activities Journal of Occupational and Organizational Psychology 72163-185
6-9
Appendix A Matrix of Benefits of Sustainable Design
This appendix provides information on the benefits of various sustainable design features The benefits are listed in the matrix (Table A-1) for each sustainable design feature The features are categorized into six primary categories
1 Sustainable siting 2 Water efficiency 3 Energy efficiency 4 Sustainable materials and resources 5 Indoor environmental quality 6 Commissioning and operation amp maintenance (OampM)
These correspond closely to the categories in the Leadership in Energy and Environmental Design (LEEDtrade) rating system and the Whole Building Design Guide1 discussed in Section 1 of the main body of this document Thus this matrix combines the ldquotriple bottom linerdquo benefits framework with six principal elements of sustainable building design Some of the benefits accrue to the facility owner and other benefits accrue to other parties such as employees local governments the local communityeconomy or the public at large When applicable those are designated in the table
Although the list of benefits is extensive it may not be completely comprehensive Some of the benefits of sustainable design will be discovered as more experience is gained with living and working in sustainable buildings
1 See httpwwwwbdgorgindexasp
A-1
Table A-1 Possible Benefits of Sustainable Design by Feature
A-2
Sustainable Design Feature
Benefits Category
Economic Social Environmental
Sustainable Siting
Site selection Analyze alternatives including use of existing facilities Do not build on prime agricultural land floodshyplains and habitats for threatened species near wetlands or on parklands Consider urban redevelopment and brownfield redevelopment sites (which require cleanup)
Facility bull Lower site preparation costs bull Potential for reduced costs of
litigation and time delay (eg because threatened species are not present not at the site)
Local government bull Lower infrastructure development
costs to support existing rather than greenfield sites
Local economy bull Reduced tourism losses
Society bull Preservation of natural
areas agricultural land and parkland for future generations
Society bull Decreased use of virgin resources bull Protection of threatened species and
wetlands bull Remediation of contaminated land
(when brownfield is used) bull Reduced erosion and flood damage bull Reduced impact on fisheries and
forests
Site analysis and harmonious building-site relationship Inventory and analyze the ecological context urban and historical context and natural and cultural attributes Organize mass orientashytion topography and outdoor spaces to employ passive solar principles provide outdoor spaces etc Design to reduce potentially detrimental conditions such as slopes that can erode Avoid adverse impacts on adjacent properties Carefully consider the placement of existing trees on site
Facility bull Possible reduction in first costs
(reduced size and cost of mechanical systems)
bull Reduction in operating costs (fuel costs)
Local government bull Elimination of unnecessary
infrastructure expenditures due to good assessment of site resources
Society bull Improved aesthetic and
functional quality of site and building for both occupants and neighbors
Society bull Reduction in energy consumption
and emissions due to optimal orientation etc
bull Conservation and restoration of ecological and cultural resources
bull Reduced negative microclimate and environmental effects in local vicinity
Facilitation of alternative transporshytation use Locate facility near rail station or bus lines Provide covered wind-sheltered seating or waiting areas for public transport Provide bicycle storage and showers Install alternative-fuel refueling stations Provide preferred parking for carpools
Facility bull Slightly lower capital cost due to
reduced parking lot size (could be offset by additional costs for showers and refueling stations)
Employees bull Potentially lower commuting costs
(using public transport rather than personal cars)
Employees bull More transportation options
Society bull Lower energy use and air pollution
from vehicles bull Reduced land disturbance for new
roads
Sustainable Design Feature
Benefits Category
Economic Social Environmental
Erosion and sedimentation control and stormwater management Develop sediment and erosion control plan Prevent loss of soil during construcshytion Prevent sedimentation of storm sewer or receiving streams Plant watershyshed buffers Allow infiltration via porous surfaces Filter stormwater through plantings and soil Use natural drainage systems
Facility bull Decreased cost of storm drainage
construction by using more natural methods
bull Reduced cost of landscaping after construction is completed (because topsoil is saved)
Localstate government bull Reduced cost of stream cleanup
and water treatment plants
Neighborslocal community bull Less disturbance during
construction
Society bull Less loss of soil during construction bull Prevention of sedimentation of storm
sewers or receiving streams bull Reduced dustparticulate matter
during construction bull Less disruption of natural water flows bull Reduction of runoff into natural water
systems
Reduced site disturbance during Facility Neighborslocal community Society construction Limit site disturbance bull Potentially decreased cost of clearshy bull Less disturbance during site bull Preservation of trees and other around the building perimeter curbs cutting and subsequent preparation vegetation walkways and main utility branch relandscaping bull Retention of vegetation and bull Increased habitat for natural species trenches Reduce the development bull Decreased site infrastructure costs scenic vistas biodiversity footprint to exceed open space bull More greenspace for use by requirements in local zoning rules occupants andor
community
Sustainable landscape and exterior design Use self-sustaining landscape design and site maintenance procedures Restore habitats Use plants native to the region Consider drought-resistance plants Avoid plants needing chemical treatment and fertilizers or causing allergic reactions Consider using green roofs
Facility bull Reduced maintenance costs water
use fertilizer and fossil fuel use due to naturally manicured landscaping
bull Possibly decreased heatcooling loads due to vegetated roof
Neighborslocal community bull More aesthetic natural
exterior appearance of building to neighbors and occupants
Society bull Reduced impact on microclimate bull Lower threat of negative ecological
impacts resulting from use of nonshynative plant species
Light pollution reduction Allow no direct-beam illumination to leave building site Use light-colored or reflective edges along driveways and walks to reduce dependence on high-wattage electrical lighting at night Use solar lights Use security lighting with motion sensors to reduce use of lights at night
Facility bull Possibly lower cost of electricity for
lighting (depending on design)
Neighborslocal community bull Less disturbance to natural
night sky conditions bull Improved security of
building
Society bull Preservation of nocturnal habitat
A-3
Sustainable Design Feature
Benefits Category
Economic Social Environmental
Water Efficiency
Water use reduction Use captured rainwater for landscaping toilet flushing etc Treat and re-use graywater excess groundwater and steam condensate Use low-flow fixtures and fittings (pressureshyassisted or composting toilets waterless urinals etc) and ozonation for laundry Use closed-loop systems and other water reduction technologies for processes
Facility bull Decreased water costs bull Potential for OampM savings Local government bull Less wastewater treatment
infrastructure needed (fewer taxes to pay for infrastructure)
Society bull Preservation of natural
water resources for future generations
Society bull Reduced use of potable water bull Reduced generation of wastewater
lower discharge to natural waterways
Energy Efficiency
Space layout Fully utilize opportunities Facility Employees Society for passive solar heatingcooling Optishy bull Diminished heating cooling and bull Improved quality of interior bull Lower electricity use fossil fuel use mize natural ventilation and daylighting lighting loads and reduced energy space (a secondary benefit and air pollutioncarbon dioxide Enhance penetration of daylight to interior costs of many energy-efficient (CO2) emissions and other spaces Provide inviting staircases to bull Increased operating efficiency due design features) environmental impacts of electricity encourage their use rather than elevators to right sizing of equipment
bull Possibly lower capital costs due to reduced sizecost of mechanical systems through more efficient design features appropriate sizing and optimal integration
bull Potentially higher occupant productivity due to daylighting
Societyutility companies bull Avoidance of electricity generation
and transmissiondistribution construction costs
production and fossil fuel use bull Decreased impacts of fuel production
and distribution (for fuels used in the building or in production of electricity for the building)
A-4
Sustainable Design Feature
Benefits Category
Economic Social Environmental
Building envelope Design envelope to provide good thermal and moisture control while supporting passive solar and natural ventilation design strategies Detail walls to provide best vapor barriers and low outside air infiltration
Facility bull Diminished heating cooling and
lighting loads and reduced energy costs
bull Increased operating efficiency due to right sizing of equipment
bull Possibly lower capital costs due to reduced sizecost of mechanical systems through more efficient design features appropriate sizing and optimal integration
Societyutility companies Avoidance of electricity generation and transmissiondistribution construction costs
Employees bull Improved quality of interior
space (a secondary benefit of many energy-efficient design features)
Society bull Lower electricity use fossil fuel use
and air pollutioncarbon dioxide (CO2) emissions and other environmental impacts of electricity production and fossil fuel use
bull Decreased impacts of fuel production and distribution (for fuels used in the building or in production of electricity for the building)
Lighting and sun control Use glazing to supply daylighting but control glare Use roof monitors and high clerestory windows Specify photocell-dimming sensors to adjust light Use separate switches to turn off lights in individual areas Use light shelves and other technishyques to bring light deeper into the buildshying Supplement daylighting with high-performance lighting that improves visual quality while reducing electrical use Use low-ambient lighting levels with task lights where appropriate Use occupancy sensors dimmers photocells and lumen maintenance controls
Facility bull Reduced electricity consumption
costs bull Lower cooling loads due to lower
heat gains from electrical lighting hence reduced energy costs and lower capital costs for cooling system
bull Potentially higher occupant productivity due to daylighting and visual quality
Societyutility companies bull Avoidance of electricity generation
and transmission distribution construction costs
Employees bull Improved quality of interior
space
Society bull Lower electricity use and the
associated air pollutionCO2 emissions bull Decreased impacts of fossil fuel
production and distribution
A-5
Sustainable Design Feature
Benefits Category
Economic Social Environmental
Systems and equipment Optimize mechanical systems to work with the building layout orientation envelope etc Consider HVAC zoning distribution systems heat recovery systems modular boilers and ice storage Do not use chlorofluorocarbonhydrofluorocarbon (CFCHCFC) refrigerants Develop inteshygrated systems designs that consider interaction of systems with overall building layout envelope etc Include efficient power distribution systems electrical equipment motors transformers etc Consider use of raised floor and underfloor HVAC with personal controls
Facility bull Reduced energy costs bull Reduced capital costs due to
downsizing of equipment bull Lower churn costs (if raised floor is
used) bull Better productivity (if personal
controls are implemented)
Employees bull Improved occupant comfort
Society bull Lower electricity use and the
associated air pollutionCO2 emissions bull Decreased impacts of fossil fuel
production and distribution bull Protection of the ozone layer (due to
avoidance of CFCsHCFCs)
Renewable energy Consider using photovoltaic solar heat and hot water geothermal heat pumps etc Consider entering into green power or renewable credit contracts
Facility bull Lower annual energy costs Local economy bull Potential for emerging businesses
related to renewable energy
Society bull Promotion of market for
renewable energy products
Society bull Lower electricity use and the
associated air pollutionCO2 emissions bull Decreased impacts of fossil fuel
production and distribution
Energy load management Use energy Facility Employees Society management systems monitoring and bull Operational savings (can offset bull Improved comfort health bull Improved energy efficiency hence controls to continuously calibrate adjust higher first costs) and safety lower electricity and fossil fuel use and maintain energy-related systems bull Reduced capital cost of mechanical
systems because control systems reduce the need for oversizing
and lower emissions Employees bull Better indoor air quality
A-6
Sustainable Design Feature
Benefits Category
Economic Social Environmental
Sustainable Materials and Resources
Storagecollection of recyclables Provide a system for collecting and storing materials such as paper glass plastic and metals for recycling
Facility bull Possibly lower waste disposal costs Local community bull Local recycling business
opportunities Local government bull Lower landfill construction costs
Employees bull Opportunity for building
occupants to feel they are making a difference which can be an opening for other actions
Society bull Expanded market for
recycled and environmentally preferable products
Society bull Reduced strain on landfills bull Reduced use of virgin natural
resources
Building and resource re-use Reuse building shell from existing buildings and fixtures from demolished buildings Use salvagedrefurbished materials
Facility bull Decreased first costs due to re-use
of materials Local government bull Less waste disposal lower need for
new waste disposal facilities
Society bull Expanded market for
salvaged materials
Society bull Reduced strain on landfills bull Reduced use of virgin natural
resources
Construction waste management Facility Society Society Recycle or productively use construction bull Possible decrease in construction bull Expanded market for bull Reduced strain on landfills demolition and land clearing wastes first costs due to lower waste recycled and bull Reduced use of virgin natural Divert these wastes from landfill disposal disposal costs environmentally preferable
products resources
Recycled content Select environmentshyally preferable materials that include recycled materials (use standards developed by government agencies or other reliable sources)
Facility bull Possible decrease in first costs of
construction due to lower price of recycled materials (in some cases)
Society bull Expanded market for
recycled and environmentally preferable products
Society bull Reduced strain on landfills bull Reduced use of virgin natural
resources
A-7
Sustainable Design Feature
Benefits Category
Economic Social Environmental
Waste prevention Use modular materials Select products for durability Eliminate unnecessary finishes and other products
Facility bull Possible decrease in first costs of
construction due to less use of materials
bull Longer lifetime of building and building features due to increased durability of materials used
bull Decreased operating costs (including replacement and waste disposal costs) by using more durable materials that need to be replaced less often
Society bull Less nuisance associated
with landfills
Society bull Reduced strain on landfills bull Reduced use of virgin natural
resources
Localregional materials Obtain materials whenever possible from local resources and manufacturers
Local economy bull Success of local businesses
Local economy bull Employment opportunities
Society bull Lower energy consumption and
resulting air pollutant air emissions due to less freight transportation
Rapidly renewable materials (bamboo cork wheat straw boards etc) certified wood
Facility bull Possible reduction of first costs Society bull Emerging businesses
Society bull Preservation of forests for
future generations
Society bull Reduced usedepletion of long-cycle
renewable materials better forest management biodiversity
Design for re-use Design buildings for flexible uses so they can be reconfigured in the future as needs change
Facility bull Lower lifecycle capital construction
requirements bull Lower churn costs
Society bull Less disturbance due to new
construction
Society bull Lower resource consumption (on a
lifecycle basis)
A-8
Sustainable Design Feature
Benefits Category
Economic Social Environmental
Indoor Environmental Quality
Indoor air quality Control pollutant sources (from neighboring buildings soil such as radon and methane and excessive dampness) Use low-emission materials (paint carpet fabrics) Allow new materishyals to ventilate before occupancy Include good ventilation systems and operable windows where appropriate Specify systems that feature economizer cycles Consider underfloor air ducting Use CO2
sensors Use control systems including personal workstation control if possible Eliminate tobacco smoke
Facility bull Organizational productivity
improvements (reduced absenteeism)
bull Lower workmanrsquos compensation disability health and liability insurance costs
bull Reduced threat of litigation Employees bull Lower health care costs to
occupants
Employees bull Reduced adverse health imshy
pacts (especially respiratory diseasediscomfort)
bull Improved personal productivity
Employees bull Better air quality inside the facility Society bull Reduced volatile organic compound
emissions to the atmosphere due to use of low-emission materials
Good visual quality Appropriately use windows skylights shading devices and light shelves Avoid glare Combine ambishyent and task lighting Use high-frequency ballasts Give occupants adequate visual access to outdoors and to the organization of the building Use pleasing surface colors and reflectivity
Facility bull Reduced energy costs (by using
daylighting)
Employees bull Satisfaction with work
environment bull Improved personal
productivity
Society bull Lower energy use and emissions due
to use of daylighting and energy efficient lighting
Noise control Reduce noise at the source during design phase (eg through orientation building layout selection of mechanical plumbing and ductwork) Use acoustic buffers floating floor slabs and sound-insulated wall floor and ceiling penetrations Achieve good room acoustics by configuring rooms using white noise etc
Facility bull Lower cost of dealing with
complaints
Employees bull Satisfaction with work
environment bull Improved personal
productivity
Systems controls Provide maintenance staff and users with level of control over automated building systems appropriate to their level of technical expertise Provide individual occupant controls when possishyble (in conjunction with underfloor systems)
Facility bull Possible decrease in operational
costs bull Decreased churn costs due to
underfloor systems
Employees bull Thermal and visual comfort
of occupants bull Improved personal
productivity
Society bull Decreased energy use and resulting
environmental impacts due to better control of energy systems
A-9
Sustainable Design Feature
Benefits Category
Economic Social Environmental
Commissioning and OampM
Commissioning and OampM Use third- Facility Employees Society party assessments to ensure that the bull Fewer equipment breakdowns and bull Occupant satisfaction with bull Lower energy consumption and air installed systems work as designed downtime costs building pollutant emissions Develop OampM manuals and train staff bull Lower lifecycle replacement costs
bull Reduced costs of dealing with occupant complaints
bull Healthsafety of building occupants
Employees bull Better indoor air quality
Sustainable housekeeping and maintenance Clean and maintain all building equipment to ensure proper functioning Check for water leaks and make repairs Check for signs of mildew and mold growth Use nontoxic natural cleaningmaintenance chemicals Periodically or continuously monitor indoor air quality
Facility bull Possibly lower operating expenses
(eg reduced water consumption) bull Less chance of sick building
syndrome and associated legal costs
Employees bull Improved indoor environshy
mental quality bull Better health of occupants
Society bull Reduced chemical influx into the
environment (by using natural cleaning products)
bull Lower water use (due to leak monitoring)
A-10
Appendix B Energy and Construction Cost Estimates1
This appendix describes the energy modeling used in the analysis presented in Section 22 of this document The analysis showed that the combination of energy-savings features added to the prototype building had a savings-to-investment ratio of nearly 15 and an adjusted internal rate of return of almost 5 which makes a compelling business case for sustainability
Figure B-1 illustrates the main steps of the modeling process As the figure shows the modeling effort began with a characterization of a base-case building This building intended to represent a typical new Federal office building was the basis against which the sustainable building was compared The base-case buildings energy use was then estimated using a building energy simulation model DOE-21E The base-case characterization and model assumptions are documented in Section B1 of this appendix
The sustainable building was defined in terms of a number of improvements made to the base-case building A set of potential improvements was developed and simulated in another energy simulation model ENERGY-10 which optimized for energy and lifecycle cost savings This simulation provided information that allowed a final set of improvement options to be selected based on maximum energy and lifecycle cost savings These options defined the sustainable building This process is described in Section B2 of this appendix
The sustainable building was then simulated in DOE-21E to obtain energy-use estimates These were compared with the energy-use estimates of the base-case building and estimated energy savings and the associated incremental costs were calculated The simulation of the sustainable building is described in Section B3 and the results of the energy-savings and cost calculations are described in Section B4 Section B5 explains some of the differences between DOE-21E and ENERGY-10
Base-Case Building Characterization
Energy Design Standard
The study used the American Society of Heating Refrigerating and Air Conditioning Engineering (ASHRAE) standard 901-1999 as the energy design standard or code for the base-case building and ASHRAE 901-1999 Table A-13 to implement the base-case building envelope parameters The HVAC equipment in the base case was modeled at the minimum efficiency levels according to ASHRAE 901-1999 Tables 621B and 621E The supply fan energy was modeled separately by breaking down the energy-efficiency ratio (EER) and coefficient of performance (COP) into its components For some building characteristics not specified in ASHRAE 901 such as the building operation schedules and HVAC system types assumptions were made based on data from several sources including the Commercial Buildings Energy Consumption Survey (Energy Information Administration 1995) the Proposed Appendix G to ASHRAE 901-2001 and general engineering practices
Construction Cost Estimating for the Base-Case Building Design
The purpose of the construction cost estimate for the overall base-case building was to set a reasonable order-of-magnitude cost for use in the lifecycle cost calculations The estimating method was parametric ndash
1 This appendix was written by D Winiarski S Shankle J Hail and B Liu Pacific Northwest National Laboratory and A Walker National Renewable Energy Laboratory
B-1
B-2
Simulation of Baseline Building Energy Use
Selection of Sustainable Design Features
Baseline DOE-21 Baseline Building DOE-21 Energy Use
Characterization Simulation
Selected Sustainable Design Options Energy-10 Sustainable Design
Features
Simulation of Sustainable Sustainable Design DOE-21 Sustainable
DOE-21Design Building Building Design Energy Use
Characterization Simulation Energy Use
Calculation Energy Savings Energy of Energy and Savings Metrics Cost Savings Calculation
Figure B-1 Energy Simulation Flow Diagram
using simple inputs such as the square feet of the building and subareas and the generic type of structural system The parametric tool was the Commercial Construction Knowledgebase module within Timberline Precision Estimating ndash Extended Edition Version 622 Timberline uses RS Means cost data and adjusts costs to Baltimore Maryland The Timberline parametric modules allow some specific inputs for a building such as specifying gas or electric heat This study specified some of those inputs to approximate the natural gas heating for the base-case building but otherwise relied on the modules assumptions
Building Occupancy Type and Size
The study focused on an office-building model According to the US General Services Administration (GSA) offices are the second largest square-footage category (after housing) and the largest building cost category The study selected a building size of 20000 ft2 because the average size of the office buildings in GSAs inventory is 20979 ft2
Building Location
The study selected Baltimore Maryland as the location for the DOE-21e and construction cost estimating because it represented a large city with a substantial Federal construction market and a moderate East Coast climate Because one purpose of this study is to help guide new Federal construction projects the study reviewed FY 2002 capital appropriations and found that roughly two-thirds of the appropriations were slated for states in the southern half of the continental United States The appropriations for California appeared to be the highest of any individual state However when grouping states into informal regional climate zones the states in the moderate eastern climate zone had significantly more appropriations than California The selection of an appropriate average climate was also based on Pacific Northwest National Laboratorys (PNNLs) experience gained through developing ASHRAE 901-1999 and Federal Energy Code (10 CFR 434) standards
Energy Rates
The study used energy cost rates for Baltimore Maryland as shown in Table B-1 The rates were developed from the local utility Baltimore Gas and Electric Company (BGE) Baltimore is a deregulated utility market and BGEs rate structure has many options to select from despite a few frozen tariffs Apparently GSA has a contract with BGE with very different schedules ndash see httphydragsagovpbsxuareawideswordbgemoddoc For simplicity this study developed an average or blended rate based on the information provided through BGEs website (the current link is httpwwwbgecomcmpCDAsection0166860300html) This study used $0077 per kilowatt-hour (kWh) and $0692 per therm based on review of BGE rate schedules
Table B-1 Energy Rates for the Base-Case Building
Energy Type Rate
Natural gas ($therm) $0692
Electricity ($kWh) $0077
2 httpwwwtimberlinecomproductsestimatingcommercial_construction_knowledgebasehtm
B-3
Derivation of Blended Electricity Rate
Commercial buildings such as the one used in the studys base-case building are likely to be on a general service or a small general service rate schedule Neither schedule is a typical demand schedule The general service schedule has two complex options for the energy demand charge averaging summer and non-summer costs The small general service schedule does not have a standard demand rate but uses peak and offpeak rates The base simple general service schedule option would be as follows
Base rate $1150month Energy charge
October through May $003749kWh June through Sept $005383kWh
Transmission charge $000298kWh Delivery service charge $002250kWh Competitive transmission charge $000576kWh
The above rates can be simplified to the following schedule for the studys base-case building
Base rate $1150month Energy charge
October through May $006873kWh June through Sept $008507kWh
Derivation of Blended Gas Rate
The general service gas schedules are located at httpwwwbgecomCDAFilesBsch_cdoc however this schedule appears to cover delivery cost but not the energy cost
Customer charge $2700 month Delivery price
First 10000 therms $01724therm All remaining therms $00936therm
BGE also charges separately for automateddaily metering A complete rate was obtained by BGE customer service who reported that costs varied between the three major suppliers in the area and from year to year However the average costs based on the last two years available are shown in Table B-2
Table B-2 Average BGE Rate (based on the last two years)
Month $Therm Month $Therm
January $0570 July $0502
February $0597 August $0458
March $0504 September $0461
April $0517 October $0498
May $0495 November $0476
June $0500 December $0562
B-4
Base-Case Building Design Assumptions
Table B-3 summarizes the key input assumptions used for the base-case building design in the DOEshy21E models
Table B-3 Base-Case Assumptions Used in the DOE-21E Models
Characteristic Base-Case Assumptions
General
Building type Office
Location Baltimore Maryland
Gross area 20164 ft2
Operating hours 8am - 5pm Monday-Friday
Utility rates
Electric energy rate Base rate $1150month
Energy charge $0077kWh
Natural gas price ($therm) Base rate $270month
Energy charge $0692therm
Architectural features
Configurationshape
Aspect ratio 21
Perimeter zone depth 15 ft
Number of floors 2
Window area 20 window-to-wall ratio
Floor-to-ceiling height 9 ft
Floor-to-floor height 13 ft
Exterior walls
Wall type 4 Face brick faccedilade on 16 on-center metal framing
Opaque wall U-value 0124
Wall insulation R-13 cavity insulation
Roof
Roof type Builtup roofing with concrete deck
Solar absorptance 07 (medium dark)
Roof U-value 0063 Btuhr-ft2-oF
Roof insulation R-15 continuous insulation
Floor structure
Floor type Concrete
Floor insulation R-54 perimeter insulation
Fenestrationwindows
Window type Aluminum frames with thermal beaks and double panes
Total U-value 057 Btuhr-ft2-oF
Shading coefficient 045
B-5
Characteristic Base-Case Assumptions
Visual transmittance 052
Window shadingoverhangs None
Building internal loads
Occupancy
Number of occupants 96
Occupancy schedule 8am - 5pm Monday-Friday
Lighting
Fixture type T-8 with electronic ballasts
Peak lighting power density 138 wattsft2 (net building wattage from ASHRAEs space by space analysis)
Lighting schedule 7am - 6pm Monday-Friday
Occupancy sensors None
Daylighting None
Office equipment
Equipment schedule 7am - 6pm Monday-Friday
Peak load density 072 watts ft2
HVAC system
HVAC system type Package rooftop unit constant-air-volume with gas furnace
Number of HVAC units Five units to serve five HVAC thermal zones
Space temperature setpoint 75ordmF coling70ordmF heating
Space setbacksetup 80ordmF cooling65ordmF heating
Cooling equipment efficiency 101 EER
Outside air supply 20 cubic feetminute (cfm) per person 17 of supply air cfm
Heating furnace efficiency 80
Ventilation control mode Constant during occupied periods cycle during unoccupied periods
Economizer None
Design supply air Minimum 05 cfmft2
Air-to-air energy recovery ventilation
None
Fan total static pressure 20 in total 10 in related to ductwork system
Fan schedule 6am - 6pm Monday-Friday with night cycle onoff
Fan motor efficiency 85
Fan efficiency 65
Servicedomesticpotable water heating
Hot water fuel type Natural gas
Thermal efficiency 80
Supply temperature 120
Hot water consumption 09 gallons per dayperson
Exceeds ASHRAE 901-1999
B-6
Selection of Sustainable Design Features
The National Renewable Energy Laboratory (NREL) performed a screening analysis of potential sustainable design options using ENERGY-10 a PC-based software design tool developed by NREL The rationale for using ENERGY-10 in this study is that with the new lifecycle costing capabilities of Version 16 it is quick and easy to search possible solutions and narrow the optimal combination of measures for further analysis with the more detailed DOE-21E model (see section B5 for a brief discussion of the differences between ENERGY-10 and DOE 21E) ENERGY-10 was used to initially assess and optimize a number of design options
bull Changes in the installed lighting power density bull Addition of daylighting controls bull Changes in building aspect ratio bull Skylighting in the building core bull Changes in fenestration area by orientation for daylighting passive solar heating and cooling
load avoidance bull Changes in building insulation levels
The NREL screening analysis documented in this section was used to characterize a suite of measures that maximizes energy savings and reduces the lifecycle cost of the sustainable building However many of the details of the implementation of the sustainable design options differ between their characterization in the NREL screening analysis and the final DOE-21E simulation This section documents the screening analysis while Section B4 documents the final sustainable building simulation
Aspect Ratio
One feature varied in the analysis was the aspect ratio3 of the building (see Figures B-2 and B-3) For a building of 20000 ft2 and two stories an aspect ratio of less than 6 requires a core zone whereas an aspect ratio from 6 to 12 could be a double-loaded corridor with no core zone For the base case a window-to-wall-area ratio of 020 was maintained for all four sides For the energy-efficient case (designated the EE case in the figures) the south window-to-wall-area ratio was as follows south 038 east 007 west 005 and north 011
Energy use was minimized by an aspect ratio of 15 for both the base and sustainable cases 4
However for the sustainable design the benefits of passive solar heating and daylighting compensated for the increased surface area and energy use increased only slightly with increasing aspect ratio However increasing aspect ratio increased first costs substantially because of the additional materials to accommodate the increased surface area for both the base and sustainable design cases
3 The ratio of the longer side of the building to the shorter side 4 In DOE-21e aspect ratio was 20 in both the base and sustainable cases This may have resulted in a slightly higher energy use and capital cost than the ENERGY-10 simulation but differences were not deemed significant enough to warrant changing the model setup
B-7
0
500000
1000000
1500000
2000000
2500000
0 1 2 3 4 5 6 7 8 9 10 11
Aspect Ratio (SE)
Ann
ual E
nerg
y U
se (k
btu
year
)
BaseCase EE Case
Figure B-2 Annual Energy Use (kBtuyr) versus Aspect Ratio (southeast)
3800000 3850000 3900000 3950000 4000000 4050000 4100000 4150000 4200000 4250000
0 5 10 15
Aspect Ratio (SE)
Life
Cyc
le C
ost (
$)
Base Case EE Case
Figure B-3 Lifecycle Cost ($) versus Aspect Ratio (southeast)
Energy Conservation Measures
Eight energy conservation measures (ECMs) were selected to define the sustainable building daylighting improved windows improved lighting efficiency window shading improved insulation passive solar heating economizer cycle and high-efficiency equipment Each measure and its cost are briefly described below
ECM 1 ndash Daylighting
Ten lighting zones were set up one facing each direction (ie east south west and north) on each floor a core zone on the top floor with 12 skylights and a 4592 ft2 core zone on the first floor with no daylighting Continuous dimming controls maintain a 50-foot-candle lighting level The cost of this measure was $188 lighting zone for dimming sensor and controls and $075 ft2 of floor
B-8
space to cover the cost of upgrading to dimming ballasts Therefore the total cost of daylighting controls was $13371
Window dimensions were optimized and costed in the passive solar heating ECM (described below) including the effects of daylight savings The 4592-ft2 core zone on the second floor is daylit only by skylights The ratio of skylight area to zone roof area was varied from 002 to 008 and annual energy use was minimized by an area ratio of 006 The cost of skylights was estimated at $90ft2 which is significantly more expensive than wall windows Figures B-4 and B-5 show the annual energy use and lifecycle costs respectively as functions of skylight to zone roof area
ECM 2 ndash Improved Windows
Double-pane windows with U=067 Btuhr-ft2-oF were replaced with low-emissivity windows with U=031 Btuhr-ft2-oF the solar heat gain coefficient remains at 039 for both but the premium
Figure B-4 Annual Energy Use (kBtuyr) as a Function of Skylight to Zone Roof Area Ratio
Figure B-5 Lifecycle Cost ($) as a Function of Skylight-to-Zone-Roof-Area Ratio
B-9
glazing uses a selective surface with visible transmittance of 07 The cost of the premium glazing was $25 ($22 to $28ft2) for item 08810 3004000 in RS Means (2002) (super-efficient glazing triple-glazed with low-e glass argon filled U=026) The cost of standard glass was $2250 for item 4600400 in RS Means (2002) (316 float 58 thick unit U=056) for a $250ft2 difference or $122 ft2R-value Table B-4 lists the results of the glazing improvement
Table B-4 Results of Glazing Improvement
Base Case Premium Glazing
Window construction Buscase U=067 4060 low-e alb U=031etc
Window total gross area (ftsup2) 2208 2208
Windows (northeastsouthwestroof) 232323230 232323230
Glazing name Buscase U=056 Double low-e selective U=026
Energy use (kBtu) 904917 820385
Energy cost ($) 16058 15633
Construction costs 3146828 3149669
Lifecycle cost 3815530 3805379
ECM 3 ndash Improved Lighting Efficiency
The lighting power density was reduced from 138 to 10 Wft2 by architectural design of the lighting system and premium efficiency equipment The cost was estimated at $036ft2 or $7259
ECM 4 ndash Window Shading
Overhangs provide shade over the south-facing windows The cost was estimated at $1237ft of overhang projection per linear foot of shaded window Only windows facing east south and west were supplied with overhangs for a linear window length of 360 ft Overhang projection was varied in the model from 0 to 4 ft with a 3-ft projection minimizing annual energy use The cost of the 3shyft projection was $13359 Figures B-6 and B-7 show the annual energy use and lifecycle costs respectively as a function of overhang projection
ECM 5 ndash Improved Insulation
Six wall cross-sections were considered to achieve different R-values R-9 R-18 R-22 R-36 and R-50 and R-1000 (R-1000 was also considered just to provide a limiting case of the importance of insulation) While R-36 provides the lowest lifecycle cost it is only slightly lower than R-18 so Rshy18 was adopted Figure B-8 shows the net present value as a function of wall U-value (the inverse of the R-value)
The overall loss coefficient of the envelope was reduced from 3276 to 1556 Btuhr-oF at a total cost of $18868 (Upgrading to 6-in steel frame walls with polyisocyanurate insulation added $005unit R-valueft2 of wall area or $3943 for wall insulation adding foam insulation to reduce the slab perimeter F-value from 035 to 020 Btuhrft2-oF cost $5ft of perimeter or $8283 for foundation insulation improving roof insulation added $003unit R-valueft2 of roof area totaling $6505 for roof insulation and adding premium doors cost $137)
B-10
Figure B-6 Annual Energy Use (kBtuyr) as a Function of Overhang Projection (ft)
Figure B-7 Lifecycle Cost ($) as a Function of Overhang Projection (ft)
Figure B-8 Net Present Value (k$) as a Function of Wall U-Value
B-11
ECM 6 ndash Passive Solar Heating
The amount of glazing on the east west north and south walls was varied to minimize annual energy use The passive solar heating measure was implemented by changing from an even distribution of windows on all sides (20 window-to-wall-area ratio) to the following distribution
bull 015 on the north bull 010 on the east bull 010 on the west bull 030 on the south
The total window area in the walls decreased from 2208 ft2 to 2064 ft2 (not including the 12 skylights in the daylighting measure) The cost was $25ft2 of window area for a total cost savings of $3600 over the base case Figures B-9 through B-16 show the annual energy use and lifecycle costs as a function of the window-to-wall-area ratios for east west south and north windows respectively
Figure B-9 Annual Energy Use (kBtu) as a Function of East Window-to-Wall-Area Ratio
Figure B-10 Annual Energy Use (kBtu) as a Function of West Window-to-Wall-Area Ratio
B-12
Figure B-11 Annual Energy Use (kBtu) as a Function of South Window-to-Wall-Area Ratio
Figure B-12 Annual Energy Use (kBtu) as a Function of North Window-to-Wall-Area Ratio
Figure B-13 Lifecycle Cost ($) as a Function of East Window-to-Wall-Area Ratio
B-13
Figure B-14 Lifecycle Cost ($) as a Function of West Window-to-Wall-Area Ratio
Figure B-15 Lifecycle Cost ($) as a Function of South Window-to-Wall-Area Ratio
Figure B-16 Lifecycle Cost ($) as a Function of North Window-to-Wall-Area Ratio
B-14
ECM 7 ndash Economizer Cycle
An economizer was added with a fixed dry bulb temperature of 60degF The cost was $025ft2 of floor area for a total cost of $5041
ECM 8 ndash High-Efficiency Equipment
HVAC efficiency was improved by using larger ducts and more efficient equipment Heating efficiency was raised from 80 to 90 at a cost of $100unit of heating capacity in kBtuhr per unit increase in efficiency Cooling efficiency was raised from an EER of 101 to 130 at a cost of $500unit of cooling capacity in kBtuhr per unit of improvement in EER The total cost of the mechanical equipment upgrades was therefore estimated to be $7006
Simulation of the Energy Use of the Sustainable Building
The sustainable building was characterized by incorporating the information developed in the NREL screening analysis with the base-case building characterization Figure B-17 lists the features incorporated in the sustainable building and Table B-5 shows the sustainable building characterization
The study developed construction and replacement cost estimates for the evaluated building energy features from several sources including vendors and facility engineering staff (through personal communication) vendor websites RS Means construction cost estimating books and case studies and reports Table B-6 summarizes the estimates and sources The estimates are shown as the net incremental cost change (increase or decrease) to the base-case construction cost
Results of the Energy Simulations
Energy Use and Energy Cost Estimates
Tables B-7 and B-8 show the energy use and energy cost by end use for both the base-case and the sustainable buildings The tables show energy use and cost with and without plug loads Although the model estimated energy consumption for plug loads and other miscellaneous office equipment these were not included in the analysis of the percent energy reductions that could be achieved using various energy efficiency technologies This is consistent with the practice within the Leadership in Energy and Environmental Design (LEEDtrade) Rating System
Lifecycle Cost Calculations
This study estimated the lifecycle cost or present value of the initial construction costs the outyear replacement costs and the annual energy costs over 25 years Most replacement costs were based on the service life values in Table 273 in Marshall and Petersen (1995) This study did not evaluate the costs of annual recurring maintenance the cost of nonrecurring or irregular repairs and maintenance or the cost impacts on the environment and occupants productivity
The lifecycle cost tool was an Excel spreadsheet workbook titled User-Friendly Building Life-Cycle Cost Analysis (MS Addison and Associates 2002) The developers say the workbook is compliant with National Institute of Standards and Technology Handbook lifecycle costing procedures and
B-15
offer the workbook free of charge at httpwwwdoe2com The study used the following key inputs for the lifecycle cost workbook
bull DOEFEMP fiscal year 2002 bull Real discount rate for this analysis 32 bull Number of analysis years 25 bull DOE fuel price escalation region 3 (south) bull Analysis sector 2 (commercial)
Table B-9 shows the lifecycle cost calculations for the base-case and the sustainable buildings
Lighting Measures bull Increased daylighting Skylights were added increasing daylight to the top floor bull Reduced lighting intensity Lighting power densities recommended by the Illuminating Engineering
Society of North America and ASHRAE as a proposed addenda to the 901 standard were adopted The lighting level was reduced from 40 to 35 footcandles in the office area with some increase in task lighting
bull Perimeter daylighting controls with dimmers Daylight sensors (six per floor) control stepped ballast controls so that electric lighting is dimmed when sufficient daylight exists In the base case no dimming of electric lighting occurs
Envelope Measures bull Window distribution The square footage of the windows was redistributed to optimize solar gain with
heating and cooling costs The optimized window-to-wall ratio is 15 window for the north wall 10 window for the east and west walls and 30 window for the south wall The base-case ratio is 20 for all walls
bull Additional wall insulation On the outside face of the exterior wall framing R-10 rigid insulation was added compared with only R-13 batt insulation in the base-case walls The resulting insulation in the sustainable building was R-23
bull Additional roof insulation The R-15 rigid insulation was increased to R-20 bull White roof A white roof finish material with low solar radiation absorptance of 030 was used
compared with the base cases absorptance of 070 bull Highly energy-efficient windows The sustainable option balances window performance with the low
lighting levels and the use of daylighting controls The result is a cost-optimized window with a U-factor of 031 and a shading coefficient of 039
Mechanical Systems bull High-efficiency air conditioner The air conditioning unit has an energy-efficiency ratio of 13
compared with 10 for the base case bull High-efficiency water heater A 90 thermal efficiency condensing water heater was used compared
with a commercial gas water heater with 80 thermal efficiency for the base case bull Low-pressure ducts The fan external static pressure was reduced from 10 inch water column to 05
inch water column by enlarging the duct sizes bull Economizers An integrated economizer including an outside air enthalpy sensor with a high-limit
enthalpy setpoint was used the setpoint was set at 25 Btulb in conjunction with a dry bulb temperature high limit of 74degF
Figure B-17 Features Included in the Sustainable Building
B-16
Table B-5 Characterization of Sustainable Building (includes base-case building comparison)
B-17
Characteristic ASHRAE 901-1999 Base Case Sustainable Building
General
Building type Office Same as in base case
Location Baltimore Maryland Same as in base case
Gross area 20164 Ft2 Same as in base case
Operation hours 8am - 5pm Monday-Friday Same as in base case
Utility Rates
Electric energy rate Base rate $1150month Same as in base case
Energy charge $0077kWh Same as in base case
Natural gas price ($therm) Base rate $270month Same as in base case
Energy charge $0692therm Same as in base case
Architectural features
Configurationshape
Aspect ratio 21 Same as in base case
Perimeter zone depth 15 ft Same as in base case
Number of floors 2 Same as in base case
Window area 20 window-to-wall ratio Redistribute windows to optimize solar gain north 15 south 30 and east and west 10 Net overall 18
Floor-to-ceiling height 9 ft Same as in base case
Floor-to-floor height 13 ft Same as in base case
Exterior walls
Wall type 4-in face brick faccedilade on 16-in on-center metal framing
See next item
Opaque wall U-value 0124 0055
Wall insulation R-13 cavity insulation Add R-10 rigid foam insulation under brick faccedilade
Roof
Roof type Builtup roofing with concrete deck See next item
Solar absorptance 07 (medium dark) 03 (white roof)
Characteristic ASHRAE 901-1999 Base Case Sustainable Building
Roof U-value 0063 0048
Roof insulation R-15 continuous insulation R-20 continuous insulation
Floor structure
Floor type Concrete Same as in base case
Floor insulation R-54 perimeter insulation Same as in base case
Fenestrationwindows
Window type Aluminum frames with thermal breaks and double panes
See next item
Total U-value 057 031
Shading coefficient 045 039
Visual transmittance 052 070
Window shadingoverhangs None Overhang was considered but not included because overhangs made little impact on energy efficiency and the construction cost was substantial
Building internal loads
Occupancy
Number of occupancy 96 Same as in base case
Occupancy schedule 8am - 5pm Monday-Friday Same as in base case
Lighting
Fixture type T-8 with electronic ballasts Same as in base case
Peak lighting power density 138 wattsft2 (net building wattage from ASHRAEs space by space analysis)
10 wattsft2 The density was recommended by the Illuminating Engineering Society of North America and ASHRAE as a proposed addenda to ASHRAEs 901 standard For this building the level was reduced from 40 to 35 foot candles in the office area
Lighting schedule 7am ndash 6pm Monday-Friday Same as in base case
Occupancy sensors None Same as in base case
Daylighting None Light sensors and dimmable fixtures the perimeter zones (15 feet in from the window walls) Skylights in second floor core with light sensors and dimmable fixtures
Office equipment
B-18
Characteristic ASHRAE 901-1999 Base Case Sustainable Building
Equipment schedule 7am ndash 6pm Monday-Friday Same as in base case
Peak load density 072 wattsft2 Same as in base case
HVAC system
HVAC system type Package rooftop constant air volume with gas furnace
Same as in base case
Number of HVAC units Five units to serve five HVAC thermal zones Same as in base case
Space temperature setpoint 75degF cooling70degF heating Same as in base case
Space setbacksetup 80degF cooling65degF heating Same as in base case
Cooling equipment efficiency 101 EER 130 EER
Outside air supply 20 cfmperson 17 of supply air cfm Same as in base case
Heating furnace efficiency 80 Same as in base case
Ventilation control mode Constant during occupied periods cycle during unoccupied periods
See next item
Economizer None Economizer in each rooftop unit with outside air enthalpyshybased controls
Design supply air Minimum 05 cfmft2 Same as in base case
Air-to-air energy recovery ventilation None Same as in base case
Fan total static pressure 20 in total 10 in related to ductwork system Increase duct size to reduced static pressure to 15 inches total (05 inches related to ductwork system)
Fan schedule 6am - 6pm Monday-Friday with night cycle onoff
Same as in base case
Fan motor efficiency 85 Same as in base case
Fan efficiency 65 Same as in base case
Servicedomesticpotable water heating
Hot water fuel type Natural gas Same as in base case
Thermal efficiency 80 90
Supply temperature 120 Same as in base case
Hot water consumption 09 gallons per minuteperson Same as in base case
Exceeds ASHRAE 901-1999
B-19
Table B-6 Costs of Technology Options and Data Sources
B-20
Alternate Feature or Technology Option
Construction Cost Impact on
Base Case Basis and Source of Cost Service Life of Alternate
Lighting
Reduce lighting power density ndash Level 1 wattsft2 to 10 wattsft2 (from 40 to 35 foot candles)
Reduce from 138 -$16970 Based on the wattsft2 (10 watt) and the costft2 ($232) needed to
meet the current Illuminating Engineering Society of North America handbooks lighting levels for the space types in the office building design (office lobby corridorsupport areas and kitchen) with T-8 fixtures electronic ballasts and compact fluorescent lamps) fixture choices remain the same as in ASHRAEs 901-1999 baseline
The
25 yr assumes light replacement costs are the same even though lower light levels reduce the number of fixtures and lamps that need to be replaced ndash and therefore reduces costs ndash over the life of the building
Add perimeter daylighting with dimming control
$11246 Based on $088ft2 for daylighting controls and fully dimming ballasts for all office space in a 15-ft depth from the building perimeter on both floors of the building The range of cost per ft2
was $023ft2 to $188ft2 ne daylight sensorcontroller was assumed per 600 ft2 of perimeter floor space or fully dimming ballasts were based on available costs in the Industrial Supply Lighting Catalog (WW Grainger 2000) with installation based on 2001 Means Electrical Cost Data
O Cost data f
Controller cost data
15 yr
Add skylights and daylighting $18219 18 skylights fixed double-glazed 44 in x 46 in $550 each (RS Controls yr15 controls to center core of building Means BCCD 08600-100-0130) effectively $3913ft2 Eighteen light
wells built up from suspended ceiling t-bar components controls and fixtures at $115ft2 of skylit core floor space $ft2 rate developed from manufacturers data indicating a range of $075 to $088ft2 plus 40 for labor
Dimmable Skylights yr25
Mechanical
Add high-efficiency air conditioning (increase EER from 10 to 13)
$5686 Base-case costs developed from distributors purchase cost data collected during analysis of unitary air conditioning equipment for DOEs EPAct standards program 2000-2002 ystem cost would then be $475ton of cooling and the alternate would be $510ton for an incremental cost of $40EERton to-contractor cost markup was assumed The sustainable design option (EER 13) was taken from DOEs Unitary Air Conditioner Technology Procurement website at httpwwwpnlgovuacproductsstm
Baseline s
A 25 distributorshy
25 yr for both the base case and sustainable building
Alternate Feature or Technology Option
Construction Cost Impact on
Base Case Basis and Source of Cost Service Life of Alternate
Add economizer with enthalpyshybased controls
$2700 Based on $540rooftop air-handling units (5 units total) based on materials from multiple manufacturers
15 yr assumes controls are the weak point
Enlarge duct sizes to reduce static air pressure at fans and therefore reduce fan and motor sizes
$7000 Based on ductwork at $1200ton for baseline pressure duct design (01 in H2O100-ft-length pressure drop) and $1400ton for a low-pressure design (005 in100-ft pressure drop) 120 lb of sheet metal per ton of air conditioning and $640lb for the duct plus insulation cost om RS Means Building Construction Cost Data
Assumes
Cost data fr
25 yr although the expected lifetime is 30 years the analysis has a 25-year time-frame so lifetimes past 25 years are not considered]
[Note
Envelope
Add 1-in (R-10) rigid foam board insulation behind brick faccedilade
$2946 Isocyanurate 4 x 8 sheets foil-faced both sides thick Rshy108
15-inshyRS Means 072-100-116-1650 $088
25 yr for both the base case and sustainable building
Decrease total U-value from 057 to 031 decrease shading coefficient from 045 to 039 and increase visual transmittance from 052 to 070
$5538 Cost of premium glazing is $25 ($22 to $28ft2) for item 08810 3004000 in RS Means (super-efficient glazing triple-glazed with low-e glass argon filled U=26) rd glass cost is $2250 for item 4600400 in RS Means (316 float 58 thick unit U=56) for a $250ft2 difference
Standa
25 yr for both the base case and sustainable building
Reallocate window distribution to optimize solar gains
-$3457 Based on $3724ft2 for windows and $1852 for wall Baseline window-to-wall ratio was 20 and the sustainable design case nets 18 increased $3418 Window cost decreased $6875 Wall cost
25 yr
Increase roof insulation from R-10 to R-20
$1916 Based on difference in Means construction costs between baseline of 3-in expanded polystyrene (R-1149 $082ft2) and 3-in polyisocyanurate (R-2174 $101ft2)
25 yr for both the base case and sustainable building
Replace roofing with a white roof system
$1553 Based on a 10 extra cost ($015ft2) for white over baseline roofing at $154ft2 Unit costs derived from RS Means Building Construction Cost Data (1999) line numbers 075-302 Manufacturers information indicates the additional cost may be higher possibly a multiple of 2
25 yr for both the base case and sustainable building
Other
Replace gas-fired service hot water heater (80 efficiency) with higher-efficiency unit (90 efficiency)
$1200 Based on review of cost information from multiple manufacturers vendors and web-based reports
25 yr for both the base case and sustainable building
B-21
Table B-7 Simulated Energy Use by End Use for the Base-Case and Sustainable Buildings
End Use Fuel Units Base-Case Building
Sustainable Building Change
Lighting Electricity kWh 79314 41518 -477
Space cooling Electricity kWh 23440 17082 -271
Space heat Natural gas Therms 2606 1854 -289
Other llA Million Btu 118 92 -224
Fans Electricity kWh 15207 10401 -316
Pumps and misc Electricity kWh 674 879 304
Hot water Natural gas Therms 642 534 -168
Total llA Million Btu 730 477 -346
Table B-8 Simulated Annual Energy Costs by End Use for the Base-Case and Sustainable Buildings
End Use Fuel Units Base-Case Building
Sustainable Building Change
Lighting ityElectric $Yr 6099 3193 -477
Space cooling Electricity $Yr 1803 1314 -271
Space heat Natural gas $Yr 1804 1284 -289
Other All $Yr 2128 1699 -201
Fans Electricity $Yr 1169 800 -316
Pumps and misc Electricity $Yr 52 68 304
Hot water Natural gas $Yr 445 370 -168
Base energy charges All $Yr 462 462 00
Total All $Yr 11834 7489 -367
B-22
-
Table B-9 Lifecycle Cost Calculations for the Base-Case and Sustainable Buildings
Difference Base-Case Sustainable (Sustainable
Units Building Building Base) Difference Comments
$ $2400000 $2437578 $37578 16
$ $2400000 $2449565 $49565 21 Present value investment cost differs from first cost in the sustainable building because of replacement costs for lighting controls and economizers which are assumed to have a 15shyyear life
$YrAnnual electricity cost $9123 $5374 ($3749) -411
$YrAnnual natural gas $2249cost $1653 ($595) -265
$YrAnnual fixed costs $462 $462 $0 00 Represents fixed energy connection charges
$YrTotal annual energy $11834cost $7489 ($4345) -367
Present value of energy costs
Present value (electricity cost) $ $151985 $89525 ($62461) -411
Present value (natural gas cost) $ $39022 $28690 ($10332) -265
Present value (fixed $ included Not Not included in Not Not Fixed charges not included in the lifecycle cost energy costs) in the lifecycle the lifecycle cost applicable applicable calculation Because they are not impacted by
cost the sustainable design options they have no impact on the cost-effectiveness calculations
Present value (total energy cost) $ $191007 $118214 ($72793) -381
Lifecycle cost $ $2591007 $2567780 ($23228) -09
Cost Element
Investment cost
Total first cost
Present value (investment cost)
Annual energy costs
B-23
ENERGY-10 and DOE-21E
While ENERGY-10 was designed for use with small buildings (ie 10000 ft2 or less in floor area) its ability to quickly assess the energy-use and lifecycle cost impact of design changes was used even with this studys larger 20000-ft2 building The same features that make ENERGY-10 quick and easy to use also limit its flexibility and the base-case building in DOE-21E and ENERGY-10 exhibited some differences in cooling load and fan power
The two models handle fundamental building characteristics in significantly different ways including the limited equipment choices in ENERGY-10 and the fact that ENERGY-10 only models one or two zones While a single zone may be appropriate for small buildings such as houses and small retail buildings larger buildings may have substantial variation in thermal loads across the building requiring some way to provide for individually served thermal zones In addition ENERGY-10rsquos feature to automatically set up daylighting zones places the daylight sensor in the center of the zone which in this case is close to a window and therefore overestimates daylighting savings
ENERGY-10 provides for a very simplified user entry using its autobuild procedure to create a very basic shoe box building model however the desire to match the prototype building led the team to specify a building description that closely matched the characteristics of the ASHRAE 901-1999 compliant base-case building modeled in DOE-21E
In developing the specific features of the base-case building in ENERGY-10 careful attention was paid to the fundamental building characteristics so that they would be the same in the base-case ENERGY-10 and DOE-21E models Less attention was focused on the final building energy use or EUI (kBtuft2yr) However there were limits to how well the fundamental descriptions for infiltration cooling equipment efficiency and the presence of a building return air plenum could be matched between the ENERGY-10 and the DOE-21E base-case buildings In the end the base-case building simulations in the DOE-21E and ENERGY-10 models resulted in the buildings having very similar overall site energy consumption (within 1 of each other) and very similar scheduled energy use (lighting and plug and hot water loads total within 2 of each other) However the ENERGY-10 base-case simulations showed higher cooling and fan energy consumption and lower heating energy use consumption than in the DOE-21E simulations This may be explained by the known differences in implementation discussed above the remaining difference may be attributable to the different underlying simulation engines Note that ENERGY-10 calculates very different estimates of cost effectiveness measures for the energy-efficiency options with an overall return on investment of 11 The differences remain an area of study
Table B-10 shows the ENERGY-10 description of the base-case building and of a low-energy version (ie sustainable design) of that base-case building The low-energy building was developed by selecting from among the potential sustainable design options
Table B-11 shows the results of the ENERGY-10 simulations of the base-case and sustainable buildings Table B-12 shows the estimated cost impacts of the sustainable design options from ENERGY-10 These cost estimates were used to generate the lifecycle cost analysis used in the screening effort but these are not the costs used in the final simulation of the sustainable building in DOE-21E See Section B4 for documentation of the final simulation of the sustainable building
B-24
Table B-10 Summary of Base-Case and Sustainable Buildings
Description Base-Case Building Sustainable building
Building characteristics
Weather file Baltimore Baltimore
Floor area (ftsup2) 20164 20164
Surface area (ftsup2) 31240 31240
Volume (ftsup3) 262132 262132
Total conduction loss coefficient (Btuhr-ordmF) 3276 1556
Average U-value (Btuhr-ft2-oF) 0105 0050
Wall construction Buscase 6 R=89 Steelstud 6 poly R=181
Roof construction Buscase R=159 Flat R=380
Floor type insulation Slab on grade Reff=676 Slab on grade Reff=1183
Window construction Buscase U=067 Btuhr-ft2-oF
4060 low-E aluminumthermobreak U=031 Btuhr-ft2-oF
Window shading None 3 ft overhangs on east south and west windows
Wall total gross area (ftsup2) 11076 11076
Roof total gross area (ftsup2) 10082 10082
Ground total gross area (ftsup2) 10082 10082
Window total gross area (ftsup2) 2208 2280
Windows (northeastsouthwestroof) 232323230 23746712
Glazing name Buscase U=056 Double low-E U=026
Operating parameters
HVAC System Direct expansion cooling with gas furnace
Direct expansion cooling with gas furnace
Rated output (heatsensible cooltotal cool) (kBtuh) 288315420 206256341
Rated air flowminimum outside air (cfm) 125971585 95271585
Heating thermostat 700degF set back to 650degF 700degF set back to 650degF
Cooling thermostat 750degF set up to 800degF 750degF set up to 800degF
Heatcool performance Efficiency=80 EER=101 Efficiency=90 EER=130
Economizertype Nonot applicable Yesfixed dry bulb 600degF
Duct leaksconduction losses (total ) 20 20
Peak gains internal lights external lights hot water other wattftsup2 138000020072 103000020072
Added mass None None
Daylighting No Yes continuous dimming
Infiltration (insup2) Air changes per hour (ACH)=01 ACH=01
B-25
Table B-11 Annual Energy Use Cost and Emissions from ENERGY-10
Base-Case Building Sustainable Building
Simulation dates Jan 1 to Dec 31 Jan 1 to Dec 31
Energy use (kBtu) 904917 495861
Energy cost ($) 16058 9208
Saved by daylighting (kWh) minus 25011
Total electric (kWh) 183542 108238
Internal lights (kWh) 78793 33793
Coolingfan (kWh) 3524217106 190662977
Other (kWh) 52402 52402
Peak electric (kW) 838 506
Fuel (hot waterheattotal) (kBtu) 62791215826278617 6279163730126520
Emissions (CO2SO2NOx) (lb) 2795851481789 160414869460
Construction costs 3146828 3195257
Lifecycle cost 3815530 3668552
Table B-12 Cost of Modeled Energy Conservation Measures From ENERGY-10
Daylighting Cost
Daylighting 13371
Glazing (windows) 4980
Shading 13359
Energy-efficient lights 7259
Insulation 18868
Passive solar heating -5400
Economizer 5041
High-efficiency HVAC 7006
Total 66500
Total after HVAC downsizing 59494
B-26
Appendix C A Sustainable Design Cost Study for the Johnson City Customer Service Center Tennessee Valley Authority (TVA)1
This appendix describes an exercise undertaken by David Zimmerman of TVA to estimate the costs of adding sustainable design features to a building in the design phase
Project Description
The proposed TVA Johnson City Customer Service Center (CSC) is a 24171-ft2 district office (see Figure C-1) The building design contains offices for employees a large meeting room for TVA and community use (13054 ft2) support spaces (restrooms showers break room storage instrument room and power crew room ndash 6187 ft2) and an enclosed heated vehicle bay (4930 ft2)
Figure C-1 Floor Plan of Johnson City CSC
Approach to Sustainable Design
The goal of the building design is to incorporate a wide range of cost-effective sustainableenergy technologies to demonstrate to TVArsquos customers its environmental commitment and to save energy and operations and maintenance (OampM) costs The analysis described below is part of the initial design process The process is similar to the approach described in Section 22 of this document for the prototypical building The standard approach to efficient building design is to establish a base-case computer model of the building The base case represents the building design without special attention to energy efficiency or sustainability Then various energy and sustainable technologies are added one at a time to see their impact on the base design The cost and savings are determined and those features found to have acceptable performance can be combined into final computer simulations to determine overall impact on the building design
The Johnson City CSC project like past TVA projects underwent extensive planning and design prior to construction Typically every major new construction project undergoes an analysis similar to the one described below for Johnson City CSC
1 This appendix was written by D Zimmerman TVA
C-1
Sustainable Features
The following technologies were examined for the sustainable version of the Johnson City CSC
bull Decentralized geothermal heat pump HVAC system The building is heated and cooled using water to air heat pumps connected to a closed loop geothermal well system To further reduce energy use individual heat pumps units that use smaller pumps were connected to individual earth-coupled wells (instead of using one large well field and pump) This geothermal system cost more than a typical air-to-air heat pump but the estimates show it pays for itself in 69 years as a result of energy and maintenance savings
bull Light tube daylighting The building central circulation corridor private offices and meeting rooms are located in the interior of the building far from exterior windows To provide natural light to these spaces 30 circular skylights that are 13 in in diameter were connected to circular tubes lined with reflective material These tubes pipe light to these interior areas The light tubes along with the switched control system to turn off electric lights when enough daylight was present have an 83-year payback
bull North clerestory daylighting to provide 50 footcandles The building design has a large open office area Windows located on the south wall of this area provide daylight to a 15-6 depth but cannot daylight the remaining 26-6 Therefore the roof was sloped upward and a six-footshyhigh continuous north facing clerestory was installed to daylight the rest of this area (see Figure C-2) Carefully sized overhangs and fins prevent direct-beam sunlight from entering the space Continuous-dimming directindirect electric lighting systems were installed to maintain 50 footcandles over the whole space The extra windows (those needed beyond what would have been installed in a conventional building) dimmable electronic light ballasts a control system and light shelves were extra cost items attributed to the daylighting system and included in the incremental cost estimate The analysis showed a payback of 65 years
bull North clerestory daylighting to provide 15 footcandles of ambient light with additional task lights This energy-saving option is the same as the option above except fewer electric lights were installed and the control system was set to maintain a minimum light level of 15 footcandles Task lights were added to each of the workstations This energy-saving option has an even faster payback ndash 14 years
bull Garage daylighting This energy-saving option involved adding north- and south-facing glazing to the vehicle bay to provide daylighting The south-facing glazing also provides some passive solar heating The cost of fiberglass glazing in place of metal panels and a control system to switch off the electric lights were included in the cost analysis The payback was 55 years
bull Light-colored roof (changing the absorptance 091 [dark] to 03 [white]) Changing the metal roof from dark blue to white produced minimum savings The base-case building uses a standard metal building roof system that calls for R-30 batts of insulation attached to the underside of the metal roof This high level of insulation minimized the savings from this option so the roof color has been left to the discretion of the architect
In addition to the energy-saving options above a wide range of additional technologies was investigated for incorporation into the design Most of these can be classified as sustainable and are as follows
bull Membrane energy recovery heat exchanger This is a relatively new technology that involves transferring heat and moisture between incoming ventilation air and outgoing exhaust air using a thin membrane The manufacturer had a prototype unit and wanted to install it and monitor performance If successful such a unit could pay for itself in energy savings in 3 to 4 years
C-2
OPEN OFFICE CORRIDOR ENCLOSED OFFICE
MEETING MEETING ROOM
Figure C-2 Typical Section of Johnson City CSC Showing Clerestory Windows
bull Using ultraviolet (UV) light to treat HVAC supply air This technology involves passing HVAC supply air through ductwork lined with UV light tubes UV light is very effective at killing bacteria Such a system would not have an easily quantified savings It uses additional electricity to operate but could have a payback based on employee wellness (less absenteeism)
bull Metal roof vs asphalt roof Typical roofs on small commercial buildings are either built-up asphalt or asphalt-based shingles A heavy-gage standing-seam metal roof can have substantially longer life compared with asphalt and is easily recycled making it a more sustainable choice Analysis showed that the extra cost of a metal roof would pay for itself in 66 years so it was included in the design
bull Permeable pavement Permeable pavement allows water to drain through to the ground below Such pavement prevents water runoff and erosion New forms of permeable asphalt pavement were found to be almost identical in cost to standard asphalt pavement Permeable pavement also reduces the need for storm water catchment structures and storage making permeable pavement an instant payback
bull Rain water collection for irrigation and vehicle washing This sustainable option involved collecting rainwater off the roof and storing it for use in a 7500-gallon aboveground tank The water would be used for washing vehicles and irrigating landscaping This option was estimated to have a 94 ndashyear payback
bull Climate appropriate plants Research showed that climate-appropriate plants for TVArsquos climate in most cases cost no more than imported plants Climate-appropriate plants were included in the design
bull Autoclaved concrete block Autoclaved concrete block covered with a manufacturer-approved exterior stucco material was included in the design This sustainable material contains recycled-content (fly ash) and has excellent insulation qualities The cost of this block was found to be equal to standard concrete block with the addition of rigid insulation resulting in no extra cost
bull Waterless urinals compared with standard urinals Waterless urinals were found to cost less to install and maintain than standard urinals They are fiberglass units with a vapor trap that contains a liquid that allows urine to pass through They do not require a water supply line flush valves etc resulting in substantial water and maintenance savings
bull High-velocity electric hand dryers ndash Excel Xleratorreg compared with paper towels The Excel Corporation markets a hand dryer that it claims can dry hands in 10 to 12 seconds compared with standard dryers which can take up to 30 seconds Two of these hand dryers were added to the design and if fully used they will reduce the use of paper towels The projected payback for the dryers cost is 16 years compared with paper towel use and disposal
C-3
bull Sustainable (healthy) interior finishes Low volatile organic compound (VOC) paints and finishes along with materials with recycled content and the ability to be recycled have been gradually introduced into TVA renovation and new construction work and were included in the CSC design
Some options were considered but not included in the design
bull Operable windows for ventilation This option was briefly considered and rejected because of the high humidity levels and very hot summers The installation of a very efficient HVAC system (geothermal heat pump) further reduces the potential of this option to save money and provide comfortable indoor conditions
bull Wind electric generation This energy option was not included because the current building site does not have the necessary wind levels
bull Photovoltaic roof canopy Replacing the covered parking canopy with a canopy made up of photovoltaic cells was found to be very costly and to have a very long payback period
In addition to the above sustainable technologies a decision had already been made to incorporate the following sustainable technologies so they were included in the base-case cost
bull Raised access floor to provide flexibility in changing the spaces and to provide underfloor HVAC with individual work station air controls
bull Movable walls to construct interior private offices and meeting rooms to minimize the use of drywall and provide easy changes to the space in the future
Financial Considerations
Figure C-3 (at the end of the appendix) shows the calculated incremental first costs and annual cost savings (with payback periods) In addition to the individual technologies described above the analysis included a number of combinations of technologies
bull Total building daylighting (north clerestory ndash 50 footcandles) This is a combination of light tube daylighting garage daylighting and open office north clerestory daylighting to 50 footcandles This combination yielded a payback of 75 years
bull Total building daylighting (north clerestory ndash 15 footcandles) This is the same as the option above except the open office area is lit to only 15 footcandles and task lights are installed in each of the workstations This combination yielded a payback of 50 years
bull Total building daylighting (50 footcandles) plus geothermal heat pump This is a combination of total building daylighting (north clerestory ndash 50 footcandles) and the geothermal heat pump HVAC system This combination yielded a payback of 69 years
bull Total building daylighting (15 footcandles) plus geothermal heat pump This is the same as the option above (daylighting combined with geothermal heat pump) except the open office area is being lit to only 15 footcandles and task lights are installed in each of the workstations This combination yielded a payback of 57 years The significance of this combination is that overall energy use of the building design was reduced by almost 50
The energy cost savings of the energy-saving options (daylighting and geothermal heat pump system) were determined by creating an energy model of the building using the PowerDOE building energy analysis program (Version 118g by James J Hirsch amp Associates) which uses DOE-21 as the principal underlying model (see Section 31 and Appendix B for description of how DOE -21 was applied in this study) This program takes into account all the heat lossgain through the various
C-4
building surfaces and the amount of internal energy use and heat gain from lights people and equipment and models the HVAC system to maintain set indoor conditions The program performs an hour-by-hour simulation of the building design and outputs a wide range of reports including yearly energy cost based on utility rate structure
The costs of the various energy-saving options were determined using several approaches The geothermal heat pump system size and cost were determined by a TVA engineer experienced in designing such systems for TVA customers The cost of daylighting components were determined from RS Mean Building Construction Cost Data ndash 2002 (RS Means 2002) along with some actual numbers from specific manufacturers
Key Conclusions for the Business Case
Many cost-effective sustainable design options exist Energy reduction of 50 from the base case design with a payback period of 57 years was projected for this building by adding many daylighting features very low light levels and a geothermal heat pump Lighting options can be very cost-effective because they tend to lower first costs
C-5
Figure C-3 Analysis of Sustainable Features for Johnson City CSC
C-6
How to Read Figure C-3
The Johnson City Customer Service Center High Performance Design Options bar chart is divided into three sections The solid bars at the top show actual energy performance of existing customer service center buildings along with the Chattanooga Office Complex which is one of TVArsquos most energy-efficient office buildings These solid bars provide a reference to which to compare the Johnson City CSC design (The units are Btuft2yr)
The multicolored bars show the performance of the base Johnson City CSC design as well as the individual technologies considered and the combinations of energy-saving options Each color shows the amount of energy going to the various component energy uses within the building such has lighting equipment heating etc (shown at the bottom of the chart) All the energy-use bars are in units of Btuft2year which makes it easy to not only compare to the solid reference bars but to other non-TVA buildings
Data for technologies listed below the bars are primarily sustainable technologies that donrsquot have energy savings but have other types of cost savings (or in some cases have no additional costs compared with standard technologies) Those showing less than a 10-year payback an instant payback or low costs have been recommended for incorporation into the design
C-7
Appendix D Documentation of the Sustainable Siting and Water-Savings Features Included in the Prototype Building Analysis1
This appendix documents the calculations used to estimate costs and cost savings associated with siting and water-efficiency technologies and materials described in Section 23 and 24 water-efficiency features (Section D1) stormwater management (Section D2) and landscape management (Section D3)
Water-Efficiency Features
Domestic Water Technology Selection
Typical domestic fixtures that are found in an office building are faucets toilets urinals and showerheads For the prototype building highly efficient fixtures were selected to exceed the minimum flow rate standards set by the Energy Policy Act (EPAct) of 1992 The following summarizes the advanced technologies that were selected (also see Table D-1)
bull Showerheads EPAct mandates that showerheads not exceed 25 gallons per minute (gpm) at a pressure of 80 pounds per square inch (psi) or less Typical building pressure is between 40 and 80 psi To exceed this standard a showerhead of 20 gpm was chosen More efficient showerheads are available but the quality of the shower can be greatly diminished with less than 20 gpm
bull Faucets EPAct sets standards that kitchen faucets cannot exceed 25 gpm at 80 psi and restroom faucets cannot exceed 22 gpm at 80 psi For both the kitchen and restroom faucets a 10 gpm model was chosen for the prototype building
bull Toilets EPAct guidelines mandate that all toilets not exceed 16 gallons per flush (gpf) Two advanced technologies were analyzed for the prototype building a dual-flush toilet and a 11shygpf model A dual-flush toilet has two flushing options ndash liquid flushing at 08 gpf and solid flushing at 16 gpf An analysis of the two toilets proved the dual-flush toilet to be the most economical option The 11-gpf toilet is an emerging technology with a very high initial cost ndash the simple payback was calculated to be up to 30 years The dual-flush toilet was only analyzed for the womens restrooms It was assumed that when men use toilets (in combination with urinals) the 16-gpf option would always be used therefore no water savings would occur from the dual-flush toilet in the mens restrooms
bull Urinals EPAct requires that all urinals not exceed 10 gpf A no-water urinal was chosen for the advanced technology for this study No-water urinals have a lower installation cost because no water supply line is necessary Therefore installing a no-water urinal is less expensive than the low-flush model
Incremental Costs and Annual Water Savings
For indoor domestic water technology the incremental capital and installation costs annual water consumption and cost savings and the simple payback were estimated For each domestic fixture found in typical office buildings (faucets toilets urinals and showerheads) a more advanced fixture was chosen that exceeded the minimum flow rate standards set by the EPAct and that kept quality as a parameter Maintenance costs were considered when analyzing urinals because of differing costs for standard urinals compared with no-water urinals
1 Prepared by K McMordie-Stoughton and G Sullivan Pacific Northwest National Laboratory
D-1
Table D-1 Domestic Water Technology Overview
Equipment Standard Equipment
(set by EPAct) Advanced Equipment
Showerheads 25 gpm 20 gpm
Faucets 25 gpm ndash kitchen 22 gpm ndash restroom
10 gpm (both kitchen and restroom)
Toilets 16 gpf Dual flush 8 and 16 gpf options0
Urinals 10 gpf 0 gpf
When annual water cost savings were calculated for each fixture type water rates were broken by low high and average based on fiscal year 1999 water rates from General Services Administration (GSA)2 Each fixtures water use was calculated by using the standard use frequency for each fixture type for the prototype building The total water reduction for indoor domestic water using equipment was over 47 Note that the energy cost savings from hot water savings were not calculated or included All assumption and data sources used to calculate these values are detailed in Table D-2
Stormwater Management
The goals of sustainable stormwater management are to maintain stormwater on site as long as possible to reduce runoff volume to reuse the stormwater and to ensure that it is clean before returning it to the natural system which reduces nonpoint source pollution and sedimentation in natural water ways For this analysis an integrative stormwater management system comprised of a gravel-paved parking lot and underground rainstorm system was examined3
This porous gravel-paved parking area is a heavy load-bearing structure that is filled with porous gravel allowing stormwater to infiltrate the porous pavement and to be moved into a rainwater collection system This system will greatly reduce runoff and retain rainwater on site for landscape irrigation by contrast a conventional asphalt parking area would cause all stormwater to run off the site increasing pollutant concentrations and eliminating the possibility of reusing the water The porous gravel system was selected for several reasons
bull As an integrative system it achieves the goals of maintaining and using stormwater on site bull The materials are partly made from recycled material bull Cost and maintenance data are reliable bull It meets the Environmental Protection Agencys National Pollutant Discharge Elimination
System (NPDES) Phase II requirements which expand the existing NPDES to require a storm water management program for all new construction including runoff control and post-construction stormwater management (For more information see httpwwwepagovfedrgstrEPA-WATER1999DecemberDay-08w29181ahtm)
2 Personal Communications with A Walker of General Services Administration February 13 2001 3 Invisible Structures Inc provided an integrative stormwater management system from Gravelpave and Rainstore products
D-2
Table D-2 Assumptions and Data Sources
Assumptions Data Data Source
Number of working days per year 235 Based on 10 holiday days and 15 vacation days
Occupancy 97 Standard for prototype building
Distribution of women and men 5050
Restroom uses Standard usage
Womens
Toilet usedayperson 3
Mens
Toilet usedayperson 1
Urinals usedayperson 2
Faucets 3
Faucet duration 30 sec
Shower useday 1
Shower duration 7 min
No of fixtures in prototype building Uniform Building Code (1997) and Dziegielewski et al (2000)
Restrooms 4
Toilets 8 4 in womens bathrooms and 4 in mens
Urinals 3
Faucets 8
Kitchen faucets 1
Showers 2
Water rates - $1000 gallons GSA Fiscal Year 1999
GSA Region 3 average (Baltimore is in Region 3)
$397
Costs for fixtures (per unit)
Showerheads
Standard $400 GSAs Federal Supply Service provided through website httpswwwgsaadvantagegov
Advanced $899 Catalog supplied by Niagara Conservation Company Cedar Knolls New Jersey 2002
Faucets
Standard $340 GSAs Federal Supply Service provided through website httpswwwgsaadvantagegov
Advanced $927 GSAs Federal Supply Service provided through website httpswwwgsaadvantagegov
Toilets
Standard $15000 GSAs Federal Supply Service
Advanced $20000 Dual-flush toilet from Caroma personal communication with representative of USA Caroma Inc May 2002
Urinals
Standard $21678 GSAs Federal Supply Service provided through website httpswwwgsaadvantagegov
D-3
Assumptions Data Data Source
Advanced $12760 GSAs Federal Supply Service provided through website httpswwwgsaadvantagegov
Installation costs for urinals Personal communication with Waterless urinal and Falcon Water Free Company May 2002
Standard $20000 (Total cost for installation of unit and water supply line)
Advanced $10000 (No water supply line needed)
Annual maintenance costs for urinals Based on information provided through personal communication with D Zimmerman Tennessee Valley Authority regarding Johnson City Customer Service Center (see Appendix C)
Standard urinal $11900
Blue seal fluid $1485
Eco-trap $1144
Savings for dual flush toilets 33 Based on one 16 gpfday and two 08 gpfdaywoman
Supply and distribution ndash typical 3
Wastewater treatment ndash activated sludge 17
Assumptions and Data Sources
To estimate the costs and annual savings associated with an integrative stormwater management system detailed assumptions were made based on available data sources which are described in the following sections
Parking Area
For the parking area the porous gravel-paved lot was compared with a traditional asphalt parking area The assumptions and data sources for the comparative analysis are as follows
bull Parking lot surface area assumptions ࠃ The total lot size is 1 acre ndash A review of the zoning ordinances including those in the
Baltimore area led to this size assumption ࠃ The parking lot area will require 50 to 75 parking spaces ࠃ The parking lot dimensions are assumed to be 140 ft by 180 ft giving a total area of
25200 ft2
bull Installation costs for the porous gravel-paved and asphalt parking lot came directly from communications from the products manufacturer4
ࠃ Gravel-paved ndash $230ft2
ࠃ Asphalt ndash $211ft2
bull Maintenance costs were obtained from a University of South Alabama study (1999) which shows a comparison of maintenance costs between an asphalt parking lot and porous gravel and grass-paved system ࠃ Gravelgrass paved parking area ndash $0296yd2yr ࠃ Asphalt parking area ndash $0497yd2yr
4 Direct communications with D Glist of Invisible Structures Inc on June 28 2002 provided estimated costs for Gravelpave product and conventional asphalt-paved surface
D-4
This study examined the historical records of the University of South Alabama Grounds Department asphalt maintenance from 1993 to 1998 and compared those records with the maintenance costs for a porous gravel and grass-paved system that was installed on campus For the asphalt parking lots maintenance costs included coating paint striping patching and crack filling and resurfacing For the grassgravel-paved parking area maintenance included regular landscaping requirements of the grass and periodic raking and topdressing of the gravel5 A 20-year life span was assumed for both surfaces
Rainwater Collection System
An integrated rain storage system Rainstore was compared with a conventional corrugated plastic pipe system The conventional system simply moves the stormwater off the asphalt parking lot but does not include the opportunity to reuse the stormwater for irrigation The assumptions and data sources for the comparative analysis are as follows Both the Rainstore and corrugated pipe systems were sized for the site using Rainstore Materials Estimator an online tool6 that allows the user to input the site characteristics and stormwater storage needs to estimate the amount of materials required for a Rainstore system Optional designs such as the corrugated pipe system can also be evaluated
Installation costs associated with the Rainstore system were obtained from a quote 7 from a Northeast product dealer based on the materials that were estimated in the Rainstore Materials Estimator The Rainstore manufacturer provided costs for additional materials and fees
bull Rainstore modular units ndash $356387
bull Geogrid and geotextile ndash $25197
bull Pump for feeding rainwater to irrigation system ndash $3007
bull Freight for shipping Rainstore system ndash $75007
Installation costs for the corrugated pipe system were provided by the product manufacturer7 and were based on the materials that were estimated in the Rainstore Material Estimator
bull Corrugated pipe ndash $373107
bull Other materials and services required ndash $211547
Labor costs for both the Rainstore system and corrugated plastic pipe were as follows
bull Labor cost ndash $70hr7
bull Total labor required for Rainstore ndash an estimated 45 hours (from the Rainstore Estimator tool) bull Total labor required for the corrugated pipe system ndash assumed to be 5 additional for extra
welding of elbows and tees into the system that the Rainstore system does not require8
5 Because the system examined in this analysis did not include a grass-paved system the maintenance costs comparison can be assumed to be conservative6 The website for the online tool is available at httpwwwinvisiblestructurescomRS3RS3_Est_Instructhtm 7 ACF Environmental ndash a distributor in the Northeastern US for Rainstore products ndash quotation for Rainstore Stormwater Storage System July 29 2002 8 Direct communications with C Spelic of Invisible Structures Inc on July 31 2002 provided estimated costs for labor freight and other associated costs with the Rainstore system and for a corrugated pipe systems based on material prices for piped system
D-5
Incremental Costs and Annual Savings Calculations
Tables D-3 through D-5 summarize the calculations that estimated the incremental cost for the sustainable stormwater management system Table D-3 itemizes all individual costs and fees and shows how the total cost was calculated for each system (summation of the cost column in Table D-3) The total cost for the conventional corrugated pipe system was subtracted from the Rainstore system to calculate the incremental installation cost as shown on the last row of Table D-3
Table D-4 lists the installation and maintenance costs for the porous gravel parking area compared with the asphalt parking area The installation cost per square foot was multiplied by the total area of the parking area which is 25200 ft2 to calculate the total installation cost To determine the incremental installation cost the cost of the asphalt parking lot was subtracted from the gravel-paved lot The incremental maintenance cost was determined in the same manner as shown in Table D-4
In Table D-5 the total incremental cost for the entire system was calculated by combining the costs for the parking area and rainwater collection system for both the sustainable design and conventional design ndash as shown in the rows labeled ldquoTotalrdquo in Table D-5 The incremental cost was then calculated by subtracting the two total costs The simple payback of 559 years can be calculated by dividing the incremental installation cost by the total maintenance savings
Landscape Management Overview and Assumptions9
Sustainable landscaping practices combine sound maintenance practices with a design that uses native plants Conventional landscaping usually is comprised of turf such as Kentucky blue grass which requires an irrigation system to provide supplemental water high maintenance to provide regular mowing chemical herbicide application to reduce weeds and fertilizer to maintain a healthy lawn in most regions of the United States Planting native species greatly reduces the need for supplemental watering and regular maintenance Native species will withstand the conditions of the area so native plants can survive in both abnormally wet and dry conditions whereas nonshynative plants do not adapt as well to extreme conditions Also with sustainable designed landscape rainwater can be harvested to serve as supplemental irrigation Specific plants can be selected to help clean rainwaters impurities such as oil from automobiles and salts from roadways to return filtered water to the groundwater or stormwater system
The following design assumptions summarize the specifics of the landscaping area analysis of the site (more details on these features are covered in the next section)
bull Landscaping area ndash 8000 ft2
bull Landscape design ndash Native seed mixture combination of native warm weather turf and wildflowers create a natural meadow area
bull Irrigation system ndash Spot and periodic watering are required to establish the native plants All of the the irrigation water required to establish the native landscaping will be harvested from the rainwater held in the stormwater management system
bull Landscape maintenance ndash The sustainable landscaping area requires very little maintenance while the traditional turf landscaping requires regular maintenance and chemical treatment
9 K McMordie Pacific Northwest National Laboratory
D-6
Table D-3 Installation Costs for Rainwater Storage and Conventional Stormwater Management Systems
Type Material Amount Units Unit Cost Cost
Rainstore system Rainstore modular units 2232 units $1597 $3563838
Geotextile 1378 yd2 $055 $76000
Geogrid 459 yd2 $383 $175904
Pump for irrigation feed $30000
Excavation 569 yd3 14 $796600
Backfill 226 yd3 $1200 $271200
Area needed 1001 ft2 NA
No cost associated with area
Cover 51 yd3 $1200 $61200
Freight 3 truck loads $250000 $750000
Labor 45 hours $7000 $315000
Total $6039742
Conventional system
Corrugated 48 plastic pipe 533 linear ft $7000 $3731000
Tees 8 each $90000 $720000
Elbows 4 each $70000 $280000
Excavation 543 yd3 14 $760200
Backfill 197 yd3 $1200 $236400
Area needed 2665 ft2 NA
No cost associated with area
Cover 99 yd3 $1200 $118800
Freight NA No freight
needed No freight
needed No freight
needed
Labor 475 hours $7000 $332500
Total $6178900
Incremental installation cost (Rainwater minus conventional) -$139158
NA ndash Not applicable
D-7
Table D-4 Installation and Maintenance Costs of Porous Gravel Parking Area and Conventional Asphalt Parking Area
Installation CostFt2
Total Installation
Cost
Maintenance Costs
($ft2yr)
Total Maintenance
CostsYr
Gravel-paved parking lot $230 $57960 $00329 $82880
Asphalt parking lot $212 $53424 $00552 $139160
Incremental cost (gravel minus asphalt) $4536 -$56280
Table D-5 Total Stormwater Installation Maintenance and Incremental Costs
Total Stormwater Costs
Total Installation
Cost ($)
Total Installation
Cost ($Kft2)
Maintenance Cost ($yr)
Total Annual Maintenance
Cost ($Kft2-yr)
Sustainable system Rainstore $60397 Gravel paved $57960 Total $118357 $5918 $829 $41
Conventional system Corrugated pipe system $61789 Asphalt-paved parking area $53424 Total $115213 $5761 $1392 $70
Incremental cost (sustainable minus conventional) $3144 $157 -$563 -$28
Assumptions and Data Sources
To estimate the installation costs and annual savings associate with landscaping at the site the following assumptions and data sources were used in the analysis
bull Landscape area ࠃ Total lot size is 1 acre ndash A review of zoning ordinances including those in the Baltimore
area led to this assumption ࠃ The parking area ndash A total of 25200 ft2 based on 50 to 75 parking spaces ࠃ Footprint of the building ndash 10082 ft2 ࠃ Landscaping area ndash 8000 ft2 (with the remaining area of 278 ft2 for sidewalks)
bull Landscape materials and installation cost10
ࠃ $20000acre for native planting of seed mixture ࠃ $6667acre for traditional turf (one-third the cost of native seed mixture)
bull Irrigation system ndashNormally no irrigation system would be installed for a native landscape but because this landscape will be irrigated from rainwater in an underground storage system a pump (costs for the pump was included in the stormwater management analysis) is required to
10 Input on the design and installation costs for native plant and traditional turf material was provided by G Gardner of Davis Gardner Gannon Pope Architecture in Philadelphia Pennsylvania This firm has been involved in two Leadership in Energy and Environmental Design (LEEDtrade) projects in the northeastern United States and is knowledgeable about the real costs associated with native plant species compared with traditional turf for the northeastern United States
D-8
pump the water from the underground storage and an irrigation system is required to provide a means to deliver the rainwater to the landscaping This system is the same size required for a conventially-landscaped area therefore there is no incremental cost for the irrigation system
bull Maintenance services and costs11
ࠃ Annual maintenance for the traditional turf area will require 6 applications of fertilizer and herbicides per year 26 mowing and maintenance trips and 1aeration
ࠃ The annual maintenance fee for the sustainable landscape is assumed to be 10 of that of the traditional landscape While sustainable landscaping will not require routine maintenance such as mowing and fertilizing it is not maintenance-free Based on a review of the literature in this area a traditional turf landscape area is estimated to require 10 days of maintenance whereas a sustainable design will only require 1 day The watering schedule for traditional turf landscaping is assumed to be 1 in of water over the entire area at 30 applications per year
ࠃ The average FY 1999 GSA water rate for Region 3 (Baltimore is in GSA Region 3) was used to estimate the cost of irrigation for traditional turf area $3971000 gallons
ࠃ No water costs are associated with the native landscaping because all supplemental water will be supplied from the rainwater collection system
ࠃ Annual maintenance service fees for traditional turf landscape are assumed to be $2754 (a combination of all services listed and irrigation requirements) This cost does not include maintenance of the irrigation systems because the maintenance costs are assumed to be minimal and not a large factor in this study because both designs have irrigation systems
Incremental Costs and Annual Savings Calculations
Table D-6 shows the individual installation and maintenance costs estimated for the sustainable and conventional landscape designs The installation costs are a combination of design implementation of landscape materials and installation of the irrigation system The maintenance costs are a combination of all routine maintenance (listed above) and cost of water to irrigate the landscaping The incremental costs were determined by calculating the difference between the total costs for each design as shown in the last row of Table D6 The simple payback of 08 years can be calculated by dividing the incremental installation cost by the total maintenance savings
11 The cost for landscape maintenance for traditional turf was estimated by Trugreen Chemlawn Company a division of the national franchise located in Baltimore Maryland
D-9
Table D-6 Installation Maintenance and Incremental Costs of Sustainable and Conventional Landscape Area
Site Design Site Design Irrigation Total Total and and Installation Maintenance Water Use Maintenance Maintenance
Implementation Implementation Cost Costs Cost Cost Cost ($acre) ($ for this site) ($1000ft2) ($yr) ($yr) ($yr) ($1000 ft2)
Sustainable Design Native planting $20000 $367309 $18365 $27239 $0 $27239 $1362
Conventional Traditional turf $666767 $122436 $6122 $272391 $59391 $331782 $16589 Incremental cost (sustainable minus conventional) $13333 $249873 $12244 -$245152 -$59391 -$304543 -$15227
D-10
Appendix E Documentation of the Sustainable Materials Features Included in the Prototype Building Analysis1
This appendix documents the calculations used to estimate costs and cost savings associated with the sustainable materials features in the prototype building analysis described in Section 21
bull Low-emitting paint versus latex paint (Section E1) bull Recycled latex paint (Section E2) bull Concrete with slag content (Section E3) bull Concrete with fly ash content (Section E4) bull Carpet with recycled content (Section E5) bull Certified wood options (Section E6)
Documentation of Costs of Low-Emitting Paint Versus Typical Latex Paint
Based on cost estimates from the Timberline model (see Appendix B) the 20000-ft2 office building has 70000 ft2 of interior painted surface The painted surface was assumed to be primed and then painted with a typical contractor-grade latex paint (eggshell)
To provide paint quality comparisons data on high-end products were also gathered Sales representatives from three major paint manufacturers were contacted and primer and topcoat paint prices were provided In addition the vendor technical data sheets provided coverage rates (square feet covered per gallon of paint) The calculations for this document assumed the midpoint of the price range and the lower end of the coverage range to offer a conservative comparison of the products
Low-emitting (no-volatile organic compound [VOC]) paint provides better working conditions at the construction site and may allow painters to work inside the building while other activities are underway The cost of the paint varies depending on the location of the purchase volume of paint purchased and the ability of the local distributor to offer special rates The specifications for all the low-emitting paints analyzed in this study stated that the VOC content was 0 milligramliter
The sales representatives suggested alternative surface preparation techniques (in addition to a traditional primer) but those techniques are not discussed here because the products were too different to offer a fair comparison
Benjamin Moore Paint Company
A Benjamin Moore sales representative provided price quotes for three types of paint used in commercial buildings a very high-end latex paint (AquaVelvet) a typical contractor-grade latex paint (SuperSpec) and a low-emitting paint (EcoSpec) The technical data sheets state that the EcoSpec primer has a higher coverage rate than the other paints Table E-1 shows the ranges quoted by the vendor for the estimated retail price and coverage rates and the values used in the calculations
1 This appendix was written by K Fowler D Hostick and K Poston Pacific Northwest National Laboratory
E-1
Table E-1 Prices and Coverage Rates for Benjamin Moore Paints
Paint Type Price Range
(per gal)
Price Assumed for the
Calculations Coverage (ft2gal)
Coverage Rate Assumed for the
Calculations
Typical contractor latex paint (SuperSpec)
Primer $1528-$1579 $1554 400-500 400
Top coat $2280-$2299 $2290 400-450 400
Very high-end latex paint (Aquavelvet)
Primer $2488-$2499 $2494 400-450 400
Top coat $2988-$2999 $2994 400-450 400
Low-emitting latex paint (EcoSpec)
Primer $2150-$2200 $2175 550 550
Top coat $2840-$2880 $2860 400-450 400
Using the values in Table E-1 the material cost for painting 70000 ft2 of wall area in the 20000-ft2
office building is as follows (assuming one coat of primer and one top coat and a 196 adder for sales tax contractor bonds and insurance profit and overhead and general conditions based on the Timberline model)
The material cost for SuperSpec is as follows
Primer coat cost = ((70000 ft2)(400 ft2gal)) x $1554gal = $271950 Top coat cost = ((70000 ft2 )(400 ft2gal)) x $2290gal = $400750 Total material cost = $271950 + $400750 = $6727 Full cost (inc adder) = $6727 x 1196 = $804549
The same calculation was done for AquaVelvet and EcoSpec resulting in full costs (inc adder) of $1148638 and $929672 respectively
The differences between EcoSpec (the non-VOC paint) and the other two paints are as follows
The material cost for EcoSpec compared with SuperSpec is as follows The difference per gallon for the primer is $2175 - $1554 = $621 (EcoSpec is more expensive by $621 per gallon) The difference per gallon for the top coat is $2860 - $2290 = $570 The total first cost difference is $929672 - $804549 = $125123 or by dividing by 20000 ft2 of building floor space the difference in first cost is $62591000 ft2
Using the same calculation procedure the difference in first cost (inc adder) for EcoSpec compared with AquaVelvet is -$109461000 ft2
Sherwin Williams Paint Company
A Sherwin Williams sales representative provided price quotes for three types of paint used in commercial buildings a high-end latex paint (ProMar 400) a typical contractor-grade latex paint (ProMar 200) and a low-emitting paint (Harmony) The technical data sheets state that the
E-2
Table E-2 Prices and Coverage Rates for Sherwin Williams
Paint Type
Price Range
(per gal)
Price Assumed for the
Calculations Coverage (ft2gal)
Coverage Rate Assumed
for the Calculations
Typical contractor latex paint (ProMar 400)
Primer $950-1000 $975 350-400 350
Top coat $1050-1250 $1150 350-400 350
Very high-end latex paint (ProMar 200)
Primer $1100-1250 $1175 350-400 350
Top coat $1300-1450 $1375 350-400 350
Low-emitting latex paint (Harmony)
Primer $1300-1450 $1375 350-400 350
Top coat $1500-1700 $1600 350-400 350
coverage rates are the same for each product Table E-2 shows the ranges quoted by the vendor for the estimated retail price and the coverage rates and the values used in the calculations
Using the values in Table E-2 the material cost for painting 70000 ft2 of wall area in the 20000-ft2
office building is as follows (assuming one coat of primer and one top coat and a 196 adder for sales tax contractor bonds and insurance profit and overhead and general conditions based on the Timberline model)
The material cost for ProMar 400 is as follows
Primer coat cost = ((70000 )(350 ft2gal)) x $975gal = $1950 Top coat cost = ((70000 ft2)(350 ft2gal)) x $1150gal = $2300 Total material cost = $1950 + $2300 = $4250 Full cost (inc adder) = $4250 x 1196 = $5083
The same calculation was done for ProMar 200 and Harmony resulting in full costs (inc adder) of $609960 and $711620 respectively
The differences between Harmony (the low-emitting paint) and ProMar 400 are as follows The difference per gallon for the primer is $1375 - $975 = $400 (Harmony primer is more expensive by $4 per gallon) The difference per gallon for the top coat is $1600 - $1150 = $450 The total first cost difference is $711620 - $5083 = $203320 or by dividing by 20000 ft2 of building floor space the difference in first cost is $101661000 ft2
Using the same calculation procedure for Harmony compared with ProMar 200 yields a difference in first cost of $50831000 ft2
Duron Paint Company
A Duron sales representative provided price quotes for four types of paint used in commercial buildings premium-quality latex paint (Plastic Kote 29-series) top-quality latex paint (Ultra Deluxe 36-series) a typical contractor-grade latex paint (Pro Kote 23-series) and a low- emitting paint
E-3
(Genesis 79-series) The technical data sheets state that the coverage rates are the same for each product The sales representative recommended the same primer regardless of top coat choice
Table E-3 shows the ranges quoted by the vendor for the estimated retail price and the coverage and shows the values used in the calculations Note that Duron paint is manufactured in Atlanta Georgia and Beltsville Maryland Procuring paint for the Baltimore prototype building from the Duron location in Maryland would contribute to localregional material points in the LEED certification process
Table E-3 Prices and Coverage Rates for Duron
Paint Type Price Range
(per gal)
Price Assumed for the
Calculations Coverage (ft2ga1)
Coverage Rate Assumed for the
Calculations
Typical contractor latex paint (Pro Kote 23-Series)
Primer $1385-1485 $1435 350-400 350
Top coat $1365-1465 $1415 400 400
Top quality latex paint (Ultra Deluxe 36-Series)
Primer $1385-1485 $1435 350-400 350
Top coat $1835-1935 $1885 400 400
Premium quality latex paint (Plastic Kote 29-Series)
Primer $1385-1485 $1435 350-400 350
Top coat $1925-2025 $1975 400 400
Low-emitting latex paint (Genesis 79-Series)
Primer $1385-1485 $1435 350-400 350
Top coat $2040-2140 $2090 400 400
Using the values in Table E-3 the material cost for painting 70000 ft2 of wall area in the 20000-ft2
office building is as follows (assuming one coat of primer and one top coat and a 196 adder for sales tax contractor bonds and insurance profit and overhead and general conditions based on the Timberline model)
The material cost for the Pro Kote 23-Series is as follows
Primer coat cost = ((70000 ft2)(400 ft2gal)) x $1435gal = $251125 Top coat cost = ((70000 ft2)(350 ft2gal)) x $1415gal = $2830 Total material cost = $251125 + $2830 = $534125 Full cost (inc adder) = $534125 x 1196 = $638814
Using the same calculation procedure the full cost (inc adder) for the other paints is as follows
bull Ultra Deluxe 36-Series $751238 bull Plastic Kote 29-Series $772766 bull Genesis 79-Series $800274
E-4
The differences between Genesis (the low-emitting paint) and the Pro Kote 23-Series are as follows There is no difference per gallon for the primer The difference per gallon for the top coat is $2090 - $1415 = $675 (Genesis is more expensive by $675 per gallon) The total first cost difference is $800274 - $638814 = $161460 or by dividing by 20000 ft2 of building floor space the difference in first cost is $80731000 ft2
Using the same procedure the other comparisons yield the following differences in first cost
bull Genesis compared with Ultra Deluxe 36-Series $24521000 ft2
bull Genesis compared with Plastic Kote 29-Series $13751000 ft2
Taking the highest and lowest per gallon differences and the total cost differential that considers the difference in coverage the following summarizes this sustainable design feature
bull Sustainable design feature low-emitting paint bull Incremental first cost ($unit) -$319 to +$675 bull Incremental cost ($1000 ft2) -$10950 to +$10166
Documentation of Recycled Latex Paint
Based on cost estimates from the Timberline model the 20000-ft2 office building has 70000 ft2 of interior painted surface Recycled content primer was not available so the cost comparisons below do not include primer costs The data on typical contractor-grade paint gathered for the low-emitting latex paint options were used as the baseline for this comparison
Recycled paint is post-consumer latex paint that has been sorted by type color and finish and reprocessed for resale The US Environmental Protection Agency (EPA) through the Comprehensive Procurement Guideline2 encourages the purchase of latex paint made from postshyconsumer-recovered materials whenever the paint meets the projects specifications and performance requirements and is available and cost effective The benefits of recycled paint for sustainable design typically include the following
bull Lower first cost (where the paint is available it is typically offered at a lower price than virgin paint of a comparable quality)
bull Reduced paint disposal needs (using the recycled paint creates a market for the excess paint often found after household and commercial construction projects)
bull Decreased waste costs (recycling rather than disposing of the excess paint avoids waste disposal costs)
Two suppliers of recycled paint provided quotes for their products These vendors sell recycled paint and accept excess latex paint for reprocessing and consolidation Both vendors can ship their products to the Baltimore area Shipping costs are not included in the cost summary below because the vendors noted that their distribution outlets are increasing and these charges may not be applicable over the long term Also both companies offered special rates for large projects and government buildings and under other special circumstances those reduced rates were not considered for this evaluation
2 Available at URL httpwwwepagovepgproductspainthtm
E-5
Table E-4 lists the price and coverage data for each of the paint products and the values used in the calculations The calculations assumed the midpoint of the price range and the lower end of the coverage range to offer a conservative comparison of the products
Table E-4 Paint Prices and Coverage Rates
Paint Type Price Range
(per gal)
Price Assumed for the
Calculations Coverage (ft2gal)
Coverage Rate Assumed for the
Calculations
Typical contractor latex paint
Benjamin Moore SuperSpec $2280-$2299 $2290 400-450 400
Sherwin Williams ProMar 400 $1050-1250 $1150 350-400 350
Duron Pro Kote 23-Series $1365-1465 $1415 400 400
Recycled paint
Nu-Blend Paints Inc $850 - $1060 $955 350-400 350
E Coat $899 - $1199 $1049 250 250
Using the values in Table E-4 the material costs for painting 70000 ft2 of wall area in the 20000-ft2
office building are as follows (assuming one top coat and a 196 adder for sales tax contractor bonds and insurance profit and overhead and general conditions based on the Timberline model)
The material cost for Benjamin Moore SuperSpec is as follows
Top coat cost = ((70000 ft2)(400 ft2gal)) x $2290gal = $400750 Full cost (inc adder) = $400750 x 1196 = $479297 (for top coat only)
Using the same procedure the following are the full costs (inc adder) for the other paints
bull Sherwin Williams ProMar 400 $275080 bull Duron Pro Kote 23-Series $338468 bull Nu-Blend recycled paint $228436 bull E Coat recycled paint $349950
The differences between Nu-Blend recycled paint and the Benjamin Moore SuperSpec latex paint are as follows The difference per gallon for the top coat is $955 - $2290 = -$1335 (Nu-Blend is less expensive by $1335 per gallon) The total first cost difference is $228436 - $479297 = -$250861 or by dividing by 20000 ft2 of building floor space the difference in first cost is -$125431000 ft2
Using the same procedure the first cost differences between Nu-blend and the other latex paints are as follows
bull Nu-Blend compared with Sherwin Williams ProMar 400 -$22821000 ft2
bull Nu-Blend compared with Duron Pro Kote 23-Series -$55021000 ft2
The differences between E Coat recycled paint and the three contractor-grade latex paints are as follows
E-6
bull E Coat compared with Benjamin Moore SuperSpec -$64671000 ft2
bull E Coat compared with Sherwin Williams ProMar 40 $37441000 ft2 (ie E Coat is more expensive by $37441000 ft2)
bull E Coat compared with Duron Pro Kote 23-Series $5741000 ft2 (E Coat is more expensive)
Taking the highest and lowest per gallon differences and the total cost differential that considers the difference in coverage the following summarizes this sustainable design feature
bull Sustainable design feature recycled paint bull Incremental first cost ($unit) -$1335 to -$105 bull Incremental cost ($1000 ft2) -$12543 to +$3744
Documentation of Costs of Concrete with Slag Content
Based on estimates provided by vendors 250 yd3 of 3000 pounds per square inch (psi) concrete would be needed for the 20000-ft2 office building The baseline product is concrete made from 100 portland cement The sustainable design option is concrete with a mix of portland cement and iron mill slag
Blast furnaces producing iron from iron ore also produce a molten slag that at one time was considered a waste product That slag can now be recycled into ground-granulated blast-furnace slag cement by grinding the iron blast furnace slag to cement fineness
NewCem produced by Lafarge Corporation was the product that the local vendors referenced when they provided price quotes NewCem is manufactured locallyregionally at Sparrows Point Maryland and therefore would contribute to localregional material points in the Leadership in Energy and Environmental Design (LEEDtrade) certification process NewCem is a finely ground granulated blast-furnace slag manufactured from the byproduct of an iron blast furnace It is made to meet the specification requirements of Grade 120 concrete which ensures high uniform strengths The specifications allow for the slag blend to be from 25 to 70 of the total cementitious materials
Some of the benefits that have been noted for slag cement mixes include improved workability and pumpability for the unhardened concrete For the hardened concrete using slag content increases the 28-day strength reduces permeability and heat of hydration increases sulphate resistance and controls the alkali silica reaction During hot weather slag concrete set times are lengthened and during cold weather the impact on set time had one of the local vendors stating that they did not use it during the winter
Sales representatives at several Baltimore area vendors provided price quotes of ready-mix concrete Table E-5 shows the ranges quoted by the vendor for the estimated retail price and shows the values used in the calculations Note that not all the vendors that offered 100 portland cement concrete also offered concrete with slag content The cost variances are due to the different vendors rather than product variations In addition to vendor quotes Lafarge Corporation the manufacturer of the NewCem product being quoted by the vendors was contacted Lafarge explained that initially concrete made with the NewCem mix was much cheaper but increases in product demand resulted in very little cost difference between 100 portland cement and NewCemportland cement mixes The purchase of slag content concrete depends on local availability The prices will vary based on current demand and availability of the product
E-7
Table E-5 Prices for Concrete
Concrete Type Price Per
Cubic Yard Price Range Assumed for the Calculations
100 portland cement concrete $6395 - $85
Quote 1 $6395
Quote 2 $85
Quote 3 $6710
Quote 4 $78
Quote 5 $6450
Slag content $6345 - $85
Quote 1 (25 NewCem) $6345
Quote 2 (50 NewCem) $85
Quote 3 (mix not specified) $6710
Using the values in Table E-5 the material costs for 250 yd3 of concrete are as follows (assuming 196 adder for sales tax contractor bonds and insurance profit and overhead and general conditions based on the Timberline model)
100 Portland Cement Concrete Least expensive quote = 250 yd3 x $6395 yd3 = $1598750 Cost including adder = $1598750 x 1196 = $1912105 Most expensive quote = 250 yd3 x $85yd3 = $21250 Cost including adder = $21250 x 1196 = $25415 Price range = $1912105 to $25415
Slag Content Concrete Least expensive quote = 250 yd3 x $6345yd3 = $1586250 Cost including adder = $1586250 x 1196 = $1897155 Most expensive quote = 250 yd3 x $85yd3 = $21250 Cost including adder = $21250 x 1196 = $25415 Price range = $1897155 to $25415
The differences between 100 portland cement and slag content cement are as follows The difference per cubic yard of concrete ranges from $6395 ndash $6345 = -$050 (concrete with slag content costing $050 less than 100 portland cement concrete) to $85 - $85 = $0 or no cost difference between the two products The range of the total first cost difference is ($1912105 shy$1897155) = -$14950 to ($25415 - 25415) = $0 or no cost difference By dividing by 20000 ft2 of building floor space the difference in first cost is -$7481000 ft2 to $01000 ft2
Taking the highest and lowest cost differences and the total cost differential the following summarizes this sustainable design feature
bull Sustainable design feature concrete with slag content bull Incremental first cost ($unit) -$050 to $0 bull Incremental cost ($1000 ft2) -$748 to $0
E-8
Documentation of Costs of Concrete with Fly Ash Content
Based on estimates provided by vendors 250 yd3 of 3000 psi concrete would be needed for the 20000-ft2 office building The baseline product is concrete made from 100 portland cement The sustainable design option is concrete with a mix of portland cement and fly ash Fly-ash-content concrete is not readily available in Baltimore typically it is only available on the West Coast However the summary in this section includes fly-ash-content cement to compare products and prices
Concrete is traditionally made using 100 portland cement aggregate and water Concrete made with portland cement has well-established mixing and setting properties and therefore does not require any extra instruction for use on a construction site Concrete with fly ash means that some portion of the portland cement was replaced with fly ash Fly ash was first used in the United States to reduce the quantity of portland cement needed for the Hoover Dam in 1929 Fly ash is a fine powder recovered from coal-fired electric power generation Millions of tons of fly ash are produced every year by US power plants Two types of fly ash are generated in the US Class C and Class F Class C produced from Western coal (low sulfur) is the one most typically used for structural concrete because it has a higher percentage of calcium oxide Class F is produced from Eastern coal3
Using concrete with fly ash content has the following qualitative benefits
bull Uses a waste product as a material eliminating the fly ash from being sent to a landfill bull Requires less water bull Has lower embodied energy than portland cement material bull Is less likely to crack because it uses less water decreasing replacement costs bull Is easier to use in cold weather than 100 portland cement bull Has workability advantages bull Offers water retention advantages bull Offers strength advantages depending on the recipe and set time bull Reduces the risk of expansion because of sulfate attack
The following are some issues to consider when using fly-ash-content concrete
bull Smaller contractors may not be familiar with the product potentially resulting in higher labor costs
bull Fly ash is generated at a variety of sources therefore the mineral makeup of the product is not 100 consistent which could potentially result is quality control issues
bull If used as a complete replacement for portland cement fly-ash content has issues related to freezethaw performance and a tendency to effloresce
bull Because of requirements in the Clean Air Act some coal-fired electric power plants are generating a high-carbon fly ash that has to be reprocessed before it can be used as a replacement for portland cement This could potentially result in less availability of fly ash in the future
3 May 7 2002 ToolBase Services (see httpwwwnahbrcorgtertiaryRaspTrackID=ampDocumentID=2072ampCategoryID=72)
E-9
Table E-6 summarizes the costs for 100 portland cement concrete and concrete containing 20 fly ash as encouraged by the EPAs Affirmative Procurement Program These costs are representative of cement walls andor flooring for a 3000 psi mix delivered to the construction site
Table E-6 Prices for Concrete
Concrete Type Price Per
Cubic Yard
100 portland cement concrete $6875
Fly ash content $6775
Only one price quote is offered to show as a comparison of fly ash costs vs slag vs 100 portland cement The baseline price quote is from a West Coast vendor of ready-mix concrete Several other vendors were contacted and although they wouldnt provide a price quote they stated that the 100 portland cement and 20 fly-ash-content concrete cost the same All of the West Coast vendors contacted explained that initially concrete made with fly-ash content was much cheaper but because of increases in demand for the product and changes in availability of quality fly ash very little cost difference exists between 100 portland cement and fly ashportland cement mixes The purchase of fly-ash-content concrete depends on local availability The prices will vary based on current demand and availability of the product
Using the values in Table E-6 the material costs for 250 yd3 of concrete are as follows (assuming 196 adder for sales tax contractor bonds and insurance profit and overhead and general conditions based on the Timberline model)
100 Portland Cement Concrete Concrete cost = 250 yd3 x $6875yd3 = $1718750 Cost including adder = $1718750 x 1196 = $2055625
20 Fly-Ash-Content Concrete Least expensive quote = 250 yd3 x $6775yd3 = $1693750 Cost including adder = $1693750 x 1196 = $2025725
The differences between 100 portland cement and 20 fly-ash-content cement are as follows The difference per cubic yard of concrete ranges from $6775 to $6875 = -$100 (concrete with fly ash content costs $1 less than 100 portland cement concrete) The range of the total first cost difference is $2025725 - $2055625 = -$299 By dividing by 20000 ft2 of building floor space the difference in first cost is -$14951000 ft2
Taking the highest and lowest cost differences and the total cost differential the following summarizes this sustainable design feature
bull Sustainable design feature concrete with fly ash bull Incremental first cost ($unit) -$100 bull Incremental cost ($1000 ft2) -$1495
E-10
Documentation of Costs of Carpet with Recycled Content
Based on cost estimates from the Timberline model the 20000-ft2 office building has 2000 yd2 of interior carpet A range of environmentally preferable carpet products is currently available on the carpet market Product examples include refurbished used carpet and new carpet made from old carpet and carpet scraps carpet backing auto parts soda bottles and flooring materials For this study a simple comparison was conducted of carpet made from 100 virgin material versus carpet with recycled content The percentage of recycled content and the source of the recycled content are not specified for this comparison because the products of similar quality vary so dramatically in design but the costs do not vary as significantly The EPA through the Comprehensive Procurement Guideline encourages the purchase of carpet with recycled content when it is available doesnt compromise quality and is cost effective
Eight national and Baltimore area carpet vendors were contacted for prices on products Only two of the vendors provided a complete set of prices for different carpet styles The installation prices include the cost of adhesives
CampA Floorcoverings Habitat and Ecotone products are both solution-dyed nylon which is fade resistant and has the same maintenance requirements as typical carpet Both of these products are about 82 recycled content by weight Explorer Expedition and Wayfarer carpets are typical contractor-grade carpets that are also solution-dyed and are manufactured with 100 new face yarn and a recycled backing (resulting in about 31 recycled content by weight) Product pricing for products made with 100 virgin materials was not available because all of CampA Floorcoverings carpet backing has recycled content
The sales representative at the Carpet Fair Commercial Division was not aware of any products made with recycled content and therefore only offered quotes for carpets with virgin material The sales representative at Dupont Flooring Systems stated that the product cost differences are the result of performance requirements patterns color etc rather than whether a product has recycled content
Mohawk Commercial Carpet produces a wide variety of both recycled content and virgin content carpets Their recycled content carpets are made of nylon that can be recycled into carpet again and the products that were discussed also are made with nonlatex-based backing The sales representative provided prices for both patterned and nonpatterned solution-dyed carpets which are fade resistant The sales representative said that the general rule of thumb for Mohawk carpets is that equivalent quality carpet made of virgin materials usually costs about $1yd2 more than the recycled content carpet Maintenance requirements for the recycled content versus virgin content carpet do not differ
Table E-7 lists the price of carpet made from virgin materials and from recycled materials The calculations assumed the midpoint of the price range to offer a conservative comparison of the products
E-11
Table E-7 Prices for Recycled Content and Virgin Carpet
Carpet Type
Price Per Square
Yard
Price Per Square Yard
Installed
Price Assumed for the
Calculations
Percentage Recycled Content
CampA Floorcoverings
Habitat $1880 $2880-$3080 $2980 82
Ecotone $1995 $2995-$3195 $3095 82
Explorer $2200 $3200-$3400 $3300 31
Expedition $2400 $3400-$3600 $3500 31
Wayfarer $2600 $3600 $3600 31
Carpet Fair Commercial Division
Broadloom 100 virgin nylon carpet
NA $1800-$2000 $1900 0
Virgin carpet tiles NA $2300-$2600 $2450 0
Dupont Flooring Systems
Recycled content face yarn and backing
NA $3500 $3500 30-80
Carpet made with virgin materials
NA $3500 $3500 0
Mohawk Commercial Carpet
Performer 28 (no pattern) $1200-$1600 $1800-$2200 $2000 0
Collegiate (no pattern budget carpet)
$600-$1000 $1400-$1800 $1600 0
Surreal (no pattern) $1200-$1600 $1800-$2200 $2000 50
Virgin patterned carpet $1800-$2200 $24-$28 $2600 0
Graphic Edge (pattern) $1200-$1600 $1800-$2200 $2000 50
Maritage Collection (4 to 5 products with pattern)
$1700-$2100 $2300-$2700 $2500 50
Tracks (pattern) $1300-$1700 $1900-$2300 $2100 50
Feathergrid (pattern) $1300-$1700 $1900-$2300 $2100 50
Structures (pattern) $1300-$1700 $1900-$2300 $2100 50
NA = not available
Using the values in Table E-7 the material costs for carpeting 2000 yd2 of floor space in the 20000shyft2 office building are as follows (assuming 196 adder for sales tax contractor bonds and insurance profit and overhead and general conditions based on the Timberline model) with Habitat carpet
Product cost = 2000 yd2 x $2980yd2 = $59600 Full cost (inc adder) = $59600 x 1196 = $71282
E-12
Using the same calculation procedure the full costs (inc adder) for the other products are as follows
bull Ecotone $74032 bull Explorer $78936 bull Expedition $83720 bull Wayfarer $86112 bull Broadloom 100 virgin nylon carpet $45448 bull 100 virgin carpet tiles $58604 bull Recycled content face yarn and backing $83720 bull Carpet made with 100 virgin materials $83720 bull Performer 28 (no pattern) $47840 bull Collegiate (no pattern budget) $38272 bull Surreal (no pattern) $47840 bull Virgin patterned carpet $62192 bull Graphic Edge (pattern) $47840 bull Maritage Collection (4 to 5 products pattern) $59800 bull Tracks Feathergrid and Structures (pattern) $50232
The difference between Habitat and the 100 virgin carpet (broadloom) is as follows The difference per square foot for the installed carpet is $2980 - $19 = $1080 The total first cost difference is $7128160 - $45448 = $2583360 or by dividing by 20000 ft2 of building floor space the difference in first cost is $1291681000 ft2
Using the same calculation procedure a comparison of the first cost of Habitat to the others is as follows
bull Habitat compared with 100 virgin carpet tiles $633881000 ft2
bull Habitat compared with carpet made with 100 virgin materials -$621921000 ft2
bull Habitat compared with Performer 28 $1172081000 ft2
bull Habitat compared with Collegiate (budget) $1650481000 ft2
bull Habitat compared with virgin patterned carpet $454481000 ft2
The differences between Ecotone and the 100 virgin carpets are as follows
bull Ecotone compared with broadloom 100 virgin nylon carpet $142922 per 1000 ft2
bull Ecotone compared with 100 virgin carpet tiles $771421000 ft2
bull Ecotone compared with carpet made with 100 virgin materials -$484381000 ft2
bull Ecotone compared with Performer 28 $1309621000 ft2
bull Ecotone compared with Collegiate (budget) $1778021000 ft2
bull Ecotone compared with virgin patterned carpet $592021000 ft2
The differences between Explorer and the 100 virgin carpet products are as follows
bull Explorer compared with broadloom 100 virgin nylon carpet $1674401000 ft2
bull Explorer compared with 100 virgin carpet tiles $1016601000 ft2
bull Explorer compared with carpet made with 100 virgin materials -$239201000 ft2
bull Explorer compared with Performer 28 $1554801000 ft2
E-13
bull Explorer Compared with Collegiate (budget) $2033201000 ft2
bull Explorer Compared with virgin patterned carpet $837201000 ft2
The differences between Expedition and the 100 virgin carpet products are as follows
bull Expedition compared with broadloom 100 virgin nylon carpet $1913601000 ft2
bull Expedition compared with 100 virgin carpet tiles $1255801000 ft2
bull Expedition compared with carpet made with 100 virgin materials $01000 ft2
bull Expedition compared with Performer 28 $1794001000 ft2
bull Expedition compared with Collegiate (budget) $2272401000 ft2
bull Expedition compared with virgin patterned carpet $1076401000 ft2
The differences between Wayfarer and the 100 virgin carpet products are as follows
bull Wayfarer compared with broadloom 100 virgin nylon carpet $2033201000 ft2
bull Wayfarer compared with 100 virgin carpet tiles $1375401000 ft2
bull Wayfarer compared with carpet made with 100 virgin materials $119601000 ft2
bull Wayfarer compared with Performer 28 $1913601000 ft2
bull Wayfarer compared with Collegiate (budget) $2392001000 ft2
bull Wayfarer compared with virgin patterned carpet $1197501000 ft2
The differences between recycled content face yarn and backing and the 100 virgin carpet products are as follows
bull Recycled content face yarn and backing compared with broadloom 100 virgin nylon carpet $1913601000 ft2
bull Recycled content face yarn and backing compared with 100 virgin carpet tiles $1255801000 ft2
bull Recycled content face yarn and backing compared with carpet made with 100 virgin materials $01000 ft2
bull Recycled content face yarn and backing compared with Performer 28 $1794001000 ft2
bull Recycled content face yarn and backing compared with Collegiate (budget) $2272401000 ft2
bull Recycled content face yarn and backing compared with virgin patterned $1076401000 ft2
The differences between Surreal and the 100 virgin carpet products are as follows
bull Surreal compared with broadloom 100 virgin nylon carpet $119601000 ft2
bull Surreal compared with 100 virgin carpet tiles -$538201000 ft2
bull Surreal compared with carpet made with 100 virgin materials -$1794001000 ft2
bull Surreal compared with Performer 28 $01000 ft2
bull Surreal compared with Collegiate (budget) $478401000 ft2
bull Surreal compared with virgin patterned carpet -$717601000 ft2
The differences between Graphic Edge and the 100 virgin carpet products are as follows
bull Graphic Edge compared with broadloom 100 virgin nylon carpet $119601000 ft2
bull Graphic Edge compared with 100 virgin carpet tiles -$538201000 ft2
bull Graphic Edge compared with carpet made with 100 virgin materials -$1794001000 ft2
bull Graphic Edge compared with Performer 28 $01000 ft2
E-14
bull Graphic Edge compared with Collegiate (budget) $478401000 ft2
bull Graphic Edge compared with virgin patterned carpet -$717601000 ft2
The differences between the Maritage Collection and the 100 virgin carpet products are as follows
bull Maritage Collection compared with broadloom 100 virgin nylon carpet $717601000 ft2
bull Maritage Collection compared with 100 virgin carpet tiles $59801000 ft2
bull Maritage Collection compared with carpet made with 100 virgin materials -$1196001000 ft2
bull Maritage Collection compared with Performer 28 $598001000 ft2
bull Maritage Collection compared with Collegiate (budget) $1076401000 ft2
bull Maritage Collection compared with virgin patterned carpet -$119601000 ft2
The differences between Tracks Feathergrid and Structures and the 100 virgin carpet products are as follows
bull Tracks Feathergrid and Structures compared with broadloom 100 virgin nylon carpet $239201000 ft2
bull Tracks Feathergrid and Structures compared with 100 virgin carpet tiles -$418601000 ft2
bull Tracks Feathergrid and Structures compared with carpet made with 100 virgin materials -$1674401000 ft2
bull Tracks Feathergrid and Structures compared with Performer 28 $119601000 ft2
bull Tracks Feathergrid and Structures compared with Collegiate (budget) $598001000 ft2
bull Tracks Feathergrid and Structures compared with virgin patterned carpet -$598001000 ft2
Taking the highest and lowest per square yard differences and the total cost differential the following summarizes this sustainable design feature
bull Sustainable design feature recycled content carpet bull Incremental first cost ($yd) -$15 to +$20 bull Incremental cost ($1000 ft2) -$179400 to +$239200
Documentation of Costs of Certified Wood Options
The following baseline materials would be replaced with certified wood products
bull 72 wood doors 3 ft x 6 ft 8 in x 1 frac34 in 5-ply particle core with birch faces (stained) bull 3060 linear feet of vinyl baseboard trim
A certified wood product is a product that originates from a forest that has been certified as well managed Typically certified wood products are labeled by one of the organizations that set the standards for responsible forest management There are two international certified wood product standards organizations ndash Forest Stewardship Council and the International Standards Organization ndash and four North American organizations ndash American Tree Farm System Canadian Standards Association International Forest Stewardship Council and Sustainable Forestry Initiative
Certification provides an independent assurance that a forestry operation meets the standards set by the certification organization The standards look for environmentally socially and economically
E-15
responsible management practices that ensure the long-term health and productivity of forests for timber production wildlife habitat water quality and community employment
Acquiring cost-competitive certified wood products for a construction project might require considerable lead-time depending on the product To acquire the quotes provided in Table E-8 (cost of doors) and Table E-9 (cost of baseboard trim) local vendors of doors and baseboard were asked about the baseline product as well as certified wood products Most of the vendors who sell typical contractor-grade products were not able to provide accurate information about certified wood products
Table E-8 Costs of Doors
Door Type Price Per Door Product Description
Certified wood doors
Quote 1 $192-$200 Particle board core
Quote 2 $168-$176 Particle board core
Quote 3 $175-200 Particle board core
Quote 4 $250-$300 Solid pine
Quote 5 $400 Solid hardwood
Traditional wood doors
Quote 1 $160 Particle board core
Quote 2 $160 Particle board core
Quote 3 $165 Particle board core
Quote 4 $372 Solid birch
Quote 5 $300-400 Solid birch
The Sustainable Forest Products Resource ForestWorld Marketplace4 and the Certified Forest Products Council5 were the easiest sources of information regarding available certified wood products The certified wood products vendors stated that the price and quality of certified wood products depended dramatically on how much time they have to locate the desired product
Note that the baseline for the building assumes particle core doors If certified wood particle core doors replace the baseline doors it is possible that action would not meet the LEED requirements for getting a certified wood credit The particle core doors are made with a very small quantity of certified wood (5 to 10 of the door) most of the door is made from recycled content Therefore solid wood doors were also considered in this analysis
Using the range of values in Table E-8 and E-9 (excluding the data for the solid mahogany doors) the material cost for replacing 72 contractor-grade 3 ft x 7 ft x 1 frac34 in 5-ply particle core door with birch faces with certified wood products is as follows (assuming 196 adder for sales tax contractor bonds and insurance profit and overhead and general conditions based on the Timberline model)
4 Available at httpwwwforestworldcom 5 Available at httpwwwcertifiedwoodorg
E-16
Table E-9 Baseboard Trim
Trim Type Price Per
Linear Foot Product Description
Certified wood baseboard trim
Quote 1 $150 Ash
Quote 2 $113 Willow
Quote 3 $159 Oak
Vinyl trim
Quote 1 $0356 Black
Quote 2 $0383 Brown
Quote 3 $0407 Off-white
Quote 4 $250 Polyurethane molding
Quote 5 $082 Rubber back
Quote 6 $080-$1 Vinyl trim installed
Quote 7 $1-12 Vinyl-rubber blend installed
Wood trim
Quote 1 $049 Ranch pine
Quote 2 $118 Wood molding
The material cost for the contractor-grade 5-ply particle core door is as follows
Product cost = 72 doors x $160 to $165door = $11520 to $11880 Full cost (inc adder) = $11520 to $11880 x 1196 = $13778 to $14208
Using the same approach the full cost ranges (inc adder) of the other products are as follows
bull Certified wood particle core door $14467 to $17222 bull Contractor-grade solid door $25834 to $34445 bull Certified solid wood door $21528 to $34445
The differences between the contractor-grade particle core door and the certified wood products are as follows
Contractor-Grade 5-ply Particle Core Door Compared with Certified Wood Particle Core Door The difference per door is ($160 to $165door) - ($168 to $200door) = -$8 to $40door The total first cost difference is ($13778 to $14208) - ($14467 to $17222) = $259 to $3444 or by dividing by 20000 ft2 of building floor space the difference in first cost ranges from $1295 to $172201000 ft2
Solid Wood Door Compared with Certified Solid Wood Door The difference per door is ($300 to 400door) - ($250 to $400door) = -$150 to $100door The total first cost difference is ($25834 to $34445) - ($21528 to $34445) = -$12917 to $8611 or by dividing by 20000 ft2 of building floor space the difference in first cost ranges from -$64585 to $430551000 ft2
E-17
Taking the highest and lowest differences and the total cost differential Table E-10 summaries this sustainable design feature
Table E-10 Summary of Certified Wood Options
Sustainable Design Feature
Incremental First Cost
($ per unit) Incremental Cost
($1000 ft2)
Certified wood particle core door vs contractor-grade particle core door
$3 to $40 $1295 to $17220
Certified wood solid wood door vs solid wood door
-$150 to $100 -$64585 to $43055
The assumed baseline material is 3060 linear feet of vinyl baseboard trim with alternative certified wood products being solid ash willow and oak baseboard trim The differences in product quality appearance and durability have not been included in the cost comparisons Noncertified wood trim first costs were also gathered to offer a more equivalent comparison from a product quality perspective
Using the range of values in Table E-9 (excluding quotes 4 through 7 because they offer higher-end products or included installation costs) the material cost for replacing 3060 linear feet of vinyl baseboard trim with certified wood products is as follows (assuming 196 adder for sales tax contractor bonds and insurance profit and overhead and general conditions based on the Timberline model)
The material cost for the contractor-grade vinyl baseboard trim is as follows
Product cost = 3060 linear feet x $0356 to $0407linear foot = $1089 to $1245 Full cost (inc adder) = $1089 to $1245 x 1196 = $1302 to $1489
Using the same calculation approach the full costs (inc adder) for the other products are as follows
bull Contractor-grade wood baseboard trim $1793 to $4319 bull Certified wood baseboard trim $4136 to $5819
The difference between the contractor-grade vinyl baseboard trim and the certified wood baseboard trim is as follows The difference per linear foot of vinyl trim is ($0356 to $0407linear foot) shy($113 to $159linear foot) = $072 to $123linear foot The total first cost difference is ($1302 to $1489) - ($4136 to $5819) = $2647 to $4517 or by dividing by 20000 ft2 of building floor space the difference in first cost ranges from $13235 to $225851000 ft2
The comparison between the contractor-grade solid wood baseboard trim and the certified wood baseboard trim yields a range of -$915 to $201301000 ft2
E-18
Appendix F Detailed Discussion of Research Studies on Occupant Health Comfort and Productivity1
This appendix provides details on the studies reviewed for Section 26 (Lower Absenteeism and Improved Productivity) and Section 3 (The Social Benefits of Sustainable Design) The studies deal with indoor air quality (Section F1) and other sustainable design practices (Section F2)
Indoor Air Quality
This section describes the studies reviewed on increased ventilation effectiveness low-emitting materials indoor chemical and pollutant source control controllability of systems thermal conditions daylight and views and potential problems with daylight and windows
Increased Ventilation Effectiveness
Increased ventilation effectiveness includes strategies such as natural ventilation increased air change rate increased volume of outdoor air and increased air filtration The health benefits productivity benefits and comfort and satisfaction of such strategies are discussed below
Health Benefits
Many large-scale building studies show that increased volumes of outdoor air natural ventilation air ventilation rates and filtration of air and improved cleaning and maintenance of systems are correlated with reduced sick building syndrome (SBS) symptoms as well as reduced allergy and asthma symptoms and transmission of infections diseases (Brightman and Moss 2000 Fisk 2001) Most of the studies cited in the literature are surveys and do not include information on how frequently windows are opened by the workers in naturally ventilated buildings Therefore it is not known whether positive impacts are due to psychological factors (eg control) or to actual increases in fresh air Further in areas where outdoor air has high levels of pollutants or allergens indoor air quality may actually be compromised For instance a study in Norway found that nurses experienced more eye irritation in hospitals near roads with heavy traffic because of the increased dust settlement rates (Smedbold et al 2001)
A controlled field experiment by Wargocki et al (2000) in Denmark found that increasing ventilation rates beyond minimum levels prescribed in standards is associated with reduced symptoms Three outdoor air change rates were studied 06 2 or 6 air changes (AC)hr (corresponding to 3 10 or 30 liters (L)personhr) Temperature and humidity were kept constant at 72ordmF and 40 relative humidity The researchers found that the workers felt better and had fewer symptoms as ventilation rates increased The workers also perceived the air as fresher
A study of 3720 employees in 40 buildings also found reduced symptoms and lower absenteeism in buildings with higher ventilation rates (Milton et al 2000) The high ventilation rate was about 50 cubic feet per minute (cfm)person outdoor air compared with a moderate rate of 25 cfmperson (This corresponds to 12 Lpersonhr and 24 Lpersonhr these data are very consistent with the Wargocki et al [2000] study) Milton et al (2000) estimated the cost of sick leave as $480personyr
1 This appendix was written by J Heerwagen Pacific Northwest National Laboratory
F-1
Productivity Benefits
Performance assessments in work settings are rare because of the difficulty of capturing actual performance measures and linking them to specific environmental features Nonetheless a field experiment in Denmark shows that workers performed better on a typing task and perceived themselves as able to think more clearly with increased ventilation (Wargocki et al 2000) A field experiment by Nunes et al (1993) looked at the link between SBS symptoms associated with ventilation rates and work performance They found that workers reporting SBS symptoms worked 72 more slowly on a vigilance task and made 30 more errors on a numerical task
Other studies have assessed self-ratings of productivity Based on a study of 40 buildings in the United Kingdom occupants in naturally ventilated or mixed-mode buildings rated their perceived productivity significantly higher than occupants of air-conditioned buildings (Leaman and Bordass 2001) Similar results were found in a study by Rowe et al in Australia where workers in mixed-mode buildings rated their work performance higher (cited in Leaman and Bordass 2001)
Comfort and Satisfaction
Workers prefer spaces with operable windows compared with completely mechanically ventilated and conditioned spaces except in hot summer weather (Leaman and Bordass 2001) In the Wargocki et al (2000) study cited above workers were more satisfied with the air quality and rated the air as fresher with increased ventilation from 06 AChr to 6 AChr
Low-Emitting Materials
The vast majority of research on materials emissions has been conducted in specialized facilities and cannot be generalized to office environments However as discussed below some field studies provide data on occupant health and productivity benefits
Health Benefits
Brightman and Moss (2001) in a review of large-scale studies of SBS in Europe and the United States identify carpet as a key risk factor in SBS Other building factors that show mixed findings (some show increases in symptoms others do not) are total volatile organic compounds (VOCs) fleecy materials and formaldehyde (Work and personal factors affecting symptom occurrence include stress history of allergy high use of photocopy machines and high level of paper work) A field intervention by Pejtersen et al (2001) compared symptoms in a newly renovated area of a building with a control group who did not experience the renovation The upgrades included renovating the HVAC system and replacing the carpet with a low-emitting vinyl floor material The researchers found significantly improved perceptions and reduced illness symptoms in the renovated space It is not known however to what extent the improvements were due to the HVAC system or to changes in the floor materials
Productivity Benefits
A field simulation study testing the effects of a 25-year-old carpet on work performance found that when the carpet was absent performance increased on a variety of clerical as well as complex cognitive tasks requiring mental effort and high attention including logical thinking arithmetic and vigilance (Wargocki et al 2000) The authors attribute this to airborne particulates although the exact mechanisms by which particulates might affect cognitive functioning are not discussed
F-2
Indoor Chemical and Pollutant Source Control
Relatively little work has been done on controlling indoor chemicals and pollutant sources No studies were found on productivity or comfort and only two studies on health impacts were found For instance a Danish experimental office study found an increase in eye and skin irritations in an office with computers laser printers and a photocopier than an office without the technologies The office with the equipment was found to have higher levels of ozone respirable particulates and VOCs (Wolkoff et al 1992) Brown (1999) also found that emissions from dry-process photocopiers increased when temperatures increased from 73ordmF to 90ordmC and that particle emissions occurred when the copier was idle and copying Numerous other studies cited in Hedge (2000) noted that SBS problems increase for workers with high computer use
Controllability of Systems
A growing body of literature in building science and health care underscores the psychological functional and health benefits of having some degree of control over the physical environment including ventilation temperatures lighting and privacy The health benefits productivity benefits and comfort and satisfaction from such controls are discussed below
Health Benefits
A field study of an air filtration system integrated into the office furniture system at the breathing zone in a Canadian government building found lower levels of symptoms and reduced absenteeism rates compared with a control floor that did not have the system (Hedge et al 1993)
A study of 11000 workers in the Netherlands by Preller et al (1990) found that absenteeism due to SBS is likely to be 34 lower when workers have control over their thermal conditions A field study of a furniture-integrated breathing zone system in a Canadian government office building found reduced absenteeism and lower levels of symptoms than a control floor in the same building without the system (Hedge et al 1993)
Productivity Benefits
Studies have documented increases in work performance on various tasks when occupants have some degree of control over temperature andor ventilation conditions at their workstations (Kroner et al 1992 Wyon 1996) Kroner et al (1992) used organizational performance data to assess the impact of personal control over temperature and ventilation at the workstation level and concluded that the control system increased productivity by 3
Drawing on a review of research on indoor air quality and thermal conditions Wyon (1996) estimated that providing workers with temperature control of just three degrees (plus or minus) would result in performance increases of 7 for typical clerical tasks 27 for logical thinking tasks 3 for skilled manual work and 86 for very rapid manual work
A large-scale office study in England also shows that personal control over the environment (as measured by a summary of ratings of perceived control over lighting noise temperatures and ventilation) was one of four key factors affecting occupantsrsquo perceived productivity at work (Leaman and Bordass 2001) Of these controls the most important was control over noise and the least important was control over lighting The authors also conclude that personal control is less important to workers when ambient conditions are comfortable and when building managers respond promptly to discomfort complaints
F-3
Comfort and Satisfaction
There is evidence that people are more tolerant of conditions the more control opportunities they have regardless of whether they choose to use the control (Leaman and Bordass 2001) Overall comfort and satisfaction also increases with personal control over ventilation and temperatures (Kroner et al 1992 Brager and deDear 2000)
Thermal Conditions
The literature on thermal comfort in buildings is voluminous (for instance see deDear et al 1993) No attempt is made here to provide a detailed review of this research much of which focuses on comfort Key findings from the literature show the following
bull Thermal discomfort is common in buildings bull Temperature conditions influence symptoms associated with SBS bull Performance impacts of thermal conditions depend on the nature of the tasks as well as on
personal factors
The health benefits productivity benefits and comfort and satisfaction from thermal conditions in buildings are discussed below
Health Benefits
Elevated temperatures are associated with increases in illness symptoms (Wyon 1996 2000) As researchers systematically increased indoor temperatures from 68ordmF to 762ordmF they found increased incidents of headache and other SBS symptoms Wyon (1996) also reports increased incidence of headache and fatigue as indoor temperatures increase from 68oF to 76oF At 76oF 60 of the workers experienced headache compared with 10 at 68oF
An extensive review of the epidemiological literature found that dampness (a thermal comfort factor) in buildings increases the risks of respiratory symptoms (cough wheezing and asthma) as well as other symptoms such as tiredness headache and respiratory infections (Bornehag et al 2001) Unfortunately the studys data are from worker surveys and do not include actual moisture levels or sources of the problem
Performance Benefits
Although discomfort is believed to negatively affect productivity the relationship is complex and is related to the nature of the work itself time of day and personal factors such as pre-existing medical conditions (Wyon 1996 2000) For instance performance on creative and memory tasks is higher when temperatures are slightly elevated However performance decreases on tasks requiring concentration and logical thinking tasks when temperatures are slightly elevated Performance on these types of tasks is better when temperatures are slightly cool
Comfort and Satisfaction
Numerous studies in the United States and elsewhere have consistently shown high levels of dissatisfaction and high variability in comfort for any given thermal condition (Heerwagen and Diamond 1992 Leaman and Bordass 2001) Given the high range of variability in comfort the ability to control temperatures and ventilation at the workstation level may be the single most effective way of increasing thermal comfort (Wyon 1996)
F-4
In a study of the costs of dealing with discomforts Federspiel (2000) estimates that efforts to increase comfort could result in a 12 decrease in labor costs of responding to complaints His data show that it takes 14 hours on average to diagnose a hot complaint and 17 hours to diagnose a cold complaint His data also suggest that complaints are not due to differences among individuals but rather to HVAC faults or poor control performance
Daylight and Views
It has long been known that people prefer to be in spaces with windows and daylight (Collins 1975) However it is only recently that researchers have begun to investigate the health and productivity impacts of daylight and views The following summarizes the research on daylight and views
bull Daylight and sun penetration may have positive benefits on health bull The benefits of views depend to a large extent on the view itself (eg degree of naturalness and
distance of the view) bull Although there is little evidence for direct impacts on work performance window views have
been found to influence a number of mental processes that are associated with performance on complex cognitive tasks
The health benefits productivity benefits and comfort and satisfaction from daylight and views in buildings are discussed below
Health Benefits
A field study of lighting conditions in a government office building in England found that headache incidence decreased significantly with increased access to daylight (Wilkins et al 1989) People who suffer from Seasonal Affective Disorder (SAD) may also benefit from access to daylight Because people with SAD prefer more brightly lighted spaces than people who do not suffer from seasonal variation in mood and well-being being adjacent to a window where light levels are higher than interior spaces may have therapeutic effects (Heerwagen 1990) Although daylight design generally tries to reduce or eliminate the penetration of direct sunlight into buildings a modest level of sunlight (sun spots) may be beneficial to health and well-being
Two studies are cited in a report prepared by Johns Hopkins researchers on the connection between the built environment and patient outcomes (Rubin et al 1998) One study compared the length of stay for 174 patients with depression who were randomly assigned to a sunny or dull hospital room (Beauchemin and Hays 1996) Those in the sunny rooms stayed an average of 169 days compared with 195 days for patients in the rooms without sun The results held true regardless of season Another healthcare study cited in the Johns Hopkins report found that differences in exposure to natural sunlight affected the serum OH-D concentrations in long-term geriatric patients (Lamberg-Allardt 1984) There is also reason to believe that access to high daylight levels and sunlight for at least part of the day would be beneficial to persons suffering from SAD (Heerwagen 1990) Daylight and sunlight patches indoors have been found also to enhance emotional functioning as long as the sunlight does not increase glare or temperature discomfort (Boubekri et al 1991 Leather et al 1998)
Physical benefits of windows and views (especially views of nature) include stress reduction and recovery from illness In a study of patients recovering from hospital surgery Ulrich (1984) found that those who had a view of a natural landscape recovered faster and spent fewer days in the
F-5
hospital than matched control patients who viewed an adjacent wing of the hospital Although similar studies have not been conducted in work settings other research cited above clearly indicates that nature views have positive impacts on stress recovery In a field study of office workers Kaplan (1992) found that workers with window views of nature felt less frustrated and more patient and reported more overall life satisfaction and better health than workers who did not have visual access to the outdoors or whose view consisted of built elements only When deprived of windows people report more negative moods and a loss of contact with the outdoor world especially loss of connection to time and weather (Collins 1975 Heerwagen and Orians 1986)
Productivity Benefits
The only current data available on the impact of daylight and views on performance are from a large-scale study of the link between daylight design and test performance in schools (Heschong-Mahone Group 1999) The study found that children scored higher on test scores in schools with the best daylight design However many other building factors may have influenced these outcomes Thus the results should be taken as preliminary until additional research support is found
Studies of window views show that people perform better on tasks requiring focused attention (such as proofreading) when they have views of nature compared with views of buildings or windowless conditions (Hartig et al 1991) Window views may be especially effective in providing micro rest breaks of a few minutes or less Micro rest breaks have positive impacts on performance and attention (Zijlstra et al 1999)
Although full spectrum electric light is widely believed to have benefits similar to daylight no scientific evidence exists for this claim A major review of the research in this area by Veitch and McColl (1994) found no indications that full spectrum fluorescent lighting was associated with any increases in psychological well-being health or productivity
Comfort and Satisfaction
Numerous office studies in the United States England and Europe have found increased satisfaction levels with increases in daylight (Collins 1975 Heerwagen and Diamond 1991 Leaman and Bordass 2001) Although most research on windows has focused on views the size and location of windows also matters A series of studies by Butler and Biner (1989) shows that the preferred size shape and location of windows are functions of the specific space under consideration People prefer larger windows in settings for relaxation and smaller windows in settings where privacy is desired (eg bedrooms and bathrooms)
Potential Problems with Daylight and Windows
Although windows and daylight have numerous benefits as identified above they also have the potential to create discomfort and distractions when not properly designed Office studies in the United States and elsewhere have consistently found that workers are bothered by glare from windows and this is especially problematic for computer work These problems are resolved to a great extent using flat screen computers and indirect lighting (Hedge et al 1995) The absence of sunlight controls also increases the potential for heat stress Heat reflective glazing and shading devices do not fully resolve these difficulties (Heerwagen and Diamond 1991 Leaman and Bordass 2001) Furthermore for facilities with 24-hour operation schedules the lack of daylight and views may lead to feelings of inequitable distribution of amenities among night-time workers who do not have the same access to daylight and views (Heerwagen and Wise 1998)
F-6
Other Sustainable Design Practices
Although interior design strategies are not included in the current version of the Leadership in Energy and Environmental Design (LEEDtrade) rating system practitioners are beginning to specify more open plan environments as a way to reduce materials especially dry wall and to make daylight and views more broadly available for workers This section reviews research on open plan layouts and partitions
Open Plan Layouts and Partitions
Open plan dense workspaces present serious challenges for sustainable design On the positive side the open plan flexible condensed workstation layout reduces the overall use of resources allows more efficient use of space reduces surfaces that collect dust and allows daylight to penetrate deeper into the space It is also evident that open plan design aids communications and information flow that are so important in many work environments On the negative side however an open plan design increases the potential for distractions and interruptions that may reduce productivity for complex cognitive work as well as the potential for more rapid transmission of illness These issues are discussed in more detail below
Comfort and Satisfaction
Open plan layouts especially those with low partitions facilitate access to daylight and views Workers in open plan spaces that facilitate access to windows are more satisfied overall with lighting and with the work environment (Collins 1975 Heerwagen and Diamond 1991) Open plan workspaces also increase peoplersquos awareness information exchange and general communication levels (Heerwagen and Hunt 2002) Of the factors that contribute to situation awareness visible activity is considered to be the most important (Gutwin and Greenberg 2001) High visual access aids the ability to see others
Productivity
Szilagyi and Holland (1980) found that increased workstation density increased satisfaction and information exchange and facilitated tasks for new employees and secretarial staff but not for managers and for workers with many years of tenure The researchers suggest that when employees are relatively new they may be using the surrounding social environment as a source of information and feedback about how to successfully accomplish their jobs For workers whose tasks are repetitive and cognitively simple the open plan environment may have positive performance impacts Researchers hypothesize that the beneficial effects are due to social facilitation that may increase stimulation and effort associated with having their work on view to others (Geen and Gange 1977)
Research has also shown that ready access to others in a work group can aid spontaneous problem solving and information flow and reduce the time to market for some products (Teasley et al 2000) However the productivity benefits are clearly related to the specific nature of work and cannot be generalized to all contexts because of the potential for serious increases in distractions and loss of privacy
F-7
Problems with the Open Plan Environment
The benefits of open plan densely packed workspaces need to be carefully balanced with the potential negative impacts on both psychological factors and physical health Specifically research shows the following potential problems
bull Physical health Increased density of workstations and open plan environments increase the overall environmental load of airborne microbials and thus facilitates transmission of illness symptoms (Fisk 2001) Open plan spaces also lead to increased distractions Distractions often lead to increased psycho-physiological activation indicating that some increased effort is needed to maintain performance (Tafalla and Evans 1997) For complex tasks the increases in effort may be substantial enough to produce physiological stress
bull Comfort and satisfaction Open plan spaces make it more difficult for workers to have private conversations (Sundstrom et al 1982) This impedes the ability to develop close work relationships and can also lead to increased feelings of stress and dissatisfaction (Gabarro 1987) There is little evidence that providing small private booths compensates for the loss of privacy at the workstation
bull Productivity Open plan workspaces increase distractions that are especially detrimental to complex cognitive tasks Distractions interfere with working memory and analytical thought processes Distractions are also more of a problem for introverts than for extraverts (Morgenstern et al 1994 Belojevic et al 2001) Belojevic et al found that concentration problems and fatigue were more pronounced for introverts working in noise compared with quiet conditions Researchers believe these results are due to differences in psycho-physiological activity Introverts have a more pronounced reaction to noise and this may lead to heightened arousal which interferes with performance on complex mental processing tasks (Eysenck 1982 Stansfeld and Shine 1993) Furthermore extroverts regularly select higher noise intensities as optimal compared with introverts (Geen 1984) These results suggest that design and location of people in settings should take into account these personality differences Introverts may need to have more enclosure or to be located farther away from sources of distracting noise
F-8

The Business Case for
SUSTAINABLE DESIGN IN FEDERAL FACILITIES We at the Department of Energy believe there can be a sound business
case for the use of sustainable design options and we encourage all
Federal agencies to incorporate these options whenever possible
ndash David Garman
Assistant Secretary
Office of Energy Efficiency and Renewable Energy
U S Department of Energy
The Federal government has many leaders in this field already and
together we can demonstrate that a sustainable building is healthier
more environmentally sound operationally and economically viable
and the way we should be doing business
ndash John L Howard Jr
Federal Environmental Executive
October 2003
On the cover National Institutes of Health Louis Stokes LaboratoriesBuilding 50 Bethesda MD Sandia National Laboratories Process and Environmental Technology Laboratory Albuquerque NM Zion National Park Visitors Center Springdale UT
Preface
Sustainable design is becoming a mainstream movement in the US architecture and construction industry and US government agencies have been both joining that movement and leading the way In the summer of 2001 the US Department of Energyrsquos Federal Energy Management Program (FEMP) and the US Navy initiated the Interagency Sustainability Working Group as a forum for Federal agency representatives located in the Washington DC area to share sustainable design experiences and information The government members of this group include
bull Coast Guard bull Department of Agriculture bull Department of Commerce
National Oceanic and Atmospheric Administration
bull Department of Defense Department of the Air Force Department of the Army Army Corps
of Engineers Army Environmental Center
Department of the Navy Naval Facilities Engineering Command
bull Department of Energy Lawrence Berkeley National Laboratory National Renewable Energy Laboratory Oak Ridge National Laboratory Pacific Northwest National Laboratory
bull Department of the Interior Fish and Wildlife Service National Park Service
bull Department of State bull Environmental Protection Agency bull Executive Office of the President
Office of the Federal Environmental Executive
Office of Management and Budget White House Task Force on Waste
Prevention and Recycling bull General Accounting Office bull General Services Administration bull Indian Health Service bull National Aeronautics and Space
Administration bull Postal Service bull State of California State and Consumer
Services Agency bull Tennessee Valley Authority
The group expressed a strong interest in communicating the business case for sustainable design In response FEMP initiated the effort documented in this report which focuses on providing solid arguments supported by defensible data to further justify the application of sustainable design principles in Federal agency construction projects Sustainable design is a natural extension of FEMPrsquos established role as an energy-efficiency renewable-energy and water-efficiency advocate in the Federal sector
Although the analysis in this document was targeted toward US government facilities the findings also have relevance to private-sector architects and engineers developers and contractors and building owners In a recent survey conducted by the US Green Building Council members of the Council said that better understanding the costs and benefits of sustainable design was a high priority Architectural and engineering firms that promote sustainable design have also expressed a need to communicate the business case
This document is a technical resource report containing cost information research results case studies and other quantitative and qualitative information pertaining to the business case for sustainable design It serves as a companion document to another shorter publication that summarizes the business case for sustainable design and construction Both documents can be found on the FEMP website httpwwweereenergygovfemp
iii
Executive Summary
What is Sustainable Design and Construction
Sustainability means choosing paths of social economic and political progress that meet the needs of the present without compromising the ability of future generations to meet their own needsi The concept of sustainability includes three key goals sometimes called the triple bottom line
bull Environmental stewardship ndash Protecting air water EEccononomomiicc PPrrososppeerriittyy land and ecosystems and conserving resources including fossil fuels thus preserving the Earthrsquos resources for future generations
bull Social responsibility ndash Improving the quality of life for individuals communities and society as a whole
bull Economic prosperity ndash Reducing costs adding value and creating economic opportunity for individuals organizations and communities
EEnnvviirroonnmmenenttaall SSttewewaarrddsshhiipp SSocociiaall RReessppononssiibbiilliittyy When designers apply these concepts to architecture they take a holistic look at all aspects of the design to minimize the use of energy materials and natural resources as well as the environmental impacts of the building and site Designers also try to maximize the quality of life inside the building and its positive effects on the surrounding community The principles of sustainable building design and construction include optimizing site potential minimizing energy consumption protecting and conserving water using environmentally preferable products enhancing indoor environmental quality and optimizing operational and maintenance practicesii
The Business Case for Sustainable Design and Construction
Many Federal designers and planners embrace the goals of environmental stewardship and social responsibility but capital budget constraints often stand in the way of smart design choices Federal managers need hard facts and figures to help articulate the business case for sustainable design Without clear information about the lifecycle costs and other benefits of design alternatives Federal decision-makers are likely to continue favoring traditional design choices
This document serves as a resource for people working on Federal and private-sector sustainable construction projects By providing significant financial evidence from research and case studies this document can help Federal designers make the case that sustainable design is a smart business choice
Sustainable Design and Construction in the Federal Sector
The Federal government has been leading by example in the field of sustainable design Many Federal agencies have developed policies to promote sustainable design concepts and their buildings are achieving prestigious silver and gold ratings from the Leadership for Energy and Environmental Design (LEEDtrade) rating system developed by the US Green Building Counciliii Federal laws and Executive Orders have established goals and provide guidance to building designers in the Federal sector for example government agencies are required to apply sustainable design principles and install energy and water conservation measures that have a payback period of less than 10 years Laws and Executive Orders also mandate that Federal managers use lifecycle cost analysis for all projects This approach supports the use of many sustainable design features because the annual cost savings from these features over their lifetimes can offset their sometimes-higher first costs However because capital budgets are usually preset for Federal construction projects government-building designers sometimes find it difficult to increase the capital budget to include the incremental first costs of some sustainable design features Nevertheless Federal agencies have found many creative ways to stay within their capital budgets while making their buildings green In fact sustainable design does not have to increase the cost of constructing a facility and in some cases may actually lower first costs as well as operating costs
v
The Benefits of Sustainable Design and Construction
A growing body of evidence shows that sustainable buildings reap rewards for building owners and operators building occupants and society The business case for sustainable design can be described using the triple bottom line framework The three categories of benefits are shown in the box below
At Zion National Park Visitors Center in Utah designers moved exhibit space outdoors and introduced natural cool-ing and lighting The building cost 30 less to build and reduces energy cost by 70 compared with a conventional facility that just meets code
When designers of the Penn-sylvania Department of Envi-ronmental Protectionrsquos Cambria Office Building first proposed an upgrade to triple-glazed double low-e windows the developer balked at the $15000 increase in cost However he was won over when the designers were able to demonstrate that the upgrade would allow them to eliminate the perimeter heating zone for a savings of $15000 downsize the heat pumps for another $10000 savings and increase floor space because of the smaller equipment and ducts for a gain of $5000 in rent
Laboratories are energy-intensive The Process and Environmental Technology Laboratory at Sandia National Laboratories in New Mexico spent just 4 more in their capital budget for energy-efficient technolo-gies saving enough energy to pay off that investment in about three years with continued savings for many years to come
Economic Benefits bull Lower (or equal) first costs bull Decreased annual energy costs bull Reduced annual water costs bull Lower maintenance and repair
costs bull Better productivity and less
absenteeism bull Indirect economic benefits to the
building owner eg lower risk ease of siting and improved image
bull Economic benefits to society eg decreased environmental damage costs lower infrastructure costs and local economic growth
Social Benefits bull Health comfort and well-
being of building occupants bull Building safety and security bull Commmunity and societal
benefits
Environmental Benefits bull Lower air pollutant emissions bull Reduced solid-waste
generation bull Decreased use of natural
resources bull Lower ecosystem impacts
Economic Benefits
Economic benefits of sustainable design can include both capital and operating cost savings as well as benefits such as productivity improvements and lower permitting costs derived indirectly from the very environmental and social benefits that sustainable buildings provide To realize the full benefits sustainable design must begin at the conceptual stage of a project and should be developed using an interdisciplinary team that examines integration of and tradeoffs among design features When the team chooses to include sustainable features often they can downsize or eliminate other equipment resulting in lower ( or equal) first costs for the sustainable design Renovating older buildings eliminating unnecessary features avoiding structural over-design and construction waste and decreasing the size of site infrastructure such as parking lots roads and sewers can also reduce first costs while providing environmental and social benefits Some sustainable features such as recycled carpet concrete with fly ash and no-water urinals can cost less than their traditional counterparts
Sustainable design also reduces annual operating costs Case studies show that energy use can be reduced by as much as 70 by incorporating energy-efficient and renewable energy systems with payback periods below 10 yearsiv Water-saving devices such as low-flow faucets and showerheads and no-water urinals can reduce water consumption significantly (eg from 25 gallons per minute to 10 gallons per minute for low-flow faucets) Payback periods for these devices are typically short ndash from immediate for no-water urinals to less than 3 years for low-flow showerheads
vi
Another key tenet of sustainable design is increased durability and ease of maintenance Concrete with fly ash is more durable than normal concrete potentially decreasing future repair costs and low-emitting (low-VOC) paint is also reported to be more durable than regular latex paint Sustainable landscaping typically decreases maintenance costs (eg for lawn care fertilizers and irrigation) and has a short payback period (eg less than a year)
Use of raised floors and underfloor HVAC and telecommunications systems as well as moveable wall partitions can reduce the churn cost (cost to reconfigure space and move people within the building) by over $2000 per person moved Given that an estimated 27 of people in a government building move each year reducing churn costs can save over $1 millionyr in a large building with 2000 workstations
Personnel costs in the US government far exceed construction energy or other annual costs Sustainable buildings potentially lower absenteeism and increase productivity A recent study estimated potential annual cost savings on the order of $25000 per 100 employees resulting from a one-time investment in better ventilation systems of $8000 per 100 employeesv Another study estimated that the value of improved productivity (including lower absenteeism) of office workers could be as high as $160 billion nationwidevi
Other indirect and longer-term economic benefits to the building owner include the following
bull Better worker retention and recruitment The environmental image associated with an employer that builds a sustainable building and the improved indoor environment within the building may reduce turnover improve morale and help create a more positive commitment to the employer as well as lower recruiting and training costs
bull Lower cost of dealing with complaints A recent study showed that increased occupant comfort could result in a 12 decrease in labor costs for responding to complaintsvii
bull Decreased risk liability and insurance rates Some insurance companies offer lower rates for buildings with energy-efficiency and other sustainable features Sustainable buildings also reduce the risk of liability from sick building syndrome and natural disasters
bull Greater building longevity If buildings do not have to be demolished and replaced the governments construction costs will be lower over the long run Some strategies for prolonging building use include selecting durable materials designing photovoltaic-ready roofs building foundations that will accept additional floors later and designing with classic and regionally appropriate styles
When workers at the West Bend Mutual Insurance Company moved into their new building with personal controls for their workstations and other sustainable features productivity increased 16
Some insurance companies offer insurance premium credits when the insured implement selected energy-savings strategies For example the nationrsquos largest professional liability insurer ndash DPIC ndash offers 10 credits for firms that practice commis-sioning and Hanover Insur-ance offered 10 credits for earth-sheltered or solar build-ings on the basis that their fuel-based heating system has fewer operating hours thus reducing fire risks
A study of the new headquarters for the Herman Miller furniture company indicates that the new sustainable building had positive impacts on occu-pants well-being job satisfaction feelings of belonging and other aspects of work life that affect indivi-dual job performance Productivity measured by the companyrsquos own total quality metrics increased when employees moved into the new space
vii
bull Better resale value In 1998 the US General Services Administrashytion sold over 1500 properties at a total selling price of about $250 million Investing in sustainable design features can considerably increase a propertys resale value because it lowers annual costs and makes a building more profitable for the new owner
bull Ease of siting Gaining early support from a community can greatly speed up approvals for a project For example the
Picture Kahujku Ranch Hawaii developers of Central Market a store in the town of Poulsbo Washington say that their decision to enhance an onsite wetland Although some would say that some-
thing like a unique ecosystem is and offer it to the city as a park not only reduced maintenance priceless certain groups within costs but also avoided project delays by generating strong American society do place economic community supportviii value on and are willing to pay for environmental and natural resources Benefits of sustainable design accrue not only to the building owner but For instance the Nature Conservancy
also to society at large For example energy-efficiency measures reduce is planning to invest $1 billion to save 200 of what they call the worlds ldquoLast public costs from pollution damages Studies estimate the costs to society Great Places of air pollutant emissions to be $100 to $7500 per metric ton for sulfur
dioxide (SO2) $2300 to $11000 per metric ton for nitrogen oxides (NOx) and $6 to $11 per metric ton for carbon dioxide (CO2)ix Sustainable development may also reduce taxpayerrsquos costs for municipal infrastructure (eg decreased need for landfills watersewage treatment plants and roads) and may foster regional economic growth through emerging businesses associated with sustainable buildings
Social Benefits
Sustainable buildings can improve the health and well-being of building occupants Sick building syndrome symptoms can be reduced by increased ventilation personal control over thermal conditions improvements in ventilation system maintenance and cleaning reduced use of pesticides and good maintenance Studies also show that building features such as stable and comfortable temperature operable windows views out usable controls and interfaces and places to go at break time have positive psychological and social benefits The benefits include reduced stress improved emotional functioning increased communication and an improved sense of belonging
Certain features of sustainable buildings can also foster occupant safety and security For instance improving control of building air distribution systems ndash including periodic calibration of sensors
ldquoIn the process of renovating the Pentagon weve found that sev-eral of the force protection mea-sures we are taking to protect the Pentagon against terrorist attacks are complementary to our sus-tainable construction efforts These are all examples of building security and energy efficiency working hand in handrdquo
Teresa Pohlman Special Assistant for Sustainable Construction US Department of Defense
adjustment of dampers and other system maintenance ndash is essential for rapid response to an emergency and contributes to energy-efficient operation under normal conditions Tighter building envelopes have the dual benefits of reducing energy losses from infiltration and making it easier to pressurize a building thus reducing entry of an airborne hazard that was released outside
Buildings that incorporate sustainable features also become models for others to follow and can improve the communities in which they are located For example the Herman Miller Corporationrsquos Green House regularly provides tours and outreach programs for design and construction professionals as well as for businesses that are planning their own sustainable buildings Communities may experience better environmental and aesthetic quality of life and less traffic congestion (when sustainable buildings make public transportation and bicycle storage accessible)
viii
Environmental Benefits
Many sustainable design strategies reduce disturbance of the natural environment Sustainable buildings emit lower levels of air pollutants and CO2 emissions due to decreased energy use achieved through energy-efficient design use of renewables and building commissionshying Waste reduction and reduced strain on landfills can be achieved by storing and collecting recyclables managing construction waste At the US Environmental Protection using recycled-content materials eliminating unnecessary finishes Agency campus in Research Triangle and using standard-sized or modular materials and durable products Park the design team justified the choice
to spend considerably more to build an Sustainable siting preserves woodlands streams and other natural aboveground garage instead of ground-
areas Using rapidly renewable materials (bamboo cork wheat straw level paved parking lot The team placed boards etc) and certified wood decreases the use and depletion of a high value on the 15 acres of natural long-cycle renewable materials and fosters better forest management woodlands that would have been
destroyed by the paved lot and biodiversity
The Costs and Benefits of Sustainable Design A Prototype Building Analysis
During this study analyses were conducted to evaluate the cost savings associated with various sustainable building features in a prototype two-story 20000-ft2 building hypothetically located in Baltimore Marylandx The total construction cost of the base- case building to
which the sustainable building was compared was estimated to be about $24 million The cost implications of adding sustainable features to this building were modeled using Energy-10 and DOE-2 supplemented by vendor quotes and other cost estimation techniques The results are summarized in Table S-1 which also shows which sections of the report discuss each feature
Although some features such as energy efficiency commissioning sustainable landscaping and storm-water management systems added about $47000 (2) to the original first cost of the building the annual cost savings associated with the sustainable features are significant Annual energy and water costs were reduced by $5900 and annual maintenance and repair costs for the landscaping and parking lot were reduced by $3600 compared with costs for the base-case building A reduction in churn costs (by using a raised floor) could lower annual costs by an additional $35000xi When the societal benefits of reducing air pollution are factored in the total annual cost reduction could be about $47000 comshypletely offsetting the first cost increase in the initial year of operation The first cost increase potentially could be further offset by using sustainable materials such as recycled carpet and concrete with fly ash
Building a Stronger Business Case for Sustainable Design and Construction
This document presents a sound business case for incorporating the principles of sustainability in the design and construction of Federal facilities In November 2002 the Federal Energy Management Program hosted a workshop to explore the information that would be needed to make this case even stronger The participants concluded that collecting data on a wide range of projects using consistent protocols for data collection reporting and use would help to more definitively assess the costs of sustainable building projects They also highlighted the need to develop a better understanding of the health well-being and other benefits to building occupants Because worker productivity is so important the workshop participants called for a better understanding of how productivity can be measured especially for knowledge workers who do not conduct routine tasks that are easily quantified The participants concluded that further dialogue is needed on methods to better understand the strategic business advantages of sustainable design
ix
Table S-1 Summary of First Costs and Annual Cost Savings of Sustainable Features in the Prototype Building Analysis i
Feature First Cost Change
Annual Cost Change Explanation
Energy-efficiency measures
+$38000 -$4300 Results of energy simulation models showed that a 37 reduction in annual energy costs could be achieved by a combination of energy-efficiency measures at a total first-cost increase of about 16 of the building cost The simple payback was estimated to be 87 years See Section 22
Commissioning +$4200 -$1300 Commissioning costs about 2 of the heating ventilation and air conditioning plus control system cost It can yield a benefit on the order of 10 of annual energy costs for a payback period of about 32 years See Section 22
Water-savings measures
-$590 -$330 No-water urinals can have lower first costs than their traditional counterparts because less piping is required thus lowering first costs for the entire package of water-savings measures All of the water-savings technologies analyzed have favorable economics with payback periods ranging from 03 to 28 years See Section 23
Sustainable landscaping and stormwater management
+$5600 -$3600 Landscaping using natural grasses and wildflowers instead of traditional turf and a sustainable stormwater management system using porousndashsurface parking lot paving instead of asphalt have payback periods of 08 and 56 years respectively See Section 24
Subtotal ii +$47000 -$9500 5-year payback
Raised floor system and moveable walls
Negligible iii -$35000 A raised floor system and moveable wall partitions instead of traditional systems would decrease churn costs significantly with very little additional first costs See Section 25
Sustainable materials
-$51000 NA Use of various sustainable materials (concrete with slag content recycled carpet low-emitting paint and certified wood doors) reduced the prototype buildings first cost by up to $260ft2 lowering the buildingrsquos cost by about 2iv
See Section 21
Social cost reduction of air pollution reduction
v -$2000 Annual reductions in emissions from improved energy performance were estimated to be 0016 tons of SO2 008 tons of NOx and 107 tons of CO2 which might be valued as high as $1090 for SO2 $800 for NOx and $107 for CO2 By including the sum of these societal cost reductions in the payback calculation for the energy measures the simple payback period would decrease from 87 to 60 years See Section 281
Total -$3800 -$47000
i Values were rounded to two significant digits ii The costs for features included in the subtotal are more certain than those for the features in the rows below iiiLower cost of air distribution systems electrical receptacles and other equipment usually offsets the higher cost of the raised floor itself iv Sometimes the costs of sustainable materials are higher than traditional ones so the cost reduction for sustainable materials shown in this table should be viewed as less certain than the other values v The cost is included in energy-efficient measures
x
Executive Summary Endnotes
i Brundtland Commission 1987 Our Common Future United Nations World Commission on Economic Development ii Principles are from the Whole Building Design Guide developed by a consortium of US government agencies See httpwwwwbdgorg
iii LEED has four ratings ndash platinum gold silver and certified The rating for a building is determined by adding the number of points the building achieves through its sustainable features See httpwwwusgbcorg
iv US DOE High Performance Buildings website See URL httpwwweereenergygovbuildingshighperformance
v Milton DK PM Glencross and MD Walters 2000 Risk of Sick Leave Associated with Outdoor Air Supply Rate Humidification and Occupant Complaints Indoor Air 2000 10212-221
vi Fisk WJ 2001 Estimates of potential nationwide productivity and health benefits from better indoor environments an update In Indoor Air Quality Handbook eds JD Spengler JM Samet and JF McCarthy McGraw-Hill New York
vii Federspiel C 2000 Costs of Responding to Complaints In Indoor Air Quality Handbook eds JD Spengler JM Samet and JF McCarthy McGraw-Hill New York
viii Rocky Mountain Institute website httpwwwrmiorgsitepagespid221php
ix National Research Council 2001 Energy Research at DOE Was It Worth It National Academy Press Washington DC p29
x Baltimore was chosen because it has both a moderately high heating and cooling load A moderately small office building was chosen because that size represents the 75th percentile within the current stock of office buildings in the US government and a similarly large percentage of private-sector buildings The base-case building used standard construction and met the ASHRAE 901-1999 standard for energy efficiency (this is also the baseline for LEED energy-efficiency credits)
xi This summary uses the conservative (low) end of the cost-savings range that was estimated
xi
Acknowledgements
The Federal Energy Management Program (FEMP) would like to acknowledge many organizations and individuals who contributed to this resource document
The work was conducted under the direction of Beverly Dyer and Anne Sprunt Crawley of FEMP Marylynn Placet of Pacific Northwest National Laboratory (PNNL) served as the Principal Investigator Other people who made contributions to analysis and writing of the report include David Winiarski Judith Heerwagen Steve Shankle Kate McMordie-Stoughton Kimberly Fowler John Hail Bing Liu Dave Hunt Donna Hostick and Kathy Poston of PNNL Andrew Walker of the National Renewable Energy Laboratory Jeffrey Harris William Tschudi and Evan Mills of Lawrence Berkeley National Laboratory David Zimmerman Tennessee Valley Authority (TVA) Joseph Fiksel of Eco-Nomics LLC and James Toothaker (consultant)
Support for development of various case studies was provided by Ralph Wrons Sandia National Laboratories Steve Dorer Phil Wirdzek Bob Beane Christopher Long and Peter Shubert US Environmental Protection Agency Roy Sieber ERG Ken Trychta Argonne National Laboratory James Toothacker consultant and Janice Lin PowerLight Corporation
Vicki Lee of Lee Scientific Communications in Richland Washington served as the editor Carl Costello and Jennifer Landsman-Ayres of Greening America developed a shorter version of this report (available on the FEMP website httpwwweereenergygovfemp) and provided support for graphics in this longer resource document
Members of the Interagency Sustainability Working Group offered useful review and comments on early versions of the report Arun Jhaveri US Department of Energy-Seattle Jonathan Herz and Don Horn US General Service Administration Fredrik Wiant Army Corps of Engineers Cathy Berlow and Alison Kinn US Environmental Protection Agency David Zimmerman TVA John Moresko US Department of the Interior Michael Chapman Navy Facilities Command Anila Strahan National Aeronautic and Space Administration Jeffrey Harris Rick Diamond and Satish Kumar Lawrence Berkeley National Laboratory Andrew Nicholls PNNL and staff members at Oak Ridge National Laboratory
This report is dedicated to the memory of Fredrik (Rik) Wiant an active member of the Interagency Sustainability Working Group who demonstrated his dedication to sustainable design principles during his career at the Army Corps of Engineers
xiii
Acronyms and Initialisms
AC air changes ACH air changes per hour ASHRAE American Society of Heating Refrigerating and Air Conditioning Engineers BEES Building for Environmental and Economic Sustainability BGE Baltimore Gas and Electric Company BIDS Building Investment Decision Support CFC chlorofluorocarbon cfm cubic feet per minute CO2 carbon dioxide COP coefficient of performance CSC Customer Service Center DEP Department of Environmental Protection DOE US Department of Energy DWP Department of Water and Power (Los Angeles) ECM energy conservation measure EE energy efficient EER energy-efficiency ratio EPA US Environmental Protection Agency EPAct Energy Policy Act of 1992 ESPC Energy Services Performance Contract FEMP Federal Energy Management Program gpf gallons per flush gpm gallons per minute GSA US General Services Administration HCFC hydrofluorocarbon HVAC heating ventilation and air conditioning IFMA International Facility Management Association kWh kilowatt-hour Ls literssecond LEEDtrade Leadership in Energy and Environmental Design NERL New England Regional Laboratory NOx nitrogen oxides NOI net operating income NPDES National Pollutant Discharge Elimination System NREL National Renewable Energy Laboratory OampM operations and maintenance PECI Portland Energy Conservation Inc PNNL Pacific Northwest National Laboratory ppm parts per million psi pounds per square inch PV photovoltaic RCSOB Rachel Carson State Office Building SAD Seasonal Affective Disorder SBS sick building syndrome SCROB South Central Regional Office Building SO2 sulfur dioxide TQM Total Quality Management
xv
TVA Tennessee Valley Authority USPS US Postal Service UV ultraviolet VOC volatile organic compound WBDG Whole Building Design Guide
xvi
Contents
Preface iii
Executive Summary v
Acknowledgements xiii
Acronyms and Initialisms xv
1 Introduction 1-1
11 What is Sustainable Design and Construction 1-1 12 Sustainable Design and Construction in the Federal Government Sector 1-3 13 A Framework for Understanding the Benefits of Sustainable Design and
Construction 1-4
2 The Economic Benefits of Sustainable Design 2-1
21 Lower (or Equal) First Costs 2-1 22 Annual Energy Cost Savings 2-7 23 Annual Water Cost Savings 2-12 24 Lower Costs of Facility Maintenance and Repair 2-16 25 Lower Churn Costs 2-17 26 Lower Absenteeism and Improved Productivity2-20 27 Other Economic Benefits to the Building Owner 2-27 28 Indirect Economic Benefits to Society 2-32
3 The Social Benefits of Sustainable Design 3-1
31 Better Health of Building Occupants 3-1 32 Improved Comfort Satisfaction and Well-Being of Building Occupants 3-4 33 Occupant Safety and Security 3-5 34 Community and Societal Benefits 3-8
4 The Environmental Benefits of Sustainable Design 4-1
41 Lower Air Pollutant and Greenhouse Gas Emissions 4-2 42 Reduced Volumes of Solid Waste4-5 43 Decreased Use of Natural Resources and Lower Ecosystem Impacts 4-7
5 Strengthening The Business Case Research and Data Needs 5-1
6 References 6-1
List of Appendixes
Appendix A Matrix of Benefits of Sustainable Design A-1
Appendix B Energy and Construction Cost Estimates B-1
Appendix C A Sustainable Design Cost Study for the Johnson City Customer Service Center Tennessee Valley Authority (TVA) C-1
Appendix D Documentation of the Sustainable Siting and Water-Savings Features Included in the Prototype Building AnalysisD-1
xvii
Appendix E Documentation of the Sustainable Materials Features Included in the Prototype Building Analysis E-1
Appendix F Detailed Discussion of Research Studies on Occupant Health Comfort and Productivity F-1
List of Case Studies and Research Summaries
Case Study 2-1 Zion National Park Visitors Center Reduces Energy Consumption While Cutting Construction Costs 2-5
Case Study 2-3 US Environmental Protection Agency (EPA) Facility in Michigan
Case Study 2-4 Argonne National Laboratorys Central Supply Facility Reduces Costs
Research Summary 2-1 Pennsylvanias Department of Environmental Protection
Research Summary 2-3 Personal Environmental Controls at West Bend Mutual
Research Summary 3-1 Improved Ventilation Rates and Lower CO2 Concentrations
Research Summary 3-3 Energy-Efficiency Upgrades Offer Opportunities for
Case Study 4-2 Construction Waste Management and Other Recycling Measures Reduce
Case Study 2-2 Facility at Sandia National Laboratories Reduces Energy Costs2-11
Reduces Water Consumption by 80 2-14
Through Sustainable Landscaping 2-18
Estimates the Cost of Churn 2-21
Research Summary 2-2 Improved Indoor Air Quality Reduces Absenteeism Costs 2-23
Insurance Company Improve Worker Productivity 2-25
Reduce Illness Symptoms in Office Workers 3-3
Research Summary 3-2 Herman Miller Improves Worker Satisfaction and Productivity 3-6
Improved Building Security 3-10
Case Study 4-1 Post Office in Marina Del Rey Improves Air Quality 4-4
Costs and Waste at EPAs New England Regional Laboratory 4-6
Case Study 4-3 EPAs Campus Protected Natural Resources at No Additional First Cost 4-10
List of Figures
1-1 Triple Bottom Line Benefits of Sustainable Design 1-5
2-1 Energy-Efficiency Measures Examined in the Prototype Building Analysis 2-8
xviii
List of Tables
S-1 Summary of First Costs and Annual Cost Savings of Sustainable Features in the Prototype Building Analysis x
1-1 Benefits of Sustainable Design and Construction 1-7
2-1 Prototype Building Analysis Energy-Efficiency Features Reduce Annual Energy Costs by 37 2-8
2-2 Prototype Building Analysis Costs and Benefits of Energy-Efficiency Measures 2-9
2-3 Costs of Commissioning for New Construction 2-10
2-4 Prototype Building Analysis Cost Data for Water-Efficiency Features 2-12
2-5 Prototype Building Analysis Costs for Sustainable Siting Features 2-16
4-1 Examples of Environmental Impacts of Buildings 4-2
4-2 Emission Coefficients for Energy Consumption in Commercial Buildings4-3
5-1 Status of Business Case Information 5-2
5-2 Key Recommendations from Participants in the Sustainable Design Business Case Workshop 5-5
xix
A Strong Energy Portfolio for a Strong America
Energy efficiency and clean renewable energy will mean a stronger economy a cleaner environment and
greater energy independence for America By investing in technology breakthroughs today our nation can look
forward to a more resilient economy and secure future
Far-reaching technology changes will be essential to Americas energy future Working with a wide array of
state community industry and university partners the US Department of Energys Office of Energy Efficiency
and Renewable Energy invests in a portfolio of energy technologies that will
- Conserve energy in the residential commercial industrial government and transportation sectors
- Increase and diversify energy supply with a focus on renewable domestic sources
- Upgrade our national energy infrastructure
- Facilitate the emergence of hydrogen technologies as vital new energy carriers
THE OPPORTUNITIES
Biomass Program Using domestic plant-derived resources to meet our fuel power and chemical needs
Building Technologies Program Homes schools and businesses that use less energy cost less to operate and ultimately generate as much power as they use
Distributed Energy amp Electric Reliability Program A more reliable energy infrastructure and reduced need for new power plants
Federal Energy Management Program Leading by example saving energy and taxpayer dollars in federal facilities
FreedomCAR amp Vehicle Technologies Program Less dependence on foreign oil and eventual transition to an emissions-free petroleum-free vehicle
Geothermal Technologies Program Tapping the Earths energy to meet our heat and power needs
Hydrogen Fuel Cells amp Infrastructure Technologies Program Paving the way toward a hydrogen economy and net-zero carbon energy future
Industrial Technologies Program Boosting the productivity and competitiveness of US industry through improvements in energy and environmental performance
Solar Energy Technology Program Utilizing the suns natural energy to generate electricity and provide water and space heating
Weatherization amp Intergovernmental Program Accelerating the use of todays best energy-efficient and renewable technologies in homes communities and businesses
Wind amp Hydropower Technologies Program Harnessing Americas abundant natural resources for clean power generation
US Department of Energy
Energy Efficiency and Renewable Energy Bringing you a prosperous future where energy is clean abundant reliable and affordable
Federal Energy Management Program
For more information or to order materials contact the FEMP Help Desk at
800-363-3732 or visit us at
wwweereenergygovfemp
October 2003
US Department of Energy
Energy Efficiency and Renewable Energy
FEMP works to reduce the cost and environmental impact of the Federal gover
Feder management decisions at
nment by advancing energy efficiency and water conservation promoting the use of distributed and renewable energy and improving utility
al sites
Introduction
As concern for the environmental and societal impacts of modern development increases Federal decision-makers are being faced with a challenge how can the government build operate and maintain facilities that minimize impacts on the environment and provide a healthy productive and secure work places without increasing costs This document serves as a resource to parties involved in both Federal government and private-sector construction projects to help them dispel mistaken assumptions and to better defend the decision to incorporate the principles of sustainability in their projects The business case for sustainable design and construction focuses on economic benefits but as the document reveals some economic benefits are actually derived indirectly from the very environmental and social benefits that sustainable buildings provide
This section explains the basic philosophical underpinnings of the sustainable design and construction movement provides some background on sustainable design in a Federal context and introduces the triple bottom line framework ndash economic social and environmental ndash that is used in this document for examining the benefits of sustainable design and construction
What is Sustainable Design and Construction
The concept of sustainable development grew from the concern that the world populationrsquos consumption of resources and production of wastes could exceed the earthrsquos capacity to produce those resources and absorb those wastes In 1987 the United Nations World Commission on the Environment (the Brundtland report) defined sustainable development as those paths of social economic and political progress that meet the needs of the present without compromising the ability of future generations to meet their own needs
The concept of sustainability includes three goals or cornerstones
bull Environmental stewardship ndash protecting air water land and ecosystems as well as conserving resources including fossil fuels thus preserving the earthrsquos resources for future generations
bull Social responsibility ndash improving the quality of life and equity for individuals communities and society as a whole
bull Economic prosperity ndash reducing costs adding value and creating economic opportunity for individuals organizations communities and nations
This triple bottom line framework as it is often called shows the three cornerstones as separate components to make sure all three are emphasized Advocates believe that only by pursuing all three of these interrelated goals will the earth return to a sustainable path Organizations that apply this framework in their decision-making recognize that by considering the environmental and social impacts of their actions as well as traditional short-term financial indicators they may increase their prospects of sustainable long-term success
To achieve tangible results the principles of sustainable development must be translated into practical guidelines that can be applied in the real world Sustainable design involves shifting away from processes and products that pollute use nonrenewable resources and have other negative consequences for society and moving toward products and processes with minimal environmental and natural resource impact and that provide benefits to society Several frameworks have been developed to help designers of all kinds of products including buildings and facilities take steps toward the goals of improving societal well-being and minimizing pollution and natural resource depletion
1-1
One of the important sustainable design frameworks for buildings is called Leadership in Energy and Environmental Design (LEEDtrade) Developed by the US Green Building Council LEED is a voluntary consensus-based rating system that awards different levels of green building certification based on total credit points earned 1 LEED gives credits for incorporating specific sustainable design strategies into a building The design strategy categories (and their potential points out of a possible total of 69) include the following
bull Sustainable sites (14) bull Water efficiency (5) bull Energy and atmosphere (17) bull Materials and resources (15) bull Indoor environmental quality (13) bull Innovation and design process (5)
The US Green Building Council plans to update the rating system periodically and add new categories of buildings (the currently approved system is for commercial buildings)2
The Federal government has also developed various tools and guidelines for increasing the sustainability of buildings and facilities A major contribution was the development of the Whole Building Design Guide (WBDG) a web-based resource providing information and resources to support sustainable design 3 This guidance was produced and is updated through an interagency effort Similar to the LEED principles the fundamental strategies for sustainable design in the WBDG include the following
bull Optimizing site potential bull Minimizing energy consumption bull Protecting and conserving water bull Using environmentally preferable products and materials bull Enhancing indoor environmental quality bull Optimizing operations and maintenance (OampM) practices
Another concept that underpins sustainable design is integrating the architectural and mechanical features of the facility to minimize energy and resource use and reduce cost while maintaining comfort When project developers commit early to a high level of building integration they can more effectively By the time 1 of project costs are exploit cost-effective tradeoffs Integrating sustainable design spent roughly 70 of the life-cycle principles early in the process is also important because that cost of the building has been deter-
is when the project-defining decisions (and major design mined by the time 7 of costs have been spent up to 85 of life-cycle mistakes) are made (Lotspeich et al 2002) Sustainable design costs have been determined considerations should be included in solicitations for
architectural and engineering services the Program of Lotspeich et al (2002) Requirements and the contracts as well as in the value engineering process (See Case Study 4-3 in Section 4)
1 To become certified a building must earn between 26 and 32 points to obtain a silver rating ndash 33 to 38 points a gold rating ndash 39 to 51 points and a platinum rating ndash 52 or more points 2 More information about the rating system can be obtained from httpwwwusgbcorg 3 See httpwwwwbdgorgindexasp
1-2
Sustainable Design and Construction in the Federal Government Sector
The business case for sustainable design takes on special meaning when discussed in the context of the Federal government whose mission is to protect the well-being of the nation As a rule the government wants to provide an example for others to follow by reducing environmental impacts lowering energy and resource use and having positive social impacts on its employees and the communities surrounding its facilities
Government efforts to implement sustainable design have potentially large impacts The Federal government owns about 500000 facilities worldwide valued at more than $300 billion (National Research Council 1998) It spends over $20 billion annually on acquiring or substantially renovating Federal facilities and it uses over $35 billion annually for energy to power heat and cool its buildings (Federal Facilities Council 2001) In addition the government spends almost $200 billion for personnel compensation and benefits for the civilian employees occupying these buildings (US Office of Personnel Management 2003) Building designs that reduce energy consumption while also providing a healthy and pleasant environment for occupants will result in more cost-efficient government operations and lower environmental impacts that affect the public
The Federal governmentrsquos building-related energy costs have The Federal government has many
dropped over 23 per square foot between 1985 and 2001 leaders in this field already and saving taxpayers $14 billion annually 4 These savings are the together we can demonstrate that a
sustainable building is healthier direct result of a number of Federal laws and Executive more environmentally sound Orders The Energy Policy Act (EPAct) of 1992 was the latest operationally and economically in a series of laws since 1975 that have recognized the Federal viable and the way we should be governmentrsquos own role as a very large consumer of energy doing business and other products EPAct provided guidance on how to
improve energy performance and set goals for Federal energy John L Howard Jr
and water use and required all government buildings to Federal Environmental Executive install energy and water conservation measures that have a payback period of less than 10 years
The Federal commitment to green buildings was further advanced by the promulgation of several key Executive Orders later in the 1990s In June 1999 the White House promulgated Executive Order 13123 requiring agencies to apply sustainable design principles to the design and construction of new facilities and setting goals for reducing energy use beyond EPAct levels lowering greenhouse gas emissions and water consumption and increasing renewable energy and green power purchasing It also mandated that agencies build showcase facilities with advanced energy-efficiency technologies
Executive Order 13123 and EPAct emphasize the need for lifecycle5 cost-effective solutions In other words government agencies were asked to compare options based on costs over the lifetime of the facility and its equipment not just on initial capital outlays Lifecycle-cost analysis often supports adding sustainable design features because the annual cost savings associated with these features over their lifetimes often offset higher first costs On the other hand the cost-effectiveness requirement can be an impediment to some sustainable design features that are more expensive on a lifecycle basis than their traditional counterparts
4 Personal communication with C Tremper McNeil Technologies Springfield Virginia 5 Lifecycle cost represents the first cost plus the replacement costs (discounted to present value)that occur over the lifetime of the equipment minus the discounted present value of the stream of cost savings
1-3
Despite the lifecycle costing requirements government project managers still find it hard to include all the sustainable design features they would like to see in building projects Because OampM costs are appropriated and managed separately from capital expenditures agencies find it difficult within their normal budgeting process to use lifecycle cost analysis which intertwines capital and OampM into one comprehensive metric Capital budgets are usually preset for construction projects so increasing the budget to include the extra cost of sustainable design features is difficult Interpretations of how lifecycle costs should be considered in government construction projects vary between agencies and even within agencies
Nevertheless as this report documents Federal agencies have found creative ways to stay within capital budgets while making their buildings green and many Federal agencies have developed policies and programs to support sustainable design Although policies vary from agency to agency most encourage the use of LEED or some similar system For example the Army worked with the US Green Building Council to develop the Sustainable Project Rating Tool (SPiRit) an adaptation of LEED that meets the specific needs of the Army
A Framework for Understanding the Benefits of Sustainable Design and Construction
Questions raised about sustainable design often include the following What does it cost What are the benefits To help answer these questions this document uses the triple bottom line benefits framework described in Section 11 and applies it to sustainable building design and construction as depicted in Figure 1-1 The three categories of benefits ndash economic social and environmental ndash were fully explored and each type of benefit was documented with hard evidence to the extent possible
Economic benefits to the building owner include first-cost and operating-cost savings In addition as Figure 1-1 indicates environmental and social benefits can lead to economic benefits for building owners For example sustainable design efforts to improve the quality of the indoor environment can result in lower absenteeism and higher productivity of building occupants and hence lower personnel costs and the buildingrsquos better environmental profile can reduce the time for and cost of permitting the facility In addition to the building owner other stakeholders such as neighbors local and state governments and society as a whole may reap economic benefits including lower damage costs from pollution reduced municipal infrastructure costs and localregional economic growth due to the emerging businesses related to sustainable design and construction
A principal social benefit of sustainable design is the improved health satisfaction and well-being of building occupants Sustainable design features can also go hand in hand with improved building safety and security Federal facilities designed using the principles of sustainability can also have positive social impacts on the surrounding community such as the transfer of pollution prevention and recycling practices to the private sector increased use of public or alternative transportation and improved brownfield sites 6
6 Brownfields are abandoned idled or underused industrial and commercial facilities where expansion or redevelopment is complicated by real or perceived environmental contamination (httpwwwepagovebtpagescleabrownfieldshtml)
1-4
Ease of siting and improved image as an environmentally conscious organization lead to economic benefits
Increased and lower turnover rates lead to economic benefits
Economic Benefits
Cost savings and economic benefits for the organization and its stakeholders
Improved quality of life for facility occupants and society as a whole
Environmental protection and resource conservation on a local regional and global scale
productivity
Environmental Benefits Social Benefits
Figure 1-1 Triple Bottom Line Benefits of Sustainable Design
Environmental benefits have been a main driver behind the sustainable design movement Sustainable facilities typically use lower amounts of fossil fuels create less air pollution and greenhouse gas emissions result in less waste for disposal in landfills consume less water and other natural resources use fewer virgin building materials disturb less land and are more sensitive to existing ecosystems
Three principal forms of evidence of the benefits of sustainable design form the basis for the documentation presented in this document
bull First under Federal Energy Management Programrsquos (FEMPs) direction the Pacific Northwest National Laboratory (PNNL) and the National Renewable Energy Laboratory (NREL) conducted engineering cost analyses to estimate the potential cost savings associated with various sustainable features in buildings One challenge encountered when developing the business case is that there is no comprehensive source of data on the costs of sustainable design features To address this challenge this study developed typical costs based on available data from various sources including vendors of sustainable building products Cost savings were estimated for a prototype two-story 20000-ft2 office building hypothetically located in Baltimore Maryland7 The analysis estimated lifecycle cost savings associated with improving energy-efficiency commissioning the building reducing water consumption using sustainable landscaping approaches using underfloor systems to reduce churn costs and choosing sustainable building materials
7 Baltimore was chosen because it has both a moderately high heating and cooling load A moderately small office building was chosen because that size represents the 75th percentile within the current stock of office buildings in the US government and a similarly large percentage of private-sector buildings
1-5
In Sections 2 3 and 4 of this document the portions of the text that discuss this prototype building analysis are identified with the green building icon (left)
bull Second the document contains numerous real-world case studies that illustrate the benefits of sustainable design These case studies document benefits achieved in both government and private-sector building projects
bull Third the document includes summaries of research studies that rigorously examined benefits such as improved occupant productivity health and well-being associated with various sustainable design features
The results of this data-gathering exercise show that a strong business case for sustainable design exists Table 1-1 summarizes the economic social and environmental benefits of the six principal elements of sustainable design which correspond closely to the categories in the LEED rating system and the WBDG
The next three sections of this document expand on each of the columns in the figure and provide the available evidence for the economic (Section 2) social (Section 3) and environmental (Section 4) benefits shown in Table 1-1 The table indicates which subsection discusses each type of benefit The final section of the main body of the document (Section 5) describes the kind of data and information that could be gathered to make the business case for sustainable design and construction even stronger than it is today Section 6 lists the references cited in this study
Several appendixes provide additional detail and data and are included at the end of the document Appendix A expands Table 1-1 into a much more detailed list of sustainable design features and their economic social and environmental benefits Appendix B provides details on the energy analysis conducted for the prototype building analysis Appendix C describes the results of an exercise similar to the prototype building analysis which examined the costs and benefits of the range of sustainable design features in a building at the Tennessee Valley Authority Appendixes D and E summarize the analysis of sustainable siting and water-saving features and the sustainable materials analysis respectively Appendix F contains a detailed discussion of the body of research conducted on occupant productivity health and comfort and satisfaction
1-6
Table 1-1 Benefits of Sustainable Design and Construction
Element Economic Benefits Social Benefits Environmental Benefits
Sustainable Reduced costs for site preparashy Improved aesthetics (eg Land preservation Lower siting tion and clear-cutting and
parking lots and roads See Section 21 Lower energy system cost due to optimal orientation See Section 21 Less landscape maintenance costs See Section 24
better appearance of site to neighbors) transportation options for employees See Section 34
Increased resource use Protection of ecological resources and water conservation Reduced energy use and air pollution See Sections 41 and 43
Soil
Water Lower first cost (for some fixshy Preservation of water Lower potable water use and efficiency tures) See Section 21 Reduced
annual water costs See Section 23 Lower municipal costs for wastewater treatment See Section 28
resources for future genershyations and for recreational and agricultural uses Fewer wastewater treatshyment plants and associated annoyances See Section 34
pollution discharges to waterways ess strain on aquatic ecosystems in water-scarce areas reservation of water resources for wildlife and agriculture See Section 43
L
P
Energy efficiency Lower first costs when systems can be downsized as the result of integrated energy solutions See Section 21 Up to 70 lower annual fuel and electricity costs reduced peak power demand See Section 22 Reduced demand for new energy infrashystructure lowering energy costs to consumers See Section 28
Improved thermal condishytions and occupant comshyfort satisfaction See Section 32 Fewer new power plants and transshymission lines and associshyated annoyances See Section 34 Improved safety and security See Section 33
Lower electricity and fossil fuel use and the accomshypanying reduced air pollushytion and carbon dioxide emissions See Section 41 Decreased impacts of fossil fuel production and distribution Section 43See
Materials and Decreased first costs due to Fewer landfills and associshy Reduced strain on landfills resources material reuse and use of recyshy
cled materials See Section 21 Lower costs for waste disposal and decreased replacement cost for more durable materials See Section 24 Lower municipal costs for new landfills See Section 28
ated nuisances Expanded market for environmentshyally preferable products Decreased traffic due to use of localregional materials See Section 34
Reduced use of virgin resources althier forests due to better management Lower energy use for material transportation Increased local recycling market See Sections 42 and 43
He
Indoor Organizational productivity Reduced adverse health Better air quality inside the environmental improvements from improved impacts Improved occushy facility including reduced quality worker performance lower
absenteeism and reduced staff turnover See Section 26 Lower disabilityhealth insurance costs and reduced threat of litigation See Section 27
pant satisfaction and comfort etter individual productivity See Sections 31 and 32
B volatile organic emissions carbon dioxide and carbon monoxide Discussed in the context of health impacts in Section 31
Commissioning Reduced energy costs See Increased occupant Lower energy consumption and OampM Section 22 Reduced costs of
dealing with complaints See Section 27 Longer building and equipment lifetimes See Section 27
productivity satisfaction and health See Sections 31 and 32
as well as air pollution and carbon dioxide emissions and other environmental impacts of energy producshytion and use See Section 41
1-7
The Economic Benefits of Sustainable Design
Evidence is growing that sustainable buildings provide financial rewards for building owners operators and occupants Sustainable buildings typically have lower annual costs for energy water maintenancerepair churn (reconfiguring space because of changing needs) and other operating expenses These reduced costs do not have to come at the expense of higher first costs Through integrated design and innovative use of sustainable materials and equipment the first cost of a sustainable building can be the same as or lower than that of a traditional building Some sustainable design features have higher first costs but the payback period for the incremental investment often is short and the lifecycle cost typically lower than the cost of more traditional buildings
In addition to direct cost savings sustainable buildings can provide indirect economic benefits to both the building owner and society For instance sustainable building features can promote better health comfort well-being and productivity of building occupants which can reduce levels of absenteeism and increase productivity Sustainable building features can offer owners economic benefits from lower risks longer building lifetimes improved ability to attract new employees reduced expenses for dealing with complaints less time and lower costs for project permitting resulting from community acceptance and support for sustainable projects and increased asset value Sustainable buildings also offer society as a whole economic benefits such as reduced costs from air pollution damage and lower infrastructure costs eg for avoided landfills wastewater treatment plants power plants and transmissiondistribution lines
Section 21 explains how using integrated design and various low-cost sustainable features reduces first costs Sections 22 through 25 discuss the other direct economic benefits annual operating cost savings for energy water maintenance and repair and churn Sections 26 and 27 discuss the indirect benefits of sustainable buildings for building owners and Section 28 discusses the indirect benefits of sustainable buildings for society Case studies and research summaries illustrating various benefits are included in each section
Lower (or Equal) First Costs
Sustainable design must begin at the conceptual stage of a project to realize the full benefits The first step is to form a design team ndash including the owners architects engineers sustainable design consultants landscape designers OampM staff health safety and security experts the general contractor and As the green design field matures it becomes
ever more clear that integration is the key to key subcontractors cost consultants and value achieving energy and environmental goalsengineers and occupant representatives This team especially if cost is a major driverneeds to work together from the start seeking an
integrated design The team develops innovative Building Green Inc (1999)solutions that meet energy environmental and social goals while keeping costs within budget
Using their collective interdisciplinary analytical capability the team can incorporate many strategies that taken alone would increase first costs For example by improving the building envelope the design team can often eliminate the heating ventilation and air conditioning (HVAC) system around the perimeter of the building (and the associated ducting) and also downsize the primary HVAC system Downsizing the HVAC system and eliminating ducting release money to pay for the envelope improvements A good example of this phenomenon occurred during the
2-1
design of the Pennsylvania Department of Environmental Protectionrsquos Cambria Office Building When designers of this building first proposed an upgrade to triple-glazed double low-e windows the developer balked at the $15000 increase in cost However the developer was won over when it was demonstrated that this upgrade would allow the perimeter-heating zone to be eliminated for a savings of $15000 the heat pumps to be downsized for an additional $10000 savings and additional space to be gained because of the smaller equipment and ducts for additional rent of $50008 Also by eliminating unnecessary features (eg expensive finishes) the team can add some more expensive sustainable features that not only meet environmental goals but that also reduce operating costs
In a sustainable design project the design team conducts a tradeoff exercise ndash trading off the cost of optional features against the cost of features that will result in energy environmental or social improvements Focusing on integrated solutions and explicitly evaluating tradeoffs can result in a sustainable facility built for the same (or an even lower) cost than a more traditional building In most of the government case studies of sustainable buildings included in this document the first costs were not higher than the original budgeted amount The following are some design and construction strategies that a team can use to reduce first costs9
bull Optimize site and orientation One obvious strategy to reduce first costs is to apply appropriate siting and building orientation techniques to capture solar radiation for lighting and heating in winter and shade the building using vegetation or other site features to reduce the summer cooling load Fully exploiting natural heating and cooling techniques can lead to smaller HVAC systems and lower first costs
bull Re-userenovate older buildings and use recycled materials Re-using buildings as well as using recycled materials and furnishings saves virgin materials and reduces the energy required to produce new materials Re-using buildings may also reduce time (and therefore money) associated with site planning and permitting
bull Reduce project size A design that is space-efficient yet adequate to meet the building objectives and requirements generally reduces the total costs although the cost per unit area may be higher Fully using indoor floor space and even moving certain required spaces to the exterior of the building can reduce first costs considerably
bull Eliminate unnecessary finishes and features One example of eliminating unnecessary items is choosing to eliminate ornamental wall paneling doors (when privacy isnt critical) and dropshyped ceilings In some cases removing unnecessary items can create new opportunities for designers For example eliminating dropped ceilings might allow deeper daylight penetration and reduce floor-to-floor height (which can reduce overall building dimensions)
bull Avoid structural overdesign and construction waste Optimal value engineering and advanced framing techniques reduce material use without adversely affecting structural performance10 Designing to minimize construction debris (eg using standard-sized or modular materials to avoid cutting pieces and generating less construction waste) also minimizes labor costs for cutting materials and disposing of waste
8 Pennsylvania Department of Environmental Protections Cambria Office (DEP Cambria) a case study in DOEs High Performance Buildings Database at httpwwweereenergygovbuildingshighperformancecase_studiesoverviewcfmProjectID=47 9 Many of these concepts were outlined in Building Green on a Budget Article found at httpwwwbetterbrickscom which cites Environmental Building News (May 1999) a newsletter published by Building Green at httpwwwbuildinggreencom 10 These techniques are explained at httpwwwtoolbaseorgtertiaryTaspTrackID=ampCategoryID=70ampDocumentID=2021
2-2
bull Fully explore integrated design including energy system optimization As discussed above integrated design often allows HVAC equipment to be downsized Models such as DOE-2 allow energy performance of a prospective building to be studied and sizing of mechanical systems to
be optimized Using daylighting and operable windows for natural ventilation can reduce Discovering the DOE-2 model was invaluable
I cant imagine doing this kind of project the need for artificial lighting fixtures and without it ever again With this technique mechanical cooling lowering first costs we can actually prove to our clients how much Beyond energy-related systems integrated money they will be saving design can also reduce construction costs and
shorten the schedule For example by Robert Fox Principal Fox amp Fowle involving the general contractor in early Architect of Four Times Square
planning sessions the design team may httpwwwbetterbrickscom identify multiple ways to streamline the construction process
bull Use construction waste management approaches In some locations waste disposal costs are very high because of declining availability of landfill capacity For instance in New York City waste disposal costs about $7500 per ton11 In such situations using a firm to recycle construction waste can decrease construction costs because waste is recycled at no cost to the general contractor thereby saving disposal costs12 (For an example see case Study 4-2 in Section 4)
bull Decrease site infrastructure Costs can be reduced if less ground needs to be disturbed and less infrastructure needs to be built Site infrastructure can be decreased by carefully planning the site using natural drainage rather than storm sewers minimizing impervious concrete sideshywalks reducing the size of roads and parking lots (eg by locating near public transportashy When you dont have all these manicured tion) using natural landscaping instead of landscapes and paved roads you end up with traditional lawns and reducing other manmade enormous reductions in infrastructure
investmentinfrastructure on the site when possible For example land development and infrastructure
John Knott Chief Executive of Island costs for the environmentally sensitive developshyPreservation Partnership Dewee Islands
ment on Dewees Island off the coast of developer Charleston South Carolina were 60 below Source Rocky Mountain Institute website average because impervious roadway surfaces httpwwwrmiorgsitepagespid221php
and conventional landscaping were not used
In addition to these strategies certain materials and fixtures that reduce environmental impact have lower first costs than their traditional counterparts (the costs for these products are described in more detail in Appendixes D and E)
bull Concrete with slag content or fly ash This product is made with a mix of Portland cement and either iron mill slag (a waste product from blast furnaces that produce iron)13 or fly ash (a waste product from coal-fired power plants) Vendor quotes gathered during this study indicate that this type of concrete can be slightly less expensive ($050 to $100 per ton less) than concrete made with 100 Portland cement and is purportedly more durable
11 High Performance Building Guidelines httpwwwcinycnyushtmlddchtmlhighperfhtml 12 See httpwwwepagovepaoswernon-hwdebrisreducehtm 13 The slag is recycled into ground-granulated blast furnace slag cement by grinding the iron blast furnace slag to cement fineness
2-3
bull Carpet with recycled content A range of environmentally preferable carpet products is currently available on the market including refurbished used carpet and new carpet made from various combinations of old carpet carpet scraps carpet backing auto parts soda bottles and flooring materials The quotes gathered for this study indicate that such sustainable carpet options can cost as much as $15 less per yard than traditional carpet (although some price quotes indicated the recycled carpet was more expensive)
bull Low-emitting paint and recycled paint Low-emitting paint has very low or no emissions of volatile organic compounds (VOCs) when it is applied For building occupants the paint significantly reduces negative reactions that normal latex paint often causes and allows buildings to be occupied during or shortly after the paint is applied Price quotes gathered for this study vary but some indicate that low-emitting paint can cost $3 per gallon less than normal paint and can cover more surface area per gallon14
Recycled paint is left-over paint collected from construction sites or the paint manufacturing process That paint is then sorted by type color and finish and reprocessed for resale Price quotes collected for this study indicate that recycled paint can sometimes be $15 per gallon less expensive than comparable virgin contractor-grade latex paint
bull Certified wood products Such products comply with Forest Stewardship Council Guidelines indicating that wood producers have applied all regional laws and international treaties respect long-term tenure and use rights on the land from which the wood is harvested Price quotes indicate that some certified wood doors are $150 less expensive than traditional doors (although some are more expensive)
bull No-water urinals Urinals that use no flushing water often cost less to install than traditional water-using urinals because of the reduced need for pipes (no intake water is required) Price quotes indicate that some brands of no-water urinals cost over $280 less (per urinal installed) than their water-using counterparts (Also see Section 23 for annual water cost savings)
Implementing all of the sustainable features discussed above (concrete with slag content recycled carpet low-emitting paint certified wood doors and no-water urinals) reduced the first costs of the prototype building that was examined in this study (see Section 1) by up to $260ft2 and the total first cost of the building construction by as much as $51000 lowering the total building cost by about 2
Case Study 2-1 shows how reducing project size and using integrated design principles can significantly reduce first costs Focusing only on strategies that keep first costs low may not be in the best long-term interest of the building owner Some features that increase first costs can significantly reduce lifecycle costs Some of these lifecycle cost reduction strategies are discussed in Sections 22 through 25
14 Various brands of low-emitting paint were compared with their traditional counterparts To provide reasonable points of comparison with the low-emitting paint costs for both normal contractor-grade and high-end products were included The cost of the low-emitting paint varied depending on location of the purchase volume of the paint purchased and the ability of the local distributor to offer special rates
2-4
This case study shows that an integrated design team can apply fairly simple natural principles in innovative ways to significantly reduce energy consumption A high-performance building does not necessarily cost more to build than a more typical building One way to reduce first costs is to consider making changes to the general building program (overall concept scope and requirements) In this case study exhibit space was moved outdoors
Project Description The Zion National Park Visitors Center in Springdale Utah is a small building (7600 ft2) designed to allow park visitors access to park information interpretation and trip-planning assistance The facility provides both indoor and outdoor exhibit spaces
Approach to Sustainable Design The design team used a whole building design process from the onset of the conceptual design through completion of the commissioning process Instead of using a two-staged design approach in which the building design is developed first followed by the engineering design of the heating lighting and other mechanical systems this design team viewed the building project as a single system The team worked to ensure that the building envelope and systems complemented each other Extensive whole-building energy and lighting computer simulations were conducted throughout the design process
Sustainable Features The building includes features such as natural ventilation and evaporative cooling passive solar heating daylighting and sunshading computerized building controls and an uninterruptible power supply integrated with a photovoltaic system The natural ventilation and cooling are facilitated by a cooltower a passive solar approach that has been used for hundreds of years Water is pumped onto a honeycomb media at the top of the tower cooling the air by evaporation This cool air descends naturally (without fans) through the tower and into the building Strategically placed windows help evacuate hot air and circulate the air The buildings envelope and general form including overhangs clerestories roofline and massive building materials help reduce energy consumption
After the building envelope was designed the small amount of remainshying heating required was met with electrically powered radiant heating panels which were estimated to be the most cost-effective solution and elimishynated the need for a central heating system that would have required a hot-air furnace or boiler and associated ductwork or piping Daylighting (provided by clerestory windows and windows six feet above the floor) meets the primary lighting needs but a high-efficiency electric lighting sysshytem and related controls were designed to complement the daylighting design The uninterruptible power supply system was included in the original Energy-Related Features of the Visitors Center
2-5
plan for the buildings electrical system because of poor power reliability at the site The design team specified an inverter that could handle input from a solar-electric system so the building was ready to be outfitted with a solar-electric system Later in the design process when additional funding was available a 72-kW solar-electric system was installed The figure (previous page) shows the designs main features
Financial Considerations The project construction cost was estimated to be about 30 less than that of a conventional visitors center This lower cost is primarily the result of a decision made early in the design process to move many of the exhibit spaces outdoors under permanent shade structures to decrease building size To ensure that the outdoor exhibits were noticed the designers separated the visitors center from the restrooms (comfort station) so visitors would walk through the outdoor exhibit space
In addition the floor space required for the building support functions (ie the mechanical room) was smaller than in a conventional visitors center because eliminating ducts large blowers chillers and boilers reduced the size of the mechanical room Eliminating the need for fuel storage (by using electrically powered radiant heat) also reduced infrastructure costs The figure below summarizes annual energy costs based on measured performance (NREL monitored the performance) The building was designed to use most of its power during offpeak periods when power is cheaper The buildings operating costs is only $045ft2 ($484m2) to operate The NREL team found that the Zion Visitors Center Complex is using 70 less energy compared with facilities built to the applicable Federal codes15 This energy use is equivalent to a total annual savings of about 250000 kilowatt-hours (kWh) (870 million Btu)
Measured Energy Cost Performance of the Visitors Center (Torcellini et al 2002)
Sources Torcellini et al (2002) DOEs High Performance Buildings Database at URL httpwwwerendoegovbuildingshighperformancecase_studiesoverview and personal communication with P Torcellini NREL Golden Colorado
15 The 70 reduction was calculated from a theoretical base-case building which was modeled to provide a starting point for the analysis and as a metric for evaluating the projects energy-savings success The base-case model has the same footprint area as the as-built building The base-case building is solar neutral (equal glazshying areas on all orientations) and meets the minimum requirements of the Federal Energy Code (10 CFR 34) Electric lights provided all lighting for the base-case building and were set to retail and exhibit lighting levels More detail on the base-case versus as-built building is available from Torcellini et al (2002) on DOEs Energy High Performance Buildings website httpwwwerendoegovbuildingshighperformancecase_studiesoverview
2-6
Annual Energy Cost Savings
A wide range of building design approaches and commercially available technologies can help effectively minimize a buildings energy costs As Section 21 discussed an important concept in energy-efficient design is integrating the buildings architectural and mechanical features to minimize energy use and reduce cost while maintaining comfort This integration is best done during the very early stages when the most cost-effective holistic system can be designed Although some energy-efficiency strategies result in slightly higher first costs the resulting annual cost savings result in lower lifecycle costs
To illustrate this concept PNNL and NREL analyzed the energy costs that could be saved by using an integrated design approach to alter architectural elements and mechanical systems in the prototype two-story building of 20000 ft2 hypothetically located in
Baltimore Maryland The base-case building to which the sustainable building was compared is assumed to meet the levels of energy efficiency in the American Society of Heating Refrigerating and Air Conditioning Engineers (ASHRAE) 901-1999 standard (this is also the baseline for LEED energy-efficiency credits) The total construction cost of this base-case building was estimated at $24 million Using two energy simulation models (Energy-10 and DOE-21e) and standard costing approaches (see Appendix B for details) the analysis team calculated the incremental first cost16 and annual energy cost savings as well as lifecycle costs17 and payback periods for a combination of energy-saving features optimized for lowest energy use and lifecycle cost (see Figure 2-1)
The results indicate that annual energy costs could be reduced 37 below the base case18 by incorporating various energy-saving features at a total first cost increase of about $38000 (adding 16 to total first costs) The overall simple payback19 for the changes was estimated to be 87 years and the sustainable building had a net lifecycle savings of over $23000 during the assumed 25-year lifetime The savings-to-investment ratio20 was estimated to be 15 Table 2-1 shows the breakout of the savings For example the added skylights combined with lower overall lighting intensity and lighting controls decreased the lighting energy consumption by about 48 and saved over $2900 in annual energy costs Table 2-2 compares some additional values between the base case and the sustainable option (prototype building)
The energy-efficiency analysis of the prototype building indicates that significant amounts of energy can be reduced within an acceptable payback period and that energy-efficient buildings can have lower lifecycle costs than their traditional counterparts The cost analysis of the Johnson City Customer Service Center being designed by the Tennessee Valley Authority (Appendix C) provides another example
16 Incremental first cost is the additional capital expenditure needed to include the sustainable design feature (a negative incremental first cost indicates a capital cost savings)17 Lifecycle cost represents the first cost plus the replacement costs (discounted to present value) that occur over the lifetime of the equipment minus the discounted present value of the stream of cost savings18 This value excludes plugloads the energy use by equipment and machines in buildings 19 Simple payback equals the incremental first cost divided by the annual cost savings 20 The savings-to-investment ratio is similar to a benefit-cost ratio and equals the discounted present value of the stream of annual cost savings over the lifetime of the investment divided by the incremental first cost plus the discounted value of future replacement costs A savings-to-investment ratio greater than 10 indicates that the present value of the savings exceed the present value of any additional capital outlays
2-7
Energy-Efficiency Measures Examined in the Prototype Building Analysis
Lighting Measures bull Increased daylighting Skylights were added increasing daylight to the top floor bull Reduced lighting intensity Lighting power densities recommended by the Illuminating Engineering
Society of North America and ASHRAE as a proposed addenda to the 901 standard were adopted The lighting level was reduced from 40 to 35 footcandles in the office area with some increase in task lighting
bull Perimeter daylighting controls with dimmers Daylight sensors (six per floor) control stepped ballast controls so that electric lighting is dimmed when sufficient daylight exists In the base case no dimming of electric lighting occurs
Envelope Measures bull Window distribution The square footage of the windows was redistributed to optimize solar gain with
heating and cooling costs he optimized window-to-wall ratio is 15 window for the north wall 10 window for the east and west walls and 30 window for the south wall is 20 for all walls
bull Additional wall insulation On the outside face of the exterior wall framing R-10 rigid insulation was added compared with only R-13 batt insulation in the base-case walls The resulting insulation in the sustainable building was R-23
bull Additional roof insulation The R-15 rigid insulation was increased to R-20 bull White roof A white roof finish material with low solar radiation absorptance of 030 was used
compared with the base cases absorptance of 070
bull Highly energy-efficient windows The sustainable option balances window performance with the low lighting levels and the use of daylighting controls he result is a cost-optimized window with a U-factor of 031 and a shading coefficient of 039
Mechanical Systems bull High-efficiency air conditioner The air conditioning unit has an energy-efficiency ratio of 13
compared with 10 for the base case
bull High-efficiency water heater A 90 thermal efficiency condensing water heater was used compared with a commercial gas water heater with 80 thermal efficiency for the base case
bull Low-pressure ducts The fan external static pressure was reduced from 10 inch water column to 05 inch water column by enlarging the duct sizes
bull Economizers An integrated economizer including an outside air enthalpy sensor with a high-limit enthalpy setpoint was used the setpoint was set at 25 Btulb in conjunction with a dry bulb temperature high limit of 74degF
T The base-case ratio
T
Figure 2-1 Energy-Efficiency Measures Examined in the Prototype Building Analysis
Table 2-1 Prototype Building Analysis Energy-Efficiency Features Reduce Annual Energy Costs by 37
Base-Case Building Annual Energy Cost
Sustainable Building Annual Energy Cost Percent Reduction
Lighting $6100 $3190 477
Cooling $1800 $1310 271
Heating $1800 $1280 289
Other $2130 $1700 201
Total $11800 $7490 367
Values are rounded to three significant digits
2-8
Table 2-2 Prototype Building Analysis Costs and Benefits of Energy-Efficiency Measures
Base Case Sustainable Building
Total first cost of building (thousand $) $2400 $2440
Annual energy cost
Dollar amount $11800 $7490
Percent change from base case NA -367
Economic metrics
Simple payback period (yr) NA 865
Lifecycle cost (thousand $) $2590 $2570
Percent change in lifecycle cost from base case NA -085
Savings-to-investment ratio NA 147
Energy use
Million Btu 730 477
Percent change from base case NA -346
Values have been rounded to three significant figures NA = not applicable
In addition to integrating architectural elements and high-efficiency mechanical systems to reduce annual energy use various measures can be taken to lower the energy use by equipment and machines in buildings (plug loads) For instance the marketplace now offers Energy Star computers office machines and appliances 21 and the Federal government mandates the purchase of these energy-efficient machines for its facilities In addition innovative entrepreneurs have begun introducing new products that help reduce unnecessary energy consumption and have short paybacks For example one commercially available device reduces the electricity consumed by vending machines by up to 46 with a payback period of 1 to 2 years while maintaining the proper temperature of the beverages or other products22
Another important aspect of achieving energy efficiency in a new building is commissioning which refers to the validation and checking process undertaken before the building is occupied to ensure that the performance of the building and its systems satisfies both the design intent and occupants needs In sustainable building design and construction the need to commission is greater than ever because of the interactive synergies between the various mechanical and electrical systems and the buildings architectural features (US General Services Administration [GSA] and US Department of Energy [DOE] 1998) Data substantiating the benefits of commissioning new buildings are difficult to obtain because benefits must be estimated against a modeled baseline or compared with a similar building However a database of 175 commissioning case studies by Portland Energy Conservation Inc (PECI) (1997) of various types of commercial buildings ranging from new to 74 years old consistently demonstrated significant energy savings and improvements in thermal comfort indoor air quality and overall OampM Table 2-3 shows the estimated costs of commissioning a new building
21 This study did not include a thorough analysis of reducing plug loads The LEED system does not apply points to this category In some cases energy-efficiency improvements depend on the behavior of building occupants and therefore cannot be guaranteed The plug load in the prototype building represents about 25 of the energy consumption22 wwwbayviewtechcom
2-9
Table 2-3 Costs of Commissioning for New Construction (PECI 1997)
Scope of Commissioning Cost
Whole building 05-15 of total construction cost
HVAC and automated controls systems only 15-25 of mechanical system cost
Electrical systems commissioning 10-15 of electrical system cost
The first cost for the HVAC and control system in the prototype building analyzed in this study was about $212000 (out of a total cost of $24 million) and the annual energy costs of the base case were modeled to be $11800 Using the values in Table 2-3 comshy
missioning the HVAC and control system would cost from $3180 to $5300 (15 to 25 of HVAC and control system costs) Assuming that the commissioning would reduce energy costs by 1023
the annual costs savings would be about $1310 resulting in payback period from 24 to 40 years
In addition to commissioning the building before it is occupied a building designed for sustain-ability must also be operated and maintained with the same goal in mind OampM activities include 1) controlling and optimizing procedures and systems and 2) performing routine preventive scheduled and unscheduled actions to prevent equipment failure or decline and to meet efficiency reliability and safety goals
In a sustainable design environment OampM requirements must be identified and addressed in a buildings planning stage to ensure that control systems are installed that the building and equipment are designed for ease of OampM and that sufficient OampM resources (staff materials replacement parts etc) are included in the annual budgets Studies of commercial buildings estimate potential OampM-related energy savings to be from 5 to 30 (Hunt and Sullivan 2002) Buildings designed for sustainability need to focus on maximizing savings through a proactive OampM program that focuses on operational efficiency
One component of such a program is the periodic recommissioning of equipment which involves rechecking and recalibrating the original equipment Examples of typical OampM and recommisshysioning activities include calibrating sensors checkingresetting temperature setpoints maintaining proper building operating schedules balancingrebalancing the HVAC systems changing filters meteringsubmetering energy with analysis and followup action as appropriate and training and certifying operators for building mechanicalelectrical equipment and systems PECI (1997) estimates $017ft2 as the average cost to recommission existing buildings Applying this cost rate to the Federal building inventory and assuming a 10 resulting reduction in energy use yield a simple payback for recommissioning of 14 years for energy savings alone (Hunt and Sullivan 2002)
Case Study 2-2 demonstrates how significant energy was saved using many of the techniques just described including energy-efficient mechanical equipment and commissioning
23 This is within the range of 5 to 30 estimated for savings associated with sound OampM To estimate the cost reduction of $1310 the energy cost was assumed to have been 10 higher had no commissioning occurred ie it would have been $118009 or about $13100 A 10 savings based on an original annual energy cost of about $13100 is $1310
2-10
This case demonstrates that a significant amount of energy can be saved by analyzing energy consumption using models and choosing technologies with favorable lifecycle costs
Project Description 151000-ft2 Process and Environmenshytal Technology Laboratory in Albuquerque New Mexico houses 180 people in a central core of labs with offices on the perimeter By carefully considering cooling heating and processelectrical loads and revising the design the team increased energy effishyciency by over 20 between the preliminary and final designs
Approach to Sustainable Design The design for this building focused only on the energy aspects of sustainability The efforts began when energy modeling during the first phase of the design process showed consumption that exceeded by 20 the average annual energy use of Sandias most energy-intensive facilities he design team evaluated a wide range of advanced energy-efficiency technologies using energy modeling and lifecycle cost analysis
Sustainable Features The largest energy consumer in the building is the ventilation air system that is required to maintain a safe laboratory environment therefore the laboratory HVAC system was a major focus of the redesign design features included in this building were variable-frequency drives for fan volume and pump control a heat pipe energy recovery system with evaporative cooling a chilled water thermal energy storage system premium efficiency motors a premium efficiency multiple boiler system variable-air-volume fume hoods energy management control systems (full direct digital control) sunshades and reflective glass energy-efficient lighting metering and commissioning
Financial Considerations The table below shows the principal systems that added to first costs the estimated cost savings and simple paybacks tal building cost was $285 million features described in the table added about 4 to the total cost but will quickly be returned in annual cost savings st about $300000 (about 1 of the building design cost) including internal staff time and the contractors test engineers of operation the annual energy consumption was 269000 Btuft2 which was even lower than the 341000 Btuft2 predicted by energy modeling studies
The
T
Sustainable
The to The additional
Commissioning the building co After one year
Principal Systems Adding to First Costs and Estimated Cost Savings and Simple Paybacks
Energy-Efficiency Technology
Added Cost ($)
Added Cost
($1000 ft2)
Energy Savings ($yr)
Energy Savings ($ft2)
Payback Period
(yr)
Variable-frequency drives instead of inlet vanes for fan variable-volume control
109600 726 61700 259 18
Heat pipe energy recovery system with evaporative cooling
329600 2182 31800 211 104
Chilled water thermal energy storage system 239500 1586 104000 689 23
Premium efficiency motors 6930 45 3200 21 22
Premium efficiency multiple-boiler system 8750 58 8200 54 11
Sources Personal communication with R Wrons Sandia and Laboratories for the 21st Century (2001)
2-11
Annual Water Cost Savings
Water efficiency can be achieved using a number of technologies that lower indoor water consumption (compared with the standard technologies available on the market) such as ultra-lowshyflow showerheads and faucet aerators no-water urinals and dual-flush toilets Facilities can also lower potable water consumption by using nonpotable water for productive uses (eg using technologies that harvest rainwater or treat wastewater for re-use in various other applications in the buildings or on the site) better energy systems recirculating water systems (instead of once-through cooling) leak detection and repair and sustainable landscaping
The costs for several water-saving features were estimated for the 20000-ft2 prototype building (see Table 2-4) All of the water-saving strategies analyzed have favorable economics with payback periods from 28 to 03 years If all the strategies in Table 2-4
were implemented the total reduction in the annual cost of water for the building would be about $330 and the first-cost savings would be $590 These measures would reduce water consumption within the building by approximately 57
Table 2-4 Prototype Building Analysis Cost Data for Water-Efficiency Features
Incremental First Cost Per Unit
Incremental First Cost
Per 1000 ft2
Annual Cost Savings
Per 1000 ft2 Simple
Payback (yr)
Ultra-low-flow showerhead
$499 per showerhead $050 $033 15
Ultra-low-flow faucet aerators
$587 per faucet $235 $814 03
Dual-flush toilets $5000 per toilet $1000 $358 28
No-water urinals -$282 per urinal -$4230 $453 Immediate
Costs were converted to a dollar value per 1000 ft2 of gross building floor space to compare types of features Cost values were rounded to three significant digits although the convention of showing two numbers to the right of the decimal place (for cents) was maintained Simple payback periods are shown in tenths of a year
The following features were examined
bull Ultra-low-flow showerheads and faucets The sustainable features examined in this study exceed the current standards required under EPAct The current standards say showerheads cannot exceed 25 gallons per minute (gpm) at the typical building pressure between 40 and 80 pounds per square inch (psi) A more sustainable showerhead that uses 20 gpm was chosen for analysis in this document Under current standards kitchen faucets cannot exceed 25 gpm at 80 psi and restroom faucets cannot exceed 22 gpm at 80 psi For both the kitchen and restroom faucets a 10 gpm model was chosen as the sustainable option for analysis in this document
bull Dual-flush toilets Regulations mandate that toilets not exceed 16 gallons per flush (gpf) A dual-flush toilet has two flushing options liquid flushing at 08 gpf and solid flushing at 16 gpf
bull No-water urinals A no-water urinal that treats the waste chemically was compared with a typical water-using urinal
Many Federal sites (military bases national parks US Post Offices and GSA buildings) have installed no-water urinals and other water-saving devices with great success For example the
2-12
North Island Naval Air Station in San Diego California installed over 200 no-water urinals and the National Aeronautics and Space Administrations Jet Propulsion Laboratory in Pasadena California installed 250 units The University of California Los Angeles (2000) performed a study examining the performance of a urinal that uses no water compared with a urinal that uses 3 gpf The study compared the following parameters to determine how well the no-water urinal performed usage bacterial growth and odor and lifecycle cost The study concluded that the no-water urinal performed better than its specifications In the tests conducted no odors were detected24
Many other water-saving approaches are available including process-oriented technologies and site-specific techniques for which costs are difficult to quantify generically as was done for the low-flow appliances described above However these measures are often very cost effective
bull Cooling towers are often one of the largest water users for large office buildings hospitals and industrial facilities As water is evaporated through the tower dissolved solids remain in the system and build up over time requiring water to be purged from the system through what is known as bleed-off Maintaining water quality is key to saving water in cooling towers and reducing bleed-off Chemical treatment side stream filtration and ozonation can help maintain proper water quality and reduce bleed-off and water consumption
bull Single-pass cooling equipment can also be a major water user in Federal facilities When the equipment is modified to a closed loop system the water can be recycled rather than discharged down the drain saving up to 40 times the water required for heat removal from the equipment
bull Boiler and steam systems are often found in large Federal facilities such as central plants hospitals large office buildings barracks and industrial process plants Proper maintenance of steam traps and condensate return and reduction of blow-down by maintaining proper water quality in the system can help reduce water use in these systems
bull Leak detection and repair of water distribution systems can provide large water savings with very quick payback especially for military bases that have old (pre-1940s) systems Such systems can reduce water losses and operating costs and can increase understanding of system operating characteristics Typically leak detection is done as part of a comprehensive water audit to help determine the source of unaccounted for water consumption at the site
bull Sustainable landscaping using plants native to a region (including drought-resistant plants) reduces (or eliminates) the need for irrigation water This is discussed further in Section 24
Case Study 2-3 discusses the water savings achieved at a facility in Ann Arbor Michigan by using closed-loop cooling and other measures Although this example demonstrates savings in a retrofit situation many of these techniques can be used in constructing new facilities especially those housing laboratory or other process equipment with high water and energy needs
24 The chemical cartridge (a device in the urinals drain that traps odors while allowing urine to pass through) performed with no maintenance problems over 7000 uses (the guaranteed number of uses for each cartridge) and did not clog during the testing period The no-water urinal did not have a greater bacterial growth level than the conventional urinal The study measured concentrations of ammonia the chemical that produces the offensive odors in urinals No significant difference existed between ammonia levels in the vicinity of the two urinals and neither approached the level that can be detected by humans In a retrofit scenario the economic analysis performed for the no-water urinal indicated a simple payback of less than three years and an annual internal rate of return from 37 to 61 (the range is based on population densities of different types of buildings)
2-13
________________________
The National Vehicle and Fuel Emissions Laboratory underwent a major retrofit to reduce energy and water consumption using an Energy Services Performance Contract (ESPC) The facility reduced its water consumption by 80 over baseline conditions saving about $140000 annually through a complete upgrade of the facility HVAC system installation of chilled and hot water recycle loops and use of other conservation measures
Project Description This water-intensive facility is a 30-year-old 175000-ft2 building in Ann Arbor Michigan and is owned and operated by the EPA The building houses offices testing laborashy tories and support spaces The EPA with support from DOEs FEMP awarded an ESPC to NORESCO in 1998 for a comprehensive upgrade of the energy systems this upgrade also significantly reduced water consumption and costs
Approach to Sustainable Design The buildings main functional space is a high-bay research space where vehicles and engines are tested Testing activities consume a high level of both energy and water Before the retrofit the facility had an annual utility bill of over $1 million and annual water consumption averaged 31 million gallons from 1993 to 1995 During that time single-pass cooling water (for the engine test cells air compressors and process chillers) accounted for about 75 of total facility water use Cooling tower makeup water accounted for an additional 10 of the facilitys water use
The facility engaged in an ESPC with the following objectives reduce energy consumption emissions and energy costs through energy conservation measures (ECMs) exceed Federal energy reduction mandates eliminate chlorofluorocarbons (CFCs) reduce water consumption and provide a simple payback of less than 10 years on the contractors capital expenditure Analysis and audits resulted in 11 individual ECMs Although most of the ECMs focused on energy savings many of the energy-savings measures also significantly reduced water use One ECM specifically focused on water conservation by converting once-through cooling systems to closed-loop systems recirculating chilled water to cool process loads at the facility and significantly reducing water consumption
Sustainable Features Key components of the ESPC included replacing 36 rooftop air-handling units replacing existing equipment in the central heating and cooling plant with two new direct-fired chiller-heater absorbers one new high-efficiency condensing boiler and two new cooling tower cells with variable frequency fan drives and adding a new pumping system The upgraded chilled water system was sized to replace the once-through cooling water with recirculated chilled water
Before the ESPC the single-pass cooling system used about 23 million gallons of water per year the upgraded cooling plant with the recirculated chilled water loop reduced water consumption by over 95 to fewer than 1 million gallons In addition before the ESPC boiler makeup water accounted for about 1 million gallons of facility water per year but after replacing the old system with high-efficiency condensing boilers and installing a new hot water piping distribution system the hot water loop makeup now accounts for only 7200 gallons of water per year In addition to the ESPC the facility has used other water-saving best management
An ESPC is a contracting method that allows a contractor (instead of the building owner) to incur the cost of implementing energy savings at a facility The contractor is paid back during the term of the contract from a share of the energy savings resulting from the measures that were implemented
2-14
practices including public information and education programs to educate employees on water conservation topics audits for leak detection and repair a water-efficient landscape that uses no irrigation water and low-flow fixtures and faucets
Financial Considerations The figure below shows water consumption before the measures were implemented (averaged over 1993 to 1995) and after the implementations (in 2002) About 25 million gallons (33 million ft3) of water were saved annually Because water and sewer costs combined are about $420 per 100 cubic feet in Ann Arbor the measures reduced total water and sewer costs by about $140000 annually Associating a precise capital cost directly to this annual water cost savings is difficult because of the synergy between the energy and water savings For example the ESPC replaced 36 rooftop air-handling units that before the retrofit operated in a single-pass mode The new units use enthalpy recovery wheels and recirculate 80 of the air This change reduced water consumption because central plant heating and cooling requirements have been dramatically reduced This reduction created the opportunity to replace the cooling tower with two smaller cells significantly reducing water use in the tower In addition the plant no longer has to humidify single-pass air in the winter
The ECM that was directly related to water reduction (implementing the recirculating chilled water loop) cost about $129000 in first costs and saved over $48000 in water costs in 2002 If these savings are achieved each year the payback period will be 27 years
4500 4000 3500 3000
Baseline
2002 100
ft3 2500
2000 1500 1000 500
0
aJn
Feb
Mar AprMay Ju
n Ju
lA
gSu ep
Oct NovDec
Month
Water Consumption Before and After ECM Implementation
Sources Personal communication with S Dorer Facility Manager at the National Vehicle and Fuel Emissions Laboratory Ann Arbor Michigan R Sieber ERG (consultant) and P Wirdzek EPA Labs21 Program Manager
2-15
Lower Costs of Facility Maintenance and Repair
Sustainable design aims to increase durability and ease of maintenance For example the service areas within sustainable buildings should be designed with enough space to allow easy access to mechanical equipment Easy access will reduce the cost of scheduled maintenance repair and eventual replacement Other approaches can also reduce annual maintenance costs using sustainable design
bull Using durable long-lasting sustainable materials can decrease maintenance and repair costs For instance cement companies have tested fly ash and slag concretes and found that if properly cured they have greater strength and durability than concrete made from normal Portland
25cementbull Using low-emitting paints offers excellent durability according to some vendors26
bull Designing buildings with areas for efficient and convenient collection of recyclable materials such as paper plastic and glass can reduce annual waste disposal costs (if recycling costs are lower than normal charges for municipal solid waste)
bull Using fluorescent lamps reduces labor costs for maintenance These lamps last about 10000 hours as opposed to 1000 hours for incandescent lamps Therefore about 10 lamp changes (and the associated labor costs) are avoided by using fluorescent lamps
bull Lightening roof color can prolong a roofs lifetime (in addition to reducing summertime heat gains and air conditioning costs) (Rosenfeld et al 1995)
bull Using recycled carpet tiles which can be removed and replaced individually reduces the need to replace carpet
bull Using sustainable landscaping techniques typically decreases lawn mowing fertilizer use and irrigation and has short payback periods (eg in the prototype building example below the payback was less than one year)
bull Managing stormwater through natural methods such as drainage ponds that also serve as habitats for wildlife rather than storm sewers often exhibits favorable lifecycle costs
Table 2-5 shows the first costs and annual cost savings of two specific site-related strategies that reduce annual maintenance costs using the same prototypical building described in the previous sections Together the strategies increase first costs by about
$5600 which is quickly repaid through maintenance cost savings of about $3600 annually
Table 2-5 Prototype Building Analysis Costs for Sustainable Siting Features
Incremental First Cost
Incremental First Cost
Per 1000 ft2
Annual Cost Savings
Per 1000 ft2
Simple Payback
(yr)
Sustainable stormwater management
$3140 $157 $2820 56
Sustainable landscape design $2449 $122 $152 08
Costs were converted to a dollar value per 1000 ft2 of gross building floor space so types of features could be compared ly costs per 1000 ft2 by 20 to obtain total costs for the building ere rounded to three significant digits although the convention of showing two numbers to the right of the decimal place (for cents) was maintained ayback periods are shown in tenths of a year
Multip Cost values w
Simple p
25 For example see httpwwwlafargenorthamericacomlafargeNAnsfCementSplashOpenForm 26 For example see httpwwwduroncomproducts-generalinfo-interior-genesishtml
2-16
The two site-related strategies shown in Table 2-5 are described as follows
bull Sustainable stormwater management An integrated stormwater management system combines a porous gravel parking area with a rainwater collection system where rainwater is stored for supplemental irrigation of native landscaping This porous gravel-paved parking area is a heavy load-bearing structure that is filled with porous gravel allowing stormwater to infiltrate the porous pavement (reducing runoff) and to be moved into an underground rainwater collection system The water can be used to supplant fresh water from the public supply for uses that do not require potable water This sustainable system is compared to a conventional asphalt parking area and a standard corrugated pipe stormwater management system without rainwater harvesting
bull Sustainable landscape design A mixture of native warm weather turf and wildflowers is used to create a natural meadow area This strategy is compared with traditional turf landscaping of Kentucky blue grass which requires substantially more irrigation maintenance and chemical application
Although the particular sustainable stormwater system used for the prototype increases the total construction cost by a little over $3000 (about 01 of total building construction cost) it saves over $500 annually in maintenance costs because less labor is required for patching potholes and conducting other maintenance on an asphalt lot The resulting payback period is less than six years The sustainable landscaping approach shows even more favorable economics the incremental first cost is nearly $2500 but this is repaid in less than one year with an annual OampM costs savings of $3045 in avoided maintenance chemical and irrigation costs (See Appendix D for more information on how these costs were calculated) Case Study 2-4 shows a real-world example of the cost savings associated with sustainable landscaping
Lower Churn Costs
In todays work environment employees are increasingly relocated within existing buildings to improve organizational effectiveness or as a result of downsizing reorganization of the business or business growth A survey conducted by the International Facility Management Association (IFMA) and published in 1997 determined that on average 44 of building occupants move within a given year This is called the churn rate27 In government buildings the churn rate appears to be somewhat lower ndash 27 (The survey included 20 government respondents) The survey found that the churn rate has been increasing over time
Moves are expensive According to IFMA (1997) the average move in the government cost $1340 (per person) The cost of a move depends on the extent to which the facility must be modified to accommodate the changes IFMA found that if new walls new or additional wiring new telecommunications systems or other construction is needed to complete the move the average cost in a government setting is $3640 (IFMA calls this a construction move) However if no furniture is moved no wiring or telecommunication system changes are required and only files and supplies are moved the average cost in a government building dropped to $166 (IFMA calls this a
27 The churn rate is defined as the total number of moves made in a 12-month period divided by the total number of occupants multiplied by 100 (to obtain a percentage)
2-17
This case study demonstrates how native landscaping can reduce both installation and OampM costs of landscaping a Federal facility The cornerstone of this design is the native trees which require no irrigation system provide shade to the building and require very little maintenance compared with a traditional landscape of sod and large non-native trees
Project Description The facility ndash built in 2001 in Argonne Illinois ndash is Argonnes shipping and receiving warehouse It was built onto an existing structure
Approach to Sustainable Design The design and integration team for the facility began incorporating design review early to ensure that all technical aspects were properly evaluated Other aspects vital to the projects success included educating the building occushypants about sustainable features and training the maintenance staff
Sustainable Features Argonne incorporated many sustainable design features into the facilshyity One hundred immature native trees were planted in small groups surrounding the facility The trees were much smaller than the larger mature trees traditionally planted on Argonne grounds Planting smaller trees helps reduce both the stress on the trees at planting and their long-term water requirements Native turf was seeded on the grounds instead of planting traditional sod thereby eliminating the need for an irrigation system
Other sustainable features included recycled building materials such as concrete block carpet structured steel lumber ceiling tiles partitions and gypsum board In addition efficient water fixtures in the rest-rooms low VOC paint an energy-efficient mechanical system high-performance windows and a rooftop rain catchment system were integrated in the sustainable design The facility was LEED-certified in spring 2002
Financial Considerations The native landscaping significantly reduced installation and OampM costs Installation costs were reduced because smaller holes were required to plant smaller trees The 100 native trees that were planted on the grounds had the same estimated cost as 40 mature trees Seeding native grass on the grounds was a much less labor-intensive practice than laying sod Sod also requires large amounts of water to saturate the ground so the sod can adapt to the new environment Seeding with native grass and eliminating the irrigation system saved Argonne about $11000 in first costs
In one growing season the trees and seeded grass became well established and currently do not require supplemental water to remain healthy If large non-native trees and sod had been used regular watering would have been required for two growing seasons and supplemental water would have been required during droughts The native landscaping reduced water requirements by an estimated 40 within the first two growing seasons and reduced the need to mow and fertilize the native grass Overall the native landscape reduces OampM costs by an estimated 50 compared with more traditional landscape
Sources Personal communication with K Trychta Argonnes Pollution Prevention Coordinator
2-18
box move)28 If existing furniture is reconfigured or furniture is moved or purchased but only minimal telecommunication reconfiguration is needed the government cost averaged $613 (a furniture move)
To reduce churn costs many high-performance sustainable buildings include a raised floor system that creates an underfloor plenum used for HVAC air distribution and modular power cabling and telecommunicationsdata systems The HVAC system and cables in the underfloor plenum typically are accessible through individual movable floor tiles These raised-floor systems also enable personal controls to be used allowing each occupant to control the level of ventilation temperature and lighting levels at his or her own workstation (the benefits of personal controls on occupant productivity health and well-being are discussed in Section 3) In addition sustainable buildings often use removable partitions in place of permanent walls
Using raised floor systems and removable partitions When using underfloor air systems local
can significantly reduce churn costs No ductwork workstation air conditioning control devices can revisions or other complex construction is needed be relocated in less than five minutes with a to alter workstation configurations The access floor screwdriver being the only tool required system together with floor diffusers allows the layout of the space to be modified with very little Source Shute (1992)
lost work time The move costs in a building with a raised floor and movable partitions would be closer to the box or furniture moves described above ($166 to $613 per person) than to the construction move ($3640 per person)
The first costs of a building with a raised floor system and underfloor HVACcabling will depend on the many factors specific to the building but estimates documented by Loftness et al (2002) indicate that the first costs are about the same as (or only slightly higher than) those in a building with a traditional acoustical tile or drywall ceiling system29 The major additional cost of such a building is the raised floor itself ndash from $3 to $10ft2 depending on manufacturer quality and integrated components (Loftness et al 2002) compared with installed acoustical ceiling tile which typically costs $149 to $231ft2 (RS Means Company Inc 2002) However the additional costs for the raised floor would most likely be offset by a lower first cost of the underfloor air-handling system compared with the traditional ceiling air-handling systems Milam (1992) states Most HVAC equipment installation occurs below the raised floor therefore laborers perform little work on ladders platforms or hoists This allows substantial increases in laborer productivity that corresponds to savings in labor costs These underfloor air-handling systems also usually have smaller piping pumps and refrigeration equipment and most of the ductwork is eliminated
In addition to HVAC savings the underfloor system also reduces first costs of power distribution receptacles data communication devices and labor for installing cabling Some evidence exists
28 Using the entire population of buildings surveyed by IFMA (1997) including various types of private-sector enterprises the average cost per move was $1207 the average cost of a construction move was $4194 the average cost of a box move was $149 and the average cost of a furniture move was $523 29 One study (Wilson 1998) of a private-sector office building in California estimated a $270ft2 decrease in first cost for the access floor system (compared with an overhead system) Part of the estimated cost reduction in this study was from using carpet tiles in the building with the access floor versus rolled goods in the traditional building which decreased the cost of the access floor by almost $100000 However given that the traditional building could also use carpet tiles the cost differential of $270 seems somewhat overstated If the carpet difference were eliminated from the estimate the cost of the building with the access floor would have been about equal to that of the standard ceiling HVAC distribution system Thus even though these data do not necessarily show that the access from system is less expensive than an overhead system the data do indicate that the differences in cost between the two kinds of systems are negligible
2-19
that underfloor HVAC systems also reduce annual energy costs by 20 to 35 (Loftness et al 2002) See the comprehensive report by Loftness et al (2002) for a complete explanation of the costs and benefits of these underfloor systems In addition to churn cost savings the use of
underfloor systems and movable partitions also saves materials and material costs during moves
For the prototype 20000-ft2 office building which hypothetically houses about 100 occupants building owners could save from $35000 to $81000 in churn costs 30 if the building were outfitted with an
The cost of an intelligent building with a good underfloor system and moveable wall partitions quality access floor a modular electrical
instead of traditional systems These savings likely distribution system and under-floor air is very could be achieved with little additional first cost close to the cost of a traditional poke-through
building (less than 1 greater) Research Summary 2-1 provides data on churn costs in an actual government office building with 1500 Source York 1994 (cited in Loftness 2002)
work stations (the Rachel Carson State Office Building in Harrisburg Pennsylvania) This study indicates that a high-performance green building with a raised floor could save over $800000 annually (compared with one without the raised floor) in a large building that has a 25 annual churn rate (a savings of $2250 per person moved) The costs of churn are often neglected when the lifecycle costs of a building are estimated This evidence indicates that such costs should be more seriously considered
Lower Absenteeism and Improved Productivity
Many studies which will be described in $35B Ene rgy $05B Wate r and S e we r this section have shown that building occupants respond to some of the $20B Faci l i ty Constructi on features of sustainable buildings by working more productively making fewer errors and being absent less often thus reducing labor costs
Figure 2-1 shows that as a fraction of total expenditures labor costs in the government far exceed construction energy or other annual costs31 so measures that positively influence worker performance and absenteeism rates could have a much higher financial impact than energy efficiency or other
Figure 2-1 Annual Federal Government Costs measures affecting operating costs
30 These figures assume 27 moves at a savings per person of about $1300 (the difference between the average government move and the box move) to $3500 per move (the rough difference between a construction move and a box move) Although Loftness et al (2002) estimate somewhat lower cost savings of $100 to $500 per move the cost savings of $2250 per move estimated for the case study of the Rachel Carson State Office Building is at about the midpoint of the estimated range used in these figures 31 Sources for data in Figure 2-1 include Office of Personnel Management website httpwwwopmgovfeddata02factbkpdf and Federal Facilities Council (2001) Note that personnel costs are for civilians only (including civilian employees of US Department of Defense) Energy and other costs include military facilities
$194B S al ari e s and Be ne fi ts
and Re novati on
2-20
The Pennsylvania Department of Environmental Protection (DEP) took advantage of its need to relocate 700 of the 1500 employees in the Rachel Carson State Office Building (RCSOB) in Harrisburg Pennsylvania to estimate the cost of churn The actual cost of the moves in RCSOB which did not have a raised floor system was compared with the estimated churn cost in a new high-performance green technology office ndash South Central Regional Office Building (SCROB) ndash where employees had similar functions and space requirements The comparison shows that using raised floor systems in sustainable buildings can reduce churn costs by 90
Research Team Staff members of the Pennsylvania DEP J Toothaker Lead
Research Setting The RCSOB is a traditional 16-story office structure with a central service core It is equipped with carpet tile a cellular floor for electrical and telephonedata distribution modular furniture full-height demountable walls and mechanized central file systems on all floors However it does not have a raised floor Its dropped ceiling contains drop-in fluorescent light fixtures sprinklers and a variable-airshyvolume HVAC ceiling distribution system the building also has a hot water perimeter heating system Exterior walls are glass and the central core provides restrooms elevators electrical rooms telephonedata rooms and communicating stairways on each floor
The opportunity to study churn costs in this building resulted from a requirement to reconfigure and reloshycate 700 of the 1500 employees in this facility to reorganize one agency into two agencies Workshystations and common areas had to be reconfigured Two floors were completely reconfigured to accomshymodate about 240 work areas with the remaining 460 workstations scattered throughout the remaining twelve floors This involved the following bull Dismantling and reconstructing private offices bull Unwiring cleaning and reconfiguring the
modular furniture and cleaning the chairs bull Reconfiguring variable-air-volume boxes lights
and sprinkler heads in the ceilings bull Reconfiguring central file equipment and the
electrical and telephonedata connections on each floor
bull Cleaning or painting all surfaces in the reconfigured areas
bull Relocating personal computers and peripherals
Components within the SCROBs Raised Floor System
The photo shows the plenum space below the floor surface and the air diffuser phone modemfax mounting and power strip on top of the carpet tile
All of this work was done using competitively bid contracts with about 50 of the labor performed at straight time during the workday and the remainder at premium pay at night and on weekends
DEP had just completed SCROB a high-performance green technology office with a raised floor system This project allowed the team to compare churn costs between the two types of offices The primary difference in the churn costs between the two buildings is the use of a raised floor system to create a floor plenum for HVAC air distribution which also houses the modular power and telephonedata distribution systems This raised floor plenum system with its individual floor tiles which are movable and easy to relocate allows easy access to the floor HVAC diffusers and power telephonedata cables When the raised
2-21
floor system is used systems furniture and demountable walls are no longer wired together which further reduces cost and lapse time for churn
Methodology The comparative evaluation consisted of a methodical review of the actual unit costs and elapsed time needed for each contracted activity for the RCSOB moves Then the DEP estimated the cost and time needed for each of the same activities for a comparable move in the SCROB
Results The cost for the RCSOB project which reconfigured 700 workspaces (including both offices and open workstations) was about $1777 million or $2538 per person ojects actual renovations and reconfigurations were completed in about three months
DEP conducted a detailed analysis of the move costs including all materials and labor for each contracted activity ach contracted activity in the new building with the raised floor (SCROB) was estimated The cost and length of time to physically reconfigure work spaces were estimated to be about 90 lower in SCROB than in RCSOB The table below shows the calculations (for ease of presentation numbers and percentages were rounded)
Comparison Analysis of the Moving Costs in RCSOB
Actual Costs in the RCSOB
Hypothetical Costs Had A Raised Floor Been Installed in RCSOB
Building type Conventional office facility High-performance green building (raised floor)
Number of work spaces 1500 1500
Annual churn rate 25 25
Number of work spaces reconfigured annually
375 375
Cost per reconfiguration $2500 (based on actual data) $250 (estimated based on situation in SCROB)
Annual cost of churn $937500 $93750
Churn cost savings Not applicable $843750
The RCSOB was completed in 1993 at a constructed cost slightly over $40 million If the facility had been designed and built with a raised floor lower churn costs equal to over 2 of its constructed cost per year could have saved DEP about $76 million since the buildings occupancy in 1993
Source Personal communication with JS Toothaker former Bureau Director DEP Commonwealth of Pennsylvania Mr Toothaker managed the 700-employee move in the RCSOB and compared the actual and estimated costs between the two facilities based on his personal participation and knowledge of the facilities Mr Toothaker was the principal developer of the Building Green in Pennsylvania Program
The pr
E
2-22
One key research study (Milton et al 2000) that examined the relationship between absenteeism and ventilation rates is highlighted in Research Summary 2-2 This study assigned dollar values to the benefits of better ventilation and estimated potential annual cost savings of about $25000 per 100 employees resulting from a one-time investment in better ventilation systems of $8000 per 100 employees This research strongly implies that designers should pursue the goal of good indoor air quality simultaneously with the goal of energy efficiency
A research study assessed sick leave for 3720 hourly workers in a large manufacturing firm in Massachusetts to determine the relationship between absenteeism and factors such as ventilation humidity and indoor air quality The study showed that $24444 per 100 employees could be saved annually with a one-time investment in improved ventilation of $8050 per 100 employees
Research Team The research team included DK Milton of the Harvard School of Public Health PM Glencross of the Harvard School of Public Health and Polaroid and MD Walters of Polaroid
Research Setting The research setting was 40 buildings and 115 independently ventilated work areas
Methodology Sick leave data were gathered from corporate records (excluding extended sick leave or short-term disability) Other data gathered on employees included age gender race shift job code years of employment and the employees primary work area (building and floor)
The final analysis focused on clerical workers to control for the potential effects of occupational factors The analysis also used existing corporate records to identify building characteristics and indoor environmental quality complaints The study gathered the following data on each building in the study bull Presence of devices to humidify supply air such as steam spray and finfill humidifiers bull Formal complaints to the corporate environmental health and safety office and remediation efforts bull Ventilation ratings for each floor ndash categories as either moderate (about 12 Ls) or high (about 24
Ls) bull Additional air quality data including endotoxin and total airborne bacteria counts culturable
bacteria culturable fungi spore counts and VOCs
Key Findings The studys results included the following bull Moderate ventilation and use of humidifiers were associated with more total sick leave as well as more
short-term sick leave bull Of the short-term sick leave 35 was attributed to lower ventilation rates translating to 12 to 19
days of increased sick leave per person per year bull Reductions in sick leave from improved ventilation were similar to reductions during flu season due to
influenza vaccination bull Respiratory illnesses caused by airborne viruses or bacteria could be effectively reduced with ultraviolet
irradiation of air near the ceiling and with increased ventilation bull Economic analysis showed that investing $8050 per 100 employees in improved ventilation could
reduce sick leave by $24444 per 100 employees (from $39950 to $15506 per 100 employees)
Source Milton et al (2000)
2-23
Another study of 11000 workers in the Netherlands found that absenteeism from sick building syndrome is likely to be 34 lower when workers have control over their thermal conditions (Preller et al 1990) A comprehensive study of methods to improve indoor environmental conditions estimated that the value of improved productivity (including lower absenteeism) of office workers could be as high as $160 billion nationwide (Fisk 2000)
Measuring productivity is relatively straightforward for simple information processing tasks such as data entry and forms processing For most knowledge workers however productivity is more difficult to measure because the outcomes are highly variable often elusive and difficult to document32 Furthermore much knowledge work is valued for its impact rather than its output Impact refers to the value of the work (as indicated by an idea concept plan or policy) to the organization Because of these difficulties the building blocks or precursors of productivity are often measured rather than work output These blocks or precursors include specific kinds of tasks associated with knowledge work performance such as attention reading comprehension creativity and logical thinking
Performance benefits resulting from sustainable building features are described below The evidence presented on performance benefits is drawn primarily from research conducted on occupants of actual buildings rather than from laboratory studies The studies cited are from peer-reviewed publications or conference proceedings and include publications in building science lighting environmental psychology and human factors Taken as a whole the studies show a cluster of building factors associated with improved performance good ventilation glare-free lighting personal control over temperatures and ventilation and good maintenance and cleaning especially of the HVAC system These factors appear to influence performance by reducing illness symptoms that interfere with work by increasing alertness and reducing fatigue and by reducing visibility problems
bull Performance on clerical and word processing tasks Much of the research on work perforshymance has been conducted in experimental settings where stimuli can be carefully controlled although a few studies have been conducted in actual work settings For example a field simulation study tested performance on a word processing task in an office with and without a 20-year-old carpet (Wargocki et al 2000) The study found that workers performance was 65 better without the carpet All other factors such as ventilation and temperatures were held constant Therefore the results are due to air quality differences associated with the old carpet A frequently cited field study (see Research Summary 2-3) conducted in an insurance agency building found a 16 increase in performance on forms processing when the company moved into a new building (Kroner et al 1992) The measure was actual work productivity not performance on simulated tasks Of the overall 16 increase in productivity 3 was attributed to using personal controls over temperature and ventilation and 13 was attributed to generally improved building quality and interior design including improved daylight views of a natural landscape better access to windows by workers and increased visual openness of the environment In a review of building studies Wyon (1996) estimated that providing workers with temperature control of just three degrees (plus or minus) would result in productivity increases of 7 for typical clerical tasks
32 In some cases researchers have attempted to associate a dollar figure on the absenteeism and other occupant benefits The Center for Building Performance and Diagnostics within the School of Architecture at Carnegie Mellon University has collated a large body of research into a tool called the Building Investment Decision Support This tool allows a user to generalize the results of a particular research studies to estimate potential dollar benefits at the users facility
2-24
This study assessed the impact of workstation personal controls and other features typically associated with sustainable buildings on worker productivity using an existing performance monitoring system When the organization moved into the new building overall productivity increased by 16 Of that 3 was associated with the system that provided personal control over temperature air velocitydirection task lighting and sound masking
Research Team Rensselaer Polytechnic University
Research Setting The research took place in an existing building and a new building that had personal controls at most of the workstations
Features of the Old Building bull 61800 ft2 for 400 workers (considered crowded) bull No task lights ceiling lights were 4-ft recessed
fluorescent fixtures bull Three different air distribution strategies bull Located in the center of town bull Managers located along window wall workers in
central core
Features of the New Building bull 149800 ft2 for 400 occupants and many amenities
(conference rooms instructional rooms auditorishyum cafeteria exercise room and outdoor patio)
bull Skylights bull Indirect lighting bull 370 workstations with personal control over
temperatures air velocity and direction task lighting and sound masking
bull 92 of workers on the perimeter with access to daylight and views (versus 30 in old building)
Personal Control System
bull Location in a prairie landscape setting with trees and a pond
Methodology Data were gathered for workers in the accounting and underwriting departments for 27 weeks before they moved into the new building and 51 weeks after the move files of each type that each employee processed during the week ly account for the effect of the personal controls (versus the potential impacts of other building or organizational changes) components of the control system were randomly disabled during the last 24 weeks of the study ndash air velocity air temperature and the radiant panel
Data included the number of To separate
Key Findings The studys results included the following bull The combined effect of the new building and the personal controls produced a median increase in
productivity of about 16 Personal controls accounted for a 3 increase and the new building and setting accounted for 13
bull Overall satisfaction increased from 46 in the old building to 75 in the new building bull Satisfaction with the new buildings temperatures air quality noise and lighting all improved
Sources Kroner et al (1992)
2-25
bull Attention and concentration Studies have also found that certain sustainable design features improve performance on tasks requiring high levels of attention For instance a study by Nunes et al (1993) found performance increases from 7 to 30 depending on the task The variability in performance was attributed to differences in ventilation levels and the consequent impact on illness symptoms Lower levels of ventilation were linked to higher reports of symptoms which in turn were associated with poorer performance Workers reporting symptoms worked 72 slower on a vigilance task and made 30 more errors on a digit substitution task
Numerous studies show performance problems from increases in noise distractions and interruptions (Fried et al 2001 Jones and Norris 1992) Decreased performance is more likely for complex creative tasks and tasks relying heavily on short-term memory such as writing and computational work Many of the factors that increase noise distractions (eg smaller workstation sizes increased densities and reduced use of carpeting or other sound-absorbing materials) are commonly used to achieve sustainable goals such as increased access to daylight and views and improved flexibility Therefore sustainability-oriented designers should consider both positive and negative impacts of various design features in the final design
bull Complex cognitive performance Improved performance on logical thinking tasks has also been reported in a review of interior environmental quality (Wyon 1996) Wyon cites studies in Sweden showing a 27 increase in logical thinking associated with personal control over temperatures The impact of temperature conditions on performance is complex with some studies showing improved performance on creativity and memory tasks with slightly elevated temperatures and with the opposite shown for concentration and logical thinking which may benefit from slightly cool temperatures (Wyon 1996)
bull Organizational level performance Most productivity studies focus on individual level work However there is evidence that building design can influence high-level organizational outcomes An analysis of the Total Quality Management (TQM) metrics data used by Herman Miller to assess its performance shows small increases of 022 in overall productivity and increases of 1 to 2 on other indicators after the organization moved into a new sustainable building (Heerwagen 2000) (This study is described in Section 32)
bull Self-ratings of productivity Research in office settings often resorts to employees rating their own productivity (ie self-rating) because of the difficulty of obtaining actual work outputs Although self-measures tend to be overestimated when the measure is used in a comparative manner to assess responses to baseline environments and change initiatives they provide useful information (Leaman and Bordass 2001) They also are fairly easy to administer
Studies using self-assessments of productivity have found strong relationships to thermal and air quality factors in line with studies of actual performance as noted above In a review of occupant surveys over a 20-year period in the United Kingdom Leaman (1999) reports that comfort and perceived productivity are greater in buildings where occupants have more control over the environment and in mixed-mode buildings that have both natural ventilation and air conditioning Two studies of more than 11000 workers in 107 buildings in Europe also found increases in perceived productivity in buildings that provided workers with control over temperature and ventilation conditions (Preller et al 1990)
Similar results are reported for an intervention study in Canada (Menzies et al 1997) The study consisted of two groups of workers in a mechanically ventilated building The intervention
2-26
group was given control over the ventilation at the workstation with a handheld infrared device that could regulate the amount and direction of air flow from four-inch air outlets in the ceiling The control group was not given any control over ventilation Workers in the intervention group said their productivity increased by 11 at 16 months after the study In contrast workers in the control group said their productivity decreased by 4 Environmental assessments of the two spaces showed that air velocity in the intervention space tripled and that both temperature and ventilation variability across the space increased also (an indication that workers were making adjustments according to their personal preferences and needs)
A field study of electric lighting systems found increased self-ratings of performance with indirect lighting due to decreased glare on computer screens as well as reduced eye problems (Hedge et al 1995)
Other Economic Benefits to the Building Owner
Federal agencies as well as sustainable building owners in the private sector are likely to accrue economic benefits as a consequence of a sustainable facilitys environmentally and socially conscious image and its positive impacts on building occupants prospective employees the community surrounding the facility and society as a whole
Research has been conducted on a few important topics related to sustainable buildings from which inferences can be drawn about the building owners economic benefits which are sometimes less direct andor longer term than the benefits described in Sections 21 through 26 This section discusses several of these somewhat indirect or longer-term economic benefits
bull Better worker retention and recruitment bull Lower cost of dealing with complaints bull Decreased risk liability and insurance rates bull Greater building longevity bull Better resale value bull Ease of siting bull Strategic and economic value of an improved image
Better Worker Retention and Recruitment
The environmentally conscious image associated with an agency that builds or occupies sustainable buildings may result in employee pride satisfaction and well-being that translate into reduced turnover improved morale and a more positive commitment to the employer These effects may have a big financial impact by reducing labor replacement and training costs In addition these effects transfer to the building owner a reputation as a desirable employer which in turn creates valuable leverage for attracting recruiting and retaining talented employees Moreover developing a high-caliber workforce ultimately results in additional long-term performance benefits described above While rigorous statistical studies on employee retention and attraction in sustainable facilities have not been conducted many studies have shown increased feelings of well-being associated with sustainable buildings (see Section 32) The retention and attraction aspects are a logical (although not fully proven) extension of feelings of well-being
In his recent book The Sustainable Advantage Willard (2002) argues that sustainability as a corporate strategy will become more common if it can be linked more convincingly to business value As Willard argues organizations that make sustainability a core value may benefit by being
2-27
able to attract and retain young workers who also value the environment and who will therefore be more willing to work harder to ensure that the organizations environmental values are realized Willard also acknowledges that the work environment itself may influence attraction retention and productivity by creating better working conditions
Lower Cost of Dealing with Complaints
When building occupants are uncomfortable ndash typically from a room temperature that is too hot or too cold ndash building maintenance engineers spend hours dealing with complaints In a study of the costs of dealing with discomforts researchers estimated that efforts to increase comfort could decrease the labor costs of responding to complaints by 12 (Federspiel 2001) The data from the study show that it takes 14 hours on average to diagnose a hot complaint and 17 hours to diagnose a cold complaint The data also suggest that complaints are not due to differences among individuals but rather to HVAC faults or poor control performance Sustainable buildings that have well-designed HVAC and control systems that have been commissioned are less likely to experience these problems
Another study reports that personal controls for HVAC systems reduce complaints to as low as 10 calls per 1000 employees per year (Loftness et al 2002) (Those controls can be installed only in conjunction with underfloor air distribution systems)
Less time dealing with complaints leads to more time to complete preventive maintenance tasks increasing equipment longevity and lowering operating costs overall
Decreased Risk Liability and Insurance Rates33
Building owners and operators face a wide range of risks (described below) which are particularly disruptive and costly in mission-critical governmental activities (civilian or military) Those risks may be partially mitigated by sustainable building design
bull Property loss prevention Various green-building technologies reduce the likelihood of physical damages and losses in facilities (American Insurance Association 1999 Vine et al 1998 and 1999 and Mills 2003b) For example sustainable siting reduces the likelihood of property damage from flooding mudslides and soil subsidence Efficient thermal envelopes and reduction in losses from recessed lighting or thermal distribution systems located above ceilings reduce the risk of ice-dam formation on roofs Using efficient torchiere light fixtures eliminates the fire risk posed by halogen versions
bull Business interruption loss prevention Unplanned power outages and improperly designed or maintained HVAC systems can cause temporary closure of facilities resulting in disruption of operations and relocation costs (Brady 1995 Eto et al 2001 and Mills 2001) These business interruption risks can be reduced by using onsite energy generation resources and energy-efficiency features
bull Hedge against energy price and cost increases Energy is a significant part of facility operating costs The likelihood of budget overruns from unanticipated energy price spikes can be reduced by energy-efficient design that lowers overall consumption
bull Natural disaster preparedness and recovery Various energy-efficient and renewable technologies make facilities less vulnerable to natural disaster events such as heat catastrophes which are a particularly high risk for federally operated low-income housing (Deering and
33 Dr E Mills of Lawrence Berkely National Laboratory contributed portions of this section
2-28
Thornton 1998 Mills 2003a) Well-insulated attics natural ventilation and heat-reflective roofing materials can considerably reduce indoor temperatures during heat waves averting hospitalization or loss of life Using multipane (eg triple-glazed) windows can reduce the threat of fire-related losses
bull Worker health and safety and risk of lawsuits Various benefits result from improved indoor environmental quality reduced likelihood of moisture damage and other factors enhancing occupant health and safety (Chen and Vine 1998 Vine et al 1998) Owners may face lawsuits when their buildings cause illness among occupants According to a study by the American Medical Association and the US Army health problems caused by poor indoor air quality cost 150 million workdays and about $15 billion in lost productivity each year in the United States 34
Increasingly the issue of sick building syndrome ends up in the courts with either builders designers or building owners being held liable for design flaws or improper operation For example in 1995 a jury awarded Polk County Florida almost $26 million to correct the con-tractors health-related design and construction flaws in the Countys eight-year-old courthouse In 1996 a jury found Dupage County Illinois responsible ndash as the building owner ndash for health-related complaints at its $53 million courthouse calling the problems a result of improper OampM34
Risk (and associated losses) has a cost even when organizations are insured Customer-side costs that occur when insurance is used include deductibles premiums (and premium increases or policy cancellations due to losses) and possible excess costs if the insurance or reinsurance coverage is capped If commercial insurance is not used (as is often but not universally the case in the government sector) the costs of risk are even higher because the facility owner is either formally or informally self-insured Formal self-insurance implies that a predefined premium is set aside from internal budgets and accumulated in the form of an earmarked loss reserve If self-insurance is informal (typically the case in the public sector) then the risks are not explicitly anticipated or otherwise reserved Where formal or informal self-insurance is used in the public sector risk management takes on particularly high value because there is no upper limit against loss costs and because losses would usually have to be absorbed in general operating budgets without guaranty of reimbursement
When Federal facilities do have insurance coverage some insurance companies are willing to offer lower insurance premiums for buildings or sites that have incorporated features that not only improve safety but that also have positive environmental effects For instance insurance companies have lowered premiums for buildings with high mass walls because they reduce the risk of fire These walls can also save energy and enhance comfort by storing heat and evening out temperature fluctuations In another example of lower premiums the Federal Emergency Management Agency reduced the premium on flood insurance by 5 for all buildings in unincorporated areas of Charleston County South Carolina based on voluntary efforts on the part of the developers of Dewees Island to improve the countys flood management capabilities by taking actions to reduce the chance of flooding on the island34
A number of forward-looking insurers have endorsed or otherwise supported energy-efficient and renewable energy technologies by initiating various types of programs or policies (Mills 2003b) In some cases insurance companies have offered premium credits of about 10 when the insured implemented selected energy-saving strategies For example the nations largest professional liability insurer ndash DPIC ndash offers 10 credits for firms that practice commissioning and the former
34 Rocky Mountain Institute website httpwwwrmiorgsitepagespid221php
2-29
Hanover Insurance Company offered 10 credits for earth-sheltered or solar buildings on the basis that lower fuel-based heating system operating hours reduce fire risk (Mills 2003b)
Greater Building Longevity
Many of the principles of sustainable design lead If our buildings are not designed to last at least 250 to longer building lifetimes and better adaptabishyto 300 years were not asking the right questions
lity of the building for future uses that cannot always be foreseen If buildings do not have to John Abrams South Mountain Company be frequently demolished and replaced total (quoted in Building Green Inc 2003) construction costs will be lower over the long run For instance keeping a buildings initial form simple will make it easier to change as needs evolve Using open-web joists and modular access flooring systems makes refitting buildings for new uses less complicated Designing rooms as multipurpose spaces allows them to be adapted for future changes in use (eg from residential to commercial space) Other strategies for adaptability include selecting durable materials that age well designing roofs to be photovoltaic-ready designing the building foundation and structure to accept additional floors at a later date avoiding partitions and leaving as much open space as possible and designing with classic and regionally appropriate styles 35
Better Resale Value
Although turnover of Federal government buildings is not as frequent as in the commercial real estate market the Federal government does sometimes sell unneeded facilities For instance in 1998 the GSA sold over 1500 properties for a total of about $250 million In subsequent years the GSA has sold between 130 and 300 buildings per year for a total price per year of $312 million to $479 million 36
Research shows that investing in sustainable design features such as energy- and water-efficiency measures can considerably increase the resale value of a property because it lowers annual costs and therefore makes a building more profitable for the new owner (Chou and Parker 2000) Real estate investors evaluate building values based on cash flow and net operating income (NOI) which is the pretax operating income minus operating expenses excluding debt service Reducing utility costs increases NOI A case study showed that a one-time investment in energy- and water-efficiency upgrades that cost $095ft2 (18 of the purchase price) saved $066ft2 in annual operating costs (equal to 15 of NOI) (Mills 2002) These savings increased the estimated resale value of the property (a small apartment building) by $36000 to $46000 (for prevailing capitalization rates of 9 and 7 respectively) ndash about ten times the initial investment for the improvements 37
Ease of Siting
The inherent environmental benefits of a sustainable building will reduce its adverse environmental impacts and enhance its acceptability to regulatory bodies the surrounding communities environshymental groups and other interested parties These benefits will tend to lower both the time delays and the cost associated with siting the building including obtaining permits and performing
35 Many strategies for making buildings adaptable for new uses are outlined in a recent article in Building Green Inc (2003)36 Personal communication from R Rice GSA 37 The capitalization or CAP rate (also knows as return on assets ROA) is defined as the ratio of NOI to the property value The ratio NOICAP provides an approximation of property value
2-30
environmental impact studies Gaining early respect and support from a community can greatly speed up project approvals For example the developers of Central Market a grocery store in the town of Poulsbo Washington say that the decision to enhance an onsite wetland and offer it to the city as a park not only reduced maintenance costs but also avoided delays by generating strong community support The developer Sam Clarke Executive Partner of the Hattaland Partnership stated The city of Poulsbo and key community leaders are well aware of our work [to enhance the environment] mdashthis establishes trust and respect which translate eventually into financial advantages38
Strategic and Economic Value of an Improved Image
An organization that owns and operates a sustainable building will tend to capture intangible value through stakeholder awareness and respect While difficult to quantify precisely this effect undoubtedly creates strategic advantage in dealing with various stakeholders eg nongovernshymental organizations other agencies and the public In essence the sustainable nature of the building can be considered a symbolic message to building visitors as well as community members and passers-by who recognize its distinctive character For example innovative sustainable buildings in the private sector including the headquarters buildings of The Gap and Herman Miller as well as the Ford Motor Company Rouge Plant have received extensive positive media coverage
Key aspects of the message conveyed by a sustainable or green building include technological advancement architectural innovation and concern for humanity and the environment The building owners can promote this message through various awareness-building techniques including posters brochures organized tours and media publicity When the sustainability of the building reinforces the primary mission of a Federal agency (eg environmental management energy efficiency and technological innovation) this image value will be particularly powerful Community groups elected representatives nongovernmental organizations and others involved in the political process may view the Federal agency owner of a sustainable building as a supporter of their interests and this positive view can translate into improved political support
Some research has been conducted to evaluate indirect financial benefits of corporate sustainability efforts While these efforts have not been directed specifically at sustainable building projects they do have some relevance to understanding the value of the improved image associated with an organizations sustainability-related activities For example a number of environmental accounting techniques have been developed using economic value added and other shareholder value measures to estimate the likely future cash flows related to the environmental impacts of capital investments and facility siting decisions (Epstein and Young 1999)
One ongoing project by SustainAbility a strategic management consultancy and think tank based in Europe has established a mapping between business value measures and dimensions of corporate sustainable development performance with documented examples that will be expanded through continued updating (SustainAbility and United Nations Environmental Program 2001) The SustainAbility project found strong evidence linking access to capital and shareholder value to a companys commitment to environmental process improvement They also found strong evidence linking corporate revenue to good workplace conditions These results indicate that both environmental and social aspects of sustainable design may impact a companys economic performance Although the government is not motivated by revenue and shareholder value per se
38 Excerpted from Rocky Mountain Institute website httpwwwrmiorgsitepagespid221php
2-31
some government analogs to these metrics exist (eg revenue and access to capital in the private sector could be viewed as analogous to higher budget allocations in a government setting)
In another effort the American Institute for Chemical Engineers (1999) developed a total cost assessment methodology for managerial decision-making that identifies the full range of environmental- and health-related costs associated with the lifecycle of a business decision including indirect contingent and intangible costs The World Resources Institute recently published a critical survey of the available methods for quantifying the business case for sustainability (Reed 2001) The greatest impediment to applying these types of quantitative methods is the absence of sufficient empirical data Not enough experience exists yet with sustainable business decision-making to satisfy the needs of financial analysts However as this section has discussed in detail research has been conducted on many important economic benefits of sustainable buildings from which good inferences can be drawn about the strategic and financial advantages of sustainable design and construction
Indirect Economic Benefits to Society
Building construction operation and demolition have a variety of environmental impacts including air pollution emissions greenhouse gas emissions associated with climate change solid waste generation water pollution natural resource depletion and habitat disturbance (see Section 4) Sustainable design aims to significantly reduce these impacts These improvements will reduce the health effects and costs associated with environmental pollution and will have other less tangible economic value to society In addition by reducing energy consumption and waste generation widespread application of sustainable design principles to new construction and renovations will over time reduce the need for new infrastructure required to support buildings ndash eg power plants transmission and distribution lines and landfills ndash and may foster local and regional growth in emerging businesses related to sustainable design The economic aspects of these societal benefits ndash decreases in environmental pollution reduced infrastructure needs and localregional business growth ndash are discussed in the sections below
The Value to Society of Environmental Preservation and Pollution Reduction
Sustainable design strives to lower energy consumption and the resulting air pollution and greenhouse gas emissions as well as to preserve natural resources wildlife habitats (eg forests and wetlands) water bodies scenic vistas and other environmental assets Economic values placed on such environmental goods are currently used for various purposes (mostly legal and policy issues) and natural resource economists have developed various means to estimate the value of natural resources and environmental impacts Although some would say that something like a unique ecosystem is priceless certain groups within American society place economic value on and are willing to pay for environmental and natural resources For instance the Nature Conservancy is planning to invest $1 billion to save 200 of what they call the worlds Last Great Places39
Various approaches have been applied to place a dollar value on reductions in air pollution emissions One way is to examine the price firms pay to buy pollution credits The Clean Air Act established a program by which power plants were required to reduce their emissions of sulfur dioxide (SO2) to a specific emission cap The program allowed companies that could reduce emissions below their caps to sell the extra reductions (credits) to other firms allowing those other
39 httpnatureorgaboutuscampaign
2-32
firms to emit above their caps As time progressed firms with high costs of SO2 control have chosen to buy credits from those with lower costs of control
These emission credits are openly traded in the market Recent prices have ranged from $90 to $272 per ton (National Research Council 2001) In addition New Jersey and five other states in ozone nonattainment zones 40 have developed open market emission trading programs whereby building owners can generate emission credits by investing in energy efficiency measuring the electricity saved and determining (based on a prescribed formula) the amount of air pollution emissions that were avoided by not generating the electricity These credits have been sold for about $1000 per ton for nitrogen oxide (NOx) (New York City Department of Design and Construction 2000) However the current market value of air pollution credits does not necessarily reflect the full cost of pollution damages eg negative health and welfare impacts
A number of research studies using a variety of methods 41 have estimated the societal cost of a pollution The cost ranges are wide because the methods and assumptions are diverse The studies estimate the costs as follows (National Research Council 2001)
bull Emissions of SO2 at $100 to $7500 per metric ton ($91 to $6800 per ton) bull Emissions of NOx at $2300 to $11000 per metric ton ($2090 to $10000 per ton) bull Emissions of carbon dioxide (CO2) at $6 to $11 per metric ton ($550 to $10 per ton)
These values could be used especially within a Federal government context to estimate the societal benefit that reduced energy consumption in sustainable buildings has on reducing emissions
In the prototype building analysis described in previous sections the energy-efficiency measures led to the following emission reduction estimates 016 tons of SO2 008 tons of NOx and 107 tons of CO2
42 Using the maximum values in the ranges above these emission reductions might be valued as high as $1090 (for SO2) $800 (for NOx) and $107 (for CO2) with a total annual cost reduction to society of $2000 This value ($2000) could be used to represent the annual benefit to society that would partially offset the incremental first cost of the energy-efficiency measures (which in this case was $38000) Including these societal cost reductions in the payback calculation lowers the payback period from 87 to 60 years
40 Nonattainment zones area areas with ambient concentrations of air pollutants that exceed the standards set to protect health and welfare 41 Some of these methods include indirect observed behaviors direct hypothetical behavior and indirect hypothetical behavior (for an overview see descriptions by Randall [1987] Freeman [1992]) The indirect observed behavior method tries to relate the value of a nonmarketed good (such as the price people would pay for a clean environment) to a marketed good (such as the price people would pay for recreational fishing) Economists commonly use the travel cost method or the hedonicimplicit price method The travel cost method uses travel expenditure as the price paid to access a site such as a natural park to estimate a demand for that site The hedonicimplicit price method investigates how a nonmarket good influences the value of a market good hypothetically this method could be used to estimate how a pristine environment surrounding a building might influence the rent or market price for that real estate Direct and indirect hypothetical behavior uses hypothetical questions to elicit the value of a nonmarket good from a respondent (contingent valuation method)42 Expressed in tons of carbon in CO2
2-33
Reduction in Municipal Infrastructure Requirements
Taxpayers and localregional governments benefit financially when they are required to invest in fewer new infrastructure projects Some ways infrastructure needs are reduced through sustainable design include the following
bull Siting buildings near public transportation and including other features that encourage public and bicycle transportation rather than use of personal vehicles not only can reduce air pollution but also can reduce regional road and highway infrastructure requirements
bull Redeveloping brownfield sites or locating new buildings in downtown areas rather than suburban or rural greenfield sites reduces the associated development costs for new transmissiondistribution systems sewer systems roads and other infrastructure systems
bull Using recycled materials and construction waste management reduces demand for landfill capacity and therefore landfill construction costs
bull Reducing water use lowers the need for new wastewatersewage treatment plants
Local and Regional Economic Growth
Long-term socioeconomic benefits to a community and region may be realized if enough builders and building owners adopt sustainable design practices For example the sustainable buildings industry could foster a market for recycled materials and energy-efficient systems creating sufficient economies of scale to reduce the price of these types of products to be more competitive with conventional products In addition surrounding communities and the region may experience economic development (including job creation) through emergence of businesses that make sustainable materials produce energy-efficient technologies and provide sustainable design construction and commissioning services A region prone to practicing sustainable design and construction is an attractive place for these companies to locate This potentially produces additional local jobs and income Government sustainable design projects can be a seed for growth of sustainable communities and regions
Sustainable building design also tends to Building on the many laudatory accomplishments of past favor local sources of materials and labor generations I want my generation and my administration further stimulating the economy adjacent to ensure that following generations can flourish and leave to the building site and providing to their children a healthy and stable Oregon We can and economic benefits that are particularly must reduce the pressures on our environment while
important in areas that are economically increasing economic growth and community health
disadvantaged For instance the State of Oregon Governor Ted Kulongoski Rally for the Oregon recently passed legislation and the Environment Remarks March 24 2003 SeeGovernor signed an Executive Order to httpwwworegonsolutionsnetoregonindexcfm
promote sustainability in various government functions One aspect of the initiative involves improving contracting practices to ensure that local contractors and businesses have competitive opportunities in rural and distressed communities 43
Another potential impact of sustainable design is an increase in property values adjacent to the sustainable building site The characteristics cited above that contribute to quality of life will also tend to enhance the desirability of the neighborhood for developing other economic enterprises including residential housing
httpwwworegonsolutionsnetgovtgroupcfm
2-34
43
The Social Benefits of Sustainable Design
The social benefits of sustainable design are related to improvements in the quality of life health and well-being These benefits can be realized at different levels ndash buildings the community and society in general At a building level research on the human benefits of sustainable design has centered on three primary topics health comfort and satisfaction Although these outcomes are clearly interrelated they have different scholarly roots and employ different methodologies Health issues are the domain of epidemiologists and public health professionals Comfort is studied by researchers with expertise in building science and physiology while well-being and psychosocial processes are studied by environmental and experimental psychologists The research described in this section integrates findings from these diverse areas with a focus on studies that assess the health comfort and well being outcomes associated with the presence or absence of sustainable building components
The building environment can have both negative and positive impacts on the occupants quality of life Negative impacts include illness absenteeism fatigue discomfort stress and distractions resulting from poor indoor air quality thermal conditioning lighting and specific aspects of interior space design (eg materials selections furnishings and personnel densities) Reducing these problems through sustainable design often improves health and performance Improved indoor air quality and increased personal control of temperatures and ventilation have strong positive effects In addition to reducing risks and discomforts buildings should also contain features and attributes that create positive psychological and social experiences Although less research has been done on health-promoting environments emerging evidence shows that certain sustainable building features including increased personal control over indoor environmental conditions access to daylight and views and connection to nature are likely to generate positive states of well- being and health
Another emerging social issue affecting buildings is security Since September 11 2001 Federal agencies have experienced heightened concern about how a buildings features affect its ability to thwart or withstand hostile actions The relationships between sustainable design and building security are important topics that will be discussed in this section
At a community or societal level the social benefits of sustainable design include knowledge transfer improved environmental quality neighborhood restoration and reduced health risks from pollutants associated with building energy use Although more research has been conducted on the benefits of sustainable design features to building occupants interest is growing in the community benefits of sustainable design and several potential areas of value to the Federal government are discussed at the end of this section
The first two sections below describe research results indicating positive impacts of sustainable buildings on occupant health (Section 31) and comfort satisfaction and well-being (Section 32) (Appendix F discusses these topics in more detail) Section 33 describes the potential benefits of energy efficiency and other sustainable design features to occupant safety and security Section 34 describes potential positive community impacts
Better Health of Building Occupants
Studies of the health benefits of sustainable design focus primarily on indoor environmental quality especially air quality Health effects result from environmental stimuli interacting with the
3-1
bodyrsquos physical systems especially respiratory skin neural and visual pathways Illness symptoms occur because environmental agents (such as chemicals or airborne microbials) affect the operation of the bodyrsquos physical systems in vulnerable persons
Many studies have found high levels of air-quality problems and occupant illnesses in office buildings (eg Brightman and Moss 2001) Studies have begun to assess the causal relationships between the building environment and illness symptoms in three areas (1) sick building syndrome (SBS) (2) asthma and allergies and (3) communicable and respiratory diseases (Fisk 2001) Research Summary 3-1 shows an example of such a study The findings of this research show that the three types of illnesses are affected by different components of the environment
bull Sick building syndrome SBS symptoms include headache fatigue dizziness irritations of the skin eyes and nose and difficulty breathing A large review study of the links between health perceived air quality absenteeism and ventilation found that ventilation rates lower than 10 Ls per person were associated with statistically significant worsening of symptoms in a range of building types44 Increases in ventilation rate above 10 Ls up to 20 Ls per person were associated with decreased symptoms and improvements in perceived air quality A ventilation increase of 5 Ls per person could reduce the proportion of workers with these respiratory symptoms from 26 to 16 and those with eye irritations from 22 to 14 (Seppanen et al 1999) SBS symptoms are also reduced by personal control over thermal conditions (Preller et al 1990 Hedge et al 1993) improvements in ventilation system maintenance and cleaning reduced use of pesticides and daily vacuuming (Sieber et al 1996)
bull Allergy and asthma symptoms Several building factors ndash moisture problems molds and dust mites ndash are strongly associated with asthma and allergy symptoms (Fisk 2002) Reducing the concentrations of allergens and irritants reduces symptoms Successful strategies for reducing such concentrations include improving HVAC maintenance and cleaning and using building practices that reduce moisture buildup (Sieber et al 1996) Other strategies include air filtration humidity control and elimination of indoor smoking Asthma symptoms were found to more likely occur in the presence of new drywall and in building interiors with cloth partitions (Sieber et al 1996)
bull Transmission of infectious diseases Infectious diseases can be transmitted by airborne microbes (viruses bacteria) Airborne transmissions can be reduced significantly through ultraviolet irradiation of air near the ceiling improved ventilation and reduced crowding (Fisk 2000b Seppanen et al 1999) One study found that workers with one or more officemates were 20 more likely to have two colds during the year than workers who did not share an office (Jakkola and Heinonen 1993) Studies showing reduced risk with lower crowding do not identify what level of density is desirable for health reasons
Health problems can be linked to absenteeism A study of absenteeism among office workers in a large East Coast company found that the absenteeism rate was 35 lower in offices with higher
44 Ventilation and air circulation are important but sometimes overlooked features of sustainable buildings Ventilation refers to the air exchange between the outside and the inside of the building Circulation refers to the air movement within and between the interior spaces of the building Both ventilation and circulation can be achieved through mechanical means (eg fans within air ducts) or by utilizing natural principles (eg warm air naturally rises) In either case a well-designed system should provide sufficient ventilation to dilute contaminants generated within the building space (by either building components or occupants) as well as adequate air circulation within and between building spaces to disperse built-up air contaminants locally while not adversely affecting the occupantsrsquo perception of temperature (eg creating drafts) It is particularly important that measures to increase energy efficiency by ldquotightening uprdquo a building take into consideration the need to maintain adequate ventilation rates Good ventilation and energy efficiency can be achieved simultaneously by using sustainable building measures such as heat recovery devices
3-2
ventilation rates (about 24 Ls per person) compared with moderate rates of 12 Ls ((Milton et al 2000) The use of humidification and complaints about air quality were also associated with increased sick leave The study analyzed sick leave of 3720 hourly workers in 40 buildings The study controlled for gender age seniority hours of nonillness absence shift ethnicity crowding and type of job (See Section 26 for additional information about absenteeism)
2
Researchers conducted a critical review and synthesis of research on the associations between ventilation rates and occupant health to provide a scientific basis for setting health-related ventilation standards The review shows that illness symptoms are often associated with low ventilation rates high CO2
concentrations and perceptions of poor air quality
Research Team The research team included OA Seppanen from Helsinki University of Technology WJ Fisk from Lawrence Berkeley National Laboratory and MJ Mendell from the National Institute for Occupational Safety and Health
Methodology Both cross-sectional and experimental studies were reviewed The following criteria were used for including cross-sectional studies
bull The study included at least three buildings or ventilation zones bull Results were statistically analyzed and included controls for other factors that can influence health
outcomes
The following criteria were used for including experimental studies
bull No changes occurred in the air-handling system and occupants did not move to a different building bull A control group or multiple applications of experimental conditions were used bull The subjects were not aware of the timing of changes in the ventilation rates bull Results were statistically analyzed
These criteria resulted in the selection of 20 studies with 30000 subjects for investigating the association between ventilation rates and human responses and 21 studies with over 30000 subjects for investigating the relationship between CO2 concentrations and human responses
Key Findings Some of the key results of the review are as follows
bull All studies assessing respiratory illness found a significant increase in the risk of illness with lower ventilation rates
bull Of the 27 studies dealing with SBS 20 found a significantly higher prevalence of at least one symptom with lower ventilation rates
bull Findings of illness symptoms were especially consistent with ventilation rates of less than 10 Ls per person
bull Lower ventilation is also associated with increased perceptions of poor air quality bull CO2 studies supported the ventilation findings in half of the studies symptoms improved
significantly when CO2 concentrations were below 800 parts per million (ppm) bull Studies did not find a definitive ventilation rate that prevented symptoms bull Only 5 of the studies were conducted in hot humid climates Results may therefore apply primarily to
moderate and cool climates
Source Seppanen et al (1999)
3-3
Improved Comfort Satisfaction and Well-Being of Building Occupants
Psychological effects (eg comfort satisfaction and well-being) are generated through perceptual and sensory processes that interpret environmental information in terms of its effect on current needs activities and preferences The psychological interpretation of the environment has consequences for work performance and productivity (as discussed in Section 26) stress and wellshybeing Because of the inherent variability in psychological responses the same environmental conditions can affect different people in different ways as well as affect the same person differently over time depending on the context
Occupant comfort and satisfaction with building conditions are a primary focus of post-occupancy evaluations The research generally shows that occupants satisfaction with lighting and air quality is higher than their thermal and acoustic satisfaction (Leaman and Bordass 2001) Efforts to improve comfort and satisfaction are important because discomfort has negative consequences for work effectiveness job satisfaction and quality of work life
A number of studies indicate that certain building features such as daylight views connection to nature and spaces for social interaction appear to have positive psychological and social benefits The benefits include reduced stress improved emotional functioning increased communication and an improved sense of belonging
Occupants satisfaction with several building features has been examined in a number of studies described below
bull Satisfaction with daylighting and electric lighting A study of seven energy-efficient buildings in the Pacific Northwest found that 70 of the occupants were satisfied with lighting overall (Heerwagen et al 1991) Factors that most influenced lighting satisfaction were access to windows and daylight some degree of control over lighting and the occupants location in the building (those on the east and in corner spaces were most satisfied) Workers in windowed areas were 25 to 30 more satisfied with lighting and with the indoor environment overall compared with workers having reduced access to windows The Pacific Northwest study found that occupants valued daylight for its variability both across the day and across seasons (Heerwagen et al 1991) Several reviews have also found that satisfaction with electric lighting improves with reduced glare problems and with increased brightness of vertical surfaces including walls and cubicle partitions (Collins et al 1990 Collins 1993)
bull Thermal satisfaction Thermal satisfaction is consistently lower than lighting satisfaction in most building studies partly because of the high variability in thermal comfort Occupant responses to the thermal environment are influenced by activity clothing levels stress age gender and individual preferences The most effective way to improve thermal comfort and satisfaction is by using individual controls for temperature and ventilation (Wyon 1996) The responsiveness of building management to complaints also improves comfort and satisfaction (Leaman and Bordass 2001)
bull Perceptions of air quality Negative perceptions of air quality are common and are associated with low ventilation rates (Seppanen et al 1999) In six cited studies 50 of occupants said the air quality in their buildings was unacceptable even though the building itself was not considered a complaint building (Seppanen et al 1999) Increased ventilation improves perceptions of air quality if the intake air itself is located at least 25 feet from an irritant source (eg an exhaust vent traffic or a trash dumpster) (Sieber et al 1996) Air quality is also
3-4
associated with food and its odor problems especially when the food is eaten by workers at their desks (Heerwagen et al 1991)
bull Overall satisfaction A recent large-scale study (Leeman and Bordass 2001) of 16 buildings in England identified several features that were consistently associated with higher levels of overall satisfaction ࠃ Shallower plan forms and depths of space (buildings and rooms that are long and narrow) ࠃ Thermal mass ࠃ Stable and comfortable temperature conditions ࠃ Operable windows ࠃ Views out ࠃ Usable controls and interfaces ࠃ Places to go at break time ࠃ A well-informed and responsive building management
bull Psychosocial well-being Although sunlight can create glare and heat gain in buildings if it is not controlled properly evidence suggests that a modest level of sunlight indoors (sun spots) significantly enhances psychological functioning and job satisfaction compared with spaces lacking daylight and sun (Leather et al 1998) Although people prefer being in windowed rather than windowless spaces the view itself has consequences for well-being Studies have found that views of nature are especially beneficial and reduce stress provide mental relief improve perceived quality of life and improve emotional functioning (Ulrich 1984 Clearwater and Coss 1990) A case study (Heerwagen 2000) of the Herman Miller building in Holland Michigan shows improvements in social functioning and sense of belonging associated with including break areas a centrally located cafeteria an interior daylit and tree-lined street and high levels of internal glazing that offered views into the street and interior spaces (see Research Summary 3-2)
Occupant Safety and Security
In the wake of the September 2001 attacks every Federal agency faces a heightened concern for providing safe and secure workplaces and public spaces in Federal office buildings military facilities and other public facilities At first it might seem that features aimed at improving security will inevitably require some sacrifice of energy efficiency or other sustainable design characshy teristics For example sustainability principles might be considered inconsistent with using additional steel and concrete to increase blast resistance eliminating natural ventilation reducing window areas (daylight passive solar heating) to minimize danger from flying glass and increasing energy use from ventilation fans associated with high-performance air filters
In the process of renovating the Pentagon weve found that several of the force protection measures we are taking to protect the Pentagon against terrorist attacks are complementary to our sustainable construction efforts These are all examples of building security and energy efficiency working hand in hand
Teresa Pohlman Special Assistant for Sustainable Construction US Department of Defense
While such tradeoffs may be required in specific cases a careful examination of the options for integrated design at both the individual building level and at the site (or campus) as a whole has led many designers to conclude that improved building security and improved energy efficiencysustainability not only can coexist but can even be complementary
3-5
This study examined occupant satisfaction as well as productivity (based on Herman Millerrsquos own TQM metrics) Results indicate that the new sustainable building had positive impacts on occupants well-being job satisfaction feelings of belonging and other aspects of work life that affect individual job performance The study also found that a small increase in organizational productivity occurred after the move to the new building
Research Team PNNL J Heerwagen lead
Research Setting The Green House designed by William McDonough and Partners of Charshylottesville Virginia is a 290000-ft2 building that combines a manufacturing plant and office facilitiesshowroom for Herman Miller Inc a furniture manufacturing company This facility is located in Holland Michigan The building has the following sustainable features
bull Extensive daylighting including an interior daylit street windows skylights and roof monitors in the manufacturing plant
bull Operable windows in both the manufacturing plant and office bull Views to the surrounding countryside from all locations bull Energy-efficient glazing and lighting bull Lighting controls that dim electric lighting when daylight is sufficient bull Occupancy sensors bull Increased filtration of particulates and increased air changeshour in the manufacturing plant bull Nontoxic adhesives and a separately ventilated painting area in the manufacturing plant bull Restored prairie landscape and wetland on the site bull Extensive recycling of waste from the cafeteria office and manufacturing plant bull Siting to reduce the visual impact of the building from the road bull In-house fitness center
Methodology A research team from PNNL conducted a pre- and post-occupancy study that included occupant surveys and analysis of organizational TQM data The data included overall productivity on-time delivery product quality and efficient use of materials DOEs Office of Building Technology State and Community Programs funded the study
Key Findings After moving into the new facility the occupants experienced the following
bull Increased sense of well-being belonging and work spirit bull Increased job satisfaction bull Increased feeling of looking forward to work and being in good spirits at work bull Higher satisfaction overall with the building especially the daylight windows electric lighting air
quality and connection to nature
The responses of the manufacturing workers varied across the shifts with the daytime workers responding most positively The night workers showed little difference between the buildings possibly because the environment changed the least for them (daylight views and connection to the outdoors are greatly diminished at night)
3-6
Analysis of the pre- and post-occupancy results related to Herman Millerrsquos TQM led to the following conclusions
bull A small increase of 022 occurred in overall productivity and small increases of 1 to 2 occurred in other TQM metrics These increases were small but are still significant because the organizashytion was already performing at 98 to 99 on all of the TQM metrics
bull No dip in productivity occurred following the move to the new facility Most moves or major changes are followed by a period of slowdown but this did not occur
bull No differences occurred in any of the TQM metrics across the manufacturing shifts despite the differences in perceptions and subjective outcomes This result suggests that the link between performance and subjective experiences is more complicated than is currently believed
Source Heerwagen (2000)
Examples of the synergy between building security and sustainability features can be seen from the Pentagon renovation project45 A spray-on wall coating selected to improve blast-resistance also helps improve the air tightness of the building envelope The tighter envelope not only saves heating and cooling energy but also provides added protection against outside releases of airborne chemical or biological agents The US Department of Defense reports that new blast-resistant windows chosen to replace the original ones at the Pentagon are also 50 more energy efficient Another feature is the choice of photo-luminescent signage to mark evacuation routes these require no standby power and are also easier to see through smoke caused by a fire or explosion than conventional exit signs A final example from the Pentagon project is the use of zoned climate control systems that not only reduce heating and cooling energy use and improve indoor air quality but also make it easier to control smoke and manage the spread of chemical or biological toxins in response to an emergency
The US Department of State is actively researching innovative structural and glazing systems that provide both daylightview and ndash because they are designed to yield to an external blast ndash better protection for building occupants Planners responsible for overseas Embassy compounds also maintain that the greater setbacks required for new buildings also provide important opportunities for sustainable landscaping solar access and other highly desirable features as a valuable by-product of security requirements
The National Aeronautics and Space Administration incorporated both building security guidelines and sustainable design in their criteria for new facilities They have found that certain standard design criteria such as structural requirements for wind and seismic loads can also help improve blast-resistance
Ideally projects targeted at improving building security should also consider opportunities to piggyback energy-efficiency and renewable energy measures because the energy cost savings could make security improvements more affordable A few other examples of positive interactions between security and efficiency measures in buildings include the following (Harris et al 2002)
45 Personal communication with T Pohlman US Department of Defense Washington DC
3-7
bull Improving control of air distribution systems ndash including periodic calibration of sensors adjustment of dampers and other system maintenance ndash is essential for rapid response to an emergency and also contributes to energy-efficient operation under normal conditions
bull Tighter building envelopes have the dual benefits of reducing energy losses from air infiltration and making it easier to pressurize a building and therefore reducing entry of airborne hazards released outside the building
bull Daylit spaces may be easier to evacuate quickly in the event of an attack or threat accompanied by a power outage
bull Onsite power systems can be very attractive considering their improved reliability during utility system outages (either natural or human-caused) in addition to any cost savings that might be associated with reduced electricity or peak power demand
bull Upgrading existing windows for blast resistance may create opportunities to improve thermal and optical (daylighting) performance if the window system or add-on film is selected carefully For example in planning for a recent retrofit project DOE evaluated several blast-resistant films with varying thermal and optical properties and then pilot-tested the samples on windows in several offices
bull Redesigning security lighting along with automated sensing and surveillance systems may actually reduce the need for constant high nighttime lighting levels while improving detection capabilities
bull Improving particle air filtration has several potential benefits In addition to protecting buildings from biological agent attack the benefits include reducing indoor particle concentrations from other sources thereby improving occupant health (and productivity) and helping reduce HVAC coil fouling which in turn improves heat exchange efficiency Some high-performance filters have significantly lower pressure drop than others that do the same job so a careful choice of filter systems and products can produce cleaner and safer air with less energy penalty
bull Site planning that provides a wide buffer zone to keep vehicles away from the exterior of a public building can also provide opportunities for better solar access and for climate-appropriate landscaping Trees can directly shade the building and both channel prevailing summer breezes toward the building and temper the effect of cold winter winds on space heating loads In addition trees and other vegetation cool the building site due to evaporation that occurs during the plantsrsquo normal biological processes (evaporation causes cooling)
More examples can be found in Research Summary 3-3 at the end of Section 3
Community and Societal Benefits
The effects of sustainable building practices on occupants are the primary social benefits that have been researched however various secondary and indirect quality-of-life benefits for which anecdotal evidence exists can accrue to other societal groups
From a public health perspective quality of life can be measured in terms of individual life expectancy and state of wellness More generally quality of life at a community level can include such issues as environmental quality aesthetics educational and recreational opportunities accessibility and quality of public services and even psychological characteristics such as community satisfaction and pride
3-8
Sustainable building practices can contribute to quality of life in a number of ways
bull Occupants who experience increased job satisfaction health and productivity will carry these experiences back to their families and friends in the community thus influencing overall wellshybeing
bull Occupants may also enjoy more pleasant and productive commutes to work and less traffic congestion in their communities if public or alternative transportation methods are made available at their workplace
bull Benefits can potentially diffuse beyond the workplace and lead to increased use of sustainable design practices and behavioral change in the community at large Behavioral changes might include increased recycling purchasing green products and investing in energy-efficient technologies
bull Buildings that include sustainable features also become models for others to follow For example the Herman Miller Green House regularly provides tours and outreach programs for local and national design and construction professionals as well as for businesses that are planning their own sustainable buildings
bull Environmentally conscious construction practices will tend to generate lower amounts of dust pollution noise traffic congestion and other community disturbances These improvements will likely contribute to improved public health safety and well-being (The environmental benefits of sustainable buildings are discussed in greater detail in Section 4)
bull Construction practices and building operation practices that foster recycling and reduce waste generation energy use and water consumption will eventually reduce the demand for new landfills electric utility plants transmission and gas pipelines and wastewater treatment facilities (see Section 27) and will decrease the public nuisance associated with them
bull Use of locally produced and manufactured products in sustainable buildings bolsters the local economy and provides jobs in the community (as well as reducing energy use and emissions caused by long-range transportation of goods)
bull If sustainable design involves cleanup and use of a brownfield site the community may benefit from the improved environmental conditions associated with the cleanup It may also experience economic development associated with productive use of a previously unused site and the presence of a new set of workers who make financial transactions in the community (The socioeconomic effects of sustainable buildings on community development improved health due to lower pollution loads and reduced infrastructure needs were discussed in Section 27)
3-9
The following table is the result of a recent effort by Lawrence Berkeley National Laboratory to assess the security implications of energy-efficiency measures (Harris et al 2002)
Efficiency Opportunities Security
Issue
Project Planning and Management
Integrated design process
Design objectives Clearly define goals and minimum requirements for sustainabilityefficiency and security as part of an organizations architectural programming
Con Air Ex RR
Architectural and engineering solicitation and contracting
Specify required expertise in sustainability and security when issuing the solicitation and use explicit criteria for selecting an architectural and engineering firm include integrated design tasks in the contract
Design charrette Allocate time and resources for integrated design charrette(s) at an early stage of design including a broad range of participants
Architectural Considerations
Building envelope
Airtight barrier Appropriately seal buildings to both resist chemical biological penetration and provide weather-tightness
Air
Insulation Insulate walls to provide a secondary barrier and thermal savings
Air Ex
Impact-absorbing walls
Use innovative walls systems (multiple layers openings crumple zones) designed to absorb blast effects that can also reduce envelope heat transfer and control solar gain
Ex
Thermal mass Design earth berms for blast deflection which can also provide thermal buffering
Ex
Specify high-mass (concrete) construction which allows active or passive use of thermal mass to reduce heatingcooling loads
Ex
Shading devices Design shading devices that can double as blast protection
Ex
Vestibules Use vestibules to help control building access while reducing infiltration of unconditioned outside air
Con Air
Windows Laminate films Apply blast-damage-resistant laminate films to interior surface of windows with appropriate emissivity and visible light transmittance
Air
Operable windows Analyze appropriate response to threat (httpsecurebuildingslblgov)
Air RR
Protective screens Use external protective screens that may also control unwanted solar gain
Ex
Storm windows Consider retrofitting storm windows with efficient (low-e solar control) films
Air Ex
3-10
Security Efficiency Opportunities Issue
HVAC Considerations
Air systems System design Consider separating ventilation air systems from Air RR thermal distribution Radiant coolingheating with hydronic distribution offers added efficiency smaller ventilation-only fresh-air supply and dedicated exhaust systems are easier to control in an emergency
Provide larger ducts and efficient fans for rapid venting Air RR and energy savings in normal operation
Use efficient ventilation systems (displacement Air RR ventilation large ducts etc) to reduce space and energy requirements for upgraded filters
Variable-speed Provide capability for normal operation and rapid Air RR drives venting (variable-speed drives also allow for dynamic
braking to stop fans faster in an emergency)
Dedicated Provide separate additional exhaust for emergency Air RR exhaust venting or for economizer operation especially in
high-risk areas such as entry vestibules loading docks and mail rooms
Whole-building Consider dual use of building purging systems (for Air RR ventilation smoke and also chemical contaminants) to provide
nighttime ldquofree coolingrdquo during normal building operation
Duct leakage Specify install and commission (test) ductwork for low Air RR leakage
Dampers Provide dampers with rapid closure and low leakage Air RR
Filtration Use low-pressure drop filters at the filtration level Air RR needed
Tightly seal around in-line filters Air RR
Security barriers Review impact of security barriers such as additional Con Air doors on normal air distribution
Water Physical layout Provide secure enclosures and minimize run lengths of Air Ex systems piping
Increase pipe size Ex
Control System Considerations
Window Operable window Provide automatic and operator control for Air RR controls controls chemicalbiological isolation and thermal comfort
Shading control Provide automatic and operator control for blast Ex RR protection and shading
Integrated Interoperable Use interoperable systems to integrate security controls Con Air Ex controls systems with other building controls (HVAC lighting access RR
surveillance firesmoke)
Plan for future additions as new sensing capability is Con Air Ex developed RR
3-11
Security Efficiency Opportunities Issue
Control System Considerations (contd)
HVAC Individual control Provide for pressurized safety zones when needed Air RR controls of fans dampers
Alternate filtration Provide parallel path through filter banks during Air RR path chemicalbiological attack
Wireless Remote Provide secure and redundant controls using wireless Con Air Ex systems monitoring and and web-based systems RR
control
Monitoring System status Provide whole-building system monitoring to improve Con Air Ex monitoring maintenance normal operation and critical RR
monitoring during events
Elevator Integrate elevator Integrate elevator controls for emergency response to Con Air Ex controls controls with fire or chemicalbiological events and for efficient RR
building control operation Make elevators controllable to allow systems implementation of peak-load strategies
Lighting Considerations
Interior Security lighting Provide efficient lighting and lighting controls such as Con exterior motion sensors lighting Integrate lighting into overall building controls Con RR
Interior Daylight access Minimize interior spaces without daylight access to RR improve visibility in daytime emergency evacuations
Distributed Generation
Backup Combined heat To reduce power and fuel costs during non-emergency RR generation and power periods upgrade emergency backup generation from
renewable fuels diesel to renewable onsite power (photovoltaics wind biofuels) or a gas turbine combined with heat recovery for space heat or hot water
Site Planning
Building site Site design and Add protective open space around structures to allow Con Ex landscaping to buildings to be oriented for passive solar features reduce heating and cooling loads
Use larger setbacks to allow trees and plantings to directly shade buildings and buffer or channel prevailing winds to provide evapotranspiration cooling and to reduce urban heat-island effects
Physical barriers Add berms and water features to provide blast protection and access control as well as stormwatererosion management
Campus Sustainable site Plan for larger multi-use sites to enhance security Con Ex layout planning and create opportunities for efficient water userecovery
management recharge and ground-source heat pumps and allow better load matching for onsite combined heat and power etc
3-12
Efficiency Opportunities Security Issue
Other
Cyber ndash security
Computer standby power
Physically shut off power to computers at night and during unoccupied periods to save energy while reducing risk of unauthorized access to data and systems
Con
Con = control of access air = airborne (chembio) threat Ex = explosive threat RR = response and recovery For more details examples and useful links see wwwwbdgorgdesign
3-13
The Environmental Benefits of Sustainable Design
Buildings consume a significant amount of our natural resources and have a wide range of environmental impacts These environmental concerns are a key driver behind the sustainable design movement Various estimates indicate that buildings use 30 of the raw materials consumed in the United States (EPA 2001) Considering what buildings are made of ndash steel concrete glass and other energy-intensive materials ndash buildings have a high level of embodied energy Based on lifecycle assessments the structural and envelope material of a typical North American office building has 2 to 4 gigajoules per square meter (175 to 350 kBtuft2) of embodied energy (Building Typically embodied energy [in a
building] is equivalent to five to ten Green Inc 2003) Producing these materials depletes years of operational energynonrenewable resources and has environmental effects and
these impacts intensify the more frequently buildings are William Bordass quoted in
demolished and replaced Building Green Inc (2003)
Building operations also contribute significantly to environmental pollutant levels in the United States and abroad As a whole US buildings use 36 of US energy demand 68 of the countryrsquos electricity (more than half of which is generated from coal) and nearly 40 of US natural gas consumption (DOE 2002) As a result US buildings are accountable for 48 of the nationrsquos SO2 emissions 20 of the NOx and 36 of the CO2 (DOE 2002) Buildings also produce 25 of the solid waste use 24 of the water create 20 of the water effluents and occupy 15 of the land (EPA 2001) In addition US builders produce between 30 and 35 million tons of construction renovation and demolition waste (DOE 2002)
Federal facilities contribute a notable portion of these building impacts for example Federal buildings are estimated to emit 105 million metric tons of CO2 (in carbon equivalents) (DOE 2001) which is about 2 of the total emissions from US buildings and is equivalent to the total emissions of Peru46
From a complete lifecycle assessment perspective construction operation and demolition or reuse of buildings involve a chain of economic activities that provide the goods and services necessary to build maintain and eventually retire or convert the asset Each of these activities carries an implicit ecological footprint of resource consumption and waste generation For example the footprint associated with a ton of steel includes impacts of mining transportation and manufacshy turing operations including a considerable amount of energy consumed in converting iron ore to steel and transporting the steel to its point of use Table 4-1 lists the sources of pollution and other negative environmental impacts related to constructing operating and demolishing buildings
Applying sustainable design principles can significantly reduce these impacts The following sections describe three categories of environmental benefits attributable to sustainable buildings lower air pollutant and greenhouse gas emissions to the atmosphere (Section 41) reduced volumes of waste (Section 42) and decreased use of natural resources and lower impacts on ecosystems (Section 43) Each section is illustrated with a case study
httpcdiacesdornlgovtrendsemisperhtm
4-1
46
Table 4-1 Examples of Environmental Impacts of Buildings
Construction Operation Demolition
Materials Use bull Depletion of nonrenewshy
able resources bull Pollution and byproducts
from materials manufacture
bull Construction materials packaging waste
Site Preparation and Use bull Disturbance of animal
habitats bull Destruction of natural
vistas bull Construction-related
runoff bull Soil erosion bull Destruction of trees that
absorb CO2
bull Introduction of invasive exotic plants
bull Urban sprawl (for greenfield sites) and associated vehicle-related environmental impacts (eg tailpipe emissions as well as impacts of highway road and parking lot construction)
bull Water quality degradashytion from using pestishycides fertilizers and other chemicals
Energy Use bull Air pollution emissions of SO2 NOx
mercury and other heavy metals and particulate matter from power plants the buildings energy consumption and transportation to the building
bull Greenhouse gas (CO2 and methane) emissions which contribute to global warming
bull Water pollution from coal mining and other fossil fuel extraction activities and thermal pollution from power plants
bull Nuclear waste fly ash and flue gas desulfurization sludge from power plants that produce the electricity used in buildings
bull Habitat destruction from fuel extraction
Building Operations bull Runoff and other discharges to water
bodies and groundwater bull Groundwater depletion bull Changes in microclimate around
buildings and urban heat island effects
bull Ozone-depleting substances from air conditioning and refrigeration
bull Light pollution in the night sky bull Water consumption bull Production of wastewater that
requires treatment bull Production of solid waste (garbage)
for disposal bull Degradation of indoor air quality
and water quality from using cleaning chemicals
bull
bull
bull bull
bull
Demolition waste (used steel concrete wood glass metals etc) Energy consumption for demolition Dust emissions Disturbance of neighboring properties Fuel use and air pollutant emissions associated with transporting demolition waste
Lower Air Pollutant and Greenhouse Gas Emissions
One set of environmental benefits from greening buildings that can be fairly easily estimated is lower air pollutant and CO2 emissions Emissions are reduced by decreasing energy use through energy-efficient design use of renewable energy and building commissioning Table 4-2 shows the average amounts of emissions that are released per Btu of natural gas and electricity used (these are called emission coefficients) The coefficients also indicate the amount of pollution that would be reduced per unit of energy saved
4-2
Table 4-2 Emission Coefficients for Energy Consumption in Commercial Buildings
SO2 Million Short Tons Per Quad
NOx Million Short Tons Per Quad
CO2 Million Short Tons Per Quad
Natural gas Negligible 008 158
Electricity (per delivered quad) 097 045 5562
Source DOE (2002) (1 short ton equals about 091 metric ton)
In the hypothetical prototype building annual emissions would be reduced by 016 short tons of SO2 008 tons of NOx and 107 short tons of CO2
47 (based on site electricity reduction of 167 million Btu and a natural gas savings of 86 million Btu) This
reduction is small compared with national emission levels48 or even emission levels in a city such as Baltimore However given that buildings contribute 48 of SO2 20 of NOx and 36 of CO2
nationwide (DOE 2002) a widespread adoption of sustainable design techniques in new and retrofit buildings would eventually affect national and regional pollution levels
Reducing SO2 and NOx is particularly important in areas (such as Baltimore) that are not achieving air quality standards Large urban areas with intense traffic and areas affected by emissions from large industrial sources and power plants can have ambient air pollution levels that exceed the amounts determined by the EPA to protect human health and welfare (National Primary and Secondary Ambient Air Quality Standards 40 CFR 50) Although buildings are not typically a target of specific emission regulations some states such as New York encourage emission reductions from nonregulated sources through a program of emission reduction credits Through this program a regulated source can pay a nonregulated source for emission credits earned by reducing emissions through energy-efficiency measures fuel switching or other means 49 When aggregated the lower emissions from small sources of NOx (such as gas-fired heating systems in buildings) in cities can help reduce ozone-related pollution (smog) In addition cutting electricity consumption helps decrease emissions of NOx and SO2 from power plants (usually located in rural areas) thereby helping to reduce regional environmental problems such as acid rain
Reducing fuel and electricity consumption also lowers CO2 emissions a greenhouse gas that is linked to climate change Decreased use of natural gas should also reduce methane emissions to the atmosphere (methane is another greenhouse gas) The effects of the buildup of greenhouse gases in the atmosphere may include sea level rise weather changes (eg increase in violent weather patterns) and impacts on agriculture Although climate change is likely to occur gradually over a long time period energy-efficiency measures implemented now will slow the pace of the greenhouse gas buildup and its potential effects
Case Study 4-1 describes how a photovoltaic energy system has lowered air pollution emissions in an area with serious air quality problems ndash the Los Angeles Basin
47 Expressed in tons of carbon in CO2 48 National emissions of SO2 NOx and CO2 from buildings were about 9 million tons 5 million tons and 564 million tons (carbon equivalents) respectively49 See httpwwwdecstatenyuswebsitedarbossercindexhtml
4-3
This case study demonstrates how innovative energy systems can reduce emissions The area in which this facility is located ndash the Los Angeles Basin ndash is plagued with high ozone levels (smog) The project demonstrates one of the innovative technologies that produce electricity without any emissions Incentive programs available in some locations from various sources can reduce the first costs of advanced technologies resulting in very reasonable economics
Project Description The US Postal Service (USPS) recently installed a large-scale photovoltaic (PV) sysshy tem at its Marina Del Rey Processing and Distribution Center in Los Angeles The center has over 400000 ft2
of floor area and high energy consumption and costs
Approach to Sustainable Design This facility is proactively seeking solutions to energy management especially given Californias volatile energy situation over the past two years The USPS worked with Lawshy rence Berkeley Laboratory (in a technical advisory role) the Los Angeles Department of Water and Power (DWP) and DOErsquos FEMP to examine costs energy savings and key financial incentives from using PV systems at this site The team determined that a rooftop solar power array would generate significant electricity to help offset peak demand utility costs
The system was attractive not only because it saves energy but because it is also expected over its lifetime to reduce emissions 2600 lb of NOx emissions and 4075 tons of CO2 equivalent to removing emissions from over 1000 cars or planting over 200000 trees The USPS is also considering PV for other postal facilities
Sustainable Features The PV technology installed at the facility consists of a 127-kW system from 845 modules that are lightweight and integrated in the buildings roof over an existing roof membrane The solar array is 50 ft by 300 ft and covers most of the facilitys flat roof The system produces clean power silently and is not visible to people on the ground
The PV system uses silicon technology to convert sunlight directly into electricity The output from the PV modules is direct current which is converted to the required alternating current using an inverter and transformer The system allows the current to be directly connected to the buildingrsquos electric service panel In addition to producing electricity the PV panels provide R-20 value thermal insulation to decrease the buildingrsquos energy consumption and reduce heating and air conditioning costs The panels also extend the roofrsquos life by protecting the roof membrane from ultraviolet rays and thermal conditions
The system is linked to a new energy management system that monitors power output from the solar cells When the system detects a decline in power output for example during cloud cover it automatically modifies the operation of the buildingrsquos chiller to compensate without affecting employee comfort
Financial Considerations The systems original first cost was about $1 million The Los Angeles DWP provided a $684000 rebate and FEMP provided a Distributed Energy Resources Grant of $125000 The net system cost to the USPS was about $226000 The estimated annual cost savings are $25000 to $28000 resulting in a simple payback period of about 8 years
Sources Personal communication with J Lin PowerLight Corporation Berkeley CA FEMP (2002)
4-4
Reduced Volumes of Solid Waste
The United States produces more than 230 million tons of municipal solid waste per year consisting of paper yard waste plastics metals etc 50 The 30 to 35 million tons of construction renovation and demolition waste that US builders produce include wood (27 of total) and other materials such as cardboard and paper drywallplaster insulation siding roofing metal concrete asphalt masonry bricks and dirt rubble waterproofing materials and landscaping materials (DOE 2002) As much as 95 of building-related construction waste is recyclable and most materials are clean and unmixed (DOE 2002)51
In addition building occupants produce municipal solid waste every day in the form of used paper plastic and glass containers food waste etc Much of this can be recycled
Several sustainable design principles reduce waste which in turn reduces the strain on landfills In addition using recycled materials in building construction encourages development of new industries that produce recycled products further reducing waste disposal needs and the use of virgin materials
The main sustainable design principles that reduce waste include the following
bull Storage and collection of recyclables The building design should provide space for collecting and storing materials such as paper glass plastic and metals that will be recycled
bull Construction waste management During construction the contractor can recycle or productively use construction demolition and land-clearing wastes and divert these wastes from landfill disposal
bull Recycled content Designers can select environmentally preferable materials that include recycled materials (Designers should use standards developed by government agencies or other reliable sources)
bull Waste prevention Designers can eliminate unnecessary finishes and make choices that use standard-sized or modular materials In addition designers should consider product durability in the design process When products need to be replaced less frequently less demolition waste is produced and fewer virgin resources are needed for replacements
Case Study 4-2 describes how both the volume of waste and construction costs were reduced through an effective construction waste management program
50 httpwwwepagovepaoswernon-hwmuncplfactshtm 51 Original sources cited in DOE (2002) include First International Sustainable Construction Conference Proceedings Construction Waste Management and Recycling Strategies in the US Nov 1994 p 689 Fine Homebuilding Construction Waste FebMar 1995 pp 70-75 National Association of Home Builders Housing Economics Mar 1995 pp 12-13 and Cost Engineering Cost-Effective Waste Minimization for Construction Managers Jan 1995 Vol 37No 1 pp 31-39
4-5
This case study demonstrates that using construction waste management other recycling efforts during construction and central recycling during building operation not only reduces the strain on local landfills but lowers construction costs
Project Description The New England Regional Laboratory (NERL) located in North Chelmsford Massachusetts is one of ten EPA regional laboratories that conducts environmental monitoring analytical support and data assessment The 71000-ft2 building incorporates an environmental testing laboratory as well as office and meeting spaces This facility won a Closing the Circle Award and a US Green Building Council LEED Gold Rating
Approach to Sustainable Design The new laboratory which opened in September 2001 was designed and built using sustainshyable principles The lab was supported by government agency sustainability advocates GSA and EPA as well as a sustainabilityshyconscious developer and contractor The goal was to use the best commercially available materials and technologies to minimize consumption of energy and resources and maximize use of natural recycled and nontoxic materials
The design construction team diverted more than 50 of its construction and demolition debris from the waste stream by recycling processing excavated rock outcroppings into crushed stone that was also used on site and reusing furniture and laboratory equipment from the former facility to furnish the new building while redistributing unused supplies to other buildings and organizations The facility used fly-ash content concrete and many other recycled-content materials (insulation carpet floor tiles mulch compost made from yard trimmings or food waste and recycled plastic benches and picnic tables)
Sustainable Features The team maximized the use of natural site features such as solar energy natural shading and drainage The teams principal goals were achieving energy efficiency and maximizing renewable energy sources so they incorporated a wide range of technologies and strategies including lighting controls skylights light tubes extra insulation high-efficiency chillers and motors green power and PV awnings that supply 2 kW of electricity to the electric grid Water-efficiency measures included Xeriscape concepts for landscaping an onsite well for laboratory uses and low-flow sinks with electronic sensors
Commercial power is provided by Green Mountain Power of Vermont via 100 renewable energy sources Green Mountain Power has committed to generating or purchasing wind-powered electricity that matches the electrical consumption of NERL an estimated 2 million kWh per year Using green power will reduce pollution by an estimated 346 million lbyr of CO2 17600 lbyr of SO2 and 6200 lbyr NOx over conventional power sources
Financial Considerations The project team documented the cost savings from the construction waste management program A concerted effort was made to minimize construction debris and to maximize recycling and reuse of anything that would become a waste stream The team hired Graham Waste Services a licensed hauler and processor of recyclables and solid waste
4-6
Any waste that was generated during construcshytion was carefully segregated into separate clearly labeled bins that Graham Waste Services supplied Bins were checked regularly for extrashyneous materials that could contaminate any of the loads The estimated amounts of materials recycled during construction the percent of the total waste stream recycled (by volume) and the associated cost savings (resulting from avoided disposal costs) were as follows bull Clean wood 330 cubic yards 21 of the
recycled waste stream volume for a $2200 savings
bull Cardboard 10 cubic yards 6 of the recycled waste stream volume for a $250 savings bull Gypsum wallboard 210 cubic yards 13 of the recycled waste stream volume for a $1400 savings bull Metal 90 cubic yards 6 of the recycled waste stream volume for a $600 savings bull Concrete 80 cubic yards 5 of the recycled waste stream volume for a $5760 savings bull Total savings $10210
Note general refuse were recycled but this did not lead to any cost savings In addition 780 cubic yards of
Sources Personal communication with B Beane EPA Region 1 in North Chelmsford Massachusetts and the documentation supporting the White House Closing the Circle Awards 2002 Nominations for Recycling Affirmative Procurement and Model Facility Awards
Decreased Use of Natural Resources and Lower Ecosystem Impacts
Many sustainable design principles help reduce impacts on natural resources and ecosystems Some key examples are as follows
bull Sustainable siting approaches consider alternatives to greenfield construction including using existing facilities (eg urban redevelopment) and brownfield sites and avoid building on prime agricultural land floodplains and habitats for threatened species or near wetlands parklands and cultural or scenic areas The principles also include designing to reduce potentially detrimental conditions such as slopes that can erode avoiding adverse impacts on adjacent properties and carefully considering the building placement amid existing trees on the site Sustainable siting may also consider reducing the buildings (or the sites) footprint to preserve the amount of open space These measures ࠃ Protect threatened species wetlands cultural areas and pristine natural areas ࠃ Remediate contaminated land (when a brownfield is used) ࠃ Preserve soil resources trees and open space in already developed areas
bull Siting near public transportation involves locating the facility near rail stations or bus lines and providing covered wind-sheltered seating or waiting areas for public transport Use of public and alternative transportation also can be fostered by installing bicycle storage and showers alternative-fuel refueling stations and preferred parking for carpools In addition to reducing
4-7
air pollution from personal vehicles these measures ࠃ Reduce land disturbance for new roads ࠃ Use less material for new roads
bull Erosion and sedimentation control stormwater management and sustainable landscaping involve developing a sediment and erosion control plan to prevent soil loss during construction using natural water management approaches instead of traditional sewers and designing a self-sustaining landscape This approach can involve planting watershed buffers using drought-resistant plants native to the region avoiding plants needing chemical treatment and fertilizers or causing allergic reactions designing natural drainage systems and using techniques that allow water infiltration through surfaces (eg using porous paving surfaces for parking lots) which allows stormwater to filter through plantings and soil These measures ࠃ Prevent sedimentation of streams ࠃ Reduce dust and particulate matter emissions during construction ࠃ Reduce disruption of natural water flows ࠃ Reduce runoff into natural water systems ࠃ Restore natural plant species to the region
bull Light pollution reduction is achieved by reducing dependence on high-wattage electrical lighting at night by using solar lighting and light-colored or reflective edges along driveways and walks and by designing night lighting to prevent direct-beam illumination from leaving the building site These measures preserve nighttime habitats for nocturnal species
bull Water reduction measures include using low-flow faucets and showerheads and improved fixtures and fittings that reduce water use (eg pressure-assisted or composting toilets and no-water urinals) low-water landscaping improved cooling towers that use closed-loop cooling approaches captured rain water for landscaping toilet flushing and other appropriate uses and treatment and use of graywater excess groundwater and steam condensate The water-efficiency and sustainable siting approaches for the prototype building described in Section 21 and 22 which included use of low-flow faucets no-water urinals dual-flush toilets and sustainable landscaping would save over 233000 gallons of water annually (equal to 70 of the base case buildingrsquos consumption including water used both inside the building and outside for landscape maintenance) Water reduction measures in buildings ࠃ Decrease extraction of potable water from groundwater reserves (eg aquifers) water
bodies and reservoirs ࠃ Reduce strain on aquatic ecosystems in water-scarce areas ࠃ Preserve water resources for wildlife and agriculture ࠃ Decrease impacts from wastewater treatment plants (eg effluent discharges)
bull Energy efficiency measures not only reduce air pollution emissions associated with energy use (discussed in Section 41) but also decrease the need for nuclear and fossil fuels These measures ࠃ Reduce the need for on-land disposal of nuclear waste fly ash and flue gas desulfurization
sludge from power plants ࠃ Reduce habitat destruction and other environmental impacts from fuel extraction
processing and transportation (eg coal mines typically disturb large tracts of land)
bull Rapidly renewable materials (eg bamboo cork and wheat straw boards) and certified wood ࠃ Reduce the use and depletion of long-cycle renewable materials ࠃ Improve forest management and biodiversity
4-8
bull Design for reuse means designing a flexible building that can have many uses and that can be reconfigured in the future as needs change As time progresses this practice should reduce the need to demolish old buildings and construct new ones These measures lower resource consumption (eg building materials such as steel concrete and glass which are energy-intensive commodities)
Case Study 4-3 describes the efforts undertaken to develop a new multibuilding campus in a way that minimized disruption of the natural environment
4-9
This case study shows how a state-of-the-art lab and office complex can be a model for environmental stewardship without increasing costs By forming a multidisciplinary design team and integrating environshymental principles into the value engineering process EPA created a 100-year building with estimated 40 energy savings 80 construction waste recovery 100 stormwater treatment through native plants and wetlands on site daylight in offices clean indoor air flexible labs and more ndash all with no extra budget for building green The case also shows that conserving energy and water using a low-impact site design minimizing materials and making other substantive choices have clear economic benefits and that sustainable design features with little financial payback can be afforded by making tradeoffs in other areas
Project Description The laboratoryoffice complex is located on over 130 acres of land in Research Trianshygle Park in central North Carolina The new facilities have one million gross square feet of floorspace including 635000 net square feet of office and laborashy tory space for 2200 employees The complex has four 5-story lab buildings connected by three 30-foot atria to three 3-story office buildings The main building also includes a central five-story office tower with cafeteria conference center auditoriums and a library The lab and office buildings are situated alongside a lake and follow the curve of the shore The campus also includes a computer center and child-care facility
Approach to Sustainable Design Because it had not undertaken a project of this magnitude before the EPA looked to the GSA and the Army Corps of Engishy neers for design assistance and construction management Working with these agencies and the chosen architecture firm (Hellmuth Obata + Kassabaum) the Clark Construction Group and the Gillbane Building Company (a GSA contractor providing construction administration and quality assurance) EPA developed a team approach to defining environmental objectives and tracking progress toward them Project leaders made a clear commitment to design and build a green building They felt the EPA facility should symbolize the EPArsquos environmental mission Green design criteria were written into the solicitations for the architectural and engineering services the Program of Requirements and the contracts Working together green advocates architects engineers and building users developed innovative approaches after systematically reviewing a wide range of options At every step along the way the team raised questions about and re-evaluated assumptions
Sustainable Features The sustainability of the buildings and sites designs was studied in depth The designers used natural methods for landscaping and stormwater treatment To protect more than 9 acres of onsite wetland areas designers used a buffer zone about 100-feet wide along the lake edge and allowed no development except for a network of walking and jogging trails A tree survey resulted in redesigned roads saving large oak trees that have been there since the early part of the 20th century Also the size of the road was decreased from four to two lanes to minimize disruption to the natural areas and reduce costs A parking structure was built instead of disrupting acres of natural woodland for an onsite paved parking lot
The building design includes sunshading tight building envelopes high-performance glass a high level of daylighting occupancy sensors and daylight dimming high-efficiency chillers and boilers variable frequency drives an outside air economizer cycle and high-efficiency fume hoods The buildings also used low-flush toilets and urinals low-flow aerators and showerheads and water-efficient cooling towers Many recycled materials were used recycled-content asphalt rubber flooring ceramic tiles insulation wood fiberboard
4-10
gypsum wallboard and more Materials were also selected to be durable (the building was designed to last 100 years) About 80 of all construction waste was recycled which diverted about 10000 tons of material from local landfills Careful attention was paid to ventilation selection of materials and finishes and construction procedures to minimize air quality degradation inside the building
Financial Considerations Throughout the project the team examshyined the cost of green design and the cost of various options For exshyample multiple skylight options for the atrium in the buildings were considered and the options first costs and energy costs over a 20-year life were compared EPA also chose to engage in focused value engishyneering reviews Although value engineering is often seen as the enemy of good design in general and green design in particular EPA transformed the traditional value engineering process into an exercise in balancing cost function and environmental performance by including designers and sustainability advocates on the value engineershying review team and encouraging interdisciplinary brainstorming
The value engineering process was especially important at this site because during the appropriations process the US Senate asked EPA to review the project again to see if the total cost could be reduced Working with the designers the value engineering team not only reduced the total project cost by about $30 million (resulting in a final cost of $225 million) but also produced a greener building Given the pressure to reduce costs many of the environmental features that
required a first-cost increment (eg the above-ground parking garage designed to minimize disruption to 15 acres of natural woodlands) could have easily been eliminated However the team reviewed the project budget as a whole and chose to eliminate other features that were not considered critical to meet their environmental goals For instance over 200 doors were eliminated to save costs To lower the cost increment of the above-ground parking garage the amount of onsite parking was reduced by 25 and alternative transportation methods were encouraged In effect the design team put a higher value on the 15 acres of natural woodland than on building design features they considered less important to quality of life
Some of the environmentally motivated strategies that reduced cost included the following bull Replacing four-lane roads with two-lane roads (and burying the electrical and communication lines
under the road) greatly decreased the road and utility footprint preserved the site woodlands and wetlands reduced construction cost by $2 million and lowered maintenance and repair costs
bull Replacing curb and gutter and oil-grit separators with grassy swales and water quality and bio-retention ponds reduced construction costs by $500000
bull Changing the atrium skylight from all glass to one-third glass one-third insulated translucent panels and one-third solid panels to improve energy performance indoor environmental comfort and light quality saved $500000 in construction costs and $500000 in annual energy costs
bull Installing 250 specialized fume hoods and exhaust systems that reduce total air flow demand by 50 and eliminating dozens of fans lowered construction cost by $15 million and annual energy costs by $1 million
When benchmarked against other laboratoryoffice buildings the annual energy use in the facility was estimated to be 40 lower than a similar facility with a savings of more than $1 million per year
Sources Communication with C Long and P Schubert EPAs Research Triangle Park EPA (1997 2001) and DOEs High Performance Buildings Database at httpwwweereenergygovbuildingshighperformancecase_studiesoverviewcfmProjectID=30
4-11
Strengthening the Business Case Research and Data Needs
The research results and case studies that were presented in the preceding sections show that a strong business case for sustainable design and construction can be made today Case studies described in Section 2 indicate that a well-designed building which integrates sustainable design features in the early stages of design can be built at about the same cost as a more typical building without those features because creative building design teams can incorporate sustainable features by reducing costs in other parts of the project Even when first costs increase slightly lifecycle cost reductions and short payback periods can make sustainable design very cost effective A number of studies also show that sustainable buildings have positive impacts on occupants Because the annual salary and benefit costs of building occupants far outweigh the annualized capital costs or the yearly costs of energy and OampM occupant productivity gains can have a considerable impact on business costs
Other stakeholders such as neighbors and local and state governments may also realize benefits such as increased protection of local natural resources lower pollution loadings better regional employment opportunities and lower infrastructure needs (eg water and waste treatment facilities) These in turn can result in economic benefits to the building owneroperator in the form of easier siting of the next facility less time to deal with complaints from the neighbors and other indirect benefits For government agencies the public good value associated with these benefits should in theory be more important than it is in the private sector Unfortunately some of these benefits are supported mainly by a few research studies or anecdotal evidence
Table 5-1 summarizes the status of the business case information in the various cells of the matrix presented in Section 1 (also presented in more detail in Appendix A)
The arguments supporting sustainable design will gain strength as more data and information are collected on the effects of sustainable design and construction on first costs annual energy and other operating costs occupant health productivity and well-being environmental impacts and other social and business impacts Some of the areas for which data gathering may prove useful to the business case are as follows
bull First costs Because projects evolve over time there is usually no clearly defined before and after picture that would allow the costs of various features that were added or taken out of the design to be estimated Case studies aimed at tracking cost estimates as the project evolves would be useful First-cost information could be more widely disseminated by adding more case studies and detail to the cost information in databases such as DOEs High Performance Buildings Database In addition for many types of sustainable design features very little generic cost information has been gathered For sustainable materials some reliable data have been collected into databases such as the Building for Environmental and Economic Sustainability developed by the National Institute of Standards and Technology 52 but further work to develop similar databases for other types of sustainable design features may be warranted The ability to examine various classes of features (materials energy efficiency water etc) through one access point (eg a single website) could be very useful
52 Available at httpwwwbfrlnistgovoaesoftwarebeespleasebees_pleasehtml
5-1
Table 5-1 Status of Business Case Information
Category Economic Benefits Social Benefits Environmental Benefits
Sustainable Some information is avail- This study found no compreshy No comprehensive research siting able on the cost and cost
savings associated with siting approaches This study estishymated cost savings associated with natural landscaping (resulting from reduced water and fertilizer consumpshytion) More data like this could be gathered through case studies or analysis of vendor information
hensive research done on the value society places on susshytainable siting However some survey work or other research may have been done (eg in an envishyronmental impact statement process) to examine benefits of specific sustainable design strategies such as siting on brownfields
has been done on the envishyronmental benefits of siting strategies These would be site-specific It would be feasible to estimate benefits such as CO2 and air pollution benefits of lower energy use due to better passive solar strategies
Water efficiency Some information is available on the cost and cost savings of various water-saving strategies This study estimated first costs and cost savings associated with specific water-efficiency technologies but a wider range of technologies could be investigated The water and cost savings in this study are based on theoretical estimates no water monitoring studies have been incorporated into the business case report to date
Impacts of building water consumption on current and future water supplies have not been studied in any comshyprehensive way (according to the research done for this study) Information on local water supply impacts may be available in cases where envishyronmental impact statements must be completed
This study estimated impacts on water consumption of some specific technologies A wider range of technologies could be investigated (such as those applicable to larger buildings than those examined in this study) Also projections of Federal facility water use and potential for reduction using sustainable design strategies would be useful
Energy efficiency Costs for a wide variety of energy-efficiency measures are available from various sources This study estimated first costs and annual cost savings associshyated with a combination of those technologies Some case study information has also been gathered Further work would involve gathering costs of a wider range of technologies especially those that should be used in larger building Also most of the estimates in this document have been based on models not measured energy savings More measured data could be gathered
Some research results show positive effects on building occupants of certain building features such as daylighting which also reduce energy consumption Although thermal comfort effects on productivity have been studied data are sparse on the impact of particular HVAC systems and other energy-efficiency measures on occupants One exemption is the study by Loftness et al (2002) which compiled research results on occupant benefits of underfloor HVAC systems This area of research might be of interest to the energy-efficiency community
The direct air pollution and CO2 emission impacts of energy-reducing strategies are fairly easy to estimate Other environmental impacts of energy efficiency are site-specific and more difficult to estimate
5-2
Category Economic Benefits Social Benefits Environmental Benefits
Sustainable Some databases of sustain- Some research results indishy The full lifecycle impacts of materials able materials exist (eg the
National Institute of Stanshydards and Technology maintains the Building for Environmental and Econoshymic Sustainability ndash BEES ndash database) This study estimated first costs and estimated cost savings associated with specific sustainable materials
cate that the use of low-emitting material such as carpeting paint etc can reduce occupants illness symptoms
sustainable materials could be investigated Some effort has been undertaken by various research groups to do this kind of work
Indoor environmental quality
Some costs have been gathered in databases such as BEES (see above) Cost differentials for low-VOC paint are included in the document Cost estimates of improved ventilation are available Further refinement and data gathering may be warranted for other features related to indoor environmental quality
Much research has been done in this area (see Appendix F) but gaps exist Gaps could potentially be prioritized based on the business impact of the effects
Very little coverage of this topic is in this document or elsewhere
Commissioning Quite a few case studies of Based on the limited search Estimating air pollution and OampM building commissioning
have been compiled by PECI This document includes a very cursory examination of the costs and cost savings of commissioning and OampM
for information conducted for this study it appears that little work has been done to estimate the positive impacts of commisshysioning and OampM on building occupants This topic has been discussed only qualitatively in this business case report This is a potentially important area for business case research because occupant health impacts have potentially large financial consequences
impacts of reducing energy use through commissioning and OampM is feasible Genshyeral information on energy savings associated with commissioning and OampM has been included in this document
bull Annual energy cost data Most information about cost savings associated with sustainable buildings is based on estimates made in the design phase For instance energy savings are modeled using tools such as Energy-10 and DOE-2 (discussed in Section 2 and Appendix B) But once built the building may not perform as simulated Meters can be used to measure actual performance and compare that against the modeled results but metering studies can be costly and often are not performed because of budget constraints Even when meters are present some building operators report that they do not have the time and resources to analyze the data This document provides information from a few case studies where actual performance has been measured and analyzed A more widespread program to monitor energy consumption and costs by end use in both sustainable and traditional buildings could bolster the business case for sustainable design in Federal facilities
5-3
bull Non-energy operating costs In addition to energy costs annual watersewer costs as well as general maintenance and repair costs could be monitored in sustainable buildings to help determine whether these costs are lower than those in their traditional counterparts
bull Occupant benefits A number of studies indicate that sustainable buildings improve occupant productivity and have other positive impacts that can affect the bottom line but more research is needed to quantify these effects in a way that allows decision makers to translate them into cost savings for every type of building The Center for Building Performance and Diagnostics within the School of Architecture at Carnegie Mellon University has collated a large body of research into a tool called the Building Investment Decision Support (BIDS) BIDS allows a user to generalize the results of particular research studies to estimate potential benefits at the users facility Given the differences between the buildings studied in the research and each users specific building BIDS can provide only a hypothetical estimate of dollar benefits More research on building occupants health satisfaction and productivity in a wide range of buildings would help strengthen the business case In particular a better understanding is needed on how to quantify impacts on the productivity of knowledge workers In addition the sustainable design community would benefit from more research that links specific sustainable design features to the corresponding occupant benefits
bull Other benefits to the building owner and the public Aside from the impacts of indoor environmental quality on occupants very little research has been conducted on the social impacts of other aspects of sustainable design Many hypothesized relationships between sustainable design features and impacts on both occupants and society at large described in the previous sections are supported by only a few studies or by anecdotal evidence Data-gathering methods could be developed to investigate the validity of the following arguments for sustainable design ࠃ Employee turnover is substantially lower in sustainable buildings ࠃ Green buildings experience lower occupant complaints and less on-call maintenance costs ࠃ Property values increase in the vicinity of green buildings ࠃ Sustainable building improves the market for recycled products ࠃ Green buildings are a factor in attracting the most desirable employees
These factors may be as important to the business case as first costs and energy savings so further research to gather data on these topics through surveys and other means may be warranted
bull Environmental benefits Some of the potential research activities on environmental benefits of sustainable design in Federal facilities might include the following ࠃ Develop a better profile of the environmental impacts of Federal facilities ࠃ Benchmark best practices with regard to environmental impacts so comparisons can be
made across facilities ࠃ Improve monitoring and analysis of energy and water consumption in Federal facilities
especially new green buildings and quantitatively assess the environmental improvements (eg reductions in energy air emissions and water consumption)
ࠃ Share lessons learned and case studies that quantify environmental improvements ࠃ Continue to track studies assessing the environmental impacts of buildings and methods
to place economic values on environmental improvements
In November 2002 FEMP convened a workshop of individuals knowledgeable about the business case for sustainable design from various government agencies academia and the private sector
5-4
-
The purpose was to discuss data and research needed to make a stronger business case for sustainable design (FEMP is expected to publish a report on this workshop in the near future) Small groups of workshop participants discussed research needs in three areas direct cost savings associated with sustainable design and construction occupant productivity and well-being and strategic business considerations Some of the recommendations of the participants summarized in Table 5-2 overlap with and build on the suggestions described above
Table 5-2 Key Recommendations from Participants in the Sustainable Design Business Case Workshop
Direct Costs Productivity and Well Being Strategic Business
Considerations
bull Gather cost data (eg dollars per ft2 normalized by building type and location) for many sustainable design projects so that analysts can estimate statistically signify-cant differences in first costs between traditional and sustainable buildings
bull Use DOEs High Performance Buildings website to compile case studies
bull Understand the differences between the costs for incremental improvements that marginally improve a buildings environmental performance versus costs for sustainable buildings derived from integrated design
bull Develop consistent protocols for data collection reporting and use
bull Develop a better understandshying of productivity and how it can be measured for a whole variety of job types including knowledge workers as well as the impacts of sustainable design and construction on productivity
bull Better define the critical building features (both sustainable and other features) that impact health well-being and productivity to be included in controlled studies
bull Focus on causal links between building features and health (eg disease transmission) using controlled studies (perhaps using methods data and results from other fields of research)
bull Develop a more definitive understanding of the relationshyship between daylight natural ventilation and views on health well-being and productivity
bull Conduct cross-sectional studies of high-performance buildings compared with conventional buildings using survey tools
bull Identify methods to better understand risk and liability occupant health effects employee retention and other key impacts of sustainable design
bull Develop a common standard for assessing environmental (broadly defined) impacts of sustainable facilities
bull Develop a method to allow all levels of managers to build their own business case for sustainable projects (within the context of their agencies and management priorities)
bull Work with a broad range of stakeholders to develop ways to better understand the strashytegic benefits of sustainable design and consider ways to study the market-transforming effects of systems such as LEED
5-5
References
10 CFR 434 Energy Code for New Federal Commercial and Multi-Family High Rise Residential Buildings US Code of Federal Regulations as amended
10 CFR 435 Energy Conservation Voluntary Performance Standards for New Buildings Mandatory For Federal Buildings Code of Federal Regulations as amended
40 CFR Part 50 National Primary and Secondary Ambient Air Quality Standards Code of Federal Regulations as amended
American Insurance Association 1999 PropertyCasualty Insurance and the Climate Change Debate A Risk Assessment Washington DC
American Institute of Chemical Engineers 1999 Total Cost Assessment Methodology American Institute of Chemical Engineersrsquo Center for Waste Reduction Technologies Washington DC
ASHRAE 901-1999 Energy Standard for Buildings Except Low-Rise Residential Buildings American Society of Heating Refrigeration and Air Conditioning Engineers Atlanta Georgia
ASHRAE 901-2001 Energy Standard for Buildings Except Low-Rise Residential Buildings American Society of Heating Refrigeration and Air Conditioning Engineers Atlanta Georgia
Beauchemin KM and P Hays 1996 Sunny hospital rooms expedite recovery from severe and refractory depressions Journal of Affective Disorders 4049-51
Belojevic G V Slepcevic and B Jakovljevic 2001 Mental performance in noise the role of introversion Journal of Environmental Psychology 21 277-207
Bornehag CG G Blomquist F Gyntelberg B Jarvholm P Malmberg L Nordvall G Pershagen and J Sundell 2001 Dampness in buildings and health Indoor Air 11(2)71
Boubekri M RB Hulliv and LL Boyer 1991 Impact of window size and sunlight penetration on office workers mood and satisfaction a novel way of assessing sunlight Environment and Behavior 23(4)474-493
Brady R 1995 Commissioning Services Can Reduce Professional Liability Losses In Proceedings of the Third National Conference on Building Commissioning Portland Energy Conservation Inc Portland Oregon
Brager GS and R deDear 2000 A Standard for Natural Ventilation ASHRAE Journal p 21-28
Brightman HS and N Moss 2001 Sick building syndrome studies and the compilation of normative and comparative values In Indoor Air Quality Handbook eds JD Spengler JM Samet and JF McCarthy McGraw-Hill New York
Brown SK 1999 Assessment of pollutant emissions from dry-process photocopiers Indoor Air 9(4)259-267
Brundtland Commission 1987 Our Common Future United Nations World Commission on Economic Development Oxford University Press Oxford England
Building Green Inc February 2003 Environmental Building News 12(2) published by Brattleboro Vermont [online newsletter available by subscription] URL httpwwwbuildinggreencom
6-1
Building Green Inc May 1999 Environmental Building News 8(9) published by Brattleboro Vermont [online newsletter available by subscription] URL httpwwwbuildinggreencom
Butler D and PM Biner 1989 Effects of setting on window preferences and factors associated with those preferences Environment and Behavior 2117-31
Chen A and EL Vine 1998 A Scoping Study on the Costs of Indoor Air Quality Illnesses An Insurance Loss Reduction Perspective Report No 41919 Lawrence Berkeley National Laboratory Berkeley California A briefer version is published in Environmental Science amp Policy 2 (1999) 457-464 Available at URL httpeetdlblgovinsuranceLBNL-41919html
Chou M and G Parker 2000 Recognition of Energy Costs and Energy Performance in Commercial Property Valuation Institute for Market Transformation prepared for the New York State Energy Research and Development Authority New York Energy $martSM Program Available at URL httpwwwimtorg
Clean Air Act Amendments of 1990 42 USC 7401 et seq
Clearwater Y and RG Coss 1990 Functional aesthetics to enhance well-being in isolated and confined settings In From Antartica to Outer Space Life in Isolation and Confinement eds AA Harrison YA Clearwater and CP McKay Springer-Verlag New York
Collins BL 1975 Windows and People US Department of Commerce Washington DC
Collins BL 1993 Evaluation of Subjective Responses to Lighting Distributions A Literature Review US Department of Commerce NISTIR 5119 National Institute of Standards and Technology Gaithersburg Maryland
Collins BL WS Fisher GL Gillette and RM Marans 1990 Second level post occupancy evaluation analysis Journal of the Illuminating Engineering Society 1921-44
deDear RJ M Fountain S Popovic S Watkins G Brager E Arens and C Benton 1993 A Field Study of Occupant Comfort and Office Thermal Environments in a Hot-Humid Climate ASHRAE Report No RPshy702 American Society of Heating Refrigerating and Air Conditioning Engineers Atlanta Georgia
Deering A and JP Thornton 1998 Solar Technology and the Insurance Industry Issues and Applications NRELMP 520-25866 National Renewable Energy Laboratory Golden Colorado
DOE ndash See US Department of Energy
Dziegielewski B J Kiefer E Opitz G Porter G Lantz W DeOreo P Mayer and J Olaf Nelson 2000 Commercial and Institutional End Uses of Water American Water Works Association Denver Colorado
Energy Information Administration 1995 Commercial Buildings Energy Consumption Survey US Department of Energy Energy Information Administration Washington DC
Energy Policy Act of 1992 Public Law 102-486
EPA ndash See US Environmental Protection Agency
Epstein MJ and SD Young 1999 Greening with EVA Management Accounting pp45-49
Eto J J Koomey B Lehman N Martin E Mills C Webber and E Worrell 2001 Scoping Study on Trends in the Economic Value of Electricity Reliability to the US Economy Report No 47911
6-2
Prepared for the Electric Power Research Institute by Lawrence Berkeley National Laboratory Berkeley California Available at URL httpeetdlblgoveaEMSreports47911pdf
Eysenck MW 1982 Attention and Arousal Springer Berlin Germany
Executive Order 13123 June 3 1999 Greening the Government Through Efficient Energy Management The White House Washington DC
Federal Energy Management System MarchApril 2002 Postal Service Installs Largest Federal Roof-Integrated Solar Photovoltaic System In FEMP Focus Federal Energy Management System Distributed Energy Resources Case Study Available at URL wwwerendoegovfemp
Federal Facilities Council 2001 Sustainable Federal Facilities A Guide to Integrating Value Engineering Life-Cycle Costing and Sustainable Development National Academy Press Washington DC
Federspiel CC 2001 Costs of Responding to Complaints Indoor Air Quality Handbook eds JD Spengler JM Samet and JF McCarthy McGraw-Hill New York
Fisk WJ 2000 Health and productivity gains from better indoor environments and their implications for the US Department of Energy E-Vision 2000 Conference Rand Corporation Santa Monica California
Fisk WJ 2001 Estimates of potential nationwide productivity and health benefits from better indoor environments an update In Indoor Air Quality Handbook eds JD Spengler JM Samet and JF McCarthy McGraw-Hill New York
Fisk WJ May 2002 How IEQ Affects Health Productivity ASHRAE Journal pp 56-58
Freeman AM 1993 The Measurement of Environmental and Resource Values Resources for the Future Washington DC
Fried Y LH Slowik HA Ben-David and RB Tiegs 2001 Exploring the Relationship Between Workspace Density and Employee Attitudinal Reaction An Integrative Model Journal of Occupational and Organizational Psychology 74359-372
Gabarro JJ 1987 The Development of Working Relationships Handbook of Organizational Behavior ed J Lorsch Prentice-Hall Englewood Cliffs New Jersey
Geen RG 1984 Preferred stimulation levels in introverts and extroverts The Handbook of Organizational Behavior Prentice-Hall Englewood Cliffs New Jersey
Geen RG and JJ Gange 1977 Drive theory and social facilitation twelve years of theory and research Psychological Bulletin 84 1267-1288
Gutwin L and S Greenberg 2001 A descriptive framework of workspace awareness for real time groupware Proceedings of Computer Supported Collaborative Work lsquo01 Kluwer Academic Press New York
Harris J B Dyer and W Tschudi 2002 Securing Buildings and Saving Energy Opportunities in the Federal Sector Presented at the US Green Building Conference Austin Texas US Green Building Council Washington DC
Hartig T M Mang and G Evans 1991 Restorative effects of natural environment experiences Environment and Behavior 233-26
6-3
Hedge A 2000 Where Are We in Understanding the Effects of Where We Are Ergonomics 43(7)1019-129
Hedge A GE Mitchell and J McCarthy 1993 Effects of a Furniture-integrated Breathing Zone Filtration System on Indoor Air Quality Sick Building Syndrome Productivity and Absenteeism Indoor Air 3328-336
Hedge A WR Sims and FD Becker 1995 Effects of lensed-indirect and parabolic lighting on satisfaction visual health and productivity of office workers Ergonomics 38(2)260-280
Heerwagen J 1990 Affective functioning light hunger and room brightness preferences Environment and Behavior 22(5)608-635
Heerwagen J 2000 Do Green Buildings Enhance the Well Being of Workers Environmental Design+Construction 3(4)24-30
Heerwagen J and B Hunt 2002 Post Occupancy Evaluation of Region 10 Office of the Future US General Services Administration Washington DC
Heerwagen J and G Orians 1986 Adaptations to windowlessness a study of the use of visual deacutecor in windowed and windowless offices Environment and Behavior 18(5)623-630
Heerwagen J J Loveland and R Diamond 1991 Post Occupancy Evaluation of Energy Edge Buildings Center for Planning and Design University of Washington Seattle Washington
Heerwagen J and R Diamond 1992 Adaptations and Coping Occupant Response to Discomfort in Energy Efficient Buildings In Proceedings of ACEEE 1992 Summer Study on Energy Efficiency in Buildings 101083-1090
Heerwagen JH and JA Wise 1998 Green Building Benefits Differences in Perceptions and Experiences Across Manufacturing Shifts HeatingPipingAir Conditioning 57-63
Heschong-Mahone Group 1999 Daylighting in Schools An Investigation into the Relationship between Daylighting and Human Performance Pacific Gas and Electric Company San Francisco California
Hunt WM and GP Sullivan 2002 Assessing the Potential for a FEMP Operations and Maintenance (OampM) Program to Improve Energy Efficiency PNNL-14076 Pacific Northwest National Laboratory Richland Washington
International Facility Management Association 1997 Benchmarks III Research Report 18 Houston Texas
Jakkola JJK and OP Heinonen 1993 Shared office space and the risk of the common cold European Journal of Epidemiology 11(2)213-216
Jones DM and N Norris 1992 Irrelevant Speech and Cognition In Handbook of Human Performance Vol 1 The Physical Environment eds DM Jones and AP Smith Academic Press London
Kaplan R 1992 Urban forestry and the workplace In Managing Urban and High-Use Recreation Settings ed PH Gobster USDA Forest Service General Technical Report NC-163 North Central Forest Experiment Station Chicago Illinois
Kroner W JA Stark-Martin and T Willemain 1992 Using Advanced Office Technology to Increase Productivity Rensselaer Polytechnic Institute Center for Architectural Research Troy New York
6-4
Laboratories for the 21st Century Case Studies 2001 Case Studies Process and Environmental Technology Laboratory at Sandia National Laboratories New Mexico US Department of Energy Available at URL httplabs21lblgovdocsPETL30810pdf
Lamberg-Allardt C 1984 Vitamin D Intake Sunlight Exposure and 25-Hydroxyvitamin D levels in the Elderly During One Year Annals of Nutrition and Metabolism 28144-150
Leaman A 1999 UK study links productivity to ventilation systems HPAC Magazine 71(11)14
Leaman A and B Bordass 2001 The Probe occupant surveys and their implications Building Research and Information 29(2)129-143
Leather P M Pyrgas D Beale and C Lawrence 1998 Windows in the Workplace Sunlight View and Occupational Stress Environment and Behavior 30(6)739-762
Loftness V R Brahme M Mondazzi E Vineyard and M MacDonald 2002 Energy Savings Potential of Flexible and Adaptive HVAC Distribution Systems for Office Buildings Air-Conditioning and Refrigeration Technology Institute (ARTI) Arlington Virginia Available at URL httpwwwarti-21crorgresearchcompletedfinalreports30030-finalpdf
Lotspeich C P Rumsey and S Van der Ryn NovemberDecember 2002 Renovating the Design and Construction Process for Sustainable Success Part 1 Environmental Design+Construction Business News Publishing Company II LLC Available at URL wwwEDCmagcom
MS Addison and Associates October 2002 User-Friendly Building Life-Cycle Cost Analysis Tempe Arizona
Marshall HE and SR Petersen 1995 Life-Cycle Costing Mechanical Estimating Guidebook for Building Construction 6th edition McGraw Hill New York
Menzies D J Pasztor F Nunes J Leduc and C-H Chan 1997 Effect of a new ventilation system on health and well-being of office workers Archives of Environmental Health 52(5)360-368
Milam JA 1992 Underfloor Air Distribution HVAC System Analysis Prepared for USG Interiors Inc and published by Environmental Design International Atlanta Georgia
Mills E 2001 When the Lights Go Out Bests Review AM Best Company Oldwick New Jersey Available at URL httpwwwbestreviewcom2001-07pc_lightshtml
Mills E 2002 Amplifying Real Estate Value Through Energy amp Water Management draft paper available at URL httpeetdlblgovemillsPUBSPDFMills_RE_and_EE(draft)pdf
Mills E 2003a Climate Change Buildings and the Insurance Sector Technological Synergisms between Adaptation and Mitigation Building Research and Information [In Press] Available at URL httpeetdlblgovemillsPUBSMitigation_Adaptationhtml
Mills E 2003b The Insurance and Risk Management Industries New Players in the Delivery of Energy-Efficient Products and Services Energy Policy LBNL-43642 Lawrence Berkeley National Laboratory Berkeley California Available at URL httpeetdlblgovemillsPUBSInsurance_Case_Studieshtml
Milton DK PM Glencross and MD Walters 2000 Risk of Sick Leave Associated with Outdoor Air Supply Rate Humidification and Occupant Complaints Indoor Air 2000 10212-221
6-5
Morgenstern ES RJ Hodgson and L Law 1994 Work efficiency and personality A comparison of introverted and extroverted subjects exposed to conditions of distraction and distortion of stimulus in a learning task Ergonomics 17211-220
National Research Council 1998 Stewardship of Federal Facilities A Proactive Strategy for Managing the Nationrsquos Public Assets National Academy Press Washington DC
National Research Council 2001 Energy Research at DOE Was It Worth It National Academy Press Washington DC
New York City Department of Design and Construction 2000 High Performance Building Guidelines Available at URL httpwwwcinycnyushtmlddchtmlhighperfhtml
Nunes R R Menzies RM Tamblyn E Boehm and R Letz 1993 The effect of varying level of outdoor air supply on neurobehavioral performance function during a study of sick building syndrome In Proceedings Indoor Air 1993 the 6th International Conference on Indoor Air Quality and Climate 153-58 Indoor Air 1993 Helsinki Finland
PECI ndash See Portland Energy Conservation Inc
Pejtersen J H Brohus CD Hyldgaard JB Nielsen O Valbjorn P Hauschildt SK Kjaergaaard and P Wolkoff 2001 Effect of renovating an office building on occupantsrsquo comfort and health Indoor Air 11(1)10-25
Portland Energy Conservation Inc (PECI) 1997 What Can Commissioning Do For Your Building Portland Oregon
Preller LT T Zweers B Brunekreef and JSM Bolej 1990 Sick Leave Due to Work-Related Health Complaints Among Office Workers in the Netherlands Indoor Air rsquo90 1227-230
Randall A 1987 Resource Economics An Economic Approach to Natural Resource and Environmental Policy Wiley New York
Reed DJ 2001 Stalking the Elusive Business Case for Corporate Sustainability World Resources Institute Sustainable Enterprise Program Washington DC
Rosenfeld AH H Akbari S Bretz BL Fishman DM Kurn D Sailor and H Taha 1995 Mitigation of Urban Heat Islands Materials Utility Programs Updates Energy and Buildings 22255-265
Rosenthal NE and MC Blehar (eds) 1989 Seasonal Affective Disorders and Phototherapy Guilford New York
RS Means Company Inc 1999 Building Construction Cost Data Construction Publishers and Consultants Kingston Massachusetts
RS Means Company Inc 2002 Green Building Project Planning and Cost Estimating Construction Publishers and Consultants Kingston Massachusetts
Rubin HR AJ Owens and G Golden 1998 An Investigation to Determine Whether the Built Environment Affects Patientsrsquo Medical Outcomes Center for Health Design Martinez California
Sandia National Laboratories and Laboratories for the 21st Century Case Studies 2001 Process and Environmental Technology Laboratory at Sandia National Laboratories New Mexico US Department of Energy Available at URL httplabs21lblgovcshtml
6-6
Sensharma NP JE Woods and AK Goodwin 1998 Relationship between the indoor environment and productivity a literature review ASHRAE Transactions 104 Part 2
Seppanen OA WJ Fisk and MJ Mendell 1999 Association of ventilation rates and C02
concentrations with health and other responses in commercial and institutional buildings Indoor Air 9226-256
Shute RW 1992 Integrated Access Floor HVAC ASHRAE Transactions 1992 98(1)730-737
Sieber WK LT Stayner R Malkin MR Petersen MJ Mendell KM Wallingford MS Crandall TG Wilcox and L Reed 1996 The National Institute for Occupational Safety and Health Indoor Environmental Evaluation Experience Part Three Associations between environmental factors and self-reported health conditions Applied Occupational and Environmental Hygiene 11(12)1387shy1392
Smedbold HT A Ahlen D Norback and B Hilt 2001 Sign of eye irritation in female hospital workers and the indoor environment Indoor Air 11(4)223-231
Stansfield W and P Shine 1993 Noise sensitivity and psychophysiological responses to noise in the laboratory ed MVallet Proceedings of the 6th International Congress on Noise as a Public Health Problem Nice France INRETS 481-484
Sundstrom E JP Town DW Brown A Forman and C McGee 1982 Physical Enclosure Type of Job and Privacy in the Office Environment and Behavior 14(5)543-559
SustainAbility and the United Nations Environmental Program 2001 Buried Treasure Uncovering the business case for corporate sustainability [report] Available at URL httpwwwsustainabilitycomstoreengagingasp
Szilagyi A and W Holland 1980 Changes in social density relationships with functional interaction and perceptions of job characteristics role stress and work satisfaction Journal of Applied Psychology 65 28-33
Taffalla R and G Evans 1997 Noise Physiology and Human Performance The Potential Role of Effort J of Occupational Health Psychology 2(2)144-155
Teasley S L Covi MS Krishnan and J Olson 2000 How does radical collocation help a team succeed Conference on Computer Supported Collaborative Work 00 Philadelphia Pennsylvania Association for Computing Machinery New York
Torcellini P R Judkoff and S Hayter 2002 Zion National Park Visitor Center Significant Energy Savings Achieved through a Whole-Building Design Process National Renewable Energy Laboratory Golden Colorado Available at URL httpwwwerendoegovbuildingshighperformancecase_studiesoverview
Ulrich R 1984 View through a window may influence recovery from surgery Science 224420-421
Uniform Building Code 1997 International Conference of Building Officials Whittier California
University of California Los Angeles 2000 Waterfree Urinal Study Department of Civil and Environmental Engineering Los Angeles California
University of South Alabama 1999 Comparison of Maintenance GrasspaveGravelpave vs Conventional Asphalt Parking Lots Mobile Alabama
6-7
US Department of Energy 2001 Annual Report to Congress on Federal Government Energy Management and Conservation Programs Washington DC
US Department of Energy 2002 2002 Buildings Energy Databook Washington DC Available at URL httpbuildingsdatabookerendoegov
US Environmental Protection Agency 1989 Report to Congress on Indoor Air Quality In Assessment and Control of Indoor Air Pollution Volume II Office of Air and Radiation (ANR-445) Washington DC
US Environmental Protection Agency 1997 Leading by Example Two Case Studies Documenting How the Environmental Protection Agency Incorporated Environmental Features into New Buildings EPA 742-Rshy97-006 Washington DC
US Environmental Protection Agency 2001 The Greening Curve Lessons Learned in the Design of the New EPA Campus in North Carolina Research Triangle Park North Carolina
US General Services Administration and US Department of Energy 1998 Building Commissioning Guide Version 22 [report] Available at URL httpwwwerendoegovfemptechassistbldgcomgdhtml
US Office of Personnel Management 2003 The Fact Book Federal Civilian Workforces Statistics Available at URL httpwwwopmgovfeddata02factbkpdf
Veitch J and SL McColl 1994 Full spectrum fluorescent lighting effects on people a critical review In Full Spectrum Lighting Effects on Performance Mood and Health Internal Report ed JA Veitch 65953-111 National Research Council of Canada Institute for Construction Research Ottawa Canada
Vine E E Mills and A Chen 1998 Energy-Efficiency and Renewable Energy Options For Risk Management and Insurance Loss Reduction An Inventory of Technologies Research Capabilities and Research Facilities at the US Department of Energys National Laboratories Report No 41432 Lawrence Berkeley National Laboratory Berkeley California (Technical appendixes are bound separately) A briefer version is published in Energy 25 (2000)131-147 Available at URL httpeetdlblgovinsuranceLBNLshy41432html
Vine E E Mills and A Chen 1999 Tapping Into Energy New Technologies and Procedures that Use Energy More Efficiently or Supply Renewable Energy Offer a Largely Untapped Path to Achieving Risk Management Objectives Bests Review - PropertyCasualty Edition Available at URL httpeetdlblgovInsuranceBestReviewbestreviewarthtml
WW Grainger 2000 Industrial Supply Lighting Catalog 2000-2001 Lake Forest Illinois
Wargocki P DP Wyon J Sundell G Clausen and PO Fanger 2000 The effects of outdoor air supply rate in an office on perceived air quality sick building syndrome (SBS) symptoms and productivity Indoor Air 10(4)222-236
Wargocki P DP Wyon YK Baik G Clausen and PO Fanger 1999 Perceived air quality sick building syndrome (SBS) symptoms and productivity in an office with two different pollution loads Indoor Air 9(3)165-179
Wilkins AJ L Nimmo-Smith A Slater and L Bedoes 1989 Fluorescent lighting headaches and eyestrain Lighting Research and Technology 21 11-18
Willard B 2002 The Sustainability Advantage Seven Business Case Benefits of a Triple Bottom Line New Society Publishers Gabriola Island British Columbia
6-8
Wolkoff P CR Johnsen C Franck P Wilhardt and O Albrechtsen 1992 A study of human reactions to office machines in a climatic chamber Journal of Exposure Analysis and Environmental Epidemiology Suppl 171-96
Wyon DP 1996 Indoor Environmental Effects on Productivity In Proceedings of IAQ 96 Paths to Better Building Environments American Society of Heating Refrigerating and Air Conditioning Engineers Atlanta Georgia
Wyon DP 2000 Thermal Effects on Performance In Indoor Air Quality Handbook eds JD Spengler JM Samet and JF McCarthy McGraw-Hill New York
Zijlstra FRH RA Roe AB Leonora and I Krediet 1999 Temporal Factors in Mental Work Effects of Interrupted Activities Journal of Occupational and Organizational Psychology 72163-185
6-9
Appendix A Matrix of Benefits of Sustainable Design
This appendix provides information on the benefits of various sustainable design features The benefits are listed in the matrix (Table A-1) for each sustainable design feature The features are categorized into six primary categories
1 Sustainable siting 2 Water efficiency 3 Energy efficiency 4 Sustainable materials and resources 5 Indoor environmental quality 6 Commissioning and operation amp maintenance (OampM)
These correspond closely to the categories in the Leadership in Energy and Environmental Design (LEEDtrade) rating system and the Whole Building Design Guide1 discussed in Section 1 of the main body of this document Thus this matrix combines the ldquotriple bottom linerdquo benefits framework with six principal elements of sustainable building design Some of the benefits accrue to the facility owner and other benefits accrue to other parties such as employees local governments the local communityeconomy or the public at large When applicable those are designated in the table
Although the list of benefits is extensive it may not be completely comprehensive Some of the benefits of sustainable design will be discovered as more experience is gained with living and working in sustainable buildings
1 See httpwwwwbdgorgindexasp
A-1
Table A-1 Possible Benefits of Sustainable Design by Feature
A-2
Sustainable Design Feature
Benefits Category
Economic Social Environmental
Sustainable Siting
Site selection Analyze alternatives including use of existing facilities Do not build on prime agricultural land floodshyplains and habitats for threatened species near wetlands or on parklands Consider urban redevelopment and brownfield redevelopment sites (which require cleanup)
Facility bull Lower site preparation costs bull Potential for reduced costs of
litigation and time delay (eg because threatened species are not present not at the site)
Local government bull Lower infrastructure development
costs to support existing rather than greenfield sites
Local economy bull Reduced tourism losses
Society bull Preservation of natural
areas agricultural land and parkland for future generations
Society bull Decreased use of virgin resources bull Protection of threatened species and
wetlands bull Remediation of contaminated land
(when brownfield is used) bull Reduced erosion and flood damage bull Reduced impact on fisheries and
forests
Site analysis and harmonious building-site relationship Inventory and analyze the ecological context urban and historical context and natural and cultural attributes Organize mass orientashytion topography and outdoor spaces to employ passive solar principles provide outdoor spaces etc Design to reduce potentially detrimental conditions such as slopes that can erode Avoid adverse impacts on adjacent properties Carefully consider the placement of existing trees on site
Facility bull Possible reduction in first costs
(reduced size and cost of mechanical systems)
bull Reduction in operating costs (fuel costs)
Local government bull Elimination of unnecessary
infrastructure expenditures due to good assessment of site resources
Society bull Improved aesthetic and
functional quality of site and building for both occupants and neighbors
Society bull Reduction in energy consumption
and emissions due to optimal orientation etc
bull Conservation and restoration of ecological and cultural resources
bull Reduced negative microclimate and environmental effects in local vicinity
Facilitation of alternative transporshytation use Locate facility near rail station or bus lines Provide covered wind-sheltered seating or waiting areas for public transport Provide bicycle storage and showers Install alternative-fuel refueling stations Provide preferred parking for carpools
Facility bull Slightly lower capital cost due to
reduced parking lot size (could be offset by additional costs for showers and refueling stations)
Employees bull Potentially lower commuting costs
(using public transport rather than personal cars)
Employees bull More transportation options
Society bull Lower energy use and air pollution
from vehicles bull Reduced land disturbance for new
roads
Sustainable Design Feature
Benefits Category
Economic Social Environmental
Erosion and sedimentation control and stormwater management Develop sediment and erosion control plan Prevent loss of soil during construcshytion Prevent sedimentation of storm sewer or receiving streams Plant watershyshed buffers Allow infiltration via porous surfaces Filter stormwater through plantings and soil Use natural drainage systems
Facility bull Decreased cost of storm drainage
construction by using more natural methods
bull Reduced cost of landscaping after construction is completed (because topsoil is saved)
Localstate government bull Reduced cost of stream cleanup
and water treatment plants
Neighborslocal community bull Less disturbance during
construction
Society bull Less loss of soil during construction bull Prevention of sedimentation of storm
sewers or receiving streams bull Reduced dustparticulate matter
during construction bull Less disruption of natural water flows bull Reduction of runoff into natural water
systems
Reduced site disturbance during Facility Neighborslocal community Society construction Limit site disturbance bull Potentially decreased cost of clearshy bull Less disturbance during site bull Preservation of trees and other around the building perimeter curbs cutting and subsequent preparation vegetation walkways and main utility branch relandscaping bull Retention of vegetation and bull Increased habitat for natural species trenches Reduce the development bull Decreased site infrastructure costs scenic vistas biodiversity footprint to exceed open space bull More greenspace for use by requirements in local zoning rules occupants andor
community
Sustainable landscape and exterior design Use self-sustaining landscape design and site maintenance procedures Restore habitats Use plants native to the region Consider drought-resistance plants Avoid plants needing chemical treatment and fertilizers or causing allergic reactions Consider using green roofs
Facility bull Reduced maintenance costs water
use fertilizer and fossil fuel use due to naturally manicured landscaping
bull Possibly decreased heatcooling loads due to vegetated roof
Neighborslocal community bull More aesthetic natural
exterior appearance of building to neighbors and occupants
Society bull Reduced impact on microclimate bull Lower threat of negative ecological
impacts resulting from use of nonshynative plant species
Light pollution reduction Allow no direct-beam illumination to leave building site Use light-colored or reflective edges along driveways and walks to reduce dependence on high-wattage electrical lighting at night Use solar lights Use security lighting with motion sensors to reduce use of lights at night
Facility bull Possibly lower cost of electricity for
lighting (depending on design)
Neighborslocal community bull Less disturbance to natural
night sky conditions bull Improved security of
building
Society bull Preservation of nocturnal habitat
A-3
Sustainable Design Feature
Benefits Category
Economic Social Environmental
Water Efficiency
Water use reduction Use captured rainwater for landscaping toilet flushing etc Treat and re-use graywater excess groundwater and steam condensate Use low-flow fixtures and fittings (pressureshyassisted or composting toilets waterless urinals etc) and ozonation for laundry Use closed-loop systems and other water reduction technologies for processes
Facility bull Decreased water costs bull Potential for OampM savings Local government bull Less wastewater treatment
infrastructure needed (fewer taxes to pay for infrastructure)
Society bull Preservation of natural
water resources for future generations
Society bull Reduced use of potable water bull Reduced generation of wastewater
lower discharge to natural waterways
Energy Efficiency
Space layout Fully utilize opportunities Facility Employees Society for passive solar heatingcooling Optishy bull Diminished heating cooling and bull Improved quality of interior bull Lower electricity use fossil fuel use mize natural ventilation and daylighting lighting loads and reduced energy space (a secondary benefit and air pollutioncarbon dioxide Enhance penetration of daylight to interior costs of many energy-efficient (CO2) emissions and other spaces Provide inviting staircases to bull Increased operating efficiency due design features) environmental impacts of electricity encourage their use rather than elevators to right sizing of equipment
bull Possibly lower capital costs due to reduced sizecost of mechanical systems through more efficient design features appropriate sizing and optimal integration
bull Potentially higher occupant productivity due to daylighting
Societyutility companies bull Avoidance of electricity generation
and transmissiondistribution construction costs
production and fossil fuel use bull Decreased impacts of fuel production
and distribution (for fuels used in the building or in production of electricity for the building)
A-4
Sustainable Design Feature
Benefits Category
Economic Social Environmental
Building envelope Design envelope to provide good thermal and moisture control while supporting passive solar and natural ventilation design strategies Detail walls to provide best vapor barriers and low outside air infiltration
Facility bull Diminished heating cooling and
lighting loads and reduced energy costs
bull Increased operating efficiency due to right sizing of equipment
bull Possibly lower capital costs due to reduced sizecost of mechanical systems through more efficient design features appropriate sizing and optimal integration
Societyutility companies Avoidance of electricity generation and transmissiondistribution construction costs
Employees bull Improved quality of interior
space (a secondary benefit of many energy-efficient design features)
Society bull Lower electricity use fossil fuel use
and air pollutioncarbon dioxide (CO2) emissions and other environmental impacts of electricity production and fossil fuel use
bull Decreased impacts of fuel production and distribution (for fuels used in the building or in production of electricity for the building)
Lighting and sun control Use glazing to supply daylighting but control glare Use roof monitors and high clerestory windows Specify photocell-dimming sensors to adjust light Use separate switches to turn off lights in individual areas Use light shelves and other technishyques to bring light deeper into the buildshying Supplement daylighting with high-performance lighting that improves visual quality while reducing electrical use Use low-ambient lighting levels with task lights where appropriate Use occupancy sensors dimmers photocells and lumen maintenance controls
Facility bull Reduced electricity consumption
costs bull Lower cooling loads due to lower
heat gains from electrical lighting hence reduced energy costs and lower capital costs for cooling system
bull Potentially higher occupant productivity due to daylighting and visual quality
Societyutility companies bull Avoidance of electricity generation
and transmission distribution construction costs
Employees bull Improved quality of interior
space
Society bull Lower electricity use and the
associated air pollutionCO2 emissions bull Decreased impacts of fossil fuel
production and distribution
A-5
Sustainable Design Feature
Benefits Category
Economic Social Environmental
Systems and equipment Optimize mechanical systems to work with the building layout orientation envelope etc Consider HVAC zoning distribution systems heat recovery systems modular boilers and ice storage Do not use chlorofluorocarbonhydrofluorocarbon (CFCHCFC) refrigerants Develop inteshygrated systems designs that consider interaction of systems with overall building layout envelope etc Include efficient power distribution systems electrical equipment motors transformers etc Consider use of raised floor and underfloor HVAC with personal controls
Facility bull Reduced energy costs bull Reduced capital costs due to
downsizing of equipment bull Lower churn costs (if raised floor is
used) bull Better productivity (if personal
controls are implemented)
Employees bull Improved occupant comfort
Society bull Lower electricity use and the
associated air pollutionCO2 emissions bull Decreased impacts of fossil fuel
production and distribution bull Protection of the ozone layer (due to
avoidance of CFCsHCFCs)
Renewable energy Consider using photovoltaic solar heat and hot water geothermal heat pumps etc Consider entering into green power or renewable credit contracts
Facility bull Lower annual energy costs Local economy bull Potential for emerging businesses
related to renewable energy
Society bull Promotion of market for
renewable energy products
Society bull Lower electricity use and the
associated air pollutionCO2 emissions bull Decreased impacts of fossil fuel
production and distribution
Energy load management Use energy Facility Employees Society management systems monitoring and bull Operational savings (can offset bull Improved comfort health bull Improved energy efficiency hence controls to continuously calibrate adjust higher first costs) and safety lower electricity and fossil fuel use and maintain energy-related systems bull Reduced capital cost of mechanical
systems because control systems reduce the need for oversizing
and lower emissions Employees bull Better indoor air quality
A-6
Sustainable Design Feature
Benefits Category
Economic Social Environmental
Sustainable Materials and Resources
Storagecollection of recyclables Provide a system for collecting and storing materials such as paper glass plastic and metals for recycling
Facility bull Possibly lower waste disposal costs Local community bull Local recycling business
opportunities Local government bull Lower landfill construction costs
Employees bull Opportunity for building
occupants to feel they are making a difference which can be an opening for other actions
Society bull Expanded market for
recycled and environmentally preferable products
Society bull Reduced strain on landfills bull Reduced use of virgin natural
resources
Building and resource re-use Reuse building shell from existing buildings and fixtures from demolished buildings Use salvagedrefurbished materials
Facility bull Decreased first costs due to re-use
of materials Local government bull Less waste disposal lower need for
new waste disposal facilities
Society bull Expanded market for
salvaged materials
Society bull Reduced strain on landfills bull Reduced use of virgin natural
resources
Construction waste management Facility Society Society Recycle or productively use construction bull Possible decrease in construction bull Expanded market for bull Reduced strain on landfills demolition and land clearing wastes first costs due to lower waste recycled and bull Reduced use of virgin natural Divert these wastes from landfill disposal disposal costs environmentally preferable
products resources
Recycled content Select environmentshyally preferable materials that include recycled materials (use standards developed by government agencies or other reliable sources)
Facility bull Possible decrease in first costs of
construction due to lower price of recycled materials (in some cases)
Society bull Expanded market for
recycled and environmentally preferable products
Society bull Reduced strain on landfills bull Reduced use of virgin natural
resources
A-7
Sustainable Design Feature
Benefits Category
Economic Social Environmental
Waste prevention Use modular materials Select products for durability Eliminate unnecessary finishes and other products
Facility bull Possible decrease in first costs of
construction due to less use of materials
bull Longer lifetime of building and building features due to increased durability of materials used
bull Decreased operating costs (including replacement and waste disposal costs) by using more durable materials that need to be replaced less often
Society bull Less nuisance associated
with landfills
Society bull Reduced strain on landfills bull Reduced use of virgin natural
resources
Localregional materials Obtain materials whenever possible from local resources and manufacturers
Local economy bull Success of local businesses
Local economy bull Employment opportunities
Society bull Lower energy consumption and
resulting air pollutant air emissions due to less freight transportation
Rapidly renewable materials (bamboo cork wheat straw boards etc) certified wood
Facility bull Possible reduction of first costs Society bull Emerging businesses
Society bull Preservation of forests for
future generations
Society bull Reduced usedepletion of long-cycle
renewable materials better forest management biodiversity
Design for re-use Design buildings for flexible uses so they can be reconfigured in the future as needs change
Facility bull Lower lifecycle capital construction
requirements bull Lower churn costs
Society bull Less disturbance due to new
construction
Society bull Lower resource consumption (on a
lifecycle basis)
A-8
Sustainable Design Feature
Benefits Category
Economic Social Environmental
Indoor Environmental Quality
Indoor air quality Control pollutant sources (from neighboring buildings soil such as radon and methane and excessive dampness) Use low-emission materials (paint carpet fabrics) Allow new materishyals to ventilate before occupancy Include good ventilation systems and operable windows where appropriate Specify systems that feature economizer cycles Consider underfloor air ducting Use CO2
sensors Use control systems including personal workstation control if possible Eliminate tobacco smoke
Facility bull Organizational productivity
improvements (reduced absenteeism)
bull Lower workmanrsquos compensation disability health and liability insurance costs
bull Reduced threat of litigation Employees bull Lower health care costs to
occupants
Employees bull Reduced adverse health imshy
pacts (especially respiratory diseasediscomfort)
bull Improved personal productivity
Employees bull Better air quality inside the facility Society bull Reduced volatile organic compound
emissions to the atmosphere due to use of low-emission materials
Good visual quality Appropriately use windows skylights shading devices and light shelves Avoid glare Combine ambishyent and task lighting Use high-frequency ballasts Give occupants adequate visual access to outdoors and to the organization of the building Use pleasing surface colors and reflectivity
Facility bull Reduced energy costs (by using
daylighting)
Employees bull Satisfaction with work
environment bull Improved personal
productivity
Society bull Lower energy use and emissions due
to use of daylighting and energy efficient lighting
Noise control Reduce noise at the source during design phase (eg through orientation building layout selection of mechanical plumbing and ductwork) Use acoustic buffers floating floor slabs and sound-insulated wall floor and ceiling penetrations Achieve good room acoustics by configuring rooms using white noise etc
Facility bull Lower cost of dealing with
complaints
Employees bull Satisfaction with work
environment bull Improved personal
productivity
Systems controls Provide maintenance staff and users with level of control over automated building systems appropriate to their level of technical expertise Provide individual occupant controls when possishyble (in conjunction with underfloor systems)
Facility bull Possible decrease in operational
costs bull Decreased churn costs due to
underfloor systems
Employees bull Thermal and visual comfort
of occupants bull Improved personal
productivity
Society bull Decreased energy use and resulting
environmental impacts due to better control of energy systems
A-9
Sustainable Design Feature
Benefits Category
Economic Social Environmental
Commissioning and OampM
Commissioning and OampM Use third- Facility Employees Society party assessments to ensure that the bull Fewer equipment breakdowns and bull Occupant satisfaction with bull Lower energy consumption and air installed systems work as designed downtime costs building pollutant emissions Develop OampM manuals and train staff bull Lower lifecycle replacement costs
bull Reduced costs of dealing with occupant complaints
bull Healthsafety of building occupants
Employees bull Better indoor air quality
Sustainable housekeeping and maintenance Clean and maintain all building equipment to ensure proper functioning Check for water leaks and make repairs Check for signs of mildew and mold growth Use nontoxic natural cleaningmaintenance chemicals Periodically or continuously monitor indoor air quality
Facility bull Possibly lower operating expenses
(eg reduced water consumption) bull Less chance of sick building
syndrome and associated legal costs
Employees bull Improved indoor environshy
mental quality bull Better health of occupants
Society bull Reduced chemical influx into the
environment (by using natural cleaning products)
bull Lower water use (due to leak monitoring)
A-10
Appendix B Energy and Construction Cost Estimates1
This appendix describes the energy modeling used in the analysis presented in Section 22 of this document The analysis showed that the combination of energy-savings features added to the prototype building had a savings-to-investment ratio of nearly 15 and an adjusted internal rate of return of almost 5 which makes a compelling business case for sustainability
Figure B-1 illustrates the main steps of the modeling process As the figure shows the modeling effort began with a characterization of a base-case building This building intended to represent a typical new Federal office building was the basis against which the sustainable building was compared The base-case buildings energy use was then estimated using a building energy simulation model DOE-21E The base-case characterization and model assumptions are documented in Section B1 of this appendix
The sustainable building was defined in terms of a number of improvements made to the base-case building A set of potential improvements was developed and simulated in another energy simulation model ENERGY-10 which optimized for energy and lifecycle cost savings This simulation provided information that allowed a final set of improvement options to be selected based on maximum energy and lifecycle cost savings These options defined the sustainable building This process is described in Section B2 of this appendix
The sustainable building was then simulated in DOE-21E to obtain energy-use estimates These were compared with the energy-use estimates of the base-case building and estimated energy savings and the associated incremental costs were calculated The simulation of the sustainable building is described in Section B3 and the results of the energy-savings and cost calculations are described in Section B4 Section B5 explains some of the differences between DOE-21E and ENERGY-10
Base-Case Building Characterization
Energy Design Standard
The study used the American Society of Heating Refrigerating and Air Conditioning Engineering (ASHRAE) standard 901-1999 as the energy design standard or code for the base-case building and ASHRAE 901-1999 Table A-13 to implement the base-case building envelope parameters The HVAC equipment in the base case was modeled at the minimum efficiency levels according to ASHRAE 901-1999 Tables 621B and 621E The supply fan energy was modeled separately by breaking down the energy-efficiency ratio (EER) and coefficient of performance (COP) into its components For some building characteristics not specified in ASHRAE 901 such as the building operation schedules and HVAC system types assumptions were made based on data from several sources including the Commercial Buildings Energy Consumption Survey (Energy Information Administration 1995) the Proposed Appendix G to ASHRAE 901-2001 and general engineering practices
Construction Cost Estimating for the Base-Case Building Design
The purpose of the construction cost estimate for the overall base-case building was to set a reasonable order-of-magnitude cost for use in the lifecycle cost calculations The estimating method was parametric ndash
1 This appendix was written by D Winiarski S Shankle J Hail and B Liu Pacific Northwest National Laboratory and A Walker National Renewable Energy Laboratory
B-1
B-2
Simulation of Baseline Building Energy Use
Selection of Sustainable Design Features
Baseline DOE-21 Baseline Building DOE-21 Energy Use
Characterization Simulation
Selected Sustainable Design Options Energy-10 Sustainable Design
Features
Simulation of Sustainable Sustainable Design DOE-21 Sustainable
DOE-21Design Building Building Design Energy Use
Characterization Simulation Energy Use
Calculation Energy Savings Energy of Energy and Savings Metrics Cost Savings Calculation
Figure B-1 Energy Simulation Flow Diagram
using simple inputs such as the square feet of the building and subareas and the generic type of structural system The parametric tool was the Commercial Construction Knowledgebase module within Timberline Precision Estimating ndash Extended Edition Version 622 Timberline uses RS Means cost data and adjusts costs to Baltimore Maryland The Timberline parametric modules allow some specific inputs for a building such as specifying gas or electric heat This study specified some of those inputs to approximate the natural gas heating for the base-case building but otherwise relied on the modules assumptions
Building Occupancy Type and Size
The study focused on an office-building model According to the US General Services Administration (GSA) offices are the second largest square-footage category (after housing) and the largest building cost category The study selected a building size of 20000 ft2 because the average size of the office buildings in GSAs inventory is 20979 ft2
Building Location
The study selected Baltimore Maryland as the location for the DOE-21e and construction cost estimating because it represented a large city with a substantial Federal construction market and a moderate East Coast climate Because one purpose of this study is to help guide new Federal construction projects the study reviewed FY 2002 capital appropriations and found that roughly two-thirds of the appropriations were slated for states in the southern half of the continental United States The appropriations for California appeared to be the highest of any individual state However when grouping states into informal regional climate zones the states in the moderate eastern climate zone had significantly more appropriations than California The selection of an appropriate average climate was also based on Pacific Northwest National Laboratorys (PNNLs) experience gained through developing ASHRAE 901-1999 and Federal Energy Code (10 CFR 434) standards
Energy Rates
The study used energy cost rates for Baltimore Maryland as shown in Table B-1 The rates were developed from the local utility Baltimore Gas and Electric Company (BGE) Baltimore is a deregulated utility market and BGEs rate structure has many options to select from despite a few frozen tariffs Apparently GSA has a contract with BGE with very different schedules ndash see httphydragsagovpbsxuareawideswordbgemoddoc For simplicity this study developed an average or blended rate based on the information provided through BGEs website (the current link is httpwwwbgecomcmpCDAsection0166860300html) This study used $0077 per kilowatt-hour (kWh) and $0692 per therm based on review of BGE rate schedules
Table B-1 Energy Rates for the Base-Case Building
Energy Type Rate
Natural gas ($therm) $0692
Electricity ($kWh) $0077
2 httpwwwtimberlinecomproductsestimatingcommercial_construction_knowledgebasehtm
B-3
Derivation of Blended Electricity Rate
Commercial buildings such as the one used in the studys base-case building are likely to be on a general service or a small general service rate schedule Neither schedule is a typical demand schedule The general service schedule has two complex options for the energy demand charge averaging summer and non-summer costs The small general service schedule does not have a standard demand rate but uses peak and offpeak rates The base simple general service schedule option would be as follows
Base rate $1150month Energy charge
October through May $003749kWh June through Sept $005383kWh
Transmission charge $000298kWh Delivery service charge $002250kWh Competitive transmission charge $000576kWh
The above rates can be simplified to the following schedule for the studys base-case building
Base rate $1150month Energy charge
October through May $006873kWh June through Sept $008507kWh
Derivation of Blended Gas Rate
The general service gas schedules are located at httpwwwbgecomCDAFilesBsch_cdoc however this schedule appears to cover delivery cost but not the energy cost
Customer charge $2700 month Delivery price
First 10000 therms $01724therm All remaining therms $00936therm
BGE also charges separately for automateddaily metering A complete rate was obtained by BGE customer service who reported that costs varied between the three major suppliers in the area and from year to year However the average costs based on the last two years available are shown in Table B-2
Table B-2 Average BGE Rate (based on the last two years)
Month $Therm Month $Therm
January $0570 July $0502
February $0597 August $0458
March $0504 September $0461
April $0517 October $0498
May $0495 November $0476
June $0500 December $0562
B-4
Base-Case Building Design Assumptions
Table B-3 summarizes the key input assumptions used for the base-case building design in the DOEshy21E models
Table B-3 Base-Case Assumptions Used in the DOE-21E Models
Characteristic Base-Case Assumptions
General
Building type Office
Location Baltimore Maryland
Gross area 20164 ft2
Operating hours 8am - 5pm Monday-Friday
Utility rates
Electric energy rate Base rate $1150month
Energy charge $0077kWh
Natural gas price ($therm) Base rate $270month
Energy charge $0692therm
Architectural features
Configurationshape
Aspect ratio 21
Perimeter zone depth 15 ft
Number of floors 2
Window area 20 window-to-wall ratio
Floor-to-ceiling height 9 ft
Floor-to-floor height 13 ft
Exterior walls
Wall type 4 Face brick faccedilade on 16 on-center metal framing
Opaque wall U-value 0124
Wall insulation R-13 cavity insulation
Roof
Roof type Builtup roofing with concrete deck
Solar absorptance 07 (medium dark)
Roof U-value 0063 Btuhr-ft2-oF
Roof insulation R-15 continuous insulation
Floor structure
Floor type Concrete
Floor insulation R-54 perimeter insulation
Fenestrationwindows
Window type Aluminum frames with thermal beaks and double panes
Total U-value 057 Btuhr-ft2-oF
Shading coefficient 045
B-5
Characteristic Base-Case Assumptions
Visual transmittance 052
Window shadingoverhangs None
Building internal loads
Occupancy
Number of occupants 96
Occupancy schedule 8am - 5pm Monday-Friday
Lighting
Fixture type T-8 with electronic ballasts
Peak lighting power density 138 wattsft2 (net building wattage from ASHRAEs space by space analysis)
Lighting schedule 7am - 6pm Monday-Friday
Occupancy sensors None
Daylighting None
Office equipment
Equipment schedule 7am - 6pm Monday-Friday
Peak load density 072 watts ft2
HVAC system
HVAC system type Package rooftop unit constant-air-volume with gas furnace
Number of HVAC units Five units to serve five HVAC thermal zones
Space temperature setpoint 75ordmF coling70ordmF heating
Space setbacksetup 80ordmF cooling65ordmF heating
Cooling equipment efficiency 101 EER
Outside air supply 20 cubic feetminute (cfm) per person 17 of supply air cfm
Heating furnace efficiency 80
Ventilation control mode Constant during occupied periods cycle during unoccupied periods
Economizer None
Design supply air Minimum 05 cfmft2
Air-to-air energy recovery ventilation
None
Fan total static pressure 20 in total 10 in related to ductwork system
Fan schedule 6am - 6pm Monday-Friday with night cycle onoff
Fan motor efficiency 85
Fan efficiency 65
Servicedomesticpotable water heating
Hot water fuel type Natural gas
Thermal efficiency 80
Supply temperature 120
Hot water consumption 09 gallons per dayperson
Exceeds ASHRAE 901-1999
B-6
Selection of Sustainable Design Features
The National Renewable Energy Laboratory (NREL) performed a screening analysis of potential sustainable design options using ENERGY-10 a PC-based software design tool developed by NREL The rationale for using ENERGY-10 in this study is that with the new lifecycle costing capabilities of Version 16 it is quick and easy to search possible solutions and narrow the optimal combination of measures for further analysis with the more detailed DOE-21E model (see section B5 for a brief discussion of the differences between ENERGY-10 and DOE 21E) ENERGY-10 was used to initially assess and optimize a number of design options
bull Changes in the installed lighting power density bull Addition of daylighting controls bull Changes in building aspect ratio bull Skylighting in the building core bull Changes in fenestration area by orientation for daylighting passive solar heating and cooling
load avoidance bull Changes in building insulation levels
The NREL screening analysis documented in this section was used to characterize a suite of measures that maximizes energy savings and reduces the lifecycle cost of the sustainable building However many of the details of the implementation of the sustainable design options differ between their characterization in the NREL screening analysis and the final DOE-21E simulation This section documents the screening analysis while Section B4 documents the final sustainable building simulation
Aspect Ratio
One feature varied in the analysis was the aspect ratio3 of the building (see Figures B-2 and B-3) For a building of 20000 ft2 and two stories an aspect ratio of less than 6 requires a core zone whereas an aspect ratio from 6 to 12 could be a double-loaded corridor with no core zone For the base case a window-to-wall-area ratio of 020 was maintained for all four sides For the energy-efficient case (designated the EE case in the figures) the south window-to-wall-area ratio was as follows south 038 east 007 west 005 and north 011
Energy use was minimized by an aspect ratio of 15 for both the base and sustainable cases 4
However for the sustainable design the benefits of passive solar heating and daylighting compensated for the increased surface area and energy use increased only slightly with increasing aspect ratio However increasing aspect ratio increased first costs substantially because of the additional materials to accommodate the increased surface area for both the base and sustainable design cases
3 The ratio of the longer side of the building to the shorter side 4 In DOE-21e aspect ratio was 20 in both the base and sustainable cases This may have resulted in a slightly higher energy use and capital cost than the ENERGY-10 simulation but differences were not deemed significant enough to warrant changing the model setup
B-7
0
500000
1000000
1500000
2000000
2500000
0 1 2 3 4 5 6 7 8 9 10 11
Aspect Ratio (SE)
Ann
ual E
nerg
y U
se (k
btu
year
)
BaseCase EE Case
Figure B-2 Annual Energy Use (kBtuyr) versus Aspect Ratio (southeast)
3800000 3850000 3900000 3950000 4000000 4050000 4100000 4150000 4200000 4250000
0 5 10 15
Aspect Ratio (SE)
Life
Cyc
le C
ost (
$)
Base Case EE Case
Figure B-3 Lifecycle Cost ($) versus Aspect Ratio (southeast)
Energy Conservation Measures
Eight energy conservation measures (ECMs) were selected to define the sustainable building daylighting improved windows improved lighting efficiency window shading improved insulation passive solar heating economizer cycle and high-efficiency equipment Each measure and its cost are briefly described below
ECM 1 ndash Daylighting
Ten lighting zones were set up one facing each direction (ie east south west and north) on each floor a core zone on the top floor with 12 skylights and a 4592 ft2 core zone on the first floor with no daylighting Continuous dimming controls maintain a 50-foot-candle lighting level The cost of this measure was $188 lighting zone for dimming sensor and controls and $075 ft2 of floor
B-8
space to cover the cost of upgrading to dimming ballasts Therefore the total cost of daylighting controls was $13371
Window dimensions were optimized and costed in the passive solar heating ECM (described below) including the effects of daylight savings The 4592-ft2 core zone on the second floor is daylit only by skylights The ratio of skylight area to zone roof area was varied from 002 to 008 and annual energy use was minimized by an area ratio of 006 The cost of skylights was estimated at $90ft2 which is significantly more expensive than wall windows Figures B-4 and B-5 show the annual energy use and lifecycle costs respectively as functions of skylight to zone roof area
ECM 2 ndash Improved Windows
Double-pane windows with U=067 Btuhr-ft2-oF were replaced with low-emissivity windows with U=031 Btuhr-ft2-oF the solar heat gain coefficient remains at 039 for both but the premium
Figure B-4 Annual Energy Use (kBtuyr) as a Function of Skylight to Zone Roof Area Ratio
Figure B-5 Lifecycle Cost ($) as a Function of Skylight-to-Zone-Roof-Area Ratio
B-9
glazing uses a selective surface with visible transmittance of 07 The cost of the premium glazing was $25 ($22 to $28ft2) for item 08810 3004000 in RS Means (2002) (super-efficient glazing triple-glazed with low-e glass argon filled U=026) The cost of standard glass was $2250 for item 4600400 in RS Means (2002) (316 float 58 thick unit U=056) for a $250ft2 difference or $122 ft2R-value Table B-4 lists the results of the glazing improvement
Table B-4 Results of Glazing Improvement
Base Case Premium Glazing
Window construction Buscase U=067 4060 low-e alb U=031etc
Window total gross area (ftsup2) 2208 2208
Windows (northeastsouthwestroof) 232323230 232323230
Glazing name Buscase U=056 Double low-e selective U=026
Energy use (kBtu) 904917 820385
Energy cost ($) 16058 15633
Construction costs 3146828 3149669
Lifecycle cost 3815530 3805379
ECM 3 ndash Improved Lighting Efficiency
The lighting power density was reduced from 138 to 10 Wft2 by architectural design of the lighting system and premium efficiency equipment The cost was estimated at $036ft2 or $7259
ECM 4 ndash Window Shading
Overhangs provide shade over the south-facing windows The cost was estimated at $1237ft of overhang projection per linear foot of shaded window Only windows facing east south and west were supplied with overhangs for a linear window length of 360 ft Overhang projection was varied in the model from 0 to 4 ft with a 3-ft projection minimizing annual energy use The cost of the 3shyft projection was $13359 Figures B-6 and B-7 show the annual energy use and lifecycle costs respectively as a function of overhang projection
ECM 5 ndash Improved Insulation
Six wall cross-sections were considered to achieve different R-values R-9 R-18 R-22 R-36 and R-50 and R-1000 (R-1000 was also considered just to provide a limiting case of the importance of insulation) While R-36 provides the lowest lifecycle cost it is only slightly lower than R-18 so Rshy18 was adopted Figure B-8 shows the net present value as a function of wall U-value (the inverse of the R-value)
The overall loss coefficient of the envelope was reduced from 3276 to 1556 Btuhr-oF at a total cost of $18868 (Upgrading to 6-in steel frame walls with polyisocyanurate insulation added $005unit R-valueft2 of wall area or $3943 for wall insulation adding foam insulation to reduce the slab perimeter F-value from 035 to 020 Btuhrft2-oF cost $5ft of perimeter or $8283 for foundation insulation improving roof insulation added $003unit R-valueft2 of roof area totaling $6505 for roof insulation and adding premium doors cost $137)
B-10
Figure B-6 Annual Energy Use (kBtuyr) as a Function of Overhang Projection (ft)
Figure B-7 Lifecycle Cost ($) as a Function of Overhang Projection (ft)
Figure B-8 Net Present Value (k$) as a Function of Wall U-Value
B-11
ECM 6 ndash Passive Solar Heating
The amount of glazing on the east west north and south walls was varied to minimize annual energy use The passive solar heating measure was implemented by changing from an even distribution of windows on all sides (20 window-to-wall-area ratio) to the following distribution
bull 015 on the north bull 010 on the east bull 010 on the west bull 030 on the south
The total window area in the walls decreased from 2208 ft2 to 2064 ft2 (not including the 12 skylights in the daylighting measure) The cost was $25ft2 of window area for a total cost savings of $3600 over the base case Figures B-9 through B-16 show the annual energy use and lifecycle costs as a function of the window-to-wall-area ratios for east west south and north windows respectively
Figure B-9 Annual Energy Use (kBtu) as a Function of East Window-to-Wall-Area Ratio
Figure B-10 Annual Energy Use (kBtu) as a Function of West Window-to-Wall-Area Ratio
B-12
Figure B-11 Annual Energy Use (kBtu) as a Function of South Window-to-Wall-Area Ratio
Figure B-12 Annual Energy Use (kBtu) as a Function of North Window-to-Wall-Area Ratio
Figure B-13 Lifecycle Cost ($) as a Function of East Window-to-Wall-Area Ratio
B-13
Figure B-14 Lifecycle Cost ($) as a Function of West Window-to-Wall-Area Ratio
Figure B-15 Lifecycle Cost ($) as a Function of South Window-to-Wall-Area Ratio
Figure B-16 Lifecycle Cost ($) as a Function of North Window-to-Wall-Area Ratio
B-14
ECM 7 ndash Economizer Cycle
An economizer was added with a fixed dry bulb temperature of 60degF The cost was $025ft2 of floor area for a total cost of $5041
ECM 8 ndash High-Efficiency Equipment
HVAC efficiency was improved by using larger ducts and more efficient equipment Heating efficiency was raised from 80 to 90 at a cost of $100unit of heating capacity in kBtuhr per unit increase in efficiency Cooling efficiency was raised from an EER of 101 to 130 at a cost of $500unit of cooling capacity in kBtuhr per unit of improvement in EER The total cost of the mechanical equipment upgrades was therefore estimated to be $7006
Simulation of the Energy Use of the Sustainable Building
The sustainable building was characterized by incorporating the information developed in the NREL screening analysis with the base-case building characterization Figure B-17 lists the features incorporated in the sustainable building and Table B-5 shows the sustainable building characterization
The study developed construction and replacement cost estimates for the evaluated building energy features from several sources including vendors and facility engineering staff (through personal communication) vendor websites RS Means construction cost estimating books and case studies and reports Table B-6 summarizes the estimates and sources The estimates are shown as the net incremental cost change (increase or decrease) to the base-case construction cost
Results of the Energy Simulations
Energy Use and Energy Cost Estimates
Tables B-7 and B-8 show the energy use and energy cost by end use for both the base-case and the sustainable buildings The tables show energy use and cost with and without plug loads Although the model estimated energy consumption for plug loads and other miscellaneous office equipment these were not included in the analysis of the percent energy reductions that could be achieved using various energy efficiency technologies This is consistent with the practice within the Leadership in Energy and Environmental Design (LEEDtrade) Rating System
Lifecycle Cost Calculations
This study estimated the lifecycle cost or present value of the initial construction costs the outyear replacement costs and the annual energy costs over 25 years Most replacement costs were based on the service life values in Table 273 in Marshall and Petersen (1995) This study did not evaluate the costs of annual recurring maintenance the cost of nonrecurring or irregular repairs and maintenance or the cost impacts on the environment and occupants productivity
The lifecycle cost tool was an Excel spreadsheet workbook titled User-Friendly Building Life-Cycle Cost Analysis (MS Addison and Associates 2002) The developers say the workbook is compliant with National Institute of Standards and Technology Handbook lifecycle costing procedures and
B-15
offer the workbook free of charge at httpwwwdoe2com The study used the following key inputs for the lifecycle cost workbook
bull DOEFEMP fiscal year 2002 bull Real discount rate for this analysis 32 bull Number of analysis years 25 bull DOE fuel price escalation region 3 (south) bull Analysis sector 2 (commercial)
Table B-9 shows the lifecycle cost calculations for the base-case and the sustainable buildings
Lighting Measures bull Increased daylighting Skylights were added increasing daylight to the top floor bull Reduced lighting intensity Lighting power densities recommended by the Illuminating Engineering
Society of North America and ASHRAE as a proposed addenda to the 901 standard were adopted The lighting level was reduced from 40 to 35 footcandles in the office area with some increase in task lighting
bull Perimeter daylighting controls with dimmers Daylight sensors (six per floor) control stepped ballast controls so that electric lighting is dimmed when sufficient daylight exists In the base case no dimming of electric lighting occurs
Envelope Measures bull Window distribution The square footage of the windows was redistributed to optimize solar gain with
heating and cooling costs The optimized window-to-wall ratio is 15 window for the north wall 10 window for the east and west walls and 30 window for the south wall The base-case ratio is 20 for all walls
bull Additional wall insulation On the outside face of the exterior wall framing R-10 rigid insulation was added compared with only R-13 batt insulation in the base-case walls The resulting insulation in the sustainable building was R-23
bull Additional roof insulation The R-15 rigid insulation was increased to R-20 bull White roof A white roof finish material with low solar radiation absorptance of 030 was used
compared with the base cases absorptance of 070 bull Highly energy-efficient windows The sustainable option balances window performance with the low
lighting levels and the use of daylighting controls The result is a cost-optimized window with a U-factor of 031 and a shading coefficient of 039
Mechanical Systems bull High-efficiency air conditioner The air conditioning unit has an energy-efficiency ratio of 13
compared with 10 for the base case bull High-efficiency water heater A 90 thermal efficiency condensing water heater was used compared
with a commercial gas water heater with 80 thermal efficiency for the base case bull Low-pressure ducts The fan external static pressure was reduced from 10 inch water column to 05
inch water column by enlarging the duct sizes bull Economizers An integrated economizer including an outside air enthalpy sensor with a high-limit
enthalpy setpoint was used the setpoint was set at 25 Btulb in conjunction with a dry bulb temperature high limit of 74degF
Figure B-17 Features Included in the Sustainable Building
B-16
Table B-5 Characterization of Sustainable Building (includes base-case building comparison)
B-17
Characteristic ASHRAE 901-1999 Base Case Sustainable Building
General
Building type Office Same as in base case
Location Baltimore Maryland Same as in base case
Gross area 20164 Ft2 Same as in base case
Operation hours 8am - 5pm Monday-Friday Same as in base case
Utility Rates
Electric energy rate Base rate $1150month Same as in base case
Energy charge $0077kWh Same as in base case
Natural gas price ($therm) Base rate $270month Same as in base case
Energy charge $0692therm Same as in base case
Architectural features
Configurationshape
Aspect ratio 21 Same as in base case
Perimeter zone depth 15 ft Same as in base case
Number of floors 2 Same as in base case
Window area 20 window-to-wall ratio Redistribute windows to optimize solar gain north 15 south 30 and east and west 10 Net overall 18
Floor-to-ceiling height 9 ft Same as in base case
Floor-to-floor height 13 ft Same as in base case
Exterior walls
Wall type 4-in face brick faccedilade on 16-in on-center metal framing
See next item
Opaque wall U-value 0124 0055
Wall insulation R-13 cavity insulation Add R-10 rigid foam insulation under brick faccedilade
Roof
Roof type Builtup roofing with concrete deck See next item
Solar absorptance 07 (medium dark) 03 (white roof)
Characteristic ASHRAE 901-1999 Base Case Sustainable Building
Roof U-value 0063 0048
Roof insulation R-15 continuous insulation R-20 continuous insulation
Floor structure
Floor type Concrete Same as in base case
Floor insulation R-54 perimeter insulation Same as in base case
Fenestrationwindows
Window type Aluminum frames with thermal breaks and double panes
See next item
Total U-value 057 031
Shading coefficient 045 039
Visual transmittance 052 070
Window shadingoverhangs None Overhang was considered but not included because overhangs made little impact on energy efficiency and the construction cost was substantial
Building internal loads
Occupancy
Number of occupancy 96 Same as in base case
Occupancy schedule 8am - 5pm Monday-Friday Same as in base case
Lighting
Fixture type T-8 with electronic ballasts Same as in base case
Peak lighting power density 138 wattsft2 (net building wattage from ASHRAEs space by space analysis)
10 wattsft2 The density was recommended by the Illuminating Engineering Society of North America and ASHRAE as a proposed addenda to ASHRAEs 901 standard For this building the level was reduced from 40 to 35 foot candles in the office area
Lighting schedule 7am ndash 6pm Monday-Friday Same as in base case
Occupancy sensors None Same as in base case
Daylighting None Light sensors and dimmable fixtures the perimeter zones (15 feet in from the window walls) Skylights in second floor core with light sensors and dimmable fixtures
Office equipment
B-18
Characteristic ASHRAE 901-1999 Base Case Sustainable Building
Equipment schedule 7am ndash 6pm Monday-Friday Same as in base case
Peak load density 072 wattsft2 Same as in base case
HVAC system
HVAC system type Package rooftop constant air volume with gas furnace
Same as in base case
Number of HVAC units Five units to serve five HVAC thermal zones Same as in base case
Space temperature setpoint 75degF cooling70degF heating Same as in base case
Space setbacksetup 80degF cooling65degF heating Same as in base case
Cooling equipment efficiency 101 EER 130 EER
Outside air supply 20 cfmperson 17 of supply air cfm Same as in base case
Heating furnace efficiency 80 Same as in base case
Ventilation control mode Constant during occupied periods cycle during unoccupied periods
See next item
Economizer None Economizer in each rooftop unit with outside air enthalpyshybased controls
Design supply air Minimum 05 cfmft2 Same as in base case
Air-to-air energy recovery ventilation None Same as in base case
Fan total static pressure 20 in total 10 in related to ductwork system Increase duct size to reduced static pressure to 15 inches total (05 inches related to ductwork system)
Fan schedule 6am - 6pm Monday-Friday with night cycle onoff
Same as in base case
Fan motor efficiency 85 Same as in base case
Fan efficiency 65 Same as in base case
Servicedomesticpotable water heating
Hot water fuel type Natural gas Same as in base case
Thermal efficiency 80 90
Supply temperature 120 Same as in base case
Hot water consumption 09 gallons per minuteperson Same as in base case
Exceeds ASHRAE 901-1999
B-19
Table B-6 Costs of Technology Options and Data Sources
B-20
Alternate Feature or Technology Option
Construction Cost Impact on
Base Case Basis and Source of Cost Service Life of Alternate
Lighting
Reduce lighting power density ndash Level 1 wattsft2 to 10 wattsft2 (from 40 to 35 foot candles)
Reduce from 138 -$16970 Based on the wattsft2 (10 watt) and the costft2 ($232) needed to
meet the current Illuminating Engineering Society of North America handbooks lighting levels for the space types in the office building design (office lobby corridorsupport areas and kitchen) with T-8 fixtures electronic ballasts and compact fluorescent lamps) fixture choices remain the same as in ASHRAEs 901-1999 baseline
The
25 yr assumes light replacement costs are the same even though lower light levels reduce the number of fixtures and lamps that need to be replaced ndash and therefore reduces costs ndash over the life of the building
Add perimeter daylighting with dimming control
$11246 Based on $088ft2 for daylighting controls and fully dimming ballasts for all office space in a 15-ft depth from the building perimeter on both floors of the building The range of cost per ft2
was $023ft2 to $188ft2 ne daylight sensorcontroller was assumed per 600 ft2 of perimeter floor space or fully dimming ballasts were based on available costs in the Industrial Supply Lighting Catalog (WW Grainger 2000) with installation based on 2001 Means Electrical Cost Data
O Cost data f
Controller cost data
15 yr
Add skylights and daylighting $18219 18 skylights fixed double-glazed 44 in x 46 in $550 each (RS Controls yr15 controls to center core of building Means BCCD 08600-100-0130) effectively $3913ft2 Eighteen light
wells built up from suspended ceiling t-bar components controls and fixtures at $115ft2 of skylit core floor space $ft2 rate developed from manufacturers data indicating a range of $075 to $088ft2 plus 40 for labor
Dimmable Skylights yr25
Mechanical
Add high-efficiency air conditioning (increase EER from 10 to 13)
$5686 Base-case costs developed from distributors purchase cost data collected during analysis of unitary air conditioning equipment for DOEs EPAct standards program 2000-2002 ystem cost would then be $475ton of cooling and the alternate would be $510ton for an incremental cost of $40EERton to-contractor cost markup was assumed The sustainable design option (EER 13) was taken from DOEs Unitary Air Conditioner Technology Procurement website at httpwwwpnlgovuacproductsstm
Baseline s
A 25 distributorshy
25 yr for both the base case and sustainable building
Alternate Feature or Technology Option
Construction Cost Impact on
Base Case Basis and Source of Cost Service Life of Alternate
Add economizer with enthalpyshybased controls
$2700 Based on $540rooftop air-handling units (5 units total) based on materials from multiple manufacturers
15 yr assumes controls are the weak point
Enlarge duct sizes to reduce static air pressure at fans and therefore reduce fan and motor sizes
$7000 Based on ductwork at $1200ton for baseline pressure duct design (01 in H2O100-ft-length pressure drop) and $1400ton for a low-pressure design (005 in100-ft pressure drop) 120 lb of sheet metal per ton of air conditioning and $640lb for the duct plus insulation cost om RS Means Building Construction Cost Data
Assumes
Cost data fr
25 yr although the expected lifetime is 30 years the analysis has a 25-year time-frame so lifetimes past 25 years are not considered]
[Note
Envelope
Add 1-in (R-10) rigid foam board insulation behind brick faccedilade
$2946 Isocyanurate 4 x 8 sheets foil-faced both sides thick Rshy108
15-inshyRS Means 072-100-116-1650 $088
25 yr for both the base case and sustainable building
Decrease total U-value from 057 to 031 decrease shading coefficient from 045 to 039 and increase visual transmittance from 052 to 070
$5538 Cost of premium glazing is $25 ($22 to $28ft2) for item 08810 3004000 in RS Means (super-efficient glazing triple-glazed with low-e glass argon filled U=26) rd glass cost is $2250 for item 4600400 in RS Means (316 float 58 thick unit U=56) for a $250ft2 difference
Standa
25 yr for both the base case and sustainable building
Reallocate window distribution to optimize solar gains
-$3457 Based on $3724ft2 for windows and $1852 for wall Baseline window-to-wall ratio was 20 and the sustainable design case nets 18 increased $3418 Window cost decreased $6875 Wall cost
25 yr
Increase roof insulation from R-10 to R-20
$1916 Based on difference in Means construction costs between baseline of 3-in expanded polystyrene (R-1149 $082ft2) and 3-in polyisocyanurate (R-2174 $101ft2)
25 yr for both the base case and sustainable building
Replace roofing with a white roof system
$1553 Based on a 10 extra cost ($015ft2) for white over baseline roofing at $154ft2 Unit costs derived from RS Means Building Construction Cost Data (1999) line numbers 075-302 Manufacturers information indicates the additional cost may be higher possibly a multiple of 2
25 yr for both the base case and sustainable building
Other
Replace gas-fired service hot water heater (80 efficiency) with higher-efficiency unit (90 efficiency)
$1200 Based on review of cost information from multiple manufacturers vendors and web-based reports
25 yr for both the base case and sustainable building
B-21
Table B-7 Simulated Energy Use by End Use for the Base-Case and Sustainable Buildings
End Use Fuel Units Base-Case Building
Sustainable Building Change
Lighting Electricity kWh 79314 41518 -477
Space cooling Electricity kWh 23440 17082 -271
Space heat Natural gas Therms 2606 1854 -289
Other llA Million Btu 118 92 -224
Fans Electricity kWh 15207 10401 -316
Pumps and misc Electricity kWh 674 879 304
Hot water Natural gas Therms 642 534 -168
Total llA Million Btu 730 477 -346
Table B-8 Simulated Annual Energy Costs by End Use for the Base-Case and Sustainable Buildings
End Use Fuel Units Base-Case Building
Sustainable Building Change
Lighting ityElectric $Yr 6099 3193 -477
Space cooling Electricity $Yr 1803 1314 -271
Space heat Natural gas $Yr 1804 1284 -289
Other All $Yr 2128 1699 -201
Fans Electricity $Yr 1169 800 -316
Pumps and misc Electricity $Yr 52 68 304
Hot water Natural gas $Yr 445 370 -168
Base energy charges All $Yr 462 462 00
Total All $Yr 11834 7489 -367
B-22
-
Table B-9 Lifecycle Cost Calculations for the Base-Case and Sustainable Buildings
Difference Base-Case Sustainable (Sustainable
Units Building Building Base) Difference Comments
$ $2400000 $2437578 $37578 16
$ $2400000 $2449565 $49565 21 Present value investment cost differs from first cost in the sustainable building because of replacement costs for lighting controls and economizers which are assumed to have a 15shyyear life
$YrAnnual electricity cost $9123 $5374 ($3749) -411
$YrAnnual natural gas $2249cost $1653 ($595) -265
$YrAnnual fixed costs $462 $462 $0 00 Represents fixed energy connection charges
$YrTotal annual energy $11834cost $7489 ($4345) -367
Present value of energy costs
Present value (electricity cost) $ $151985 $89525 ($62461) -411
Present value (natural gas cost) $ $39022 $28690 ($10332) -265
Present value (fixed $ included Not Not included in Not Not Fixed charges not included in the lifecycle cost energy costs) in the lifecycle the lifecycle cost applicable applicable calculation Because they are not impacted by
cost the sustainable design options they have no impact on the cost-effectiveness calculations
Present value (total energy cost) $ $191007 $118214 ($72793) -381
Lifecycle cost $ $2591007 $2567780 ($23228) -09
Cost Element
Investment cost
Total first cost
Present value (investment cost)
Annual energy costs
B-23
ENERGY-10 and DOE-21E
While ENERGY-10 was designed for use with small buildings (ie 10000 ft2 or less in floor area) its ability to quickly assess the energy-use and lifecycle cost impact of design changes was used even with this studys larger 20000-ft2 building The same features that make ENERGY-10 quick and easy to use also limit its flexibility and the base-case building in DOE-21E and ENERGY-10 exhibited some differences in cooling load and fan power
The two models handle fundamental building characteristics in significantly different ways including the limited equipment choices in ENERGY-10 and the fact that ENERGY-10 only models one or two zones While a single zone may be appropriate for small buildings such as houses and small retail buildings larger buildings may have substantial variation in thermal loads across the building requiring some way to provide for individually served thermal zones In addition ENERGY-10rsquos feature to automatically set up daylighting zones places the daylight sensor in the center of the zone which in this case is close to a window and therefore overestimates daylighting savings
ENERGY-10 provides for a very simplified user entry using its autobuild procedure to create a very basic shoe box building model however the desire to match the prototype building led the team to specify a building description that closely matched the characteristics of the ASHRAE 901-1999 compliant base-case building modeled in DOE-21E
In developing the specific features of the base-case building in ENERGY-10 careful attention was paid to the fundamental building characteristics so that they would be the same in the base-case ENERGY-10 and DOE-21E models Less attention was focused on the final building energy use or EUI (kBtuft2yr) However there were limits to how well the fundamental descriptions for infiltration cooling equipment efficiency and the presence of a building return air plenum could be matched between the ENERGY-10 and the DOE-21E base-case buildings In the end the base-case building simulations in the DOE-21E and ENERGY-10 models resulted in the buildings having very similar overall site energy consumption (within 1 of each other) and very similar scheduled energy use (lighting and plug and hot water loads total within 2 of each other) However the ENERGY-10 base-case simulations showed higher cooling and fan energy consumption and lower heating energy use consumption than in the DOE-21E simulations This may be explained by the known differences in implementation discussed above the remaining difference may be attributable to the different underlying simulation engines Note that ENERGY-10 calculates very different estimates of cost effectiveness measures for the energy-efficiency options with an overall return on investment of 11 The differences remain an area of study
Table B-10 shows the ENERGY-10 description of the base-case building and of a low-energy version (ie sustainable design) of that base-case building The low-energy building was developed by selecting from among the potential sustainable design options
Table B-11 shows the results of the ENERGY-10 simulations of the base-case and sustainable buildings Table B-12 shows the estimated cost impacts of the sustainable design options from ENERGY-10 These cost estimates were used to generate the lifecycle cost analysis used in the screening effort but these are not the costs used in the final simulation of the sustainable building in DOE-21E See Section B4 for documentation of the final simulation of the sustainable building
B-24
Table B-10 Summary of Base-Case and Sustainable Buildings
Description Base-Case Building Sustainable building
Building characteristics
Weather file Baltimore Baltimore
Floor area (ftsup2) 20164 20164
Surface area (ftsup2) 31240 31240
Volume (ftsup3) 262132 262132
Total conduction loss coefficient (Btuhr-ordmF) 3276 1556
Average U-value (Btuhr-ft2-oF) 0105 0050
Wall construction Buscase 6 R=89 Steelstud 6 poly R=181
Roof construction Buscase R=159 Flat R=380
Floor type insulation Slab on grade Reff=676 Slab on grade Reff=1183
Window construction Buscase U=067 Btuhr-ft2-oF
4060 low-E aluminumthermobreak U=031 Btuhr-ft2-oF
Window shading None 3 ft overhangs on east south and west windows
Wall total gross area (ftsup2) 11076 11076
Roof total gross area (ftsup2) 10082 10082
Ground total gross area (ftsup2) 10082 10082
Window total gross area (ftsup2) 2208 2280
Windows (northeastsouthwestroof) 232323230 23746712
Glazing name Buscase U=056 Double low-E U=026
Operating parameters
HVAC System Direct expansion cooling with gas furnace
Direct expansion cooling with gas furnace
Rated output (heatsensible cooltotal cool) (kBtuh) 288315420 206256341
Rated air flowminimum outside air (cfm) 125971585 95271585
Heating thermostat 700degF set back to 650degF 700degF set back to 650degF
Cooling thermostat 750degF set up to 800degF 750degF set up to 800degF
Heatcool performance Efficiency=80 EER=101 Efficiency=90 EER=130
Economizertype Nonot applicable Yesfixed dry bulb 600degF
Duct leaksconduction losses (total ) 20 20
Peak gains internal lights external lights hot water other wattftsup2 138000020072 103000020072
Added mass None None
Daylighting No Yes continuous dimming
Infiltration (insup2) Air changes per hour (ACH)=01 ACH=01
B-25
Table B-11 Annual Energy Use Cost and Emissions from ENERGY-10
Base-Case Building Sustainable Building
Simulation dates Jan 1 to Dec 31 Jan 1 to Dec 31
Energy use (kBtu) 904917 495861
Energy cost ($) 16058 9208
Saved by daylighting (kWh) minus 25011
Total electric (kWh) 183542 108238
Internal lights (kWh) 78793 33793
Coolingfan (kWh) 3524217106 190662977
Other (kWh) 52402 52402
Peak electric (kW) 838 506
Fuel (hot waterheattotal) (kBtu) 62791215826278617 6279163730126520
Emissions (CO2SO2NOx) (lb) 2795851481789 160414869460
Construction costs 3146828 3195257
Lifecycle cost 3815530 3668552
Table B-12 Cost of Modeled Energy Conservation Measures From ENERGY-10
Daylighting Cost
Daylighting 13371
Glazing (windows) 4980
Shading 13359
Energy-efficient lights 7259
Insulation 18868
Passive solar heating -5400
Economizer 5041
High-efficiency HVAC 7006
Total 66500
Total after HVAC downsizing 59494
B-26
Appendix C A Sustainable Design Cost Study for the Johnson City Customer Service Center Tennessee Valley Authority (TVA)1
This appendix describes an exercise undertaken by David Zimmerman of TVA to estimate the costs of adding sustainable design features to a building in the design phase
Project Description
The proposed TVA Johnson City Customer Service Center (CSC) is a 24171-ft2 district office (see Figure C-1) The building design contains offices for employees a large meeting room for TVA and community use (13054 ft2) support spaces (restrooms showers break room storage instrument room and power crew room ndash 6187 ft2) and an enclosed heated vehicle bay (4930 ft2)
Figure C-1 Floor Plan of Johnson City CSC
Approach to Sustainable Design
The goal of the building design is to incorporate a wide range of cost-effective sustainableenergy technologies to demonstrate to TVArsquos customers its environmental commitment and to save energy and operations and maintenance (OampM) costs The analysis described below is part of the initial design process The process is similar to the approach described in Section 22 of this document for the prototypical building The standard approach to efficient building design is to establish a base-case computer model of the building The base case represents the building design without special attention to energy efficiency or sustainability Then various energy and sustainable technologies are added one at a time to see their impact on the base design The cost and savings are determined and those features found to have acceptable performance can be combined into final computer simulations to determine overall impact on the building design
The Johnson City CSC project like past TVA projects underwent extensive planning and design prior to construction Typically every major new construction project undergoes an analysis similar to the one described below for Johnson City CSC
1 This appendix was written by D Zimmerman TVA
C-1
Sustainable Features
The following technologies were examined for the sustainable version of the Johnson City CSC
bull Decentralized geothermal heat pump HVAC system The building is heated and cooled using water to air heat pumps connected to a closed loop geothermal well system To further reduce energy use individual heat pumps units that use smaller pumps were connected to individual earth-coupled wells (instead of using one large well field and pump) This geothermal system cost more than a typical air-to-air heat pump but the estimates show it pays for itself in 69 years as a result of energy and maintenance savings
bull Light tube daylighting The building central circulation corridor private offices and meeting rooms are located in the interior of the building far from exterior windows To provide natural light to these spaces 30 circular skylights that are 13 in in diameter were connected to circular tubes lined with reflective material These tubes pipe light to these interior areas The light tubes along with the switched control system to turn off electric lights when enough daylight was present have an 83-year payback
bull North clerestory daylighting to provide 50 footcandles The building design has a large open office area Windows located on the south wall of this area provide daylight to a 15-6 depth but cannot daylight the remaining 26-6 Therefore the roof was sloped upward and a six-footshyhigh continuous north facing clerestory was installed to daylight the rest of this area (see Figure C-2) Carefully sized overhangs and fins prevent direct-beam sunlight from entering the space Continuous-dimming directindirect electric lighting systems were installed to maintain 50 footcandles over the whole space The extra windows (those needed beyond what would have been installed in a conventional building) dimmable electronic light ballasts a control system and light shelves were extra cost items attributed to the daylighting system and included in the incremental cost estimate The analysis showed a payback of 65 years
bull North clerestory daylighting to provide 15 footcandles of ambient light with additional task lights This energy-saving option is the same as the option above except fewer electric lights were installed and the control system was set to maintain a minimum light level of 15 footcandles Task lights were added to each of the workstations This energy-saving option has an even faster payback ndash 14 years
bull Garage daylighting This energy-saving option involved adding north- and south-facing glazing to the vehicle bay to provide daylighting The south-facing glazing also provides some passive solar heating The cost of fiberglass glazing in place of metal panels and a control system to switch off the electric lights were included in the cost analysis The payback was 55 years
bull Light-colored roof (changing the absorptance 091 [dark] to 03 [white]) Changing the metal roof from dark blue to white produced minimum savings The base-case building uses a standard metal building roof system that calls for R-30 batts of insulation attached to the underside of the metal roof This high level of insulation minimized the savings from this option so the roof color has been left to the discretion of the architect
In addition to the energy-saving options above a wide range of additional technologies was investigated for incorporation into the design Most of these can be classified as sustainable and are as follows
bull Membrane energy recovery heat exchanger This is a relatively new technology that involves transferring heat and moisture between incoming ventilation air and outgoing exhaust air using a thin membrane The manufacturer had a prototype unit and wanted to install it and monitor performance If successful such a unit could pay for itself in energy savings in 3 to 4 years
C-2
OPEN OFFICE CORRIDOR ENCLOSED OFFICE
MEETING MEETING ROOM
Figure C-2 Typical Section of Johnson City CSC Showing Clerestory Windows
bull Using ultraviolet (UV) light to treat HVAC supply air This technology involves passing HVAC supply air through ductwork lined with UV light tubes UV light is very effective at killing bacteria Such a system would not have an easily quantified savings It uses additional electricity to operate but could have a payback based on employee wellness (less absenteeism)
bull Metal roof vs asphalt roof Typical roofs on small commercial buildings are either built-up asphalt or asphalt-based shingles A heavy-gage standing-seam metal roof can have substantially longer life compared with asphalt and is easily recycled making it a more sustainable choice Analysis showed that the extra cost of a metal roof would pay for itself in 66 years so it was included in the design
bull Permeable pavement Permeable pavement allows water to drain through to the ground below Such pavement prevents water runoff and erosion New forms of permeable asphalt pavement were found to be almost identical in cost to standard asphalt pavement Permeable pavement also reduces the need for storm water catchment structures and storage making permeable pavement an instant payback
bull Rain water collection for irrigation and vehicle washing This sustainable option involved collecting rainwater off the roof and storing it for use in a 7500-gallon aboveground tank The water would be used for washing vehicles and irrigating landscaping This option was estimated to have a 94 ndashyear payback
bull Climate appropriate plants Research showed that climate-appropriate plants for TVArsquos climate in most cases cost no more than imported plants Climate-appropriate plants were included in the design
bull Autoclaved concrete block Autoclaved concrete block covered with a manufacturer-approved exterior stucco material was included in the design This sustainable material contains recycled-content (fly ash) and has excellent insulation qualities The cost of this block was found to be equal to standard concrete block with the addition of rigid insulation resulting in no extra cost
bull Waterless urinals compared with standard urinals Waterless urinals were found to cost less to install and maintain than standard urinals They are fiberglass units with a vapor trap that contains a liquid that allows urine to pass through They do not require a water supply line flush valves etc resulting in substantial water and maintenance savings
bull High-velocity electric hand dryers ndash Excel Xleratorreg compared with paper towels The Excel Corporation markets a hand dryer that it claims can dry hands in 10 to 12 seconds compared with standard dryers which can take up to 30 seconds Two of these hand dryers were added to the design and if fully used they will reduce the use of paper towels The projected payback for the dryers cost is 16 years compared with paper towel use and disposal
C-3
bull Sustainable (healthy) interior finishes Low volatile organic compound (VOC) paints and finishes along with materials with recycled content and the ability to be recycled have been gradually introduced into TVA renovation and new construction work and were included in the CSC design
Some options were considered but not included in the design
bull Operable windows for ventilation This option was briefly considered and rejected because of the high humidity levels and very hot summers The installation of a very efficient HVAC system (geothermal heat pump) further reduces the potential of this option to save money and provide comfortable indoor conditions
bull Wind electric generation This energy option was not included because the current building site does not have the necessary wind levels
bull Photovoltaic roof canopy Replacing the covered parking canopy with a canopy made up of photovoltaic cells was found to be very costly and to have a very long payback period
In addition to the above sustainable technologies a decision had already been made to incorporate the following sustainable technologies so they were included in the base-case cost
bull Raised access floor to provide flexibility in changing the spaces and to provide underfloor HVAC with individual work station air controls
bull Movable walls to construct interior private offices and meeting rooms to minimize the use of drywall and provide easy changes to the space in the future
Financial Considerations
Figure C-3 (at the end of the appendix) shows the calculated incremental first costs and annual cost savings (with payback periods) In addition to the individual technologies described above the analysis included a number of combinations of technologies
bull Total building daylighting (north clerestory ndash 50 footcandles) This is a combination of light tube daylighting garage daylighting and open office north clerestory daylighting to 50 footcandles This combination yielded a payback of 75 years
bull Total building daylighting (north clerestory ndash 15 footcandles) This is the same as the option above except the open office area is lit to only 15 footcandles and task lights are installed in each of the workstations This combination yielded a payback of 50 years
bull Total building daylighting (50 footcandles) plus geothermal heat pump This is a combination of total building daylighting (north clerestory ndash 50 footcandles) and the geothermal heat pump HVAC system This combination yielded a payback of 69 years
bull Total building daylighting (15 footcandles) plus geothermal heat pump This is the same as the option above (daylighting combined with geothermal heat pump) except the open office area is being lit to only 15 footcandles and task lights are installed in each of the workstations This combination yielded a payback of 57 years The significance of this combination is that overall energy use of the building design was reduced by almost 50
The energy cost savings of the energy-saving options (daylighting and geothermal heat pump system) were determined by creating an energy model of the building using the PowerDOE building energy analysis program (Version 118g by James J Hirsch amp Associates) which uses DOE-21 as the principal underlying model (see Section 31 and Appendix B for description of how DOE -21 was applied in this study) This program takes into account all the heat lossgain through the various
C-4
building surfaces and the amount of internal energy use and heat gain from lights people and equipment and models the HVAC system to maintain set indoor conditions The program performs an hour-by-hour simulation of the building design and outputs a wide range of reports including yearly energy cost based on utility rate structure
The costs of the various energy-saving options were determined using several approaches The geothermal heat pump system size and cost were determined by a TVA engineer experienced in designing such systems for TVA customers The cost of daylighting components were determined from RS Mean Building Construction Cost Data ndash 2002 (RS Means 2002) along with some actual numbers from specific manufacturers
Key Conclusions for the Business Case
Many cost-effective sustainable design options exist Energy reduction of 50 from the base case design with a payback period of 57 years was projected for this building by adding many daylighting features very low light levels and a geothermal heat pump Lighting options can be very cost-effective because they tend to lower first costs
C-5
Figure C-3 Analysis of Sustainable Features for Johnson City CSC
C-6
How to Read Figure C-3
The Johnson City Customer Service Center High Performance Design Options bar chart is divided into three sections The solid bars at the top show actual energy performance of existing customer service center buildings along with the Chattanooga Office Complex which is one of TVArsquos most energy-efficient office buildings These solid bars provide a reference to which to compare the Johnson City CSC design (The units are Btuft2yr)
The multicolored bars show the performance of the base Johnson City CSC design as well as the individual technologies considered and the combinations of energy-saving options Each color shows the amount of energy going to the various component energy uses within the building such has lighting equipment heating etc (shown at the bottom of the chart) All the energy-use bars are in units of Btuft2year which makes it easy to not only compare to the solid reference bars but to other non-TVA buildings
Data for technologies listed below the bars are primarily sustainable technologies that donrsquot have energy savings but have other types of cost savings (or in some cases have no additional costs compared with standard technologies) Those showing less than a 10-year payback an instant payback or low costs have been recommended for incorporation into the design
C-7
Appendix D Documentation of the Sustainable Siting and Water-Savings Features Included in the Prototype Building Analysis1
This appendix documents the calculations used to estimate costs and cost savings associated with siting and water-efficiency technologies and materials described in Section 23 and 24 water-efficiency features (Section D1) stormwater management (Section D2) and landscape management (Section D3)
Water-Efficiency Features
Domestic Water Technology Selection
Typical domestic fixtures that are found in an office building are faucets toilets urinals and showerheads For the prototype building highly efficient fixtures were selected to exceed the minimum flow rate standards set by the Energy Policy Act (EPAct) of 1992 The following summarizes the advanced technologies that were selected (also see Table D-1)
bull Showerheads EPAct mandates that showerheads not exceed 25 gallons per minute (gpm) at a pressure of 80 pounds per square inch (psi) or less Typical building pressure is between 40 and 80 psi To exceed this standard a showerhead of 20 gpm was chosen More efficient showerheads are available but the quality of the shower can be greatly diminished with less than 20 gpm
bull Faucets EPAct sets standards that kitchen faucets cannot exceed 25 gpm at 80 psi and restroom faucets cannot exceed 22 gpm at 80 psi For both the kitchen and restroom faucets a 10 gpm model was chosen for the prototype building
bull Toilets EPAct guidelines mandate that all toilets not exceed 16 gallons per flush (gpf) Two advanced technologies were analyzed for the prototype building a dual-flush toilet and a 11shygpf model A dual-flush toilet has two flushing options ndash liquid flushing at 08 gpf and solid flushing at 16 gpf An analysis of the two toilets proved the dual-flush toilet to be the most economical option The 11-gpf toilet is an emerging technology with a very high initial cost ndash the simple payback was calculated to be up to 30 years The dual-flush toilet was only analyzed for the womens restrooms It was assumed that when men use toilets (in combination with urinals) the 16-gpf option would always be used therefore no water savings would occur from the dual-flush toilet in the mens restrooms
bull Urinals EPAct requires that all urinals not exceed 10 gpf A no-water urinal was chosen for the advanced technology for this study No-water urinals have a lower installation cost because no water supply line is necessary Therefore installing a no-water urinal is less expensive than the low-flush model
Incremental Costs and Annual Water Savings
For indoor domestic water technology the incremental capital and installation costs annual water consumption and cost savings and the simple payback were estimated For each domestic fixture found in typical office buildings (faucets toilets urinals and showerheads) a more advanced fixture was chosen that exceeded the minimum flow rate standards set by the EPAct and that kept quality as a parameter Maintenance costs were considered when analyzing urinals because of differing costs for standard urinals compared with no-water urinals
1 Prepared by K McMordie-Stoughton and G Sullivan Pacific Northwest National Laboratory
D-1
Table D-1 Domestic Water Technology Overview
Equipment Standard Equipment
(set by EPAct) Advanced Equipment
Showerheads 25 gpm 20 gpm
Faucets 25 gpm ndash kitchen 22 gpm ndash restroom
10 gpm (both kitchen and restroom)
Toilets 16 gpf Dual flush 8 and 16 gpf options0
Urinals 10 gpf 0 gpf
When annual water cost savings were calculated for each fixture type water rates were broken by low high and average based on fiscal year 1999 water rates from General Services Administration (GSA)2 Each fixtures water use was calculated by using the standard use frequency for each fixture type for the prototype building The total water reduction for indoor domestic water using equipment was over 47 Note that the energy cost savings from hot water savings were not calculated or included All assumption and data sources used to calculate these values are detailed in Table D-2
Stormwater Management
The goals of sustainable stormwater management are to maintain stormwater on site as long as possible to reduce runoff volume to reuse the stormwater and to ensure that it is clean before returning it to the natural system which reduces nonpoint source pollution and sedimentation in natural water ways For this analysis an integrative stormwater management system comprised of a gravel-paved parking lot and underground rainstorm system was examined3
This porous gravel-paved parking area is a heavy load-bearing structure that is filled with porous gravel allowing stormwater to infiltrate the porous pavement and to be moved into a rainwater collection system This system will greatly reduce runoff and retain rainwater on site for landscape irrigation by contrast a conventional asphalt parking area would cause all stormwater to run off the site increasing pollutant concentrations and eliminating the possibility of reusing the water The porous gravel system was selected for several reasons
bull As an integrative system it achieves the goals of maintaining and using stormwater on site bull The materials are partly made from recycled material bull Cost and maintenance data are reliable bull It meets the Environmental Protection Agencys National Pollutant Discharge Elimination
System (NPDES) Phase II requirements which expand the existing NPDES to require a storm water management program for all new construction including runoff control and post-construction stormwater management (For more information see httpwwwepagovfedrgstrEPA-WATER1999DecemberDay-08w29181ahtm)
2 Personal Communications with A Walker of General Services Administration February 13 2001 3 Invisible Structures Inc provided an integrative stormwater management system from Gravelpave and Rainstore products
D-2
Table D-2 Assumptions and Data Sources
Assumptions Data Data Source
Number of working days per year 235 Based on 10 holiday days and 15 vacation days
Occupancy 97 Standard for prototype building
Distribution of women and men 5050
Restroom uses Standard usage
Womens
Toilet usedayperson 3
Mens
Toilet usedayperson 1
Urinals usedayperson 2
Faucets 3
Faucet duration 30 sec
Shower useday 1
Shower duration 7 min
No of fixtures in prototype building Uniform Building Code (1997) and Dziegielewski et al (2000)
Restrooms 4
Toilets 8 4 in womens bathrooms and 4 in mens
Urinals 3
Faucets 8
Kitchen faucets 1
Showers 2
Water rates - $1000 gallons GSA Fiscal Year 1999
GSA Region 3 average (Baltimore is in Region 3)
$397
Costs for fixtures (per unit)
Showerheads
Standard $400 GSAs Federal Supply Service provided through website httpswwwgsaadvantagegov
Advanced $899 Catalog supplied by Niagara Conservation Company Cedar Knolls New Jersey 2002
Faucets
Standard $340 GSAs Federal Supply Service provided through website httpswwwgsaadvantagegov
Advanced $927 GSAs Federal Supply Service provided through website httpswwwgsaadvantagegov
Toilets
Standard $15000 GSAs Federal Supply Service
Advanced $20000 Dual-flush toilet from Caroma personal communication with representative of USA Caroma Inc May 2002
Urinals
Standard $21678 GSAs Federal Supply Service provided through website httpswwwgsaadvantagegov
D-3
Assumptions Data Data Source
Advanced $12760 GSAs Federal Supply Service provided through website httpswwwgsaadvantagegov
Installation costs for urinals Personal communication with Waterless urinal and Falcon Water Free Company May 2002
Standard $20000 (Total cost for installation of unit and water supply line)
Advanced $10000 (No water supply line needed)
Annual maintenance costs for urinals Based on information provided through personal communication with D Zimmerman Tennessee Valley Authority regarding Johnson City Customer Service Center (see Appendix C)
Standard urinal $11900
Blue seal fluid $1485
Eco-trap $1144
Savings for dual flush toilets 33 Based on one 16 gpfday and two 08 gpfdaywoman
Supply and distribution ndash typical 3
Wastewater treatment ndash activated sludge 17
Assumptions and Data Sources
To estimate the costs and annual savings associated with an integrative stormwater management system detailed assumptions were made based on available data sources which are described in the following sections
Parking Area
For the parking area the porous gravel-paved lot was compared with a traditional asphalt parking area The assumptions and data sources for the comparative analysis are as follows
bull Parking lot surface area assumptions ࠃ The total lot size is 1 acre ndash A review of the zoning ordinances including those in the
Baltimore area led to this size assumption ࠃ The parking lot area will require 50 to 75 parking spaces ࠃ The parking lot dimensions are assumed to be 140 ft by 180 ft giving a total area of
25200 ft2
bull Installation costs for the porous gravel-paved and asphalt parking lot came directly from communications from the products manufacturer4
ࠃ Gravel-paved ndash $230ft2
ࠃ Asphalt ndash $211ft2
bull Maintenance costs were obtained from a University of South Alabama study (1999) which shows a comparison of maintenance costs between an asphalt parking lot and porous gravel and grass-paved system ࠃ Gravelgrass paved parking area ndash $0296yd2yr ࠃ Asphalt parking area ndash $0497yd2yr
4 Direct communications with D Glist of Invisible Structures Inc on June 28 2002 provided estimated costs for Gravelpave product and conventional asphalt-paved surface
D-4
This study examined the historical records of the University of South Alabama Grounds Department asphalt maintenance from 1993 to 1998 and compared those records with the maintenance costs for a porous gravel and grass-paved system that was installed on campus For the asphalt parking lots maintenance costs included coating paint striping patching and crack filling and resurfacing For the grassgravel-paved parking area maintenance included regular landscaping requirements of the grass and periodic raking and topdressing of the gravel5 A 20-year life span was assumed for both surfaces
Rainwater Collection System
An integrated rain storage system Rainstore was compared with a conventional corrugated plastic pipe system The conventional system simply moves the stormwater off the asphalt parking lot but does not include the opportunity to reuse the stormwater for irrigation The assumptions and data sources for the comparative analysis are as follows Both the Rainstore and corrugated pipe systems were sized for the site using Rainstore Materials Estimator an online tool6 that allows the user to input the site characteristics and stormwater storage needs to estimate the amount of materials required for a Rainstore system Optional designs such as the corrugated pipe system can also be evaluated
Installation costs associated with the Rainstore system were obtained from a quote 7 from a Northeast product dealer based on the materials that were estimated in the Rainstore Materials Estimator The Rainstore manufacturer provided costs for additional materials and fees
bull Rainstore modular units ndash $356387
bull Geogrid and geotextile ndash $25197
bull Pump for feeding rainwater to irrigation system ndash $3007
bull Freight for shipping Rainstore system ndash $75007
Installation costs for the corrugated pipe system were provided by the product manufacturer7 and were based on the materials that were estimated in the Rainstore Material Estimator
bull Corrugated pipe ndash $373107
bull Other materials and services required ndash $211547
Labor costs for both the Rainstore system and corrugated plastic pipe were as follows
bull Labor cost ndash $70hr7
bull Total labor required for Rainstore ndash an estimated 45 hours (from the Rainstore Estimator tool) bull Total labor required for the corrugated pipe system ndash assumed to be 5 additional for extra
welding of elbows and tees into the system that the Rainstore system does not require8
5 Because the system examined in this analysis did not include a grass-paved system the maintenance costs comparison can be assumed to be conservative6 The website for the online tool is available at httpwwwinvisiblestructurescomRS3RS3_Est_Instructhtm 7 ACF Environmental ndash a distributor in the Northeastern US for Rainstore products ndash quotation for Rainstore Stormwater Storage System July 29 2002 8 Direct communications with C Spelic of Invisible Structures Inc on July 31 2002 provided estimated costs for labor freight and other associated costs with the Rainstore system and for a corrugated pipe systems based on material prices for piped system
D-5
Incremental Costs and Annual Savings Calculations
Tables D-3 through D-5 summarize the calculations that estimated the incremental cost for the sustainable stormwater management system Table D-3 itemizes all individual costs and fees and shows how the total cost was calculated for each system (summation of the cost column in Table D-3) The total cost for the conventional corrugated pipe system was subtracted from the Rainstore system to calculate the incremental installation cost as shown on the last row of Table D-3
Table D-4 lists the installation and maintenance costs for the porous gravel parking area compared with the asphalt parking area The installation cost per square foot was multiplied by the total area of the parking area which is 25200 ft2 to calculate the total installation cost To determine the incremental installation cost the cost of the asphalt parking lot was subtracted from the gravel-paved lot The incremental maintenance cost was determined in the same manner as shown in Table D-4
In Table D-5 the total incremental cost for the entire system was calculated by combining the costs for the parking area and rainwater collection system for both the sustainable design and conventional design ndash as shown in the rows labeled ldquoTotalrdquo in Table D-5 The incremental cost was then calculated by subtracting the two total costs The simple payback of 559 years can be calculated by dividing the incremental installation cost by the total maintenance savings
Landscape Management Overview and Assumptions9
Sustainable landscaping practices combine sound maintenance practices with a design that uses native plants Conventional landscaping usually is comprised of turf such as Kentucky blue grass which requires an irrigation system to provide supplemental water high maintenance to provide regular mowing chemical herbicide application to reduce weeds and fertilizer to maintain a healthy lawn in most regions of the United States Planting native species greatly reduces the need for supplemental watering and regular maintenance Native species will withstand the conditions of the area so native plants can survive in both abnormally wet and dry conditions whereas nonshynative plants do not adapt as well to extreme conditions Also with sustainable designed landscape rainwater can be harvested to serve as supplemental irrigation Specific plants can be selected to help clean rainwaters impurities such as oil from automobiles and salts from roadways to return filtered water to the groundwater or stormwater system
The following design assumptions summarize the specifics of the landscaping area analysis of the site (more details on these features are covered in the next section)
bull Landscaping area ndash 8000 ft2
bull Landscape design ndash Native seed mixture combination of native warm weather turf and wildflowers create a natural meadow area
bull Irrigation system ndash Spot and periodic watering are required to establish the native plants All of the the irrigation water required to establish the native landscaping will be harvested from the rainwater held in the stormwater management system
bull Landscape maintenance ndash The sustainable landscaping area requires very little maintenance while the traditional turf landscaping requires regular maintenance and chemical treatment
9 K McMordie Pacific Northwest National Laboratory
D-6
Table D-3 Installation Costs for Rainwater Storage and Conventional Stormwater Management Systems
Type Material Amount Units Unit Cost Cost
Rainstore system Rainstore modular units 2232 units $1597 $3563838
Geotextile 1378 yd2 $055 $76000
Geogrid 459 yd2 $383 $175904
Pump for irrigation feed $30000
Excavation 569 yd3 14 $796600
Backfill 226 yd3 $1200 $271200
Area needed 1001 ft2 NA
No cost associated with area
Cover 51 yd3 $1200 $61200
Freight 3 truck loads $250000 $750000
Labor 45 hours $7000 $315000
Total $6039742
Conventional system
Corrugated 48 plastic pipe 533 linear ft $7000 $3731000
Tees 8 each $90000 $720000
Elbows 4 each $70000 $280000
Excavation 543 yd3 14 $760200
Backfill 197 yd3 $1200 $236400
Area needed 2665 ft2 NA
No cost associated with area
Cover 99 yd3 $1200 $118800
Freight NA No freight
needed No freight
needed No freight
needed
Labor 475 hours $7000 $332500
Total $6178900
Incremental installation cost (Rainwater minus conventional) -$139158
NA ndash Not applicable
D-7
Table D-4 Installation and Maintenance Costs of Porous Gravel Parking Area and Conventional Asphalt Parking Area
Installation CostFt2
Total Installation
Cost
Maintenance Costs
($ft2yr)
Total Maintenance
CostsYr
Gravel-paved parking lot $230 $57960 $00329 $82880
Asphalt parking lot $212 $53424 $00552 $139160
Incremental cost (gravel minus asphalt) $4536 -$56280
Table D-5 Total Stormwater Installation Maintenance and Incremental Costs
Total Stormwater Costs
Total Installation
Cost ($)
Total Installation
Cost ($Kft2)
Maintenance Cost ($yr)
Total Annual Maintenance
Cost ($Kft2-yr)
Sustainable system Rainstore $60397 Gravel paved $57960 Total $118357 $5918 $829 $41
Conventional system Corrugated pipe system $61789 Asphalt-paved parking area $53424 Total $115213 $5761 $1392 $70
Incremental cost (sustainable minus conventional) $3144 $157 -$563 -$28
Assumptions and Data Sources
To estimate the installation costs and annual savings associate with landscaping at the site the following assumptions and data sources were used in the analysis
bull Landscape area ࠃ Total lot size is 1 acre ndash A review of zoning ordinances including those in the Baltimore
area led to this assumption ࠃ The parking area ndash A total of 25200 ft2 based on 50 to 75 parking spaces ࠃ Footprint of the building ndash 10082 ft2 ࠃ Landscaping area ndash 8000 ft2 (with the remaining area of 278 ft2 for sidewalks)
bull Landscape materials and installation cost10
ࠃ $20000acre for native planting of seed mixture ࠃ $6667acre for traditional turf (one-third the cost of native seed mixture)
bull Irrigation system ndashNormally no irrigation system would be installed for a native landscape but because this landscape will be irrigated from rainwater in an underground storage system a pump (costs for the pump was included in the stormwater management analysis) is required to
10 Input on the design and installation costs for native plant and traditional turf material was provided by G Gardner of Davis Gardner Gannon Pope Architecture in Philadelphia Pennsylvania This firm has been involved in two Leadership in Energy and Environmental Design (LEEDtrade) projects in the northeastern United States and is knowledgeable about the real costs associated with native plant species compared with traditional turf for the northeastern United States
D-8
pump the water from the underground storage and an irrigation system is required to provide a means to deliver the rainwater to the landscaping This system is the same size required for a conventially-landscaped area therefore there is no incremental cost for the irrigation system
bull Maintenance services and costs11
ࠃ Annual maintenance for the traditional turf area will require 6 applications of fertilizer and herbicides per year 26 mowing and maintenance trips and 1aeration
ࠃ The annual maintenance fee for the sustainable landscape is assumed to be 10 of that of the traditional landscape While sustainable landscaping will not require routine maintenance such as mowing and fertilizing it is not maintenance-free Based on a review of the literature in this area a traditional turf landscape area is estimated to require 10 days of maintenance whereas a sustainable design will only require 1 day The watering schedule for traditional turf landscaping is assumed to be 1 in of water over the entire area at 30 applications per year
ࠃ The average FY 1999 GSA water rate for Region 3 (Baltimore is in GSA Region 3) was used to estimate the cost of irrigation for traditional turf area $3971000 gallons
ࠃ No water costs are associated with the native landscaping because all supplemental water will be supplied from the rainwater collection system
ࠃ Annual maintenance service fees for traditional turf landscape are assumed to be $2754 (a combination of all services listed and irrigation requirements) This cost does not include maintenance of the irrigation systems because the maintenance costs are assumed to be minimal and not a large factor in this study because both designs have irrigation systems
Incremental Costs and Annual Savings Calculations
Table D-6 shows the individual installation and maintenance costs estimated for the sustainable and conventional landscape designs The installation costs are a combination of design implementation of landscape materials and installation of the irrigation system The maintenance costs are a combination of all routine maintenance (listed above) and cost of water to irrigate the landscaping The incremental costs were determined by calculating the difference between the total costs for each design as shown in the last row of Table D6 The simple payback of 08 years can be calculated by dividing the incremental installation cost by the total maintenance savings
11 The cost for landscape maintenance for traditional turf was estimated by Trugreen Chemlawn Company a division of the national franchise located in Baltimore Maryland
D-9
Table D-6 Installation Maintenance and Incremental Costs of Sustainable and Conventional Landscape Area
Site Design Site Design Irrigation Total Total and and Installation Maintenance Water Use Maintenance Maintenance
Implementation Implementation Cost Costs Cost Cost Cost ($acre) ($ for this site) ($1000ft2) ($yr) ($yr) ($yr) ($1000 ft2)
Sustainable Design Native planting $20000 $367309 $18365 $27239 $0 $27239 $1362
Conventional Traditional turf $666767 $122436 $6122 $272391 $59391 $331782 $16589 Incremental cost (sustainable minus conventional) $13333 $249873 $12244 -$245152 -$59391 -$304543 -$15227
D-10
Appendix E Documentation of the Sustainable Materials Features Included in the Prototype Building Analysis1
This appendix documents the calculations used to estimate costs and cost savings associated with the sustainable materials features in the prototype building analysis described in Section 21
bull Low-emitting paint versus latex paint (Section E1) bull Recycled latex paint (Section E2) bull Concrete with slag content (Section E3) bull Concrete with fly ash content (Section E4) bull Carpet with recycled content (Section E5) bull Certified wood options (Section E6)
Documentation of Costs of Low-Emitting Paint Versus Typical Latex Paint
Based on cost estimates from the Timberline model (see Appendix B) the 20000-ft2 office building has 70000 ft2 of interior painted surface The painted surface was assumed to be primed and then painted with a typical contractor-grade latex paint (eggshell)
To provide paint quality comparisons data on high-end products were also gathered Sales representatives from three major paint manufacturers were contacted and primer and topcoat paint prices were provided In addition the vendor technical data sheets provided coverage rates (square feet covered per gallon of paint) The calculations for this document assumed the midpoint of the price range and the lower end of the coverage range to offer a conservative comparison of the products
Low-emitting (no-volatile organic compound [VOC]) paint provides better working conditions at the construction site and may allow painters to work inside the building while other activities are underway The cost of the paint varies depending on the location of the purchase volume of paint purchased and the ability of the local distributor to offer special rates The specifications for all the low-emitting paints analyzed in this study stated that the VOC content was 0 milligramliter
The sales representatives suggested alternative surface preparation techniques (in addition to a traditional primer) but those techniques are not discussed here because the products were too different to offer a fair comparison
Benjamin Moore Paint Company
A Benjamin Moore sales representative provided price quotes for three types of paint used in commercial buildings a very high-end latex paint (AquaVelvet) a typical contractor-grade latex paint (SuperSpec) and a low-emitting paint (EcoSpec) The technical data sheets state that the EcoSpec primer has a higher coverage rate than the other paints Table E-1 shows the ranges quoted by the vendor for the estimated retail price and coverage rates and the values used in the calculations
1 This appendix was written by K Fowler D Hostick and K Poston Pacific Northwest National Laboratory
E-1
Table E-1 Prices and Coverage Rates for Benjamin Moore Paints
Paint Type Price Range
(per gal)
Price Assumed for the
Calculations Coverage (ft2gal)
Coverage Rate Assumed for the
Calculations
Typical contractor latex paint (SuperSpec)
Primer $1528-$1579 $1554 400-500 400
Top coat $2280-$2299 $2290 400-450 400
Very high-end latex paint (Aquavelvet)
Primer $2488-$2499 $2494 400-450 400
Top coat $2988-$2999 $2994 400-450 400
Low-emitting latex paint (EcoSpec)
Primer $2150-$2200 $2175 550 550
Top coat $2840-$2880 $2860 400-450 400
Using the values in Table E-1 the material cost for painting 70000 ft2 of wall area in the 20000-ft2
office building is as follows (assuming one coat of primer and one top coat and a 196 adder for sales tax contractor bonds and insurance profit and overhead and general conditions based on the Timberline model)
The material cost for SuperSpec is as follows
Primer coat cost = ((70000 ft2)(400 ft2gal)) x $1554gal = $271950 Top coat cost = ((70000 ft2 )(400 ft2gal)) x $2290gal = $400750 Total material cost = $271950 + $400750 = $6727 Full cost (inc adder) = $6727 x 1196 = $804549
The same calculation was done for AquaVelvet and EcoSpec resulting in full costs (inc adder) of $1148638 and $929672 respectively
The differences between EcoSpec (the non-VOC paint) and the other two paints are as follows
The material cost for EcoSpec compared with SuperSpec is as follows The difference per gallon for the primer is $2175 - $1554 = $621 (EcoSpec is more expensive by $621 per gallon) The difference per gallon for the top coat is $2860 - $2290 = $570 The total first cost difference is $929672 - $804549 = $125123 or by dividing by 20000 ft2 of building floor space the difference in first cost is $62591000 ft2
Using the same calculation procedure the difference in first cost (inc adder) for EcoSpec compared with AquaVelvet is -$109461000 ft2
Sherwin Williams Paint Company
A Sherwin Williams sales representative provided price quotes for three types of paint used in commercial buildings a high-end latex paint (ProMar 400) a typical contractor-grade latex paint (ProMar 200) and a low-emitting paint (Harmony) The technical data sheets state that the
E-2
Table E-2 Prices and Coverage Rates for Sherwin Williams
Paint Type
Price Range
(per gal)
Price Assumed for the
Calculations Coverage (ft2gal)
Coverage Rate Assumed
for the Calculations
Typical contractor latex paint (ProMar 400)
Primer $950-1000 $975 350-400 350
Top coat $1050-1250 $1150 350-400 350
Very high-end latex paint (ProMar 200)
Primer $1100-1250 $1175 350-400 350
Top coat $1300-1450 $1375 350-400 350
Low-emitting latex paint (Harmony)
Primer $1300-1450 $1375 350-400 350
Top coat $1500-1700 $1600 350-400 350
coverage rates are the same for each product Table E-2 shows the ranges quoted by the vendor for the estimated retail price and the coverage rates and the values used in the calculations
Using the values in Table E-2 the material cost for painting 70000 ft2 of wall area in the 20000-ft2
office building is as follows (assuming one coat of primer and one top coat and a 196 adder for sales tax contractor bonds and insurance profit and overhead and general conditions based on the Timberline model)
The material cost for ProMar 400 is as follows
Primer coat cost = ((70000 )(350 ft2gal)) x $975gal = $1950 Top coat cost = ((70000 ft2)(350 ft2gal)) x $1150gal = $2300 Total material cost = $1950 + $2300 = $4250 Full cost (inc adder) = $4250 x 1196 = $5083
The same calculation was done for ProMar 200 and Harmony resulting in full costs (inc adder) of $609960 and $711620 respectively
The differences between Harmony (the low-emitting paint) and ProMar 400 are as follows The difference per gallon for the primer is $1375 - $975 = $400 (Harmony primer is more expensive by $4 per gallon) The difference per gallon for the top coat is $1600 - $1150 = $450 The total first cost difference is $711620 - $5083 = $203320 or by dividing by 20000 ft2 of building floor space the difference in first cost is $101661000 ft2
Using the same calculation procedure for Harmony compared with ProMar 200 yields a difference in first cost of $50831000 ft2
Duron Paint Company
A Duron sales representative provided price quotes for four types of paint used in commercial buildings premium-quality latex paint (Plastic Kote 29-series) top-quality latex paint (Ultra Deluxe 36-series) a typical contractor-grade latex paint (Pro Kote 23-series) and a low- emitting paint
E-3
(Genesis 79-series) The technical data sheets state that the coverage rates are the same for each product The sales representative recommended the same primer regardless of top coat choice
Table E-3 shows the ranges quoted by the vendor for the estimated retail price and the coverage and shows the values used in the calculations Note that Duron paint is manufactured in Atlanta Georgia and Beltsville Maryland Procuring paint for the Baltimore prototype building from the Duron location in Maryland would contribute to localregional material points in the LEED certification process
Table E-3 Prices and Coverage Rates for Duron
Paint Type Price Range
(per gal)
Price Assumed for the
Calculations Coverage (ft2ga1)
Coverage Rate Assumed for the
Calculations
Typical contractor latex paint (Pro Kote 23-Series)
Primer $1385-1485 $1435 350-400 350
Top coat $1365-1465 $1415 400 400
Top quality latex paint (Ultra Deluxe 36-Series)
Primer $1385-1485 $1435 350-400 350
Top coat $1835-1935 $1885 400 400
Premium quality latex paint (Plastic Kote 29-Series)
Primer $1385-1485 $1435 350-400 350
Top coat $1925-2025 $1975 400 400
Low-emitting latex paint (Genesis 79-Series)
Primer $1385-1485 $1435 350-400 350
Top coat $2040-2140 $2090 400 400
Using the values in Table E-3 the material cost for painting 70000 ft2 of wall area in the 20000-ft2
office building is as follows (assuming one coat of primer and one top coat and a 196 adder for sales tax contractor bonds and insurance profit and overhead and general conditions based on the Timberline model)
The material cost for the Pro Kote 23-Series is as follows
Primer coat cost = ((70000 ft2)(400 ft2gal)) x $1435gal = $251125 Top coat cost = ((70000 ft2)(350 ft2gal)) x $1415gal = $2830 Total material cost = $251125 + $2830 = $534125 Full cost (inc adder) = $534125 x 1196 = $638814
Using the same calculation procedure the full cost (inc adder) for the other paints is as follows
bull Ultra Deluxe 36-Series $751238 bull Plastic Kote 29-Series $772766 bull Genesis 79-Series $800274
E-4
The differences between Genesis (the low-emitting paint) and the Pro Kote 23-Series are as follows There is no difference per gallon for the primer The difference per gallon for the top coat is $2090 - $1415 = $675 (Genesis is more expensive by $675 per gallon) The total first cost difference is $800274 - $638814 = $161460 or by dividing by 20000 ft2 of building floor space the difference in first cost is $80731000 ft2
Using the same procedure the other comparisons yield the following differences in first cost
bull Genesis compared with Ultra Deluxe 36-Series $24521000 ft2
bull Genesis compared with Plastic Kote 29-Series $13751000 ft2
Taking the highest and lowest per gallon differences and the total cost differential that considers the difference in coverage the following summarizes this sustainable design feature
bull Sustainable design feature low-emitting paint bull Incremental first cost ($unit) -$319 to +$675 bull Incremental cost ($1000 ft2) -$10950 to +$10166
Documentation of Recycled Latex Paint
Based on cost estimates from the Timberline model the 20000-ft2 office building has 70000 ft2 of interior painted surface Recycled content primer was not available so the cost comparisons below do not include primer costs The data on typical contractor-grade paint gathered for the low-emitting latex paint options were used as the baseline for this comparison
Recycled paint is post-consumer latex paint that has been sorted by type color and finish and reprocessed for resale The US Environmental Protection Agency (EPA) through the Comprehensive Procurement Guideline2 encourages the purchase of latex paint made from postshyconsumer-recovered materials whenever the paint meets the projects specifications and performance requirements and is available and cost effective The benefits of recycled paint for sustainable design typically include the following
bull Lower first cost (where the paint is available it is typically offered at a lower price than virgin paint of a comparable quality)
bull Reduced paint disposal needs (using the recycled paint creates a market for the excess paint often found after household and commercial construction projects)
bull Decreased waste costs (recycling rather than disposing of the excess paint avoids waste disposal costs)
Two suppliers of recycled paint provided quotes for their products These vendors sell recycled paint and accept excess latex paint for reprocessing and consolidation Both vendors can ship their products to the Baltimore area Shipping costs are not included in the cost summary below because the vendors noted that their distribution outlets are increasing and these charges may not be applicable over the long term Also both companies offered special rates for large projects and government buildings and under other special circumstances those reduced rates were not considered for this evaluation
2 Available at URL httpwwwepagovepgproductspainthtm
E-5
Table E-4 lists the price and coverage data for each of the paint products and the values used in the calculations The calculations assumed the midpoint of the price range and the lower end of the coverage range to offer a conservative comparison of the products
Table E-4 Paint Prices and Coverage Rates
Paint Type Price Range
(per gal)
Price Assumed for the
Calculations Coverage (ft2gal)
Coverage Rate Assumed for the
Calculations
Typical contractor latex paint
Benjamin Moore SuperSpec $2280-$2299 $2290 400-450 400
Sherwin Williams ProMar 400 $1050-1250 $1150 350-400 350
Duron Pro Kote 23-Series $1365-1465 $1415 400 400
Recycled paint
Nu-Blend Paints Inc $850 - $1060 $955 350-400 350
E Coat $899 - $1199 $1049 250 250
Using the values in Table E-4 the material costs for painting 70000 ft2 of wall area in the 20000-ft2
office building are as follows (assuming one top coat and a 196 adder for sales tax contractor bonds and insurance profit and overhead and general conditions based on the Timberline model)
The material cost for Benjamin Moore SuperSpec is as follows
Top coat cost = ((70000 ft2)(400 ft2gal)) x $2290gal = $400750 Full cost (inc adder) = $400750 x 1196 = $479297 (for top coat only)
Using the same procedure the following are the full costs (inc adder) for the other paints
bull Sherwin Williams ProMar 400 $275080 bull Duron Pro Kote 23-Series $338468 bull Nu-Blend recycled paint $228436 bull E Coat recycled paint $349950
The differences between Nu-Blend recycled paint and the Benjamin Moore SuperSpec latex paint are as follows The difference per gallon for the top coat is $955 - $2290 = -$1335 (Nu-Blend is less expensive by $1335 per gallon) The total first cost difference is $228436 - $479297 = -$250861 or by dividing by 20000 ft2 of building floor space the difference in first cost is -$125431000 ft2
Using the same procedure the first cost differences between Nu-blend and the other latex paints are as follows
bull Nu-Blend compared with Sherwin Williams ProMar 400 -$22821000 ft2
bull Nu-Blend compared with Duron Pro Kote 23-Series -$55021000 ft2
The differences between E Coat recycled paint and the three contractor-grade latex paints are as follows
E-6
bull E Coat compared with Benjamin Moore SuperSpec -$64671000 ft2
bull E Coat compared with Sherwin Williams ProMar 40 $37441000 ft2 (ie E Coat is more expensive by $37441000 ft2)
bull E Coat compared with Duron Pro Kote 23-Series $5741000 ft2 (E Coat is more expensive)
Taking the highest and lowest per gallon differences and the total cost differential that considers the difference in coverage the following summarizes this sustainable design feature
bull Sustainable design feature recycled paint bull Incremental first cost ($unit) -$1335 to -$105 bull Incremental cost ($1000 ft2) -$12543 to +$3744
Documentation of Costs of Concrete with Slag Content
Based on estimates provided by vendors 250 yd3 of 3000 pounds per square inch (psi) concrete would be needed for the 20000-ft2 office building The baseline product is concrete made from 100 portland cement The sustainable design option is concrete with a mix of portland cement and iron mill slag
Blast furnaces producing iron from iron ore also produce a molten slag that at one time was considered a waste product That slag can now be recycled into ground-granulated blast-furnace slag cement by grinding the iron blast furnace slag to cement fineness
NewCem produced by Lafarge Corporation was the product that the local vendors referenced when they provided price quotes NewCem is manufactured locallyregionally at Sparrows Point Maryland and therefore would contribute to localregional material points in the Leadership in Energy and Environmental Design (LEEDtrade) certification process NewCem is a finely ground granulated blast-furnace slag manufactured from the byproduct of an iron blast furnace It is made to meet the specification requirements of Grade 120 concrete which ensures high uniform strengths The specifications allow for the slag blend to be from 25 to 70 of the total cementitious materials
Some of the benefits that have been noted for slag cement mixes include improved workability and pumpability for the unhardened concrete For the hardened concrete using slag content increases the 28-day strength reduces permeability and heat of hydration increases sulphate resistance and controls the alkali silica reaction During hot weather slag concrete set times are lengthened and during cold weather the impact on set time had one of the local vendors stating that they did not use it during the winter
Sales representatives at several Baltimore area vendors provided price quotes of ready-mix concrete Table E-5 shows the ranges quoted by the vendor for the estimated retail price and shows the values used in the calculations Note that not all the vendors that offered 100 portland cement concrete also offered concrete with slag content The cost variances are due to the different vendors rather than product variations In addition to vendor quotes Lafarge Corporation the manufacturer of the NewCem product being quoted by the vendors was contacted Lafarge explained that initially concrete made with the NewCem mix was much cheaper but increases in product demand resulted in very little cost difference between 100 portland cement and NewCemportland cement mixes The purchase of slag content concrete depends on local availability The prices will vary based on current demand and availability of the product
E-7
Table E-5 Prices for Concrete
Concrete Type Price Per
Cubic Yard Price Range Assumed for the Calculations
100 portland cement concrete $6395 - $85
Quote 1 $6395
Quote 2 $85
Quote 3 $6710
Quote 4 $78
Quote 5 $6450
Slag content $6345 - $85
Quote 1 (25 NewCem) $6345
Quote 2 (50 NewCem) $85
Quote 3 (mix not specified) $6710
Using the values in Table E-5 the material costs for 250 yd3 of concrete are as follows (assuming 196 adder for sales tax contractor bonds and insurance profit and overhead and general conditions based on the Timberline model)
100 Portland Cement Concrete Least expensive quote = 250 yd3 x $6395 yd3 = $1598750 Cost including adder = $1598750 x 1196 = $1912105 Most expensive quote = 250 yd3 x $85yd3 = $21250 Cost including adder = $21250 x 1196 = $25415 Price range = $1912105 to $25415
Slag Content Concrete Least expensive quote = 250 yd3 x $6345yd3 = $1586250 Cost including adder = $1586250 x 1196 = $1897155 Most expensive quote = 250 yd3 x $85yd3 = $21250 Cost including adder = $21250 x 1196 = $25415 Price range = $1897155 to $25415
The differences between 100 portland cement and slag content cement are as follows The difference per cubic yard of concrete ranges from $6395 ndash $6345 = -$050 (concrete with slag content costing $050 less than 100 portland cement concrete) to $85 - $85 = $0 or no cost difference between the two products The range of the total first cost difference is ($1912105 shy$1897155) = -$14950 to ($25415 - 25415) = $0 or no cost difference By dividing by 20000 ft2 of building floor space the difference in first cost is -$7481000 ft2 to $01000 ft2
Taking the highest and lowest cost differences and the total cost differential the following summarizes this sustainable design feature
bull Sustainable design feature concrete with slag content bull Incremental first cost ($unit) -$050 to $0 bull Incremental cost ($1000 ft2) -$748 to $0
E-8
Documentation of Costs of Concrete with Fly Ash Content
Based on estimates provided by vendors 250 yd3 of 3000 psi concrete would be needed for the 20000-ft2 office building The baseline product is concrete made from 100 portland cement The sustainable design option is concrete with a mix of portland cement and fly ash Fly-ash-content concrete is not readily available in Baltimore typically it is only available on the West Coast However the summary in this section includes fly-ash-content cement to compare products and prices
Concrete is traditionally made using 100 portland cement aggregate and water Concrete made with portland cement has well-established mixing and setting properties and therefore does not require any extra instruction for use on a construction site Concrete with fly ash means that some portion of the portland cement was replaced with fly ash Fly ash was first used in the United States to reduce the quantity of portland cement needed for the Hoover Dam in 1929 Fly ash is a fine powder recovered from coal-fired electric power generation Millions of tons of fly ash are produced every year by US power plants Two types of fly ash are generated in the US Class C and Class F Class C produced from Western coal (low sulfur) is the one most typically used for structural concrete because it has a higher percentage of calcium oxide Class F is produced from Eastern coal3
Using concrete with fly ash content has the following qualitative benefits
bull Uses a waste product as a material eliminating the fly ash from being sent to a landfill bull Requires less water bull Has lower embodied energy than portland cement material bull Is less likely to crack because it uses less water decreasing replacement costs bull Is easier to use in cold weather than 100 portland cement bull Has workability advantages bull Offers water retention advantages bull Offers strength advantages depending on the recipe and set time bull Reduces the risk of expansion because of sulfate attack
The following are some issues to consider when using fly-ash-content concrete
bull Smaller contractors may not be familiar with the product potentially resulting in higher labor costs
bull Fly ash is generated at a variety of sources therefore the mineral makeup of the product is not 100 consistent which could potentially result is quality control issues
bull If used as a complete replacement for portland cement fly-ash content has issues related to freezethaw performance and a tendency to effloresce
bull Because of requirements in the Clean Air Act some coal-fired electric power plants are generating a high-carbon fly ash that has to be reprocessed before it can be used as a replacement for portland cement This could potentially result in less availability of fly ash in the future
3 May 7 2002 ToolBase Services (see httpwwwnahbrcorgtertiaryRaspTrackID=ampDocumentID=2072ampCategoryID=72)
E-9
Table E-6 summarizes the costs for 100 portland cement concrete and concrete containing 20 fly ash as encouraged by the EPAs Affirmative Procurement Program These costs are representative of cement walls andor flooring for a 3000 psi mix delivered to the construction site
Table E-6 Prices for Concrete
Concrete Type Price Per
Cubic Yard
100 portland cement concrete $6875
Fly ash content $6775
Only one price quote is offered to show as a comparison of fly ash costs vs slag vs 100 portland cement The baseline price quote is from a West Coast vendor of ready-mix concrete Several other vendors were contacted and although they wouldnt provide a price quote they stated that the 100 portland cement and 20 fly-ash-content concrete cost the same All of the West Coast vendors contacted explained that initially concrete made with fly-ash content was much cheaper but because of increases in demand for the product and changes in availability of quality fly ash very little cost difference exists between 100 portland cement and fly ashportland cement mixes The purchase of fly-ash-content concrete depends on local availability The prices will vary based on current demand and availability of the product
Using the values in Table E-6 the material costs for 250 yd3 of concrete are as follows (assuming 196 adder for sales tax contractor bonds and insurance profit and overhead and general conditions based on the Timberline model)
100 Portland Cement Concrete Concrete cost = 250 yd3 x $6875yd3 = $1718750 Cost including adder = $1718750 x 1196 = $2055625
20 Fly-Ash-Content Concrete Least expensive quote = 250 yd3 x $6775yd3 = $1693750 Cost including adder = $1693750 x 1196 = $2025725
The differences between 100 portland cement and 20 fly-ash-content cement are as follows The difference per cubic yard of concrete ranges from $6775 to $6875 = -$100 (concrete with fly ash content costs $1 less than 100 portland cement concrete) The range of the total first cost difference is $2025725 - $2055625 = -$299 By dividing by 20000 ft2 of building floor space the difference in first cost is -$14951000 ft2
Taking the highest and lowest cost differences and the total cost differential the following summarizes this sustainable design feature
bull Sustainable design feature concrete with fly ash bull Incremental first cost ($unit) -$100 bull Incremental cost ($1000 ft2) -$1495
E-10
Documentation of Costs of Carpet with Recycled Content
Based on cost estimates from the Timberline model the 20000-ft2 office building has 2000 yd2 of interior carpet A range of environmentally preferable carpet products is currently available on the carpet market Product examples include refurbished used carpet and new carpet made from old carpet and carpet scraps carpet backing auto parts soda bottles and flooring materials For this study a simple comparison was conducted of carpet made from 100 virgin material versus carpet with recycled content The percentage of recycled content and the source of the recycled content are not specified for this comparison because the products of similar quality vary so dramatically in design but the costs do not vary as significantly The EPA through the Comprehensive Procurement Guideline encourages the purchase of carpet with recycled content when it is available doesnt compromise quality and is cost effective
Eight national and Baltimore area carpet vendors were contacted for prices on products Only two of the vendors provided a complete set of prices for different carpet styles The installation prices include the cost of adhesives
CampA Floorcoverings Habitat and Ecotone products are both solution-dyed nylon which is fade resistant and has the same maintenance requirements as typical carpet Both of these products are about 82 recycled content by weight Explorer Expedition and Wayfarer carpets are typical contractor-grade carpets that are also solution-dyed and are manufactured with 100 new face yarn and a recycled backing (resulting in about 31 recycled content by weight) Product pricing for products made with 100 virgin materials was not available because all of CampA Floorcoverings carpet backing has recycled content
The sales representative at the Carpet Fair Commercial Division was not aware of any products made with recycled content and therefore only offered quotes for carpets with virgin material The sales representative at Dupont Flooring Systems stated that the product cost differences are the result of performance requirements patterns color etc rather than whether a product has recycled content
Mohawk Commercial Carpet produces a wide variety of both recycled content and virgin content carpets Their recycled content carpets are made of nylon that can be recycled into carpet again and the products that were discussed also are made with nonlatex-based backing The sales representative provided prices for both patterned and nonpatterned solution-dyed carpets which are fade resistant The sales representative said that the general rule of thumb for Mohawk carpets is that equivalent quality carpet made of virgin materials usually costs about $1yd2 more than the recycled content carpet Maintenance requirements for the recycled content versus virgin content carpet do not differ
Table E-7 lists the price of carpet made from virgin materials and from recycled materials The calculations assumed the midpoint of the price range to offer a conservative comparison of the products
E-11
Table E-7 Prices for Recycled Content and Virgin Carpet
Carpet Type
Price Per Square
Yard
Price Per Square Yard
Installed
Price Assumed for the
Calculations
Percentage Recycled Content
CampA Floorcoverings
Habitat $1880 $2880-$3080 $2980 82
Ecotone $1995 $2995-$3195 $3095 82
Explorer $2200 $3200-$3400 $3300 31
Expedition $2400 $3400-$3600 $3500 31
Wayfarer $2600 $3600 $3600 31
Carpet Fair Commercial Division
Broadloom 100 virgin nylon carpet
NA $1800-$2000 $1900 0
Virgin carpet tiles NA $2300-$2600 $2450 0
Dupont Flooring Systems
Recycled content face yarn and backing
NA $3500 $3500 30-80
Carpet made with virgin materials
NA $3500 $3500 0
Mohawk Commercial Carpet
Performer 28 (no pattern) $1200-$1600 $1800-$2200 $2000 0
Collegiate (no pattern budget carpet)
$600-$1000 $1400-$1800 $1600 0
Surreal (no pattern) $1200-$1600 $1800-$2200 $2000 50
Virgin patterned carpet $1800-$2200 $24-$28 $2600 0
Graphic Edge (pattern) $1200-$1600 $1800-$2200 $2000 50
Maritage Collection (4 to 5 products with pattern)
$1700-$2100 $2300-$2700 $2500 50
Tracks (pattern) $1300-$1700 $1900-$2300 $2100 50
Feathergrid (pattern) $1300-$1700 $1900-$2300 $2100 50
Structures (pattern) $1300-$1700 $1900-$2300 $2100 50
NA = not available
Using the values in Table E-7 the material costs for carpeting 2000 yd2 of floor space in the 20000shyft2 office building are as follows (assuming 196 adder for sales tax contractor bonds and insurance profit and overhead and general conditions based on the Timberline model) with Habitat carpet
Product cost = 2000 yd2 x $2980yd2 = $59600 Full cost (inc adder) = $59600 x 1196 = $71282
E-12
Using the same calculation procedure the full costs (inc adder) for the other products are as follows
bull Ecotone $74032 bull Explorer $78936 bull Expedition $83720 bull Wayfarer $86112 bull Broadloom 100 virgin nylon carpet $45448 bull 100 virgin carpet tiles $58604 bull Recycled content face yarn and backing $83720 bull Carpet made with 100 virgin materials $83720 bull Performer 28 (no pattern) $47840 bull Collegiate (no pattern budget) $38272 bull Surreal (no pattern) $47840 bull Virgin patterned carpet $62192 bull Graphic Edge (pattern) $47840 bull Maritage Collection (4 to 5 products pattern) $59800 bull Tracks Feathergrid and Structures (pattern) $50232
The difference between Habitat and the 100 virgin carpet (broadloom) is as follows The difference per square foot for the installed carpet is $2980 - $19 = $1080 The total first cost difference is $7128160 - $45448 = $2583360 or by dividing by 20000 ft2 of building floor space the difference in first cost is $1291681000 ft2
Using the same calculation procedure a comparison of the first cost of Habitat to the others is as follows
bull Habitat compared with 100 virgin carpet tiles $633881000 ft2
bull Habitat compared with carpet made with 100 virgin materials -$621921000 ft2
bull Habitat compared with Performer 28 $1172081000 ft2
bull Habitat compared with Collegiate (budget) $1650481000 ft2
bull Habitat compared with virgin patterned carpet $454481000 ft2
The differences between Ecotone and the 100 virgin carpets are as follows
bull Ecotone compared with broadloom 100 virgin nylon carpet $142922 per 1000 ft2
bull Ecotone compared with 100 virgin carpet tiles $771421000 ft2
bull Ecotone compared with carpet made with 100 virgin materials -$484381000 ft2
bull Ecotone compared with Performer 28 $1309621000 ft2
bull Ecotone compared with Collegiate (budget) $1778021000 ft2
bull Ecotone compared with virgin patterned carpet $592021000 ft2
The differences between Explorer and the 100 virgin carpet products are as follows
bull Explorer compared with broadloom 100 virgin nylon carpet $1674401000 ft2
bull Explorer compared with 100 virgin carpet tiles $1016601000 ft2
bull Explorer compared with carpet made with 100 virgin materials -$239201000 ft2
bull Explorer compared with Performer 28 $1554801000 ft2
E-13
bull Explorer Compared with Collegiate (budget) $2033201000 ft2
bull Explorer Compared with virgin patterned carpet $837201000 ft2
The differences between Expedition and the 100 virgin carpet products are as follows
bull Expedition compared with broadloom 100 virgin nylon carpet $1913601000 ft2
bull Expedition compared with 100 virgin carpet tiles $1255801000 ft2
bull Expedition compared with carpet made with 100 virgin materials $01000 ft2
bull Expedition compared with Performer 28 $1794001000 ft2
bull Expedition compared with Collegiate (budget) $2272401000 ft2
bull Expedition compared with virgin patterned carpet $1076401000 ft2
The differences between Wayfarer and the 100 virgin carpet products are as follows
bull Wayfarer compared with broadloom 100 virgin nylon carpet $2033201000 ft2
bull Wayfarer compared with 100 virgin carpet tiles $1375401000 ft2
bull Wayfarer compared with carpet made with 100 virgin materials $119601000 ft2
bull Wayfarer compared with Performer 28 $1913601000 ft2
bull Wayfarer compared with Collegiate (budget) $2392001000 ft2
bull Wayfarer compared with virgin patterned carpet $1197501000 ft2
The differences between recycled content face yarn and backing and the 100 virgin carpet products are as follows
bull Recycled content face yarn and backing compared with broadloom 100 virgin nylon carpet $1913601000 ft2
bull Recycled content face yarn and backing compared with 100 virgin carpet tiles $1255801000 ft2
bull Recycled content face yarn and backing compared with carpet made with 100 virgin materials $01000 ft2
bull Recycled content face yarn and backing compared with Performer 28 $1794001000 ft2
bull Recycled content face yarn and backing compared with Collegiate (budget) $2272401000 ft2
bull Recycled content face yarn and backing compared with virgin patterned $1076401000 ft2
The differences between Surreal and the 100 virgin carpet products are as follows
bull Surreal compared with broadloom 100 virgin nylon carpet $119601000 ft2
bull Surreal compared with 100 virgin carpet tiles -$538201000 ft2
bull Surreal compared with carpet made with 100 virgin materials -$1794001000 ft2
bull Surreal compared with Performer 28 $01000 ft2
bull Surreal compared with Collegiate (budget) $478401000 ft2
bull Surreal compared with virgin patterned carpet -$717601000 ft2
The differences between Graphic Edge and the 100 virgin carpet products are as follows
bull Graphic Edge compared with broadloom 100 virgin nylon carpet $119601000 ft2
bull Graphic Edge compared with 100 virgin carpet tiles -$538201000 ft2
bull Graphic Edge compared with carpet made with 100 virgin materials -$1794001000 ft2
bull Graphic Edge compared with Performer 28 $01000 ft2
E-14
bull Graphic Edge compared with Collegiate (budget) $478401000 ft2
bull Graphic Edge compared with virgin patterned carpet -$717601000 ft2
The differences between the Maritage Collection and the 100 virgin carpet products are as follows
bull Maritage Collection compared with broadloom 100 virgin nylon carpet $717601000 ft2
bull Maritage Collection compared with 100 virgin carpet tiles $59801000 ft2
bull Maritage Collection compared with carpet made with 100 virgin materials -$1196001000 ft2
bull Maritage Collection compared with Performer 28 $598001000 ft2
bull Maritage Collection compared with Collegiate (budget) $1076401000 ft2
bull Maritage Collection compared with virgin patterned carpet -$119601000 ft2
The differences between Tracks Feathergrid and Structures and the 100 virgin carpet products are as follows
bull Tracks Feathergrid and Structures compared with broadloom 100 virgin nylon carpet $239201000 ft2
bull Tracks Feathergrid and Structures compared with 100 virgin carpet tiles -$418601000 ft2
bull Tracks Feathergrid and Structures compared with carpet made with 100 virgin materials -$1674401000 ft2
bull Tracks Feathergrid and Structures compared with Performer 28 $119601000 ft2
bull Tracks Feathergrid and Structures compared with Collegiate (budget) $598001000 ft2
bull Tracks Feathergrid and Structures compared with virgin patterned carpet -$598001000 ft2
Taking the highest and lowest per square yard differences and the total cost differential the following summarizes this sustainable design feature
bull Sustainable design feature recycled content carpet bull Incremental first cost ($yd) -$15 to +$20 bull Incremental cost ($1000 ft2) -$179400 to +$239200
Documentation of Costs of Certified Wood Options
The following baseline materials would be replaced with certified wood products
bull 72 wood doors 3 ft x 6 ft 8 in x 1 frac34 in 5-ply particle core with birch faces (stained) bull 3060 linear feet of vinyl baseboard trim
A certified wood product is a product that originates from a forest that has been certified as well managed Typically certified wood products are labeled by one of the organizations that set the standards for responsible forest management There are two international certified wood product standards organizations ndash Forest Stewardship Council and the International Standards Organization ndash and four North American organizations ndash American Tree Farm System Canadian Standards Association International Forest Stewardship Council and Sustainable Forestry Initiative
Certification provides an independent assurance that a forestry operation meets the standards set by the certification organization The standards look for environmentally socially and economically
E-15
responsible management practices that ensure the long-term health and productivity of forests for timber production wildlife habitat water quality and community employment
Acquiring cost-competitive certified wood products for a construction project might require considerable lead-time depending on the product To acquire the quotes provided in Table E-8 (cost of doors) and Table E-9 (cost of baseboard trim) local vendors of doors and baseboard were asked about the baseline product as well as certified wood products Most of the vendors who sell typical contractor-grade products were not able to provide accurate information about certified wood products
Table E-8 Costs of Doors
Door Type Price Per Door Product Description
Certified wood doors
Quote 1 $192-$200 Particle board core
Quote 2 $168-$176 Particle board core
Quote 3 $175-200 Particle board core
Quote 4 $250-$300 Solid pine
Quote 5 $400 Solid hardwood
Traditional wood doors
Quote 1 $160 Particle board core
Quote 2 $160 Particle board core
Quote 3 $165 Particle board core
Quote 4 $372 Solid birch
Quote 5 $300-400 Solid birch
The Sustainable Forest Products Resource ForestWorld Marketplace4 and the Certified Forest Products Council5 were the easiest sources of information regarding available certified wood products The certified wood products vendors stated that the price and quality of certified wood products depended dramatically on how much time they have to locate the desired product
Note that the baseline for the building assumes particle core doors If certified wood particle core doors replace the baseline doors it is possible that action would not meet the LEED requirements for getting a certified wood credit The particle core doors are made with a very small quantity of certified wood (5 to 10 of the door) most of the door is made from recycled content Therefore solid wood doors were also considered in this analysis
Using the range of values in Table E-8 and E-9 (excluding the data for the solid mahogany doors) the material cost for replacing 72 contractor-grade 3 ft x 7 ft x 1 frac34 in 5-ply particle core door with birch faces with certified wood products is as follows (assuming 196 adder for sales tax contractor bonds and insurance profit and overhead and general conditions based on the Timberline model)
4 Available at httpwwwforestworldcom 5 Available at httpwwwcertifiedwoodorg
E-16
Table E-9 Baseboard Trim
Trim Type Price Per
Linear Foot Product Description
Certified wood baseboard trim
Quote 1 $150 Ash
Quote 2 $113 Willow
Quote 3 $159 Oak
Vinyl trim
Quote 1 $0356 Black
Quote 2 $0383 Brown
Quote 3 $0407 Off-white
Quote 4 $250 Polyurethane molding
Quote 5 $082 Rubber back
Quote 6 $080-$1 Vinyl trim installed
Quote 7 $1-12 Vinyl-rubber blend installed
Wood trim
Quote 1 $049 Ranch pine
Quote 2 $118 Wood molding
The material cost for the contractor-grade 5-ply particle core door is as follows
Product cost = 72 doors x $160 to $165door = $11520 to $11880 Full cost (inc adder) = $11520 to $11880 x 1196 = $13778 to $14208
Using the same approach the full cost ranges (inc adder) of the other products are as follows
bull Certified wood particle core door $14467 to $17222 bull Contractor-grade solid door $25834 to $34445 bull Certified solid wood door $21528 to $34445
The differences between the contractor-grade particle core door and the certified wood products are as follows
Contractor-Grade 5-ply Particle Core Door Compared with Certified Wood Particle Core Door The difference per door is ($160 to $165door) - ($168 to $200door) = -$8 to $40door The total first cost difference is ($13778 to $14208) - ($14467 to $17222) = $259 to $3444 or by dividing by 20000 ft2 of building floor space the difference in first cost ranges from $1295 to $172201000 ft2
Solid Wood Door Compared with Certified Solid Wood Door The difference per door is ($300 to 400door) - ($250 to $400door) = -$150 to $100door The total first cost difference is ($25834 to $34445) - ($21528 to $34445) = -$12917 to $8611 or by dividing by 20000 ft2 of building floor space the difference in first cost ranges from -$64585 to $430551000 ft2
E-17
Taking the highest and lowest differences and the total cost differential Table E-10 summaries this sustainable design feature
Table E-10 Summary of Certified Wood Options
Sustainable Design Feature
Incremental First Cost
($ per unit) Incremental Cost
($1000 ft2)
Certified wood particle core door vs contractor-grade particle core door
$3 to $40 $1295 to $17220
Certified wood solid wood door vs solid wood door
-$150 to $100 -$64585 to $43055
The assumed baseline material is 3060 linear feet of vinyl baseboard trim with alternative certified wood products being solid ash willow and oak baseboard trim The differences in product quality appearance and durability have not been included in the cost comparisons Noncertified wood trim first costs were also gathered to offer a more equivalent comparison from a product quality perspective
Using the range of values in Table E-9 (excluding quotes 4 through 7 because they offer higher-end products or included installation costs) the material cost for replacing 3060 linear feet of vinyl baseboard trim with certified wood products is as follows (assuming 196 adder for sales tax contractor bonds and insurance profit and overhead and general conditions based on the Timberline model)
The material cost for the contractor-grade vinyl baseboard trim is as follows
Product cost = 3060 linear feet x $0356 to $0407linear foot = $1089 to $1245 Full cost (inc adder) = $1089 to $1245 x 1196 = $1302 to $1489
Using the same calculation approach the full costs (inc adder) for the other products are as follows
bull Contractor-grade wood baseboard trim $1793 to $4319 bull Certified wood baseboard trim $4136 to $5819
The difference between the contractor-grade vinyl baseboard trim and the certified wood baseboard trim is as follows The difference per linear foot of vinyl trim is ($0356 to $0407linear foot) shy($113 to $159linear foot) = $072 to $123linear foot The total first cost difference is ($1302 to $1489) - ($4136 to $5819) = $2647 to $4517 or by dividing by 20000 ft2 of building floor space the difference in first cost ranges from $13235 to $225851000 ft2
The comparison between the contractor-grade solid wood baseboard trim and the certified wood baseboard trim yields a range of -$915 to $201301000 ft2
E-18
Appendix F Detailed Discussion of Research Studies on Occupant Health Comfort and Productivity1
This appendix provides details on the studies reviewed for Section 26 (Lower Absenteeism and Improved Productivity) and Section 3 (The Social Benefits of Sustainable Design) The studies deal with indoor air quality (Section F1) and other sustainable design practices (Section F2)
Indoor Air Quality
This section describes the studies reviewed on increased ventilation effectiveness low-emitting materials indoor chemical and pollutant source control controllability of systems thermal conditions daylight and views and potential problems with daylight and windows
Increased Ventilation Effectiveness
Increased ventilation effectiveness includes strategies such as natural ventilation increased air change rate increased volume of outdoor air and increased air filtration The health benefits productivity benefits and comfort and satisfaction of such strategies are discussed below
Health Benefits
Many large-scale building studies show that increased volumes of outdoor air natural ventilation air ventilation rates and filtration of air and improved cleaning and maintenance of systems are correlated with reduced sick building syndrome (SBS) symptoms as well as reduced allergy and asthma symptoms and transmission of infections diseases (Brightman and Moss 2000 Fisk 2001) Most of the studies cited in the literature are surveys and do not include information on how frequently windows are opened by the workers in naturally ventilated buildings Therefore it is not known whether positive impacts are due to psychological factors (eg control) or to actual increases in fresh air Further in areas where outdoor air has high levels of pollutants or allergens indoor air quality may actually be compromised For instance a study in Norway found that nurses experienced more eye irritation in hospitals near roads with heavy traffic because of the increased dust settlement rates (Smedbold et al 2001)
A controlled field experiment by Wargocki et al (2000) in Denmark found that increasing ventilation rates beyond minimum levels prescribed in standards is associated with reduced symptoms Three outdoor air change rates were studied 06 2 or 6 air changes (AC)hr (corresponding to 3 10 or 30 liters (L)personhr) Temperature and humidity were kept constant at 72ordmF and 40 relative humidity The researchers found that the workers felt better and had fewer symptoms as ventilation rates increased The workers also perceived the air as fresher
A study of 3720 employees in 40 buildings also found reduced symptoms and lower absenteeism in buildings with higher ventilation rates (Milton et al 2000) The high ventilation rate was about 50 cubic feet per minute (cfm)person outdoor air compared with a moderate rate of 25 cfmperson (This corresponds to 12 Lpersonhr and 24 Lpersonhr these data are very consistent with the Wargocki et al [2000] study) Milton et al (2000) estimated the cost of sick leave as $480personyr
1 This appendix was written by J Heerwagen Pacific Northwest National Laboratory
F-1
Productivity Benefits
Performance assessments in work settings are rare because of the difficulty of capturing actual performance measures and linking them to specific environmental features Nonetheless a field experiment in Denmark shows that workers performed better on a typing task and perceived themselves as able to think more clearly with increased ventilation (Wargocki et al 2000) A field experiment by Nunes et al (1993) looked at the link between SBS symptoms associated with ventilation rates and work performance They found that workers reporting SBS symptoms worked 72 more slowly on a vigilance task and made 30 more errors on a numerical task
Other studies have assessed self-ratings of productivity Based on a study of 40 buildings in the United Kingdom occupants in naturally ventilated or mixed-mode buildings rated their perceived productivity significantly higher than occupants of air-conditioned buildings (Leaman and Bordass 2001) Similar results were found in a study by Rowe et al in Australia where workers in mixed-mode buildings rated their work performance higher (cited in Leaman and Bordass 2001)
Comfort and Satisfaction
Workers prefer spaces with operable windows compared with completely mechanically ventilated and conditioned spaces except in hot summer weather (Leaman and Bordass 2001) In the Wargocki et al (2000) study cited above workers were more satisfied with the air quality and rated the air as fresher with increased ventilation from 06 AChr to 6 AChr
Low-Emitting Materials
The vast majority of research on materials emissions has been conducted in specialized facilities and cannot be generalized to office environments However as discussed below some field studies provide data on occupant health and productivity benefits
Health Benefits
Brightman and Moss (2001) in a review of large-scale studies of SBS in Europe and the United States identify carpet as a key risk factor in SBS Other building factors that show mixed findings (some show increases in symptoms others do not) are total volatile organic compounds (VOCs) fleecy materials and formaldehyde (Work and personal factors affecting symptom occurrence include stress history of allergy high use of photocopy machines and high level of paper work) A field intervention by Pejtersen et al (2001) compared symptoms in a newly renovated area of a building with a control group who did not experience the renovation The upgrades included renovating the HVAC system and replacing the carpet with a low-emitting vinyl floor material The researchers found significantly improved perceptions and reduced illness symptoms in the renovated space It is not known however to what extent the improvements were due to the HVAC system or to changes in the floor materials
Productivity Benefits
A field simulation study testing the effects of a 25-year-old carpet on work performance found that when the carpet was absent performance increased on a variety of clerical as well as complex cognitive tasks requiring mental effort and high attention including logical thinking arithmetic and vigilance (Wargocki et al 2000) The authors attribute this to airborne particulates although the exact mechanisms by which particulates might affect cognitive functioning are not discussed
F-2
Indoor Chemical and Pollutant Source Control
Relatively little work has been done on controlling indoor chemicals and pollutant sources No studies were found on productivity or comfort and only two studies on health impacts were found For instance a Danish experimental office study found an increase in eye and skin irritations in an office with computers laser printers and a photocopier than an office without the technologies The office with the equipment was found to have higher levels of ozone respirable particulates and VOCs (Wolkoff et al 1992) Brown (1999) also found that emissions from dry-process photocopiers increased when temperatures increased from 73ordmF to 90ordmC and that particle emissions occurred when the copier was idle and copying Numerous other studies cited in Hedge (2000) noted that SBS problems increase for workers with high computer use
Controllability of Systems
A growing body of literature in building science and health care underscores the psychological functional and health benefits of having some degree of control over the physical environment including ventilation temperatures lighting and privacy The health benefits productivity benefits and comfort and satisfaction from such controls are discussed below
Health Benefits
A field study of an air filtration system integrated into the office furniture system at the breathing zone in a Canadian government building found lower levels of symptoms and reduced absenteeism rates compared with a control floor that did not have the system (Hedge et al 1993)
A study of 11000 workers in the Netherlands by Preller et al (1990) found that absenteeism due to SBS is likely to be 34 lower when workers have control over their thermal conditions A field study of a furniture-integrated breathing zone system in a Canadian government office building found reduced absenteeism and lower levels of symptoms than a control floor in the same building without the system (Hedge et al 1993)
Productivity Benefits
Studies have documented increases in work performance on various tasks when occupants have some degree of control over temperature andor ventilation conditions at their workstations (Kroner et al 1992 Wyon 1996) Kroner et al (1992) used organizational performance data to assess the impact of personal control over temperature and ventilation at the workstation level and concluded that the control system increased productivity by 3
Drawing on a review of research on indoor air quality and thermal conditions Wyon (1996) estimated that providing workers with temperature control of just three degrees (plus or minus) would result in performance increases of 7 for typical clerical tasks 27 for logical thinking tasks 3 for skilled manual work and 86 for very rapid manual work
A large-scale office study in England also shows that personal control over the environment (as measured by a summary of ratings of perceived control over lighting noise temperatures and ventilation) was one of four key factors affecting occupantsrsquo perceived productivity at work (Leaman and Bordass 2001) Of these controls the most important was control over noise and the least important was control over lighting The authors also conclude that personal control is less important to workers when ambient conditions are comfortable and when building managers respond promptly to discomfort complaints
F-3
Comfort and Satisfaction
There is evidence that people are more tolerant of conditions the more control opportunities they have regardless of whether they choose to use the control (Leaman and Bordass 2001) Overall comfort and satisfaction also increases with personal control over ventilation and temperatures (Kroner et al 1992 Brager and deDear 2000)
Thermal Conditions
The literature on thermal comfort in buildings is voluminous (for instance see deDear et al 1993) No attempt is made here to provide a detailed review of this research much of which focuses on comfort Key findings from the literature show the following
bull Thermal discomfort is common in buildings bull Temperature conditions influence symptoms associated with SBS bull Performance impacts of thermal conditions depend on the nature of the tasks as well as on
personal factors
The health benefits productivity benefits and comfort and satisfaction from thermal conditions in buildings are discussed below
Health Benefits
Elevated temperatures are associated with increases in illness symptoms (Wyon 1996 2000) As researchers systematically increased indoor temperatures from 68ordmF to 762ordmF they found increased incidents of headache and other SBS symptoms Wyon (1996) also reports increased incidence of headache and fatigue as indoor temperatures increase from 68oF to 76oF At 76oF 60 of the workers experienced headache compared with 10 at 68oF
An extensive review of the epidemiological literature found that dampness (a thermal comfort factor) in buildings increases the risks of respiratory symptoms (cough wheezing and asthma) as well as other symptoms such as tiredness headache and respiratory infections (Bornehag et al 2001) Unfortunately the studys data are from worker surveys and do not include actual moisture levels or sources of the problem
Performance Benefits
Although discomfort is believed to negatively affect productivity the relationship is complex and is related to the nature of the work itself time of day and personal factors such as pre-existing medical conditions (Wyon 1996 2000) For instance performance on creative and memory tasks is higher when temperatures are slightly elevated However performance decreases on tasks requiring concentration and logical thinking tasks when temperatures are slightly elevated Performance on these types of tasks is better when temperatures are slightly cool
Comfort and Satisfaction
Numerous studies in the United States and elsewhere have consistently shown high levels of dissatisfaction and high variability in comfort for any given thermal condition (Heerwagen and Diamond 1992 Leaman and Bordass 2001) Given the high range of variability in comfort the ability to control temperatures and ventilation at the workstation level may be the single most effective way of increasing thermal comfort (Wyon 1996)
F-4
In a study of the costs of dealing with discomforts Federspiel (2000) estimates that efforts to increase comfort could result in a 12 decrease in labor costs of responding to complaints His data show that it takes 14 hours on average to diagnose a hot complaint and 17 hours to diagnose a cold complaint His data also suggest that complaints are not due to differences among individuals but rather to HVAC faults or poor control performance
Daylight and Views
It has long been known that people prefer to be in spaces with windows and daylight (Collins 1975) However it is only recently that researchers have begun to investigate the health and productivity impacts of daylight and views The following summarizes the research on daylight and views
bull Daylight and sun penetration may have positive benefits on health bull The benefits of views depend to a large extent on the view itself (eg degree of naturalness and
distance of the view) bull Although there is little evidence for direct impacts on work performance window views have
been found to influence a number of mental processes that are associated with performance on complex cognitive tasks
The health benefits productivity benefits and comfort and satisfaction from daylight and views in buildings are discussed below
Health Benefits
A field study of lighting conditions in a government office building in England found that headache incidence decreased significantly with increased access to daylight (Wilkins et al 1989) People who suffer from Seasonal Affective Disorder (SAD) may also benefit from access to daylight Because people with SAD prefer more brightly lighted spaces than people who do not suffer from seasonal variation in mood and well-being being adjacent to a window where light levels are higher than interior spaces may have therapeutic effects (Heerwagen 1990) Although daylight design generally tries to reduce or eliminate the penetration of direct sunlight into buildings a modest level of sunlight (sun spots) may be beneficial to health and well-being
Two studies are cited in a report prepared by Johns Hopkins researchers on the connection between the built environment and patient outcomes (Rubin et al 1998) One study compared the length of stay for 174 patients with depression who were randomly assigned to a sunny or dull hospital room (Beauchemin and Hays 1996) Those in the sunny rooms stayed an average of 169 days compared with 195 days for patients in the rooms without sun The results held true regardless of season Another healthcare study cited in the Johns Hopkins report found that differences in exposure to natural sunlight affected the serum OH-D concentrations in long-term geriatric patients (Lamberg-Allardt 1984) There is also reason to believe that access to high daylight levels and sunlight for at least part of the day would be beneficial to persons suffering from SAD (Heerwagen 1990) Daylight and sunlight patches indoors have been found also to enhance emotional functioning as long as the sunlight does not increase glare or temperature discomfort (Boubekri et al 1991 Leather et al 1998)
Physical benefits of windows and views (especially views of nature) include stress reduction and recovery from illness In a study of patients recovering from hospital surgery Ulrich (1984) found that those who had a view of a natural landscape recovered faster and spent fewer days in the
F-5
hospital than matched control patients who viewed an adjacent wing of the hospital Although similar studies have not been conducted in work settings other research cited above clearly indicates that nature views have positive impacts on stress recovery In a field study of office workers Kaplan (1992) found that workers with window views of nature felt less frustrated and more patient and reported more overall life satisfaction and better health than workers who did not have visual access to the outdoors or whose view consisted of built elements only When deprived of windows people report more negative moods and a loss of contact with the outdoor world especially loss of connection to time and weather (Collins 1975 Heerwagen and Orians 1986)
Productivity Benefits
The only current data available on the impact of daylight and views on performance are from a large-scale study of the link between daylight design and test performance in schools (Heschong-Mahone Group 1999) The study found that children scored higher on test scores in schools with the best daylight design However many other building factors may have influenced these outcomes Thus the results should be taken as preliminary until additional research support is found
Studies of window views show that people perform better on tasks requiring focused attention (such as proofreading) when they have views of nature compared with views of buildings or windowless conditions (Hartig et al 1991) Window views may be especially effective in providing micro rest breaks of a few minutes or less Micro rest breaks have positive impacts on performance and attention (Zijlstra et al 1999)
Although full spectrum electric light is widely believed to have benefits similar to daylight no scientific evidence exists for this claim A major review of the research in this area by Veitch and McColl (1994) found no indications that full spectrum fluorescent lighting was associated with any increases in psychological well-being health or productivity
Comfort and Satisfaction
Numerous office studies in the United States England and Europe have found increased satisfaction levels with increases in daylight (Collins 1975 Heerwagen and Diamond 1991 Leaman and Bordass 2001) Although most research on windows has focused on views the size and location of windows also matters A series of studies by Butler and Biner (1989) shows that the preferred size shape and location of windows are functions of the specific space under consideration People prefer larger windows in settings for relaxation and smaller windows in settings where privacy is desired (eg bedrooms and bathrooms)
Potential Problems with Daylight and Windows
Although windows and daylight have numerous benefits as identified above they also have the potential to create discomfort and distractions when not properly designed Office studies in the United States and elsewhere have consistently found that workers are bothered by glare from windows and this is especially problematic for computer work These problems are resolved to a great extent using flat screen computers and indirect lighting (Hedge et al 1995) The absence of sunlight controls also increases the potential for heat stress Heat reflective glazing and shading devices do not fully resolve these difficulties (Heerwagen and Diamond 1991 Leaman and Bordass 2001) Furthermore for facilities with 24-hour operation schedules the lack of daylight and views may lead to feelings of inequitable distribution of amenities among night-time workers who do not have the same access to daylight and views (Heerwagen and Wise 1998)
F-6
Other Sustainable Design Practices
Although interior design strategies are not included in the current version of the Leadership in Energy and Environmental Design (LEEDtrade) rating system practitioners are beginning to specify more open plan environments as a way to reduce materials especially dry wall and to make daylight and views more broadly available for workers This section reviews research on open plan layouts and partitions
Open Plan Layouts and Partitions
Open plan dense workspaces present serious challenges for sustainable design On the positive side the open plan flexible condensed workstation layout reduces the overall use of resources allows more efficient use of space reduces surfaces that collect dust and allows daylight to penetrate deeper into the space It is also evident that open plan design aids communications and information flow that are so important in many work environments On the negative side however an open plan design increases the potential for distractions and interruptions that may reduce productivity for complex cognitive work as well as the potential for more rapid transmission of illness These issues are discussed in more detail below
Comfort and Satisfaction
Open plan layouts especially those with low partitions facilitate access to daylight and views Workers in open plan spaces that facilitate access to windows are more satisfied overall with lighting and with the work environment (Collins 1975 Heerwagen and Diamond 1991) Open plan workspaces also increase peoplersquos awareness information exchange and general communication levels (Heerwagen and Hunt 2002) Of the factors that contribute to situation awareness visible activity is considered to be the most important (Gutwin and Greenberg 2001) High visual access aids the ability to see others
Productivity
Szilagyi and Holland (1980) found that increased workstation density increased satisfaction and information exchange and facilitated tasks for new employees and secretarial staff but not for managers and for workers with many years of tenure The researchers suggest that when employees are relatively new they may be using the surrounding social environment as a source of information and feedback about how to successfully accomplish their jobs For workers whose tasks are repetitive and cognitively simple the open plan environment may have positive performance impacts Researchers hypothesize that the beneficial effects are due to social facilitation that may increase stimulation and effort associated with having their work on view to others (Geen and Gange 1977)
Research has also shown that ready access to others in a work group can aid spontaneous problem solving and information flow and reduce the time to market for some products (Teasley et al 2000) However the productivity benefits are clearly related to the specific nature of work and cannot be generalized to all contexts because of the potential for serious increases in distractions and loss of privacy
F-7
Problems with the Open Plan Environment
The benefits of open plan densely packed workspaces need to be carefully balanced with the potential negative impacts on both psychological factors and physical health Specifically research shows the following potential problems
bull Physical health Increased density of workstations and open plan environments increase the overall environmental load of airborne microbials and thus facilitates transmission of illness symptoms (Fisk 2001) Open plan spaces also lead to increased distractions Distractions often lead to increased psycho-physiological activation indicating that some increased effort is needed to maintain performance (Tafalla and Evans 1997) For complex tasks the increases in effort may be substantial enough to produce physiological stress
bull Comfort and satisfaction Open plan spaces make it more difficult for workers to have private conversations (Sundstrom et al 1982) This impedes the ability to develop close work relationships and can also lead to increased feelings of stress and dissatisfaction (Gabarro 1987) There is little evidence that providing small private booths compensates for the loss of privacy at the workstation
bull Productivity Open plan workspaces increase distractions that are especially detrimental to complex cognitive tasks Distractions interfere with working memory and analytical thought processes Distractions are also more of a problem for introverts than for extraverts (Morgenstern et al 1994 Belojevic et al 2001) Belojevic et al found that concentration problems and fatigue were more pronounced for introverts working in noise compared with quiet conditions Researchers believe these results are due to differences in psycho-physiological activity Introverts have a more pronounced reaction to noise and this may lead to heightened arousal which interferes with performance on complex mental processing tasks (Eysenck 1982 Stansfeld and Shine 1993) Furthermore extroverts regularly select higher noise intensities as optimal compared with introverts (Geen 1984) These results suggest that design and location of people in settings should take into account these personality differences Introverts may need to have more enclosure or to be located farther away from sources of distracting noise
F-8