Embed Size (px)
Citation preview
RIT-D Report This report presents the sub-transmission network limitations in the lower Mornington Peninsula including the preferred option to address those limitations.
Final Project Assessment Report Lower Mornington Peninsula Supply Area
Project № UE-DOA-S-17-001

RIT-D Final Project Assessment Report
Lower Mornington Peninsula Supply Area Project № UE-DOA-S-17-001 Page 1 of 69
This page has been intentionally left blank
RIT-D Final Project Assessment Report
Lower Mornington Peninsula Supply Area Project № UE-DOA-S-17-001
Page 2 of 69
Table of Contents
1 Approval and Document Control 4
2 Executive summary 5
3 Introduction 16
4 Identified Need 17
4.1 Network overview 17
4.2 Description of the identified need 20
4.2.1 Voltage collapse limitation 20
4.2.2 Insufficient thermal capacity in sub-transmission network 22
4.3 Bushfire exposure 24
4.4 Closing comments on the need for investment 24
4.5 Quantification of the identified need 25
5 Key assumptions in relation to the Identified Need 26
5.1 Method for quantifying the identified need 26
5.1.1 Expected unserved energy due to voltage collapse limitation 26
5.1.2 Expected unserved energy due to insufficient thermal capacity 26
5.2 Forecast maximum demand 27
5.3 Characteristic of load profile 30
5.4 Plant failure rates 32
5.5 Sub-transmission network losses under N-1 condition 32
5.6 Plant ratings 32
5.7 Value of customer reliability 33
5.8 Discount rates 34
6 Summary of submissions 35
6.1 In response to NNOR 35
6.1.1 GreenSync’s Demand Management Proposal 35
6.1.1.1 Solution highlights 35
6.1.2 Aggreko’s Embedded Generation Proposal 38
6.1.2.1 Solution highlights 38
6.2 In response to DPAR 40
7 Credible options included in this RIT-D 41
8 Market modelling methodology 45
8.1 Classes of market benefits considered 45
8.1.1 Changes in involuntary load shedding 46
8.1.2 Changes in NEM generation dispatch 47
RIT-D Final Project Assessment Report
Lower Mornington Peninsula Supply Area Project № UE-DOA-S-17-001
Page 3 of 69
8.1.3 Changes in network losses 47
8.2 Classes of market benefits not expected to be material 48
8.2.1 Changes in voluntary load shedding 48
8.2.2 Changes in costs to other parties 48
8.2.3 Difference in timing of distribution investment 49
8.2.4 Option value 49
8.3 Quantification of costs for each credible option 49
8.4 Scenarios and sensitivities 50
8.4.1 Capital costs 51
8.4.2 Value of customer reliability 51
8.4.3 Discount rates 51
8.4.4 Average Victorian spot price 52
8.4.5 Summary of sensitivity testing 52
9 Results of analysis 53
9.1 Gross market benefits 53
9.2 Net market benefits 54
9.3 Sensitivity assessment on reasonable Scenarios 55
9.4 Economic timing 57
10 Proposed preferred option 58
11 Submission 59
11.1 Next steps 59
12 Checklist of compliance with NER clauses 60
13 Abbreviations and Glossary 61
Appendix A 64
RIT-D Final Project Assessment Report
Lower Mornington Peninsula Supply Area Project № UE-DOA-S-17-001
Page 4 of 69
1 Approval and Document Control
VERSION DATE AUTHOR
1 25 May 2016 UE Network Planning
Amendment overview
New document
RIT-D Final Project Assessment Report
Lower Mornington Peninsula Supply Area Project № UE-DOA-S-17-001
Page 5 of 69
2 Executive summary
Summary
The lower Mornington Peninsula is supplied by a 66kV sub-transmission network supplying Dromana (DMA), Rosebud (RBD) and Sorrento (STO) 66/22 kV zone substations. These three zone substations together with other zone substations in the region including Frankston South (FSH), Hastings (HGS) and Mornington (MTN) are supplied from the 220/66 kV transmission connection point known as Tyabb Terminal Station (TBTS), the sole source of electricity supply to the Mornington Peninsula from the Victorian shared transmission network.
The 66kV sub-transmission network which supplies this region is relatively long with the transmission connection point located on the eastern side of the Mornington Peninsula and most of the load centres located on the west side. This sub-transmission network is also highly utilised at times of maximum demand. On the present forecast, it is estimated that the following sub-transmission lines, which provide electricity supply to the region, will have maximum demands that exceed their respective N-1 thermal ratings:
DMA-RBD No. 1 66kV line;
DMA-RBD No. 2 66kV line;
MTN-DMA 66kV line;
TBTS-DMA 66kV line; and
TBTS-MTN No.1 66kV line.
The other more pressing issue is the inability of the network to maintain voltage levels within regulatory limits in the event of an outage of either the MTN-DMA 66kV line or the TBTS-DMA 66 kV line at high demand conditions, with the former being the more severe condition.
In November 2014, United Energy (UE) commenced the Regulatory Investment Test for Distribution (RIT-D) consultation process to seek alternative options in addressing the need to the proposed network option by publishing a Non-Network Options Report (NNOR).
In response to this consultation, UE received two detailed proposals from GreenSync Pty Ltd and Aggreko Pty Ltd proposing alternative ways to address the need in the lower Mornington Peninsula supply area. Energy Development Limited (EDL) responded that they will not be submitting a non-network solution proposal for this particular limitation.
In the Draft Project Assessment Report (DPAR) published on 16 December 2016, UE compared one credible network option and two credible hybrid options (comprising of non-network solutions followed by a deferred network option) that were technically comparable in addressing the identified need. The three credible options identified were:
1. Install a new 66kV line between Hastings and Rosebud zone substations, ready for service by December 2020 (i.e. 2020-21 summer).
2. Contract with GreenSync Pty Ltd for demand reduction non-network support services and implement their solution for a four year period starting December 2018, followed by Option 1 ready for service by December 2022 (i.e. 2022-23 summer).
RIT-D Final Project Assessment Report
Lower Mornington Peninsula Supply Area Project № UE-DOA-S-17-001
Page 6 of 69
3. Contract with Aggreko Pty Ltd for embedded generation non-network support services and implement their solution for a five year period starting December 2019, followed by Option 1 ready for service by December 2024 (i.e. 2024-25 summer).
Based on the economic assessment (detailed later in this report), Option 2 satisfies the requirements of the RIT-D and is therefore identified as the preferred option.
Purpose
This Final Project Assessment Report (FPAR) has been prepared by UE in accordance with the requirements of clause 5.17.4(r) of the National Electricity Rules (NER).
This report has been prepared following the conclusion of the consultation on the DPAR and represents the third and final stage of the Regulatory Investment Test for Distribution (RIT-D) process. The purpose of this report is to identify the preferred credible option to address the sub-transmission network limitations in the lower Mornington Peninsula.
The FPAR recommends no change to the preferred option from the DPAR. The preferred option is Option 2. This recommended option has two stages of implementation:
Stage 1 - GreenSync demand reduction solution
First stage is to implement GreenSync four year demand reduction proposal in 2018-19 to defer network investment by two years. It includes:
Contracting GreenSync to provide demand reduction at DMA, RBD and STO supply area until the commissioning of new Hastings to Rosebud 66kV line project;
Enrolling C&I, Small Businesses, Utility and Residential DSM portfolios into GreenSync advanced analytics PortfolioCMTM platform which, when integrated with UE SCADA system, will have the capability to monitor constrained network elements to accurately predict when and where constraint exist, and dispatch DSM assets at minimum cost to maintain network security;
Establishment cost;
Customer payments for voluntary load shedding.
The estimated cost of Stage 1 is $3.67 million in 2015-16 AUD.
Stage 2 - Install a new 66 kV line from Hastings to Rosebud
Implement second stage of the preferred option before summer 2022-23, which includes:
Installing approximately 53 km of new 66 kV line from Hastings (HGS) zone substation to Rosebud (RBD) zone substation. The new line would be constructed along the south-eastern coast (along the road reserve) of the Mornington Peninsula. Most of the route would involve the reconstruction of existing overhead pole lines.
Installing three 66 kV circuit breakers, one at RBD and two at HGS zone substations.
Upgrade the TBTS-HGS No.1 and No.2 feeder exits at Tyabb Terminal Station (TBTS).
The estimated capital cost of Stage 2 is 29.5 million (± 10%) in 2015-16 AUD. Annual operating and maintenance costs are anticipated to be around 0.5% of the capital cost. The expected commissioning date of network augmentation is no later than December 2022.
Total Cost
RIT-D Final Project Assessment Report
Lower Mornington Peninsula Supply Area Project № UE-DOA-S-17-001
Page 7 of 69
The estimated total capital and operational cost (Stage 1 + Stage 2) of this recommended option is 35.0 million, in 2015-16 AUD.
This FPAR:
Provides background information on the sub-transmission network limitations in the lower Mornington Peninsula.
Identifies the need which UE is seeking to address, together with the assumption used in identifying that need.
Summarises and provides commentary on the submission(s) received.
Describes the credible options that are considered in this RIT-D assessment.
Describes the methods used in quantifying each class of market benefit.
Quantifies costs (with a breakdown of operating and capital expenditure) and classes of material market benefits for each of the credible options.
Provides reasons why differences in changes in voluntary load curtailment, costs to other parties, option value and timing of other distribution investment do not apply to a credible option.
Provides the results of NPV analysis of each credible option and accompanying explanatory statements regarding the results.
Identifies the proposed preferred option for implementation.
Results of consultation on the Draft Project Assessment Report
On 16 December 2015, UE published the DPAR in accordance with clause 5.17.4(j) of the NER. The purpose of this report was to provide a basis for consultation on the proposed preferred option to address the network limitations within the lower Mornington Peninsula supply area. This report stated that the recommended action would involve the implementation of GreenSync’s four year demand management solution from summer 2018-19, followed by a deferred network investment before December 2022.
Registered participants and interested parties were invited to lodge submissions on the matters outlined in the DPAR by 2 February 2016.
No submissions were received.
Changes from the Draft Project Assessment Report
The NER requires that the FPAR includes matters detailed in the DPAR together with a summary of, and response to, any submissions received in response to the DPAR. In the absence of any submissions to the DPAR, this FPAR repeats the materials and analysis presented in the DPAR. There has been no material changes to the FPAR.
RIT-D Final Project Assessment Report
Lower Mornington Peninsula Supply Area Project № UE-DOA-S-17-001
Page 8 of 69
Actual Maximum Demand recorded on 31 December 2015
The actual maximum demand measured as the summation of zone substation coincident demands in lower Mornington Peninsula was recorded as 120 MVA on 31 December 2015 at 5:45pm (39 MVA at DMA, 40 MVA at RBD and 41 MVA at STO zone substations). The ambient temperature conditions on the day represented a 54% PoE. In the DPAR, UE’s 50% PoE maximum demand forecast for summer 2015-16 was specified as 119.4 MVA.
The actual maximum demand recorded on the last day of 2015, reconfirms the validity of UE’s maximum demand forecasting assumptions. Therefore the maximum demand forecasts presented in the DPAR do not need to be reassessed for the purposes of the FPAR.
GreenSync’s proposal internal approvals
UE has engaged key internal stakeholders to undertake a formal risk assessment of GreenSync’s demand management solution in the lower Mornington Peninsula. This process has informed contract negotiations for establishing a network support agreement with Greensync for implementing the preferred solution highlighted in this FPAR. Execution of the network support agreement will then be subject to UE’s internal approval.
The need for investment
The lower Mornington Peninsula is supplied by a 66kV sub-transmission network supplying Dromana (DMA), Rosebud (RBD) and Sorrento (STO) 66/22 kV zone substations. These three zone substations together with other zone substations in the region including Frankston South (FSH), Hastings (HGS) and Mornington (MTN) are supplied from the 220/66 kV transmission connection point known as Tyabb Terminal Station (TBTS), the sole source of electricity supply to the Mornington Peninsula from the Victorian shared transmission network.
The 66kV sub-transmission network which supplies this region is relatively long with the transmission connection point located on the eastern side of the Mornington Peninsula and most of the load centres located on the west side. This sub-transmission network is also highly utilised at maximum demand. On the present forecast, it is estimated that the following sub-transmission lines, which provide electricity supply to the region, will have maximum demands that exceed their N-1 thermal ratings:
DMA-RBD No. 1 66kV line;
DMA-RBD No. 2 66kV line;
MTN-DMA 66kV line;
TBTS-DMA 66kV line; and
TBTS-MTN No.1 66kV line.
The other more pressing issue is the inability of the network to maintain voltage levels within regulatory limits in the event of an outage of either the MTN-DMA 66kV line or the TBTS-DMA 66 kV line at maximum demand conditions, with the former being the more severe condition.
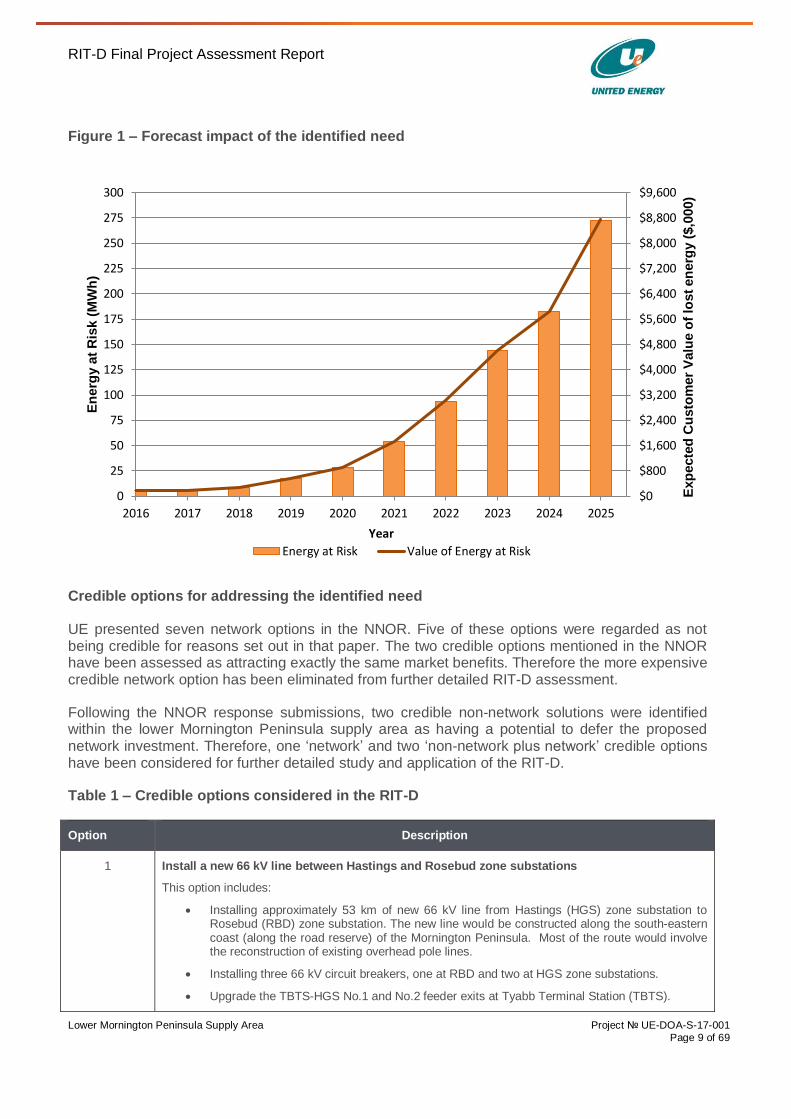
The forecast impact of the ‘identified need’ discussed above is presented in Figure 1.
RIT-D Final Project Assessment Report
Lower Mornington Peninsula Supply Area Project № UE-DOA-S-17-001
Page 9 of 69
Figure 1 – Forecast impact of the identified need
Credible options for addressing the identified need
UE presented seven network options in the NNOR. Five of these options were regarded as not being credible for reasons set out in that paper. The two credible options mentioned in the NNOR have been assessed as attracting exactly the same market benefits. Therefore the more expensive credible network option has been eliminated from further detailed RIT-D assessment.
Following the NNOR response submissions, two credible non-network solutions were identified within the lower Mornington Peninsula supply area as having a potential to defer the proposed network investment. Therefore, one ‘network’ and two ‘non-network plus network’ credible options have been considered for further detailed study and application of the RIT-D.
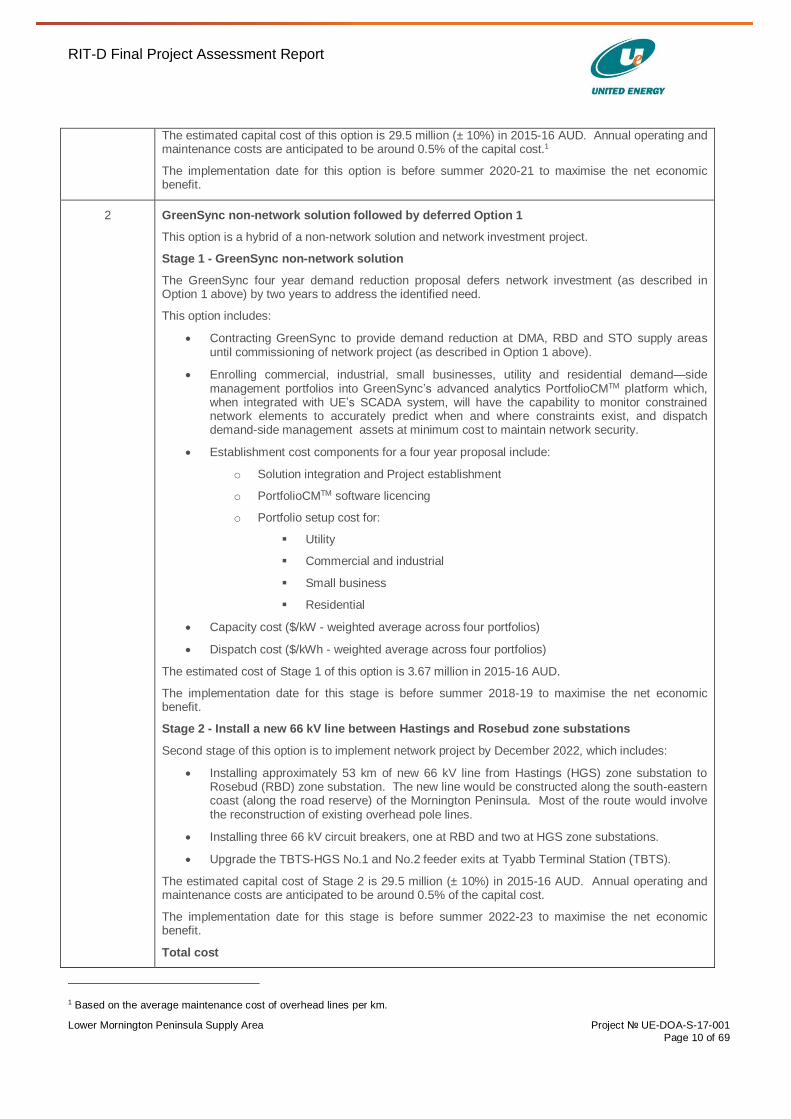
Table 1 – Credible options considered in the RIT-D
Option Description
1 Install a new 66 kV line between Hastings and Rosebud zone substations
This option includes:
Installing approximately 53 km of new 66 kV line from Hastings (HGS) zone substation to Rosebud (RBD) zone substation. The new line would be constructed along the south-eastern coast (along the road reserve) of the Mornington Peninsula. Most of the route would involve the reconstruction of existing overhead pole lines.
Installing three 66 kV circuit breakers, one at RBD and two at HGS zone substations.
Upgrade the TBTS-HGS No.1 and No.2 feeder exits at Tyabb Terminal Station (TBTS).
$0
$800
$1,600
$2,400
$3,200
$4,000
$4,800
$5,600
$6,400
$7,200
$8,000
$8,800
$9,600
0
25
50
75
100
125
150
175
200
225
250
275
300
2016 2017 2018 2019 2020 2021 2022 2023 2024 2025
Exp
ecte
d C
usto
mer
Valu
e o
f lo
st
en
erg
y (
$,0
00)
En
erg
y a
t R
isk (
MW
h)
Year
Energy at Risk Value of Energy at Risk
RIT-D Final Project Assessment Report
Lower Mornington Peninsula Supply Area Project № UE-DOA-S-17-001
Page 10 of 69
The estimated capital cost of this option is 29.5 million (± 10%) in 2015-16 AUD. Annual operating and maintenance costs are anticipated to be around 0.5% of the capital cost.1
The implementation date for this option is before summer 2020-21 to maximise the net economic benefit.
2 GreenSync non-network solution followed by deferred Option 1
This option is a hybrid of a non-network solution and network investment project.
Stage 1 - GreenSync non-network solution
The GreenSync four year demand reduction proposal defers network investment (as described in Option 1 above) by two years to address the identified need.
This option includes:
Contracting GreenSync to provide demand reduction at DMA, RBD and STO supply areas until commissioning of network project (as described in Option 1 above).
Enrolling commercial, industrial, small businesses, utility and residential demand—side management portfolios into GreenSync’s advanced analytics PortfolioCMTM platform which, when integrated with UE’s SCADA system, will have the capability to monitor constrained network elements to accurately predict when and where constraints exist, and dispatch demand-side management assets at minimum cost to maintain network security.
Establishment cost components for a four year proposal include:
o Solution integration and Project establishment
o PortfolioCMTM software licencing
o Portfolio setup cost for:
Utility
Commercial and industrial
Small business
Residential
Capacity cost ($/kW - weighted average across four portfolios)
Dispatch cost ($/kWh - weighted average across four portfolios)
The estimated cost of Stage 1 of this option is 3.67 million in 2015-16 AUD.
The implementation date for this stage is before summer 2018-19 to maximise the net economic benefit.
Stage 2 - Install a new 66 kV line between Hastings and Rosebud zone substations
Second stage of this option is to implement network project by December 2022, which includes:
Installing approximately 53 km of new 66 kV line from Hastings (HGS) zone substation to Rosebud (RBD) zone substation. The new line would be constructed along the south-eastern coast (along the road reserve) of the Mornington Peninsula. Most of the route would involve the reconstruction of existing overhead pole lines.
Installing three 66 kV circuit breakers, one at RBD and two at HGS zone substations.
Upgrade the TBTS-HGS No.1 and No.2 feeder exits at Tyabb Terminal Station (TBTS).
The estimated capital cost of Stage 2 is 29.5 million (± 10%) in 2015-16 AUD. Annual operating and maintenance costs are anticipated to be around 0.5% of the capital cost.
The implementation date for this stage is before summer 2022-23 to maximise the net economic benefit.
Total cost
1 Based on the average maintenance cost of overhead lines per km.
RIT-D Final Project Assessment Report
Lower Mornington Peninsula Supply Area Project № UE-DOA-S-17-001
Page 11 of 69
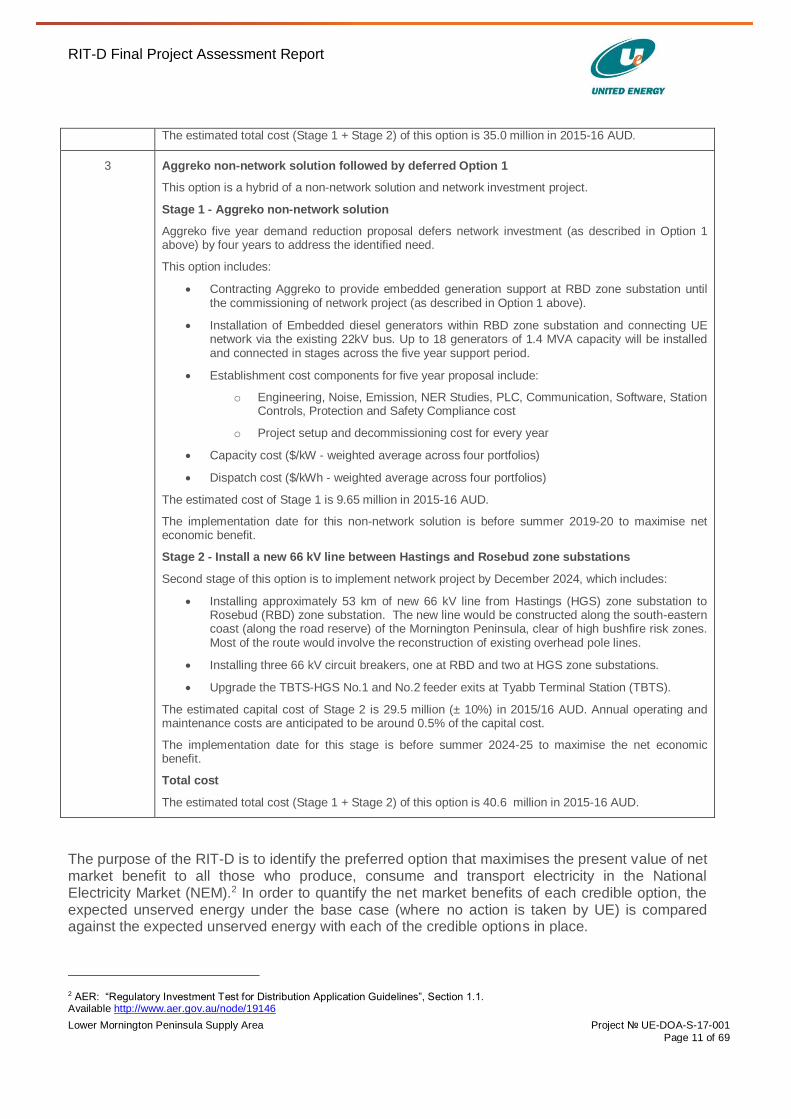
The estimated total cost (Stage 1 + Stage 2) of this option is 35.0 million in 2015-16 AUD.
3 Aggreko non-network solution followed by deferred Option 1
This option is a hybrid of a non-network solution and network investment project.
Stage 1 - Aggreko non-network solution
Aggreko five year demand reduction proposal defers network investment (as described in Option 1 above) by four years to address the identified need.
This option includes:
Contracting Aggreko to provide embedded generation support at RBD zone substation until the commissioning of network project (as described in Option 1 above).
Installation of Embedded diesel generators within RBD zone substation and connecting UE network via the existing 22kV bus. Up to 18 generators of 1.4 MVA capacity will be installed and connected in stages across the five year support period.
Establishment cost components for five year proposal include:
o Engineering, Noise, Emission, NER Studies, PLC, Communication, Software, Station Controls, Protection and Safety Compliance cost
o Project setup and decommissioning cost for every year
Capacity cost ($/kW - weighted average across four portfolios)
Dispatch cost ($/kWh - weighted average across four portfolios)
The estimated cost of Stage 1 is 9.65 million in 2015-16 AUD.
The implementation date for this non-network solution is before summer 2019-20 to maximise net economic benefit.
Stage 2 - Install a new 66 kV line between Hastings and Rosebud zone substations
Second stage of this option is to implement network project by December 2024, which includes:
Installing approximately 53 km of new 66 kV line from Hastings (HGS) zone substation to Rosebud (RBD) zone substation. The new line would be constructed along the south-eastern coast (along the road reserve) of the Mornington Peninsula, clear of high bushfire risk zones. Most of the route would involve the reconstruction of existing overhead pole lines.
Installing three 66 kV circuit breakers, one at RBD and two at HGS zone substations.
Upgrade the TBTS-HGS No.1 and No.2 feeder exits at Tyabb Terminal Station (TBTS).
The estimated capital cost of Stage 2 is 29.5 million (± 10%) in 2015/16 AUD. Annual operating and maintenance costs are anticipated to be around 0.5% of the capital cost.
The implementation date for this stage is before summer 2024-25 to maximise the net economic benefit.
Total cost
The estimated total cost (Stage 1 + Stage 2) of this option is 40.6 million in 2015-16 AUD.
The purpose of the RIT-D is to identify the preferred option that maximises the present value of net market benefit to all those who produce, consume and transport electricity in the National Electricity Market (NEM).2 In order to quantify the net market benefits of each credible option, the expected unserved energy under the base case (where no action is taken by UE) is compared against the expected unserved energy with each of the credible options in place.
2 AER: “Regulatory Investment Test for Distribution Application Guidelines”, Section 1.1. Available http://www.aer.gov.au/node/19146
RIT-D Final Project Assessment Report
Lower Mornington Peninsula Supply Area Project № UE-DOA-S-17-001
Page 12 of 69
Scenarios considered
The NER stipulates that the RIT-D must be based on a cost-benefit analysis that considers a number of reasonable scenarios of future supply and demand.3 In this particular RIT-D, UE notes that different assumptions regarding future supply or transmission development are not expected to impact on the assessment of alternative options.
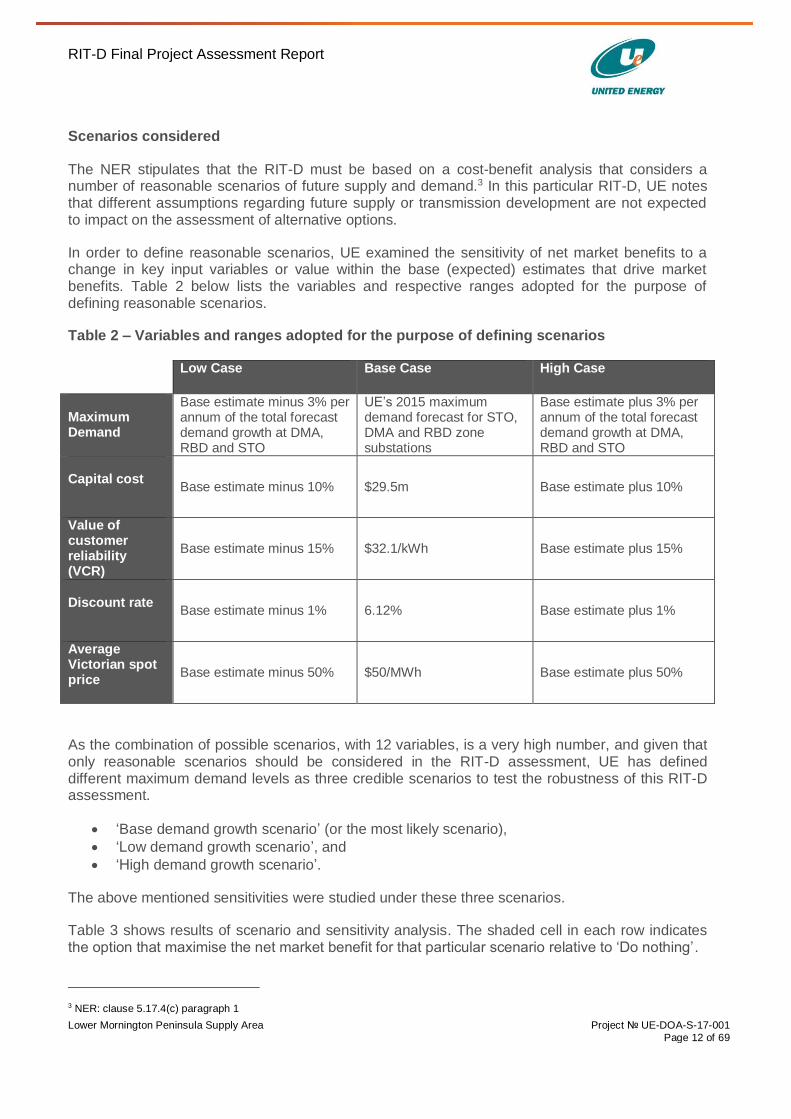
In order to define reasonable scenarios, UE examined the sensitivity of net market benefits to a change in key input variables or value within the base (expected) estimates that drive market benefits. Table 2 below lists the variables and respective ranges adopted for the purpose of defining reasonable scenarios.
Table 2 – Variables and ranges adopted for the purpose of defining scenarios
Low Case Base Case High Case
Maximum Demand
Base estimate minus 3% per annum of the total forecast demand growth at DMA, RBD and STO
UE’s 2015 maximum demand forecast for STO, DMA and RBD zone substations
Base estimate plus 3% per annum of the total forecast demand growth at DMA, RBD and STO
Capital cost
Base estimate minus 10% $29.5m Base estimate plus 10%
Value of customer reliability (VCR)
Base estimate minus 15% $32.1/kWh Base estimate plus 15%
Discount rate
Base estimate minus 1% 6.12% Base estimate plus 1%
Average Victorian spot price
Base estimate minus 50% $50/MWh Base estimate plus 50%
As the combination of possible scenarios, with 12 variables, is a very high number, and given that only reasonable scenarios should be considered in the RIT-D assessment, UE has defined different maximum demand levels as three credible scenarios to test the robustness of this RIT-D assessment.
‘Base demand growth scenario’ (or the most likely scenario),
‘Low demand growth scenario’, and
‘High demand growth scenario’.
The above mentioned sensitivities were studied under these three scenarios.
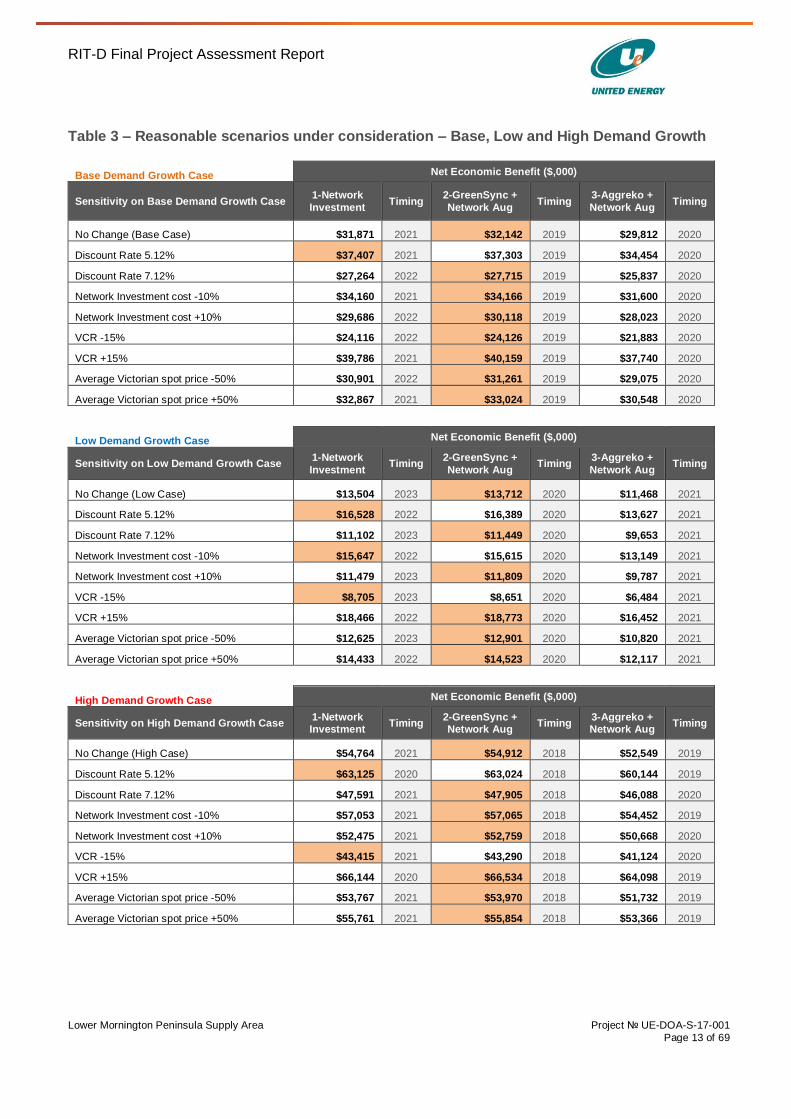
Table 3 shows results of scenario and sensitivity analysis. The shaded cell in each row indicates the option that maximise the net market benefit for that particular scenario relative to ‘Do nothing’.
3 NER: clause 5.17.4(c) paragraph 1
RIT-D Final Project Assessment Report
Lower Mornington Peninsula Supply Area Project № UE-DOA-S-17-001
Page 13 of 69
Table 3 – Reasonable scenarios under consideration – Base, Low and High Demand Growth
Base Demand Growth Case Net Economic Benefit ($,000)
Sensitivity on Base Demand Growth Case 1-Network
Investment Timing
2-GreenSync +
Network Aug Timing
3-Aggreko +
Network Aug Timing
No Change (Base Case) $31,871 2021 $32,142 2019 $29,812 2020
Discount Rate 5.12% $37,407 2021 $37,303 2019 $34,454 2020
Discount Rate 7.12% $27,264 2022 $27,715 2019 $25,837 2020
Network Investment cost -10% $34,160 2021 $34,166 2019 $31,600 2020
Network Investment cost +10% $29,686 2022 $30,118 2019 $28,023 2020
VCR -15% $24,116 2022 $24,126 2019 $21,883 2020
VCR +15% $39,786 2021 $40,159 2019 $37,740 2020
Average Victorian spot price -50% $30,901 2022 $31,261 2019 $29,075 2020
Average Victorian spot price +50% $32,867 2021 $33,024 2019 $30,548 2020
Low Demand Growth Case Net Economic Benefit ($,000)
Sensitivity on Low Demand Growth Case 1-Network
Investment Timing
2-GreenSync +
Network Aug Timing
3-Aggreko +
Network Aug Timing
No Change (Low Case) $13,504 2023 $13,712 2020 $11,468 2021
Discount Rate 5.12% $16,528 2022 $16,389 2020 $13,627 2021
Discount Rate 7.12% $11,102 2023 $11,449 2020 $9,653 2021
Network Investment cost -10% $15,647 2022 $15,615 2020 $13,149 2021
Network Investment cost +10% $11,479 2023 $11,809 2020 $9,787 2021
VCR -15% $8,705 2023 $8,651 2020 $6,484 2021
VCR +15% $18,466 2022 $18,773 2020 $16,452 2021
Average Victorian spot price -50% $12,625 2023 $12,901 2020 $10,820 2021
Average Victorian spot price +50% $14,433 2022 $14,523 2020 $12,117 2021
High Demand Growth Case Net Economic Benefit ($,000)
Sensitivity on High Demand Growth Case 1-Network Investment
Timing 2-GreenSync + Network Aug
Timing 3-Aggreko + Network Aug
Timing
No Change (High Case) $54,764 2021 $54,912 2018 $52,549 2019
Discount Rate 5.12% $63,125 2020 $63,024 2018 $60,144 2019
Discount Rate 7.12% $47,591 2021 $47,905 2018 $46,088 2020
Network Investment cost -10% $57,053 2021 $57,065 2018 $54,452 2019
Network Investment cost +10% $52,475 2021 $52,759 2018 $50,668 2020
VCR -15% $43,415 2021 $43,290 2018 $41,124 2020
VCR +15% $66,144 2020 $66,534 2018 $64,098 2019
Average Victorian spot price -50% $53,767 2021 $53,970 2018 $51,732 2019
Average Victorian spot price +50% $55,761 2021 $55,854 2018 $53,366 2019
RIT-D Final Project Assessment Report
Lower Mornington Peninsula Supply Area Project № UE-DOA-S-17-001
Page 14 of 69
NPV Results
Table 3 sets out a comparison of the present value of net market benefits of each option under all reasonable scenarios, over a twenty-year period.
The results set out in the table above show:
Option 2 maximises net market benefit under the base case set of assumptions;
Option 2 maximises net market benefit under majority of scenarios involving the variation of assumptions within plausible limits;
Option 1 maximises net market benefit under:
o low discount rate sensitivity of Base, Low and High demand growth scenarios;
o low VCR sensitivity of Low and High demand growth scenarios; and
o low investment cost sensitivity of Low demand growth scenario;
Option 3 has lower net economic benefits under all studied scenarios by a reasonable margin.
This RIT-D assessment demonstrates that Option 2 maximises the present value of net market benefits under base case and majority of other reasonable scenarios considered. The preferred option for investment is therefore Option 2: Implementing GreenSync’s four-year demand management solution by December 2018 followed by the commissioning of the new 66 kV line from Hastings to Rosebud zone substation by December 2022. This option satisfies the requirements of the RIT-D.
The timing of this proposed investment is sensitive to the demand growth in lower Mornington Peninsula supply area. The economic timing of the proposed preferred option is when the annualised cost of power supply interruption exceeds the annualised cost of the proposed preferred option.
The timing of the proposed preferred Option 2 is before summer 2018-19 under the ‘base case’ reasonable scenario (i.e. under the most likely scenario).
There may be scope for deferring the proposed preferred option by one year if:
o the maximum demand growth at DMA, RBD and STO is 3% per annum lower than base estimates – that is, the maximum demand at lower Mornington Peninsula is approximately 2-3 MW per annum lower than the base case forecast.
The proposed preferred option may be implemented a year earlier if:
o The maximum demand growth at DMA, RBD and STO is 3% per annum higher than base estimates.
RIT-D Final Project Assessment Report
Lower Mornington Peninsula Supply Area Project № UE-DOA-S-17-001
Page 15 of 69
Recommendation
The recommended option is to proceed with Option 2 as defined in Table 1.
Next steps
This FPAR represents the final stage of the RIT-D process.
In accordance with the provisions set out in clause 5.17.5(c) of the NER, Registered Participants or interested parties may, within 30 days after the publication of this report, dispute the conclusions made by UE in this report with the Australian Energy Regulatory (AER). Accordingly, Registered Participants and interested parties who wish to dispute the recommendation outlined in this report must do so by 1st August 2016.
Any parties raising such a dispute are also required to notify the United Energy Manager Network Planning at [email protected].
All submissions will be published on UE’s website.4
If no formal dispute is raised, UE will commence with the activities necessary to proceed with the implementation of the preferred option.
4 If you do not want your submission to be publically available, please clearly stipulate this at the time of lodgment.
RIT-D Final Project Assessment Report
Lower Mornington Peninsula Supply Area Project № UE-DOA-S-17-001
Page 16 of 69
3 Introduction
This Final Project Assessment Report has been prepared by United Energy (UE) in accordance with the requirements of clause 5.17.4(r) of the National Electricity Rules (NER).
This report represents the third and final stage of the consultation process in relation to the application of the Regulatory Investment Test for Distribution (RIT-D) on potential credible options to address the sub-transmission network limitations in the lower Mornington Peninsula.
The Non Network Options Report (NNOR) in relation to this RIT-D was published on 26 Nov 2014, followed by the Draft Project Assessment Report (DPAR) on 16 Dec 2015.
This report:
Provides background information on the sub-transmission network limitations in the lower Mornington Peninsula.
Identifies the need which UE is seeking to address, together with the assumption used in identifying that need.
Summarises and provides commentary on the submission(s) received on the NNOR.
Describes the credible options that are considered in this RIT-D assessment.
Describes the methods used in quantifying each class of market benefit.
Quantifies costs (with a breakdown of operating and capital expenditure) and classes of material market benefits for each of the credible options.
Provides reasons why differences in changes in voluntary load curtailment, costs to other parties, option value and timing of other distribution investment do not apply to a credible option.
Provides the results of NPV analysis of each credible option and accompanying explanatory statements regarding the results.
Identifies the proposed preferred option, which is implementation of GreenSync’s four year demand management solution from summer 2018-19 followed by the installation of the new 66kV line from Hastings to Rosebud zone substations before December 2022.
RIT-D Final Project Assessment Report
Lower Mornington Peninsula Supply Area Project № UE-DOA-S-17-001
Page 17 of 69
4 Identified Need
4.1 Network overview
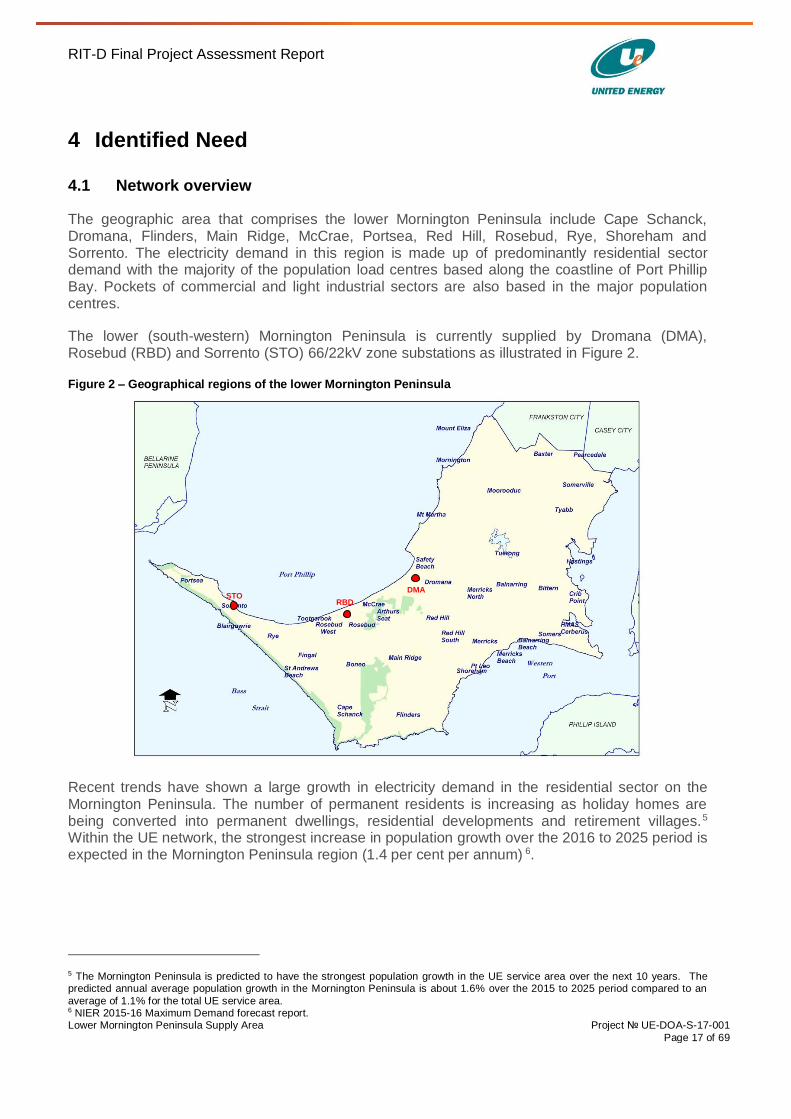
The geographic area that comprises the lower Mornington Peninsula include Cape Schanck, Dromana, Flinders, Main Ridge, McCrae, Portsea, Red Hill, Rosebud, Rye, Shoreham and Sorrento. The electricity demand in this region is made up of predominantly residential sector demand with the majority of the population load centres based along the coastline of Port Phillip Bay. Pockets of commercial and light industrial sectors are also based in the major population centres.
The lower (south-western) Mornington Peninsula is currently supplied by Dromana (DMA), Rosebud (RBD) and Sorrento (STO) 66/22kV zone substations as illustrated in Figure 2.
Figure 2 – Geographical regions of the lower Mornington Peninsula
Recent trends have shown a large growth in electricity demand in the residential sector on the Mornington Peninsula. The number of permanent residents is increasing as holiday homes are being converted into permanent dwellings, residential developments and retirement villages.5 Within the UE network, the strongest increase in population growth over the 2016 to 2025 period is expected in the Mornington Peninsula region (1.4 per cent per annum) 6.
5 The Mornington Peninsula is predicted to have the strongest population growth in the UE service area over the next 10 years. The predicted annual average population growth in the Mornington Peninsula is about 1.6% over the 2015 to 2025 period compared to an
average of 1.1% for the total UE service area. 6 NIER 2015-16 Maximum Demand forecast report.
DMA
RBD STO
RIT-D Final Project Assessment Report
Lower Mornington Peninsula Supply Area Project № UE-DOA-S-17-001
Page 18 of 69
The Mornington Peninsula remains one of Melbourne’s premier holiday destinations. The population being serviced rises from approximately 150,000 residents to more than 200,000 during the peak summer months.7
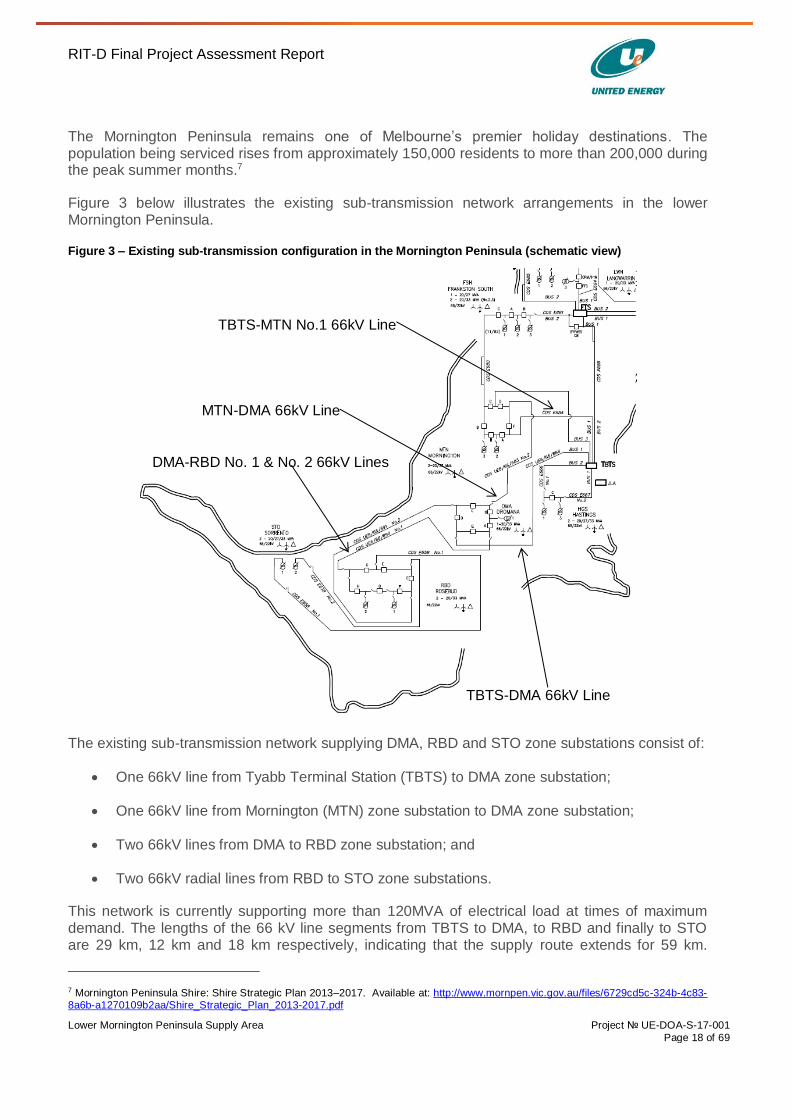
Figure 3 below illustrates the existing sub-transmission network arrangements in the lower Mornington Peninsula.
Figure 3 – Existing sub-transmission configuration in the Mornington Peninsula (schematic view)
The existing sub-transmission network supplying DMA, RBD and STO zone substations consist of:
One 66kV line from Tyabb Terminal Station (TBTS) to DMA zone substation;
One 66kV line from Mornington (MTN) zone substation to DMA zone substation;
Two 66kV lines from DMA to RBD zone substation; and
Two 66kV radial lines from RBD to STO zone substations.
This network is currently supporting more than 120MVA of electrical load at times of maximum demand. The lengths of the 66 kV line segments from TBTS to DMA, to RBD and finally to STO are 29 km, 12 km and 18 km respectively, indicating that the supply route extends for 59 km.
7 Mornington Peninsula Shire: Shire Strategic Plan 2013–2017. Available at: http://www.mornpen.vic.gov.au/files/6729cd5c-324b-4c83-8a6b-a1270109b2aa/Shire_Strategic_Plan_2013-2017.pdf
MTN-DMA 66kV Line
DMA-RBD No. 1 & No. 2 66kV Lines
TBTS-DMA 66kV Line
TBTS-MTN No.1 66kV Line
RIT-D Final Project Assessment Report
Lower Mornington Peninsula Supply Area Project № UE-DOA-S-17-001
Page 19 of 69
Given the relatively long length of the sub-transmission network and high demand, capacitor banks are installed at STO and RBD zone substations to provide reactive power compensation for the load, with one bank at STO used to slightly over-compensate the power factor to minimise reactive power losses in the 66 kV lines. Both these stations are currently operating near unity power factor. Although DMA zone substation is not equipped with any capacitor banks, the zone substation also operates near unity power factor due to the use of pole-mounted capacitor banks within the 22kV distribution network. The effectiveness of these devices together with the on-load tap changers (of zone substation transformers) to maintain voltage levels within acceptable levels is diminishing rapidly in the event of loss of one of the sub-transmission lines to DMA zone substation during maximum demand conditions because of the magnitude of the losses along the 66 kV lines, particularly for loss of the MTN-DMA 66kV line.
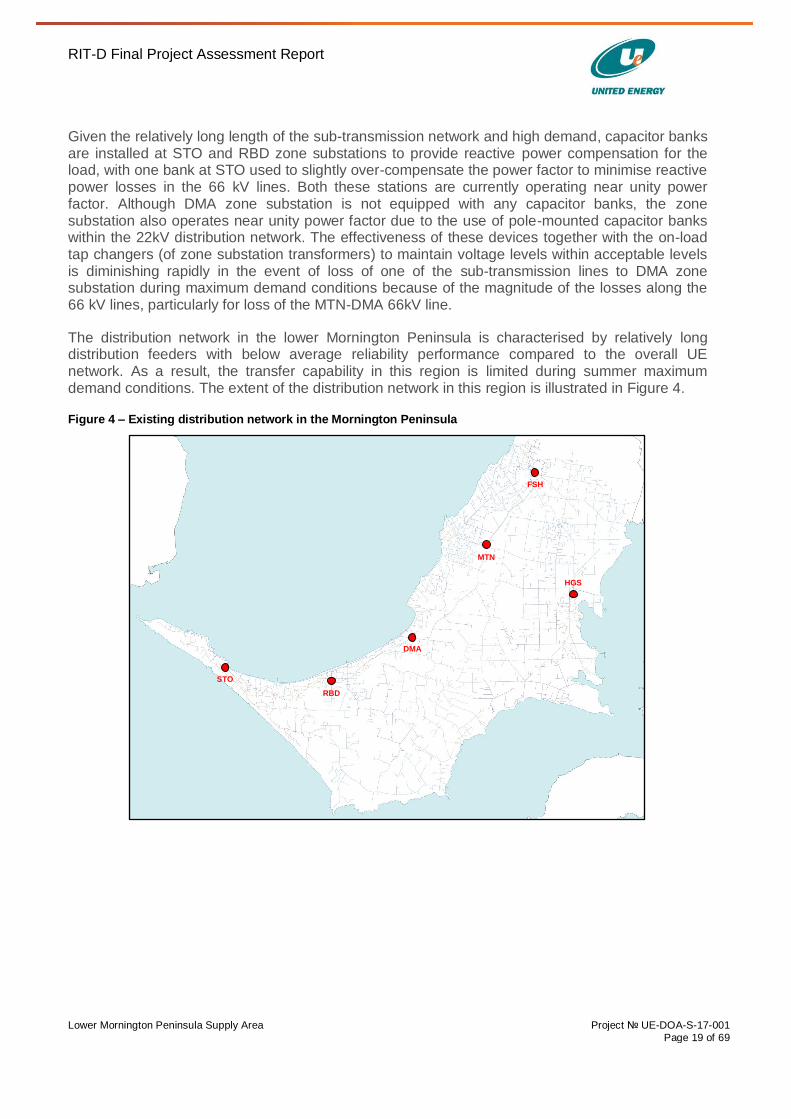
The distribution network in the lower Mornington Peninsula is characterised by relatively long distribution feeders with below average reliability performance compared to the overall UE network. As a result, the transfer capability in this region is limited during summer maximum demand conditions. The extent of the distribution network in this region is illustrated in Figure 4.
Figure 4 – Existing distribution network in the Mornington Peninsula
STO
RBD
DMA
MTN
FSH
HGS
RIT-D Final Project Assessment Report
Lower Mornington Peninsula Supply Area Project № UE-DOA-S-17-001
Page 20 of 69
4.2 Description of the identified need
4.2.1 Voltage collapse limitation
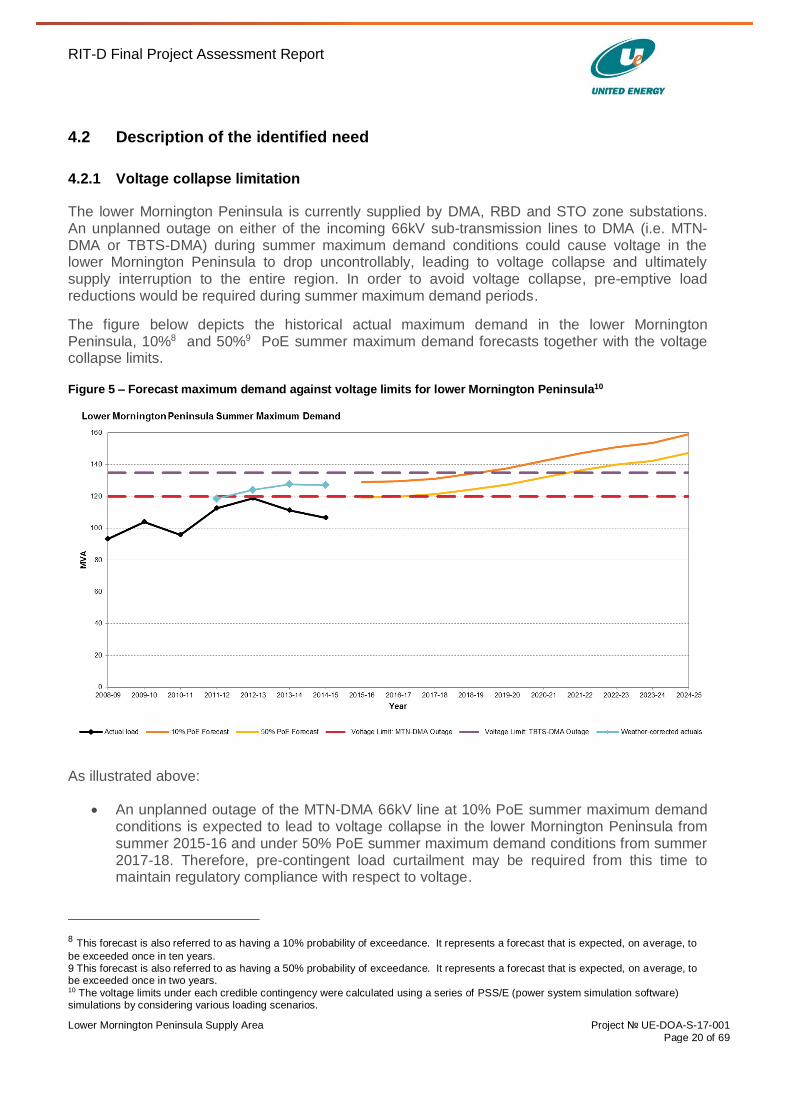
The lower Mornington Peninsula is currently supplied by DMA, RBD and STO zone substations. An unplanned outage on either of the incoming 66kV sub-transmission lines to DMA (i.e. MTN-DMA or TBTS-DMA) during summer maximum demand conditions could cause voltage in the lower Mornington Peninsula to drop uncontrollably, leading to voltage collapse and ultimately supply interruption to the entire region. In order to avoid voltage collapse, pre-emptive load reductions would be required during summer maximum demand periods.
The figure below depicts the historical actual maximum demand in the lower Mornington Peninsula, 10%8 and 50%9 PoE summer maximum demand forecasts together with the voltage collapse limits.
Figure 5 – Forecast maximum demand against voltage limits for lower Mornington Peninsula10
As illustrated above:
An unplanned outage of the MTN-DMA 66kV line at 10% PoE summer maximum demand conditions is expected to lead to voltage collapse in the lower Mornington Peninsula from summer 2015-16 and under 50% PoE summer maximum demand conditions from summer 2017-18. Therefore, pre-contingent load curtailment may be required from this time to maintain regulatory compliance with respect to voltage.
8 This forecast is also referred to as having a 10% probability of exceedance. It represents a forecast that is expected, on average, to
be exceeded once in ten years. 9 This forecast is also referred to as having a 50% probability of exceedance. It represents a forecast that is expected, on average, to be exceeded once in two years. 10 The voltage limits under each credible contingency were calculated using a series of PSS/E (power system simulation software) simulations by considering various loading scenarios.
RIT-D Final Project Assessment Report
Lower Mornington Peninsula Supply Area Project № UE-DOA-S-17-001
Page 21 of 69
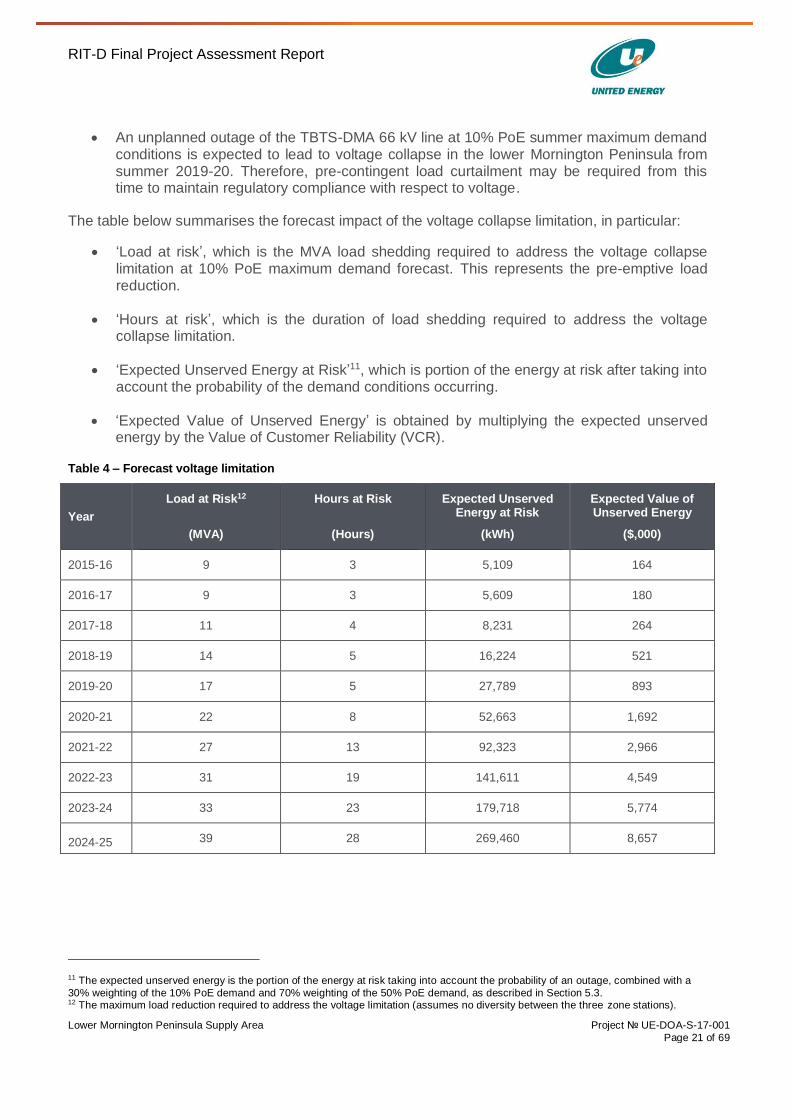
An unplanned outage of the TBTS-DMA 66 kV line at 10% PoE summer maximum demand conditions is expected to lead to voltage collapse in the lower Mornington Peninsula from summer 2019-20. Therefore, pre-contingent load curtailment may be required from this time to maintain regulatory compliance with respect to voltage.
The table below summarises the forecast impact of the voltage collapse limitation, in particular:
‘Load at risk’, which is the MVA load shedding required to address the voltage collapse limitation at 10% PoE maximum demand forecast. This represents the pre-emptive load reduction.
‘Hours at risk’, which is the duration of load shedding required to address the voltage collapse limitation.
‘Expected Unserved Energy at Risk’11, which is portion of the energy at risk after taking into account the probability of the demand conditions occurring.
‘Expected Value of Unserved Energy’ is obtained by multiplying the expected unserved energy by the Value of Customer Reliability (VCR).
Table 4 – Forecast voltage limitation
Year
Load at Risk12 adadffadfda
(MVA)
Hours at Risk afdafdadfad
(Hours)
Expected Unserved Energy at Risk
(kWh)
Expected Value of Unserved Energy
($,000)
2015-16 9 3 5,109 164
2016-17 9 3 5,609 180
2017-18 11 4 8,231 264
2018-19 14 5 16,224 521
2019-20 17 5 27,789 893
2020-21 22 8 52,663 1,692
2021-22 27 13 92,323 2,966
2022-23 31 19 141,611 4,549
2023-24 33 23 179,718 5,774
2024-25 39 28 269,460 8,657
11 The expected unserved energy is the portion of the energy at risk taking into account the probability of an outage, combined with a
30% weighting of the 10% PoE demand and 70% weighting of the 50% PoE demand, as described in Section 5.3. 12 The maximum load reduction required to address the voltage limitation (assumes no diversity between the three zone stations).
RIT-D Final Project Assessment Report
Lower Mornington Peninsula Supply Area Project № UE-DOA-S-17-001
Page 22 of 69
4.2.2 Insufficient thermal capacity in sub-transmission network
On the present forecast, it is estimated that the following sub-transmission lines13, which provide electricity supply to the lower Mornington Peninsula, will have maximum demands that exceed their respective N-1 thermal ratings:
DMA-RBD No.1 66 kV line for loss of the DMA-RBD No.2 66 kV line.
DMA-RBD No.2 66 kV line for loss of the DMA-RBD No.1 66 kV line.
MTN-DMA 66 kV line for loss of the TBTS-DMA 66 kV line.
TBTS-DMA 66 kV line for loss of the MTN-DMA 66 kV line.
TBTS-MTN No.1 66 kV line for loss of TBTS-DMA 66 kV line.14
Unlike other parts of the UE network where load can be transferred to adjacent sub-transmission systems, the load transfer capability away from the abovementioned network is significantly limited. This is because:
For the DMA-RBD lines which supply RBD and STO zone substations, only RBD has off-loading capability of 16.6 MVA to neighbouring DMA zone substation in 2015-16.
For the TBTS-DMA and MTN-DMA lines which supply DMA, RBD and STO zone substations, only DMA has off-loading capability of 8.0 MVA to neighbouring MTN zone substation in 2015-16.
For the TBTS-MTN No.1 line which supplies the DMA, FSH, MTN, RBD and STO zone substations, a limited amount of load can be transferred from MTN to neighbouring FSH (3.6 MVA in 2015-16) and to HGS (5.5 MVA in 2015-16) zone substations.
It has a highly utilised distribution feeder network with below average reliability performance.
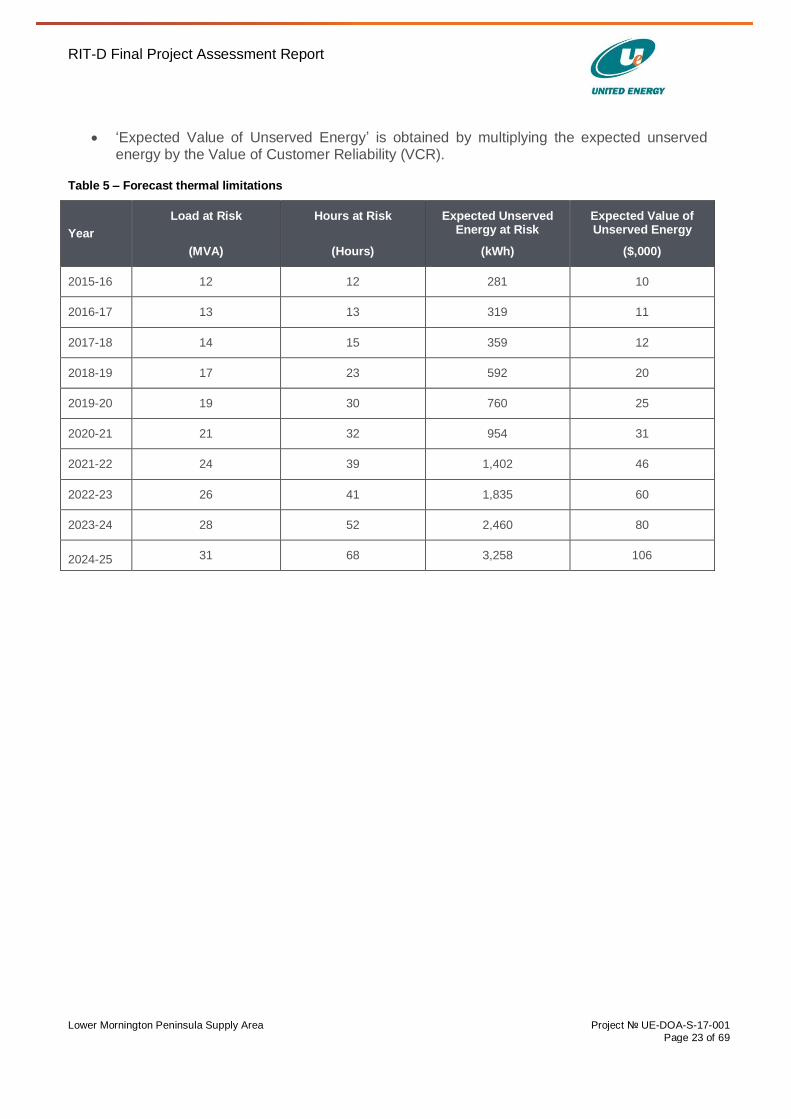
The table below summarises the forecast impact of thermal limitations, in particular:
‘Load at risk’, which is the MVA load shedding required to address the abovementioned thermal limitations at 10% PoE maximum demand forecast (i.e. the worst case scenario). This represents a post-contingent load reduction after considering the impact of load transfer capability.
‘Hours at risk‘, which is the duration of load shedding required addressing the abovementioned thermal limitations.
‘Expected Unserved Energy at Risk’15, which is portion of the energy at risk after taking into account the probability of the demand conditions occurring and plant unavailability.
13 Only the outages that lead to overload and results in the highest loading levels of the remaining sub-transmission network are listed. 14 The TBTS-MTN No.1 66 kV line also becomes overloaded following the loss of the TBTS-MTN No.2 66 kV line. 15 The expected unserved energy is the portion of the energy at risk taking into account the probability of an outage, combined with a 30% weighting of the 10% PoE demand and 70% weighting of the 50% PoE demand, as described in Section 5.3.
RIT-D Final Project Assessment Report
Lower Mornington Peninsula Supply Area Project № UE-DOA-S-17-001
Page 23 of 69
‘Expected Value of Unserved Energy’ is obtained by multiplying the expected unserved energy by the Value of Customer Reliability (VCR).
Table 5 – Forecast thermal limitations
Year
Load at Risk adadffadfda
(MVA)
Hours at Risk afdafdadfad
(Hours)
Expected Unserved Energy at Risk
(kWh)
Expected Value of Unserved Energy
($,000)
2015-16 12 12 281 10
2016-17 13 13 319 11
2017-18 14 15 359 12
2018-19 17 23 592 20
2019-20 19 30 760 25
2020-21 21 32 954 31
2021-22 24 39 1,402 46
2022-23 26 41 1,835 60
2023-24 28 52 2,460 80
2024-25 31 68 3,258 106
RIT-D Final Project Assessment Report
Lower Mornington Peninsula Supply Area Project № UE-DOA-S-17-001
Page 24 of 69
4.3 Bushfire exposure
Large areas of natural bush, state parks, local reserves, rural fields and other vegetation co-exist along populated areas of the Mornington Peninsula. Therefore, there exists a higher threat of bushfire in many parts of this region compared to other parts of UE’s service area.
In recent years, UE has observed four separate incidents of sub-transmission line forced outages as a result of bushfire-related incidents in the area. Two of these incidents related to outage of both the DMA-RBD 66 kV lines (i.e. N-2 outage). This resulted in total loss of supply to a majority of the lower Mornington Peninsula (i.e. all of RBD and STO zone substations). The prospect of bushfire-related factors leading to outage of both the DMA-RBD 66 kV lines is greater in the area of Arthurs Seat Park where both lines traverse in close proximity in difficult to access terrain with thick vegetation.
In light of recent events, UE considers the loss of both the DMA-RBD 66 kV lines, due to bushfire-related incidents, to be a credible contingency event. UE has not quantified this risk as part of this report. Instead, UE discusses qualitatively whether each potential credible option discussed in Section 7 addresses the risk of loss-of-supply under an N-2 contingent event.
4.4 Closing comments on the need for investment
The following limitations are to be addressed by this RIT-D:
From summer 2015-16, an unplanned outage of one of the incoming sub-transmission lines to DMA zone substation during 10% PoE summer maximum demand conditions is expected to lead to voltage collapse in the lower Mornington Peninsula.
From summer 2015-16, an unplanned outage of a critical sub-transmission line during summer maximum demand conditions is expected to lead to supply interruptions in the lower Mornington Peninsula due to thermal overload of remaining in-service sub-transmission lines.
Outage of both the DMA-RBD 66 kV lines due to bushfire incidents are expected to lead to total loss of supply to a majority of the lower Mornington Peninsula until one or both lines are fully restored.
In light of the growing demand and the forecast increase in load-at-risk, UE examined a number of options to alleviate the identified need in the NNOR. Out of these options, the three most credible options are outlined in Section 7 of this report.
RIT-D Final Project Assessment Report
Lower Mornington Peninsula Supply Area Project № UE-DOA-S-17-001
Page 25 of 69
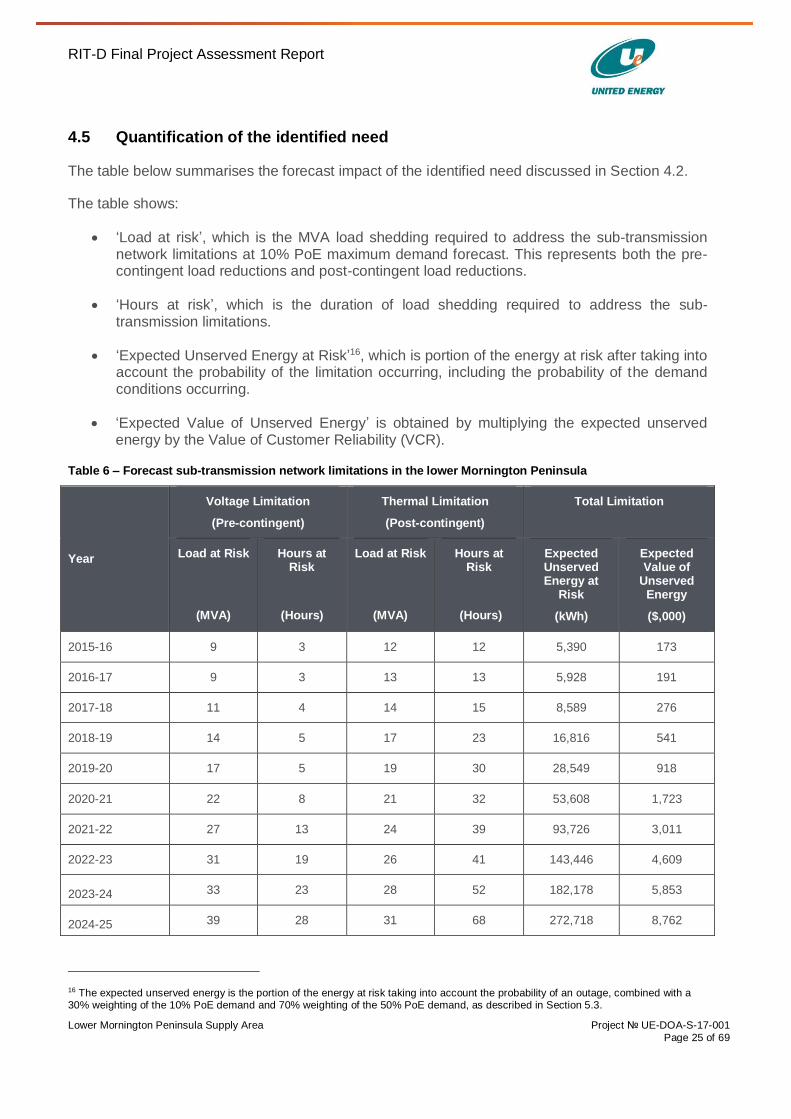
4.5 Quantification of the identified need
The table below summarises the forecast impact of the identified need discussed in Section 4.2.
The table shows:
‘Load at risk’, which is the MVA load shedding required to address the sub-transmission network limitations at 10% PoE maximum demand forecast. This represents both the pre-contingent load reductions and post-contingent load reductions.
‘Hours at risk’, which is the duration of load shedding required to address the sub-transmission limitations.
‘Expected Unserved Energy at Risk’16, which is portion of the energy at risk after taking into account the probability of the limitation occurring, including the probability of the demand conditions occurring.
‘Expected Value of Unserved Energy’ is obtained by multiplying the expected unserved energy by the Value of Customer Reliability (VCR).
Table 6 – Forecast sub-transmission network limitations in the lower Mornington Peninsula
Year
Voltage Limitation
(Pre-contingent)
Thermal Limitation
(Post-contingent)
Total Limitation
Load at Risk fffffffff
(MVA)
Hours at Risk
(Hours)
Load at Risk fffffffff
(MVA)
Hours at Risk
(Hours)
Expected Unserved Energy at
Risk
(kWh)
Expected Value of
Unserved Energy
($,000)
2015-16 9 3 12 12 5,390 173
2016-17 9 3 13 13 5,928 191
2017-18 11 4 14 15 8,589 276
2018-19 14 5 17 23 16,816 541
2019-20 17 5 19 30 28,549 918
2020-21 22 8 21 32 53,608 1,723
2021-22 27 13 24 39 93,726 3,011
2022-23 31 19 26 41 143,446 4,609
2023-24 33 23 28 52 182,178 5,853
2024-25 39 28 31 68 272,718 8,762
16 The expected unserved energy is the portion of the energy at risk taking into account the probability of an outage, combined with a 30% weighting of the 10% PoE demand and 70% weighting of the 50% PoE demand, as described in Section 5.3.
RIT-D Final Project Assessment Report
Lower Mornington Peninsula Supply Area Project № UE-DOA-S-17-001
Page 26 of 69
5 Key assumptions in relation to the Identified Need
5.1 Method for quantifying the identified need
The identified need that is addressed by this RIT-D, presented in Section 4.5, is comprised of the following components:
Expected unserved energy due to voltage collapse limitation in the lower Mornington Peninsula; and
Expected unserved energy due to insufficient thermal capacity in the sub-transmission network.
The section below summarises the method adopted to quantify the abovementioned risks.
5.1.1 Expected unserved energy due to voltage collapse limitation
In order to avoid the voltage collapse limitation and maintain voltage stability, load must be reduced during system normal conditions (i.e. prior to an outage) at times when the total lower Mornington Peninsula demand reaches the voltage collapse limit to maintain regulatory compliance. The expected unserved energy due to voltage collapse limitation was calculated as follows:
Identify the expected unserved energy under system normal conditions by comparing the total demand in the lower Mornington Peninsula (i.e. combined demand at DMA, RBD and STO zone substations) against the voltage collapse limit using a 30% weighting for a 10% PoE and 70% weighting for a 50% PoE demand forecast.
5.1.2 Expected unserved energy due to insufficient thermal capacity
The expected unserved energy due to insufficient thermal capacity in the sub-transmission network was calculated as follows:
1. Identify the expected unserved energy in the following sub-transmission network under system normal conditions (i.e. N condition) and following loss of a critical sub-transmission line (i.e. N-1 condition) taking into account the probability of failure:
a. DMA-RBD No. 1 and No. 2 lines which supplies RBD and STO zone substations.
b. TBTS-DMA line which supplies DMA, RBD and STO zone substations.
c. MTN-DMA line which supplies DMA, RBD and STO zone substations.
d. TBTS-MTN No.1 line which supplies DMA, FSH, MTN, RBD and STO zone substations.
The combined expected unserved energy from (a) to (d) represents the expected unserved energy that is to be addressed due insufficient thermal capacity in the sub-transmission network.
This assessment includes the impact of load transfer capability. Analysis indicated that the total risks to be addressed due to insufficient thermal capacity in the sub-transmission network is
RIT-D Final Project Assessment Report
Lower Mornington Peninsula Supply Area Project № UE-DOA-S-17-001
Page 27 of 69
greater under the scenario that considers the impact of load transfers compared to the scenario that excludes such transfers.17 This is due to significant incremental risks in the distribution feeder network, particularly during N-1 conditions where the distribution feeders are exposed to greater level of risk given increased utilisation. Thermal limitation component, on average, forms only 3% of the total energy at risk per year. Market benefits realised from considering adjacent distribution feeder risk is negligibly small.
In order to realise market benefits arising from load transfers to neighbouring network during emergency conditions, the available load transfer capability must be optimised such that the incremental risks in the distribution feeder network is reduced (particularly under N-1 conditions). This requires significant iterative modelling assessment which would be disproportionate to any additional benefits that may be identified given:
High proportion of the identified need relates to the voltage collapse limitation. Any additional benefits realised from load transfers during emergency conditions would not alter the timing of proposed augmentation nor alter the outcome of this RIT-D.
The available load transfer is already limited and expected to deteriorate. Further reduction is unlikely to yield significant market benefits.
Due to this reason, adjacent distribution feeders’ risk, after load transfers has been ignored in this RIT-D assessment.
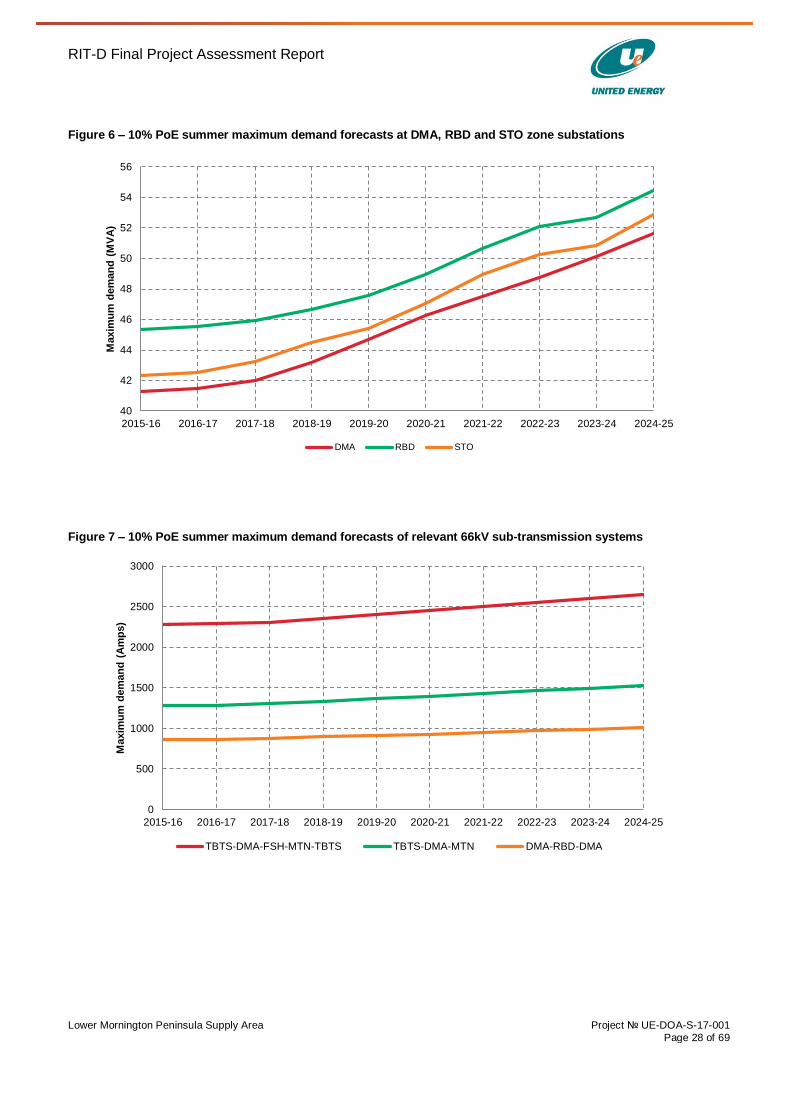
5.2 Forecast maximum demand
Forecasts of the 10% PoE and 50% PoE summer maximum demand for the relevant zone substations and sub-transmission systems in the lower Mornington Peninsula are presented in figures below. These forecasts are based on the base (expected) economic growth scenario.
17 Load transfer capability away from sub-transmission systems on the UE network was calculated for summer 2015-16 as part of contingency planning studies.
RIT-D Final Project Assessment Report
Lower Mornington Peninsula Supply Area Project № UE-DOA-S-17-001
Page 28 of 69
Figure 6 – 10% PoE summer maximum demand forecasts at DMA, RBD and STO zone substations
Figure 7 – 10% PoE summer maximum demand forecasts of relevant 66kV sub-transmission systems
40
42
44
46
48
50
52
54
56
2015-16 2016-17 2017-18 2018-19 2019-20 2020-21 2021-22 2022-23 2023-24 2024-25
Maxim
um
dem
an
d (
MV
A)
DMA RBD STO
0
500
1000
1500
2000
2500
3000
2015-16 2016-17 2017-18 2018-19 2019-20 2020-21 2021-22 2022-23 2023-24 2024-25
Maxim
um
dem
an
d (
Am
ps)
TBTS-DMA-FSH-MTN-TBTS TBTS-DMA-MTN DMA-RBD-DMA
RIT-D Final Project Assessment Report
Lower Mornington Peninsula Supply Area Project № UE-DOA-S-17-001
Page 29 of 69
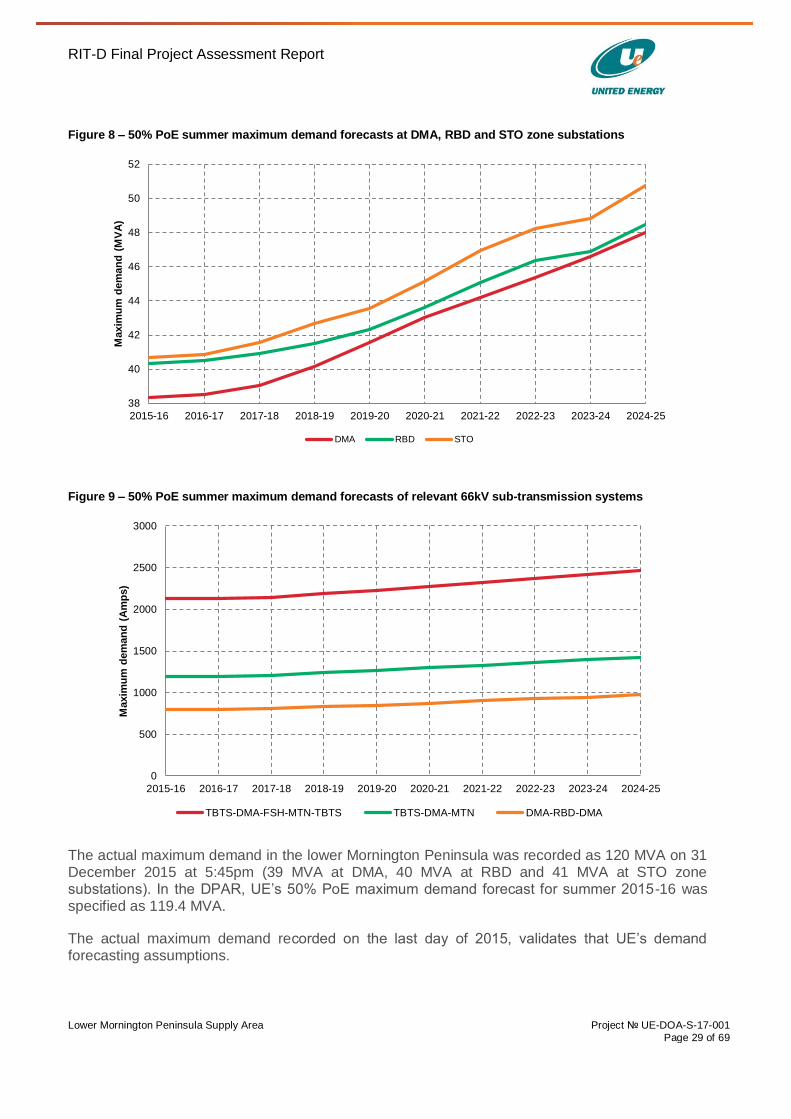
Figure 8 – 50% PoE summer maximum demand forecasts at DMA, RBD and STO zone substations
Figure 9 – 50% PoE summer maximum demand forecasts of relevant 66kV sub-transmission systems
The actual maximum demand in the lower Mornington Peninsula was recorded as 120 MVA on 31 December 2015 at 5:45pm (39 MVA at DMA, 40 MVA at RBD and 41 MVA at STO zone substations). In the DPAR, UE’s 50% PoE maximum demand forecast for summer 2015-16 was specified as 119.4 MVA.
The actual maximum demand recorded on the last day of 2015, validates that UE’s demand forecasting assumptions.
38
40
42
44
46
48
50
52
2015-16 2016-17 2017-18 2018-19 2019-20 2020-21 2021-22 2022-23 2023-24 2024-25
Maxim
um
dem
an
d (
MV
A)
DMA RBD STO
0
500
1000
1500
2000
2500
3000
2015-16 2016-17 2017-18 2018-19 2019-20 2020-21 2021-22 2022-23 2023-24 2024-25
Maxim
um
dem
an
d (
Am
ps)
TBTS-DMA-FSH-MTN-TBTS TBTS-DMA-MTN DMA-RBD-DMA
RIT-D Final Project Assessment Report
Lower Mornington Peninsula Supply Area Project № UE-DOA-S-17-001
Page 30 of 69
The amount of expected unserved energy is estimated in this report by taking 30% weighting of the unserved energy at 10% PoE demand forecast and 70% weighting of the unserved energy at 50% PoE demand forecast.
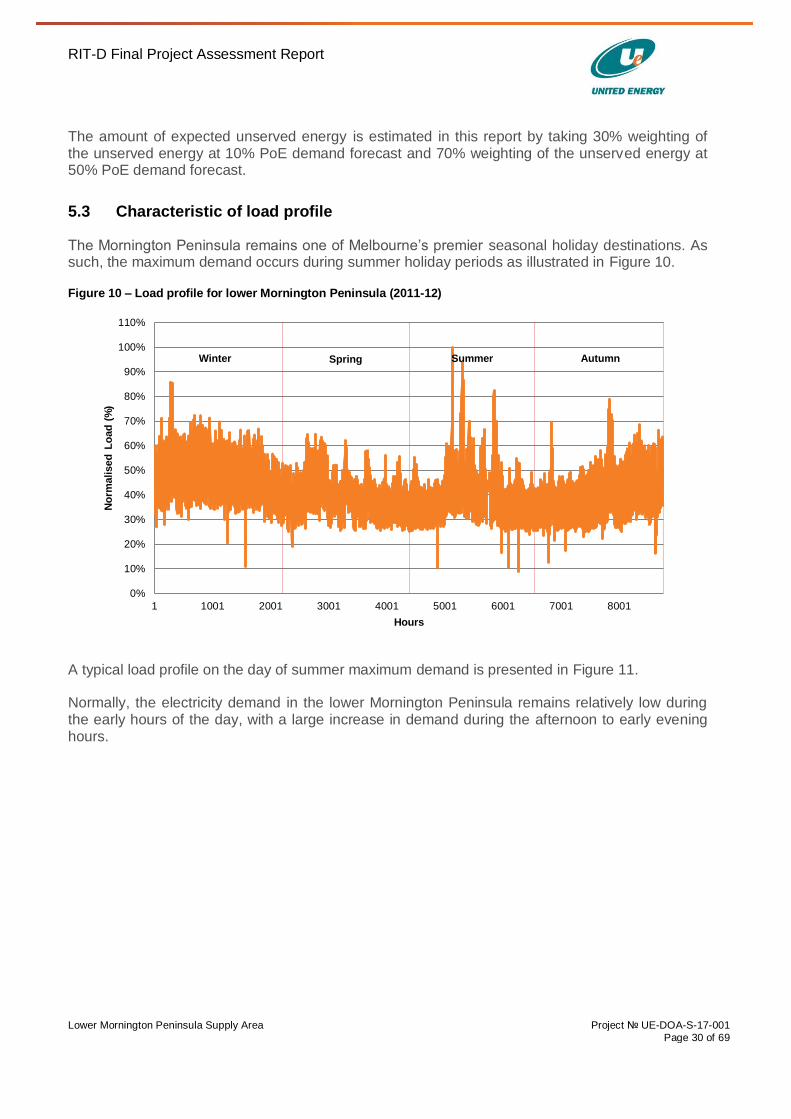
5.3 Characteristic of load profile
The Mornington Peninsula remains one of Melbourne’s premier seasonal holiday destinations. As such, the maximum demand occurs during summer holiday periods as illustrated in Figure 10.
Figure 10 – Load profile for lower Mornington Peninsula (2011-12)
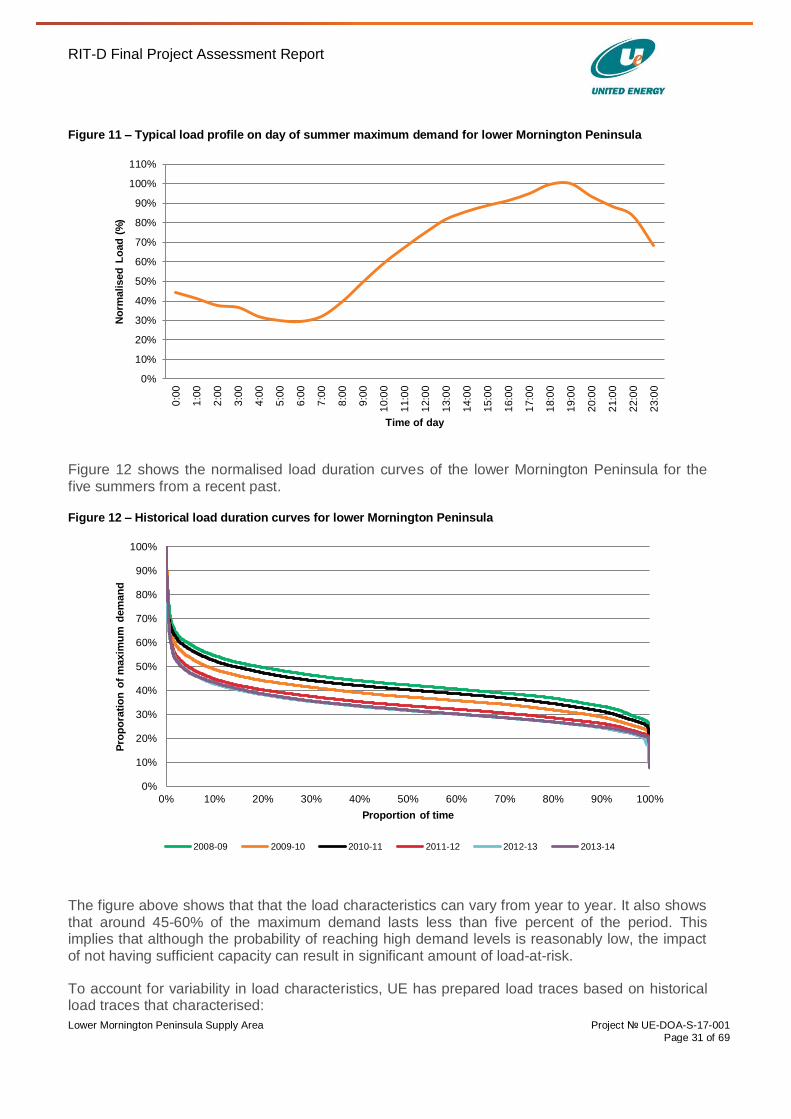
A typical load profile on the day of summer maximum demand is presented in Figure 11.
Normally, the electricity demand in the lower Mornington Peninsula remains relatively low during the early hours of the day, with a large increase in demand during the afternoon to early evening hours.
0%
10%
20%
30%
40%
50%
60%
70%
80%
90%
100%
110%
1 1001 2001 3001 4001 5001 6001 7001 8001
No
rmalised
Lo
ad
(%
)
Hours
Winter Spring Summer Autumn
RIT-D Final Project Assessment Report
Lower Mornington Peninsula Supply Area Project № UE-DOA-S-17-001
Page 31 of 69
Figure 11 – Typical load profile on day of summer maximum demand for lower Mornington Peninsula
Figure 12 shows the normalised load duration curves of the lower Mornington Peninsula for the five summers from a recent past.
Figure 12 – Historical load duration curves for lower Mornington Peninsula
The figure above shows that that the load characteristics can vary from year to year. It also shows that around 45-60% of the maximum demand lasts less than five percent of the period. This implies that although the probability of reaching high demand levels is reasonably low, the impact of not having sufficient capacity can result in significant amount of load-at-risk.
To account for variability in load characteristics, UE has prepared load traces based on historical load traces that characterised:
0%
10%
20%
30%
40%
50%
60%
70%
80%
90%
100%
110%0
:00
1:0
0
2:0
0
3:0
0
4:0
0
5:0
0
6:0
0
7:0
0
8:0
0
9:0
0
10:0
0
11:0
0
12:0
0
13:0
0
14:0
0
15:0
0
16:0
0
17:0
0
18:0
0
19:0
0
20:0
0
21:0
0
22:0
0
23:0
0
No
rmalised
Lo
ad
(%
)
Time of day
0%
10%
20%
30%
40%
50%
60%
70%
80%
90%
100%
0% 10% 20% 30% 40% 50% 60% 70% 80% 90% 100%
Pro
po
rati
on
of
maxim
um
dem
an
d
Proportion of time
2008-09 2009-10 2010-11 2011-12 2012-13 2013-14
RIT-D Final Project Assessment Report
Lower Mornington Peninsula Supply Area Project № UE-DOA-S-17-001
Page 32 of 69
10% and 50% PoE demand profiles (or close to) for the lower Mornington Peninsula18;
Maximum demand occurring during summer holiday periods; and
Excludes load transfer from / to neighbouring network.
Based on this approach, the expected unserved energy due to both thermal and voltage limitations were estimated using the 2011-1219 and 2013-1420 historical traces.
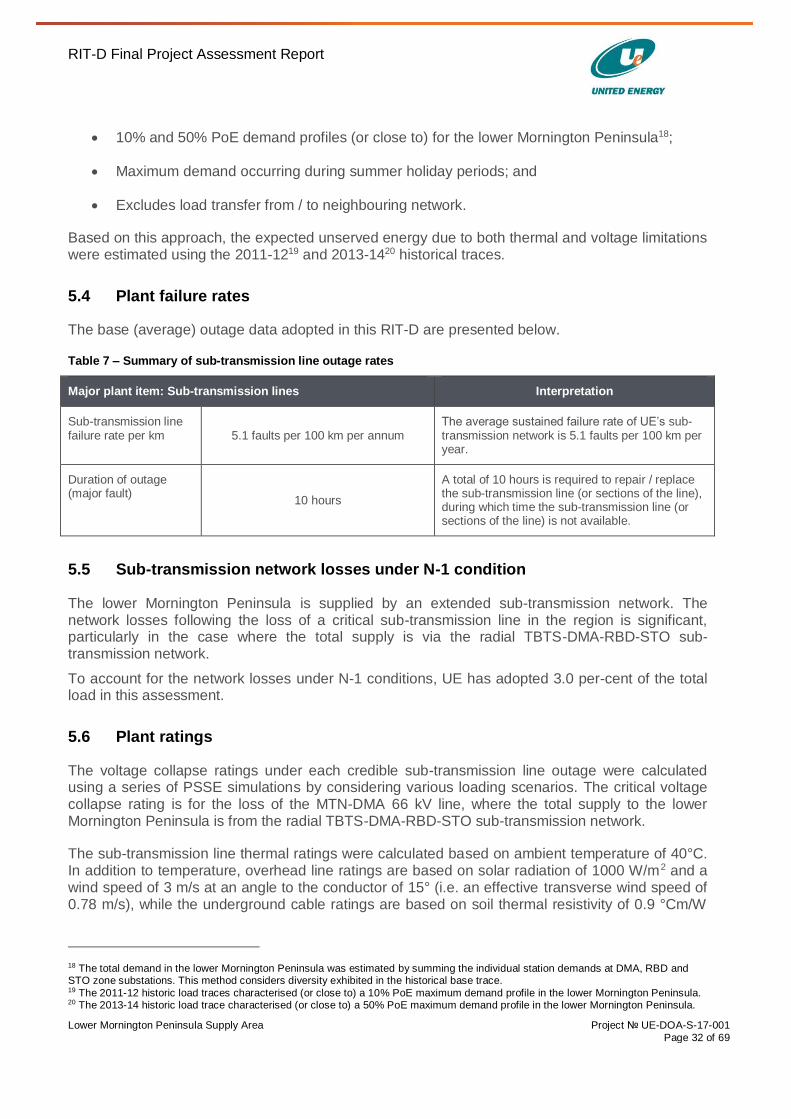
5.4 Plant failure rates
The base (average) outage data adopted in this RIT-D are presented below.
Table 7 – Summary of sub-transmission line outage rates
Major plant item: Sub-transmission lines Interpretation
Sub-transmission line failure rate per km 5.1 faults per 100 km per annum
The average sustained failure rate of UE’s sub-transmission network is 5.1 faults per 100 km per year.
Duration of outage (major fault)
10 hours
A total of 10 hours is required to repair / replace the sub-transmission line (or sections of the line), during which time the sub-transmission line (or sections of the line) is not available.
5.5 Sub-transmission network losses under N-1 condition
The lower Mornington Peninsula is supplied by an extended sub-transmission network. The network losses following the loss of a critical sub-transmission line in the region is significant, particularly in the case where the total supply is via the radial TBTS-DMA-RBD-STO sub-transmission network.
To account for the network losses under N-1 conditions, UE has adopted 3.0 per-cent of the total load in this assessment.
5.6 Plant ratings
The voltage collapse ratings under each credible sub-transmission line outage were calculated using a series of PSSE simulations by considering various loading scenarios. The critical voltage collapse rating is for the loss of the MTN-DMA 66 kV line, where the total supply to the lower Mornington Peninsula is from the radial TBTS-DMA-RBD-STO sub-transmission network.
The sub-transmission line thermal ratings were calculated based on ambient temperature of 40°C. In addition to temperature, overhead line ratings are based on solar radiation of 1000 W/m2 and a wind speed of 3 m/s at an angle to the conductor of 15° (i.e. an effective transverse wind speed of 0.78 m/s), while the underground cable ratings are based on soil thermal resistivity of 0.9 °Cm/W
18 The total demand in the lower Mornington Peninsula was estimated by summing the individual station demands at DMA, RBD and STO zone substations. This method considers diversity exhibited in the historical base trace. 19 The 2011-12 historic load traces characterised (or close to) a 10% PoE maximum demand profile in the lower Mornington Peninsula. 20 The 2013-14 historic load trace characterised (or close to) a 50% PoE maximum demand profile in the lower Mornington Peninsula.
RIT-D Final Project Assessment Report
Lower Mornington Peninsula Supply Area Project № UE-DOA-S-17-001
Page 33 of 69
or 1.2 °Cm/W at specific sites. For underground cables, a typical load profile has been considered to accommodate the variability in demand over time.
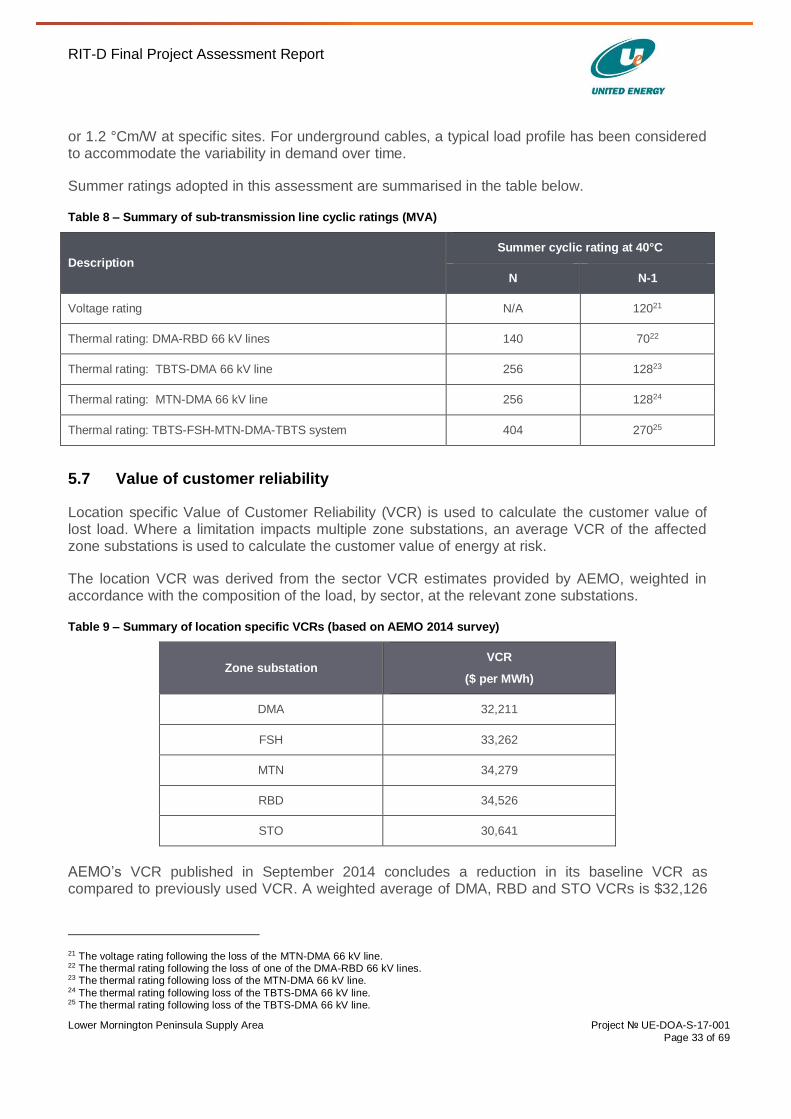
Summer ratings adopted in this assessment are summarised in the table below.
Table 8 – Summary of sub-transmission line cyclic ratings (MVA)
Description
Summer cyclic rating at 40°C
N N-1
Voltage rating N/A 12021
Thermal rating: DMA-RBD 66 kV lines 140 7022
Thermal rating: TBTS-DMA 66 kV line 256 12823
Thermal rating: MTN-DMA 66 kV line 256 12824
Thermal rating: TBTS-FSH-MTN-DMA-TBTS system 404 27025
5.7 Value of customer reliability
Location specific Value of Customer Reliability (VCR) is used to calculate the customer value of lost load. Where a limitation impacts multiple zone substations, an average VCR of the affected zone substations is used to calculate the customer value of energy at risk.
The location VCR was derived from the sector VCR estimates provided by AEMO, weighted in accordance with the composition of the load, by sector, at the relevant zone substations.
Table 9 – Summary of location specific VCRs (based on AEMO 2014 survey)
Zone substation VCR
($ per MWh)
DMA 32,211
FSH 33,262
MTN 34,279
RBD 34,526
STO 30,641
AEMO’s VCR published in September 2014 concludes a reduction in its baseline VCR as compared to previously used VCR. A weighted average of DMA, RBD and STO VCRs is $32,126
21 The voltage rating following the loss of the MTN-DMA 66 kV line. 22 The thermal rating following the loss of one of the DMA-RBD 66 kV lines. 23 The thermal rating following loss of the MTN-DMA 66 kV line. 24 The thermal rating following loss of the TBTS-DMA 66 kV line. 25 The thermal rating following loss of the TBTS-DMA 66 kV line.

RIT-D Final Project Assessment Report
Lower Mornington Peninsula Supply Area Project № UE-DOA-S-17-001
Page 34 of 69
per MWh, which has been used to calculate the market benefits for reducing involuntary load shedding due to voltage limitation.
5.8 Discount rates
To compare cash flows of options with different time profiles, it is necessary to use a discount rate to express future costs and benefits in present value terms. The choice of discount rate will impact on the estimated present value of net market benefits, and may affect the ranking of alternative options.
As compared to NNOR discount rate of 9.5 percent, a real, pre-tax discount rate of 6.12 percent is adopted in this RIT-D following the outcome of the draft 2016-2020 regulatory price review determination.
RIT-D Final Project Assessment Report
Lower Mornington Peninsula Supply Area Project № UE-DOA-S-17-001
Page 35 of 69
6 Summary of submissions
6.1 In response to NNOR
On 26th November 2014, UE published the Non Network Options Report (NNOR) providing details on the network limitations within the Lower Mornington Peninsula supply area. This report sought information from Registered Participants and Interested Parties regarding alternative potential credible options or variants to the potential credible network options presented by UE.
In response to the NNOR, UE received enquiries from several non-network service providers. UE engaged in joint planning with these proponents to assess the viability of credible alternative solutions within the lower Mornington Peninsula supply area. UE received two submissions by 29 May 2015, being the closing date for submissions to the NNOR from:
1. GreenSync Pty Ltd submitted a demand management solution 2. Aggreko Pty Ltd submitted an embedded generation solution
These solutions defer the timing of the proposed network augmentation and result in positive net economic benefit, therefore, considered as credible solutions. Both proponents proposed the ability to start the program in the year which maximises net market benefits and flexibility to extend and expand the demand reduction support to defer network investment.
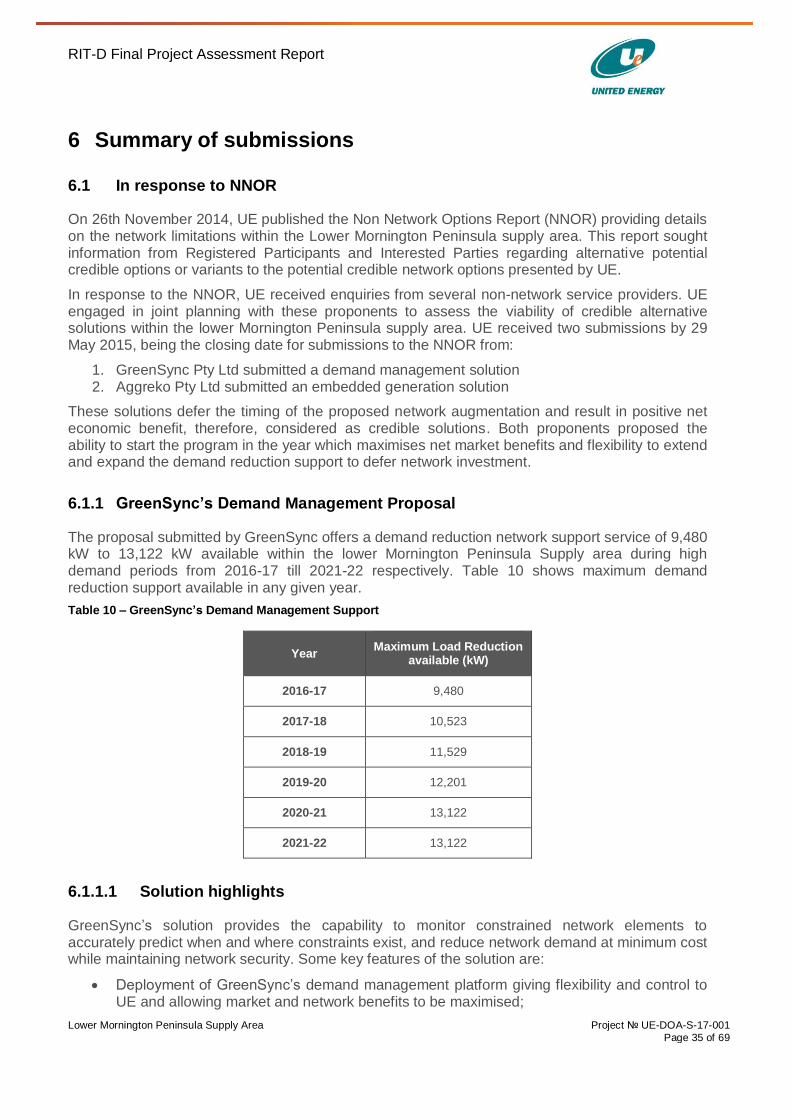
6.1.1 GreenSync’s Demand Management Proposal
The proposal submitted by GreenSync offers a demand reduction network support service of 9,480 kW to 13,122 kW available within the lower Mornington Peninsula Supply area during high demand periods from 2016-17 till 2021-22 respectively. Table 10 shows maximum demand reduction support available in any given year.
Table 10 – GreenSync’s Demand Management Support
Year Maximum Load Reduction
available (kW)
2016-17 9,480
2017-18 10,523
2018-19 11,529
2019-20 12,201
2020-21 13,122
2021-22 13,122
6.1.1.1 Solution highlights
GreenSync’s solution provides the capability to monitor constrained network elements to accurately predict when and where constraints exist, and reduce network demand at minimum cost while maintaining network security. Some key features of the solution are:
Deployment of GreenSync’s demand management platform giving flexibility and control to UE and allowing market and network benefits to be maximised;
RIT-D Final Project Assessment Report
Lower Mornington Peninsula Supply Area Project № UE-DOA-S-17-001
Page 36 of 69
A full suite of five portfolio options (Utility, Commercial & Industrial, Small Business, Residential Storage and Community Driven Curtailment) available for inclusion in UE’s deferral programme;
The ability to start the demand management programme in the year which maximises net market benefits;
The ability to extend and expand the demand reduction support to extend network deferral; and
The community-led programme provides a platform to promote the use of Demand Side Management and next generation grid technologies.
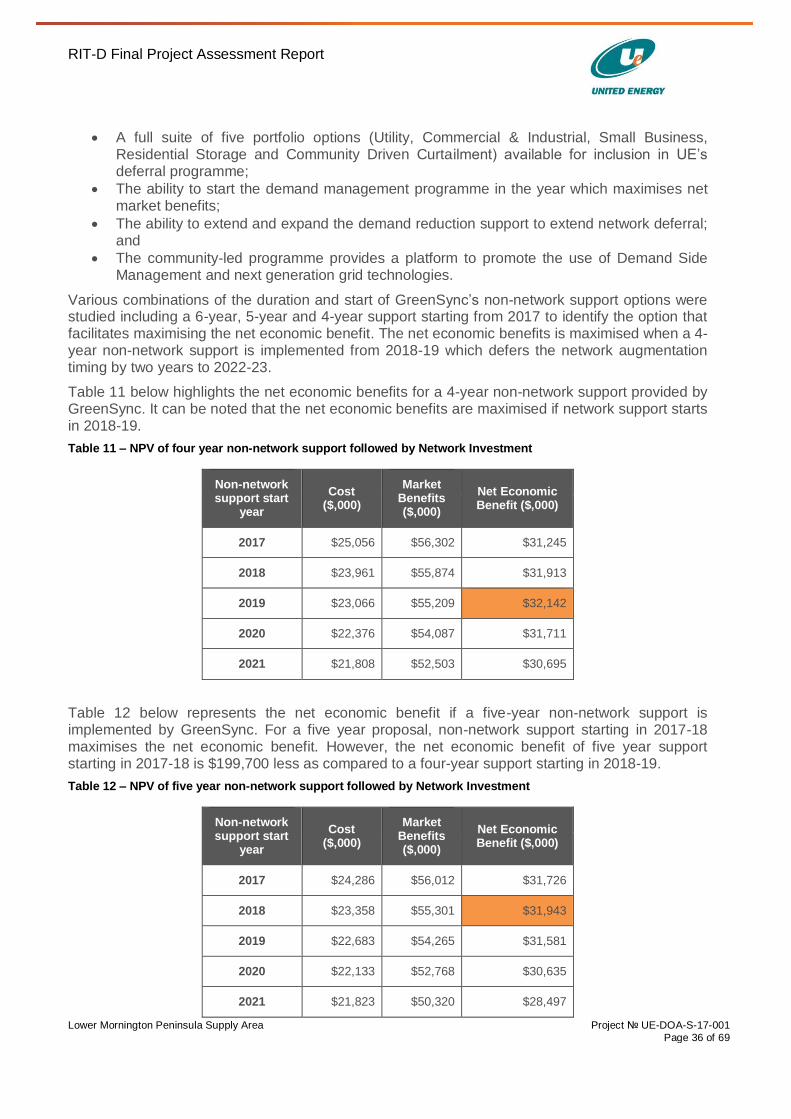
Various combinations of the duration and start of GreenSync’s non-network support options were studied including a 6-year, 5-year and 4-year support starting from 2017 to identify the option that facilitates maximising the net economic benefit. The net economic benefits is maximised when a 4-year non-network support is implemented from 2018-19 which defers the network augmentation timing by two years to 2022-23.
Table 11 below highlights the net economic benefits for a 4-year non-network support provided by GreenSync. It can be noted that the net economic benefits are maximised if network support starts in 2018-19.
Table 11 – NPV of four year non-network support followed by Network Investment
Non-network support start
year
Cost ($,000)
Market Benefits ($,000)
Net Economic Benefit ($,000)
2017 $25,056 $56,302 $31,245
2018 $23,961 $55,874 $31,913
2019 $23,066 $55,209 $32,142
2020 $22,376 $54,087 $31,711
2021 $21,808 $52,503 $30,695
Table 12 below represents the net economic benefit if a five-year non-network support is implemented by GreenSync. For a five year proposal, non-network support starting in 2017-18 maximises the net economic benefit. However, the net economic benefit of five year support starting in 2017-18 is $199,700 less as compared to a four-year support starting in 2018-19.
Table 12 – NPV of five year non-network support followed by Network Investment
Non-network support start
year
Cost ($,000)
Market Benefits ($,000)
Net Economic Benefit ($,000)
2017 $24,286 $56,012 $31,726
2018 $23,358 $55,301 $31,943
2019 $22,683 $54,265 $31,581
2020 $22,133 $52,768 $30,635
2021 $21,823 $50,320 $28,497
RIT-D Final Project Assessment Report
Lower Mornington Peninsula Supply Area Project № UE-DOA-S-17-001
Page 37 of 69
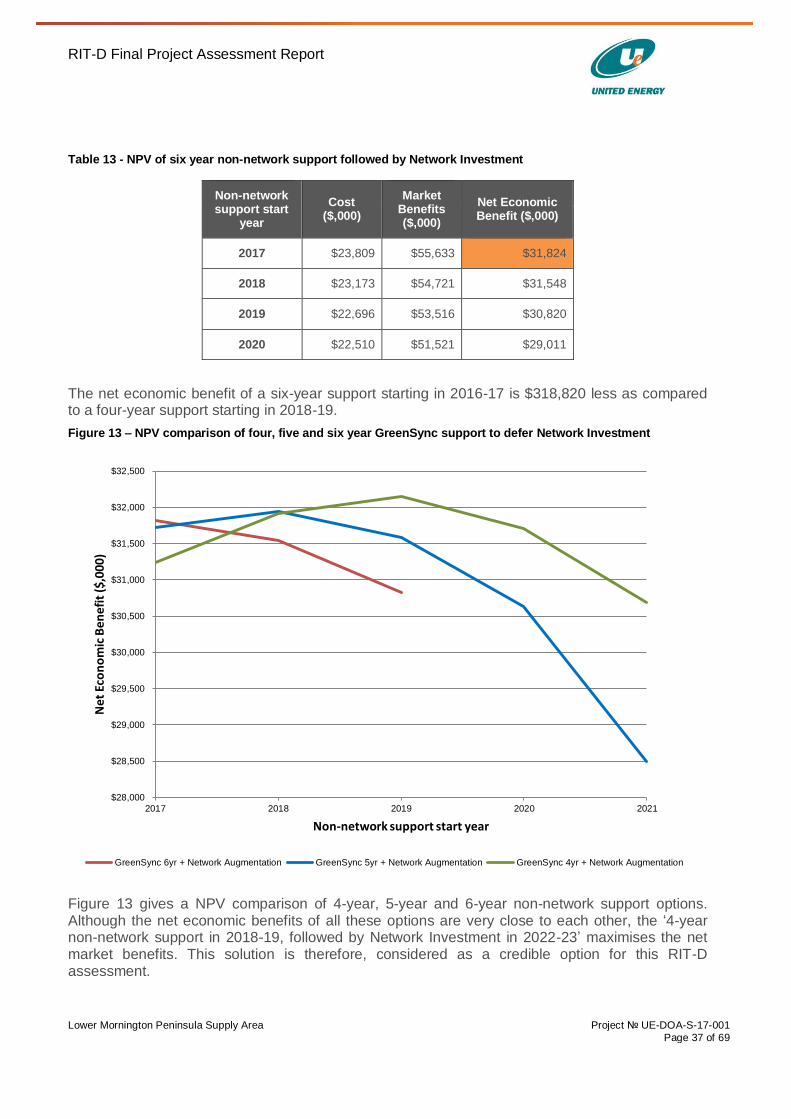
Table 13 - NPV of six year non-network support followed by Network Investment
Non-network support start
year
Cost ($,000)
Market Benefits ($,000)
Net Economic Benefit ($,000)
2017 $23,809 $55,633 $31,824
2018 $23,173 $54,721 $31,548
2019 $22,696 $53,516 $30,820
2020 $22,510 $51,521 $29,011
The net economic benefit of a six-year support starting in 2016-17 is $318,820 less as compared to a four-year support starting in 2018-19.
Figure 13 – NPV comparison of four, five and six year GreenSync support to defer Network Investment
Figure 13 gives a NPV comparison of 4-year, 5-year and 6-year non-network support options. Although the net economic benefits of all these options are very close to each other, the ‘4-year non-network support in 2018-19, followed by Network Investment in 2022-23’ maximises the net market benefits. This solution is therefore, considered as a credible option for this RIT-D assessment.
$28,000
$28,500
$29,000
$29,500
$30,000
$30,500
$31,000
$31,500
$32,000
$32,500
2017 2018 2019 2020 2021
Net
Eco
no
mic
Ben
efit
($,
000)
Non-network support start year
GreenSync 6yr + Network Augmentation GreenSync 5yr + Network Augmentation GreenSync 4yr + Network Augmentation
RIT-D Final Project Assessment Report
Lower Mornington Peninsula Supply Area Project № UE-DOA-S-17-001
Page 38 of 69
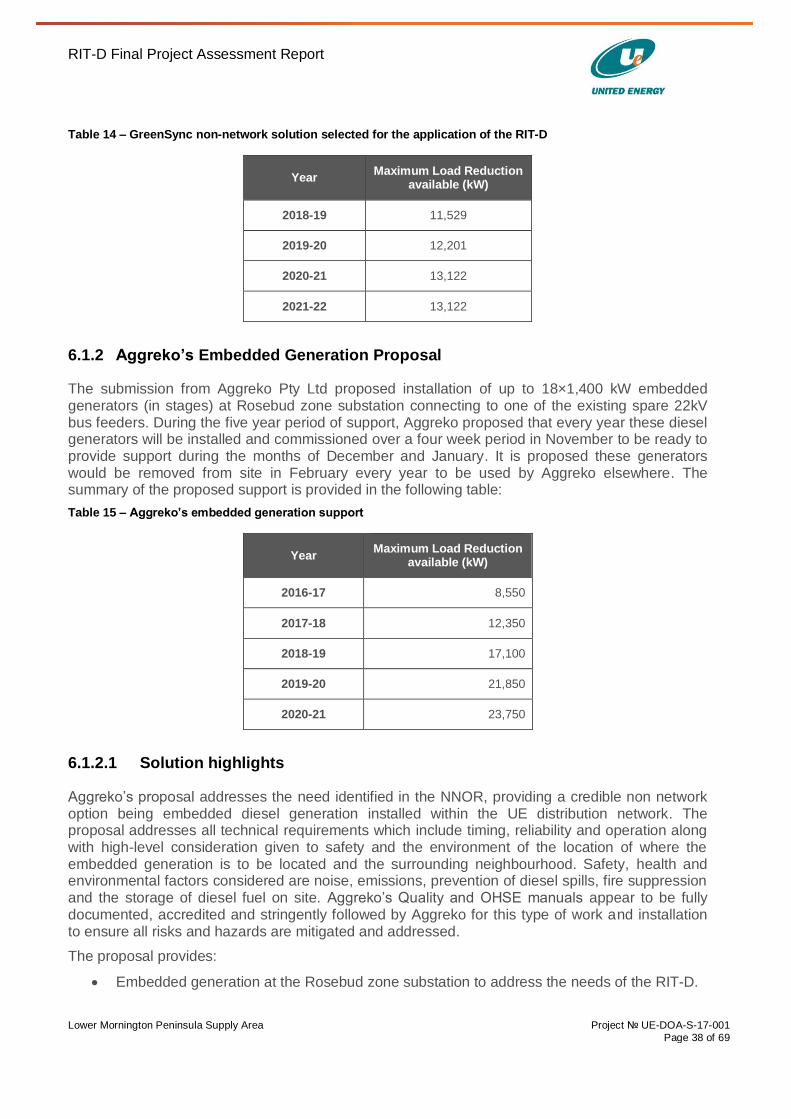
Table 14 – GreenSync non-network solution selected for the application of the RIT-D
Year Maximum Load Reduction
available (kW)
2018-19 11,529
2019-20 12,201
2020-21 13,122
2021-22 13,122
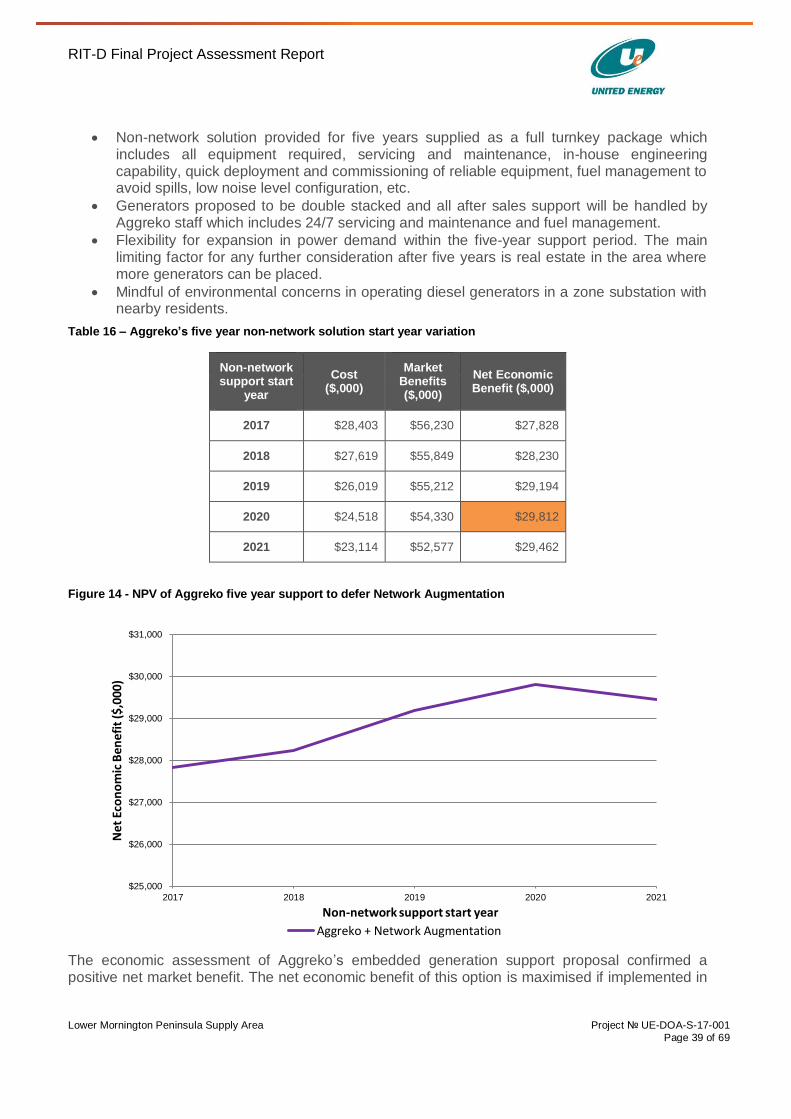
6.1.2 Aggreko’s Embedded Generation Proposal
The submission from Aggreko Pty Ltd proposed installation of up to 18×1,400 kW embedded generators (in stages) at Rosebud zone substation connecting to one of the existing spare 22kV bus feeders. During the five year period of support, Aggreko proposed that every year these diesel generators will be installed and commissioned over a four week period in November to be ready to provide support during the months of December and January. It is proposed these generators would be removed from site in February every year to be used by Aggreko elsewhere. The summary of the proposed support is provided in the following table:
Table 15 – Aggreko’s embedded generation support
Year Maximum Load Reduction
available (kW)
2016-17 8,550
2017-18 12,350
2018-19 17,100
2019-20 21,850
2020-21 23,750
6.1.2.1 Solution highlights
Aggreko’s proposal addresses the need identified in the NNOR, providing a credible non network option being embedded diesel generation installed within the UE distribution network. The proposal addresses all technical requirements which include timing, reliability and operation along with high-level consideration given to safety and the environment of the location of where the embedded generation is to be located and the surrounding neighbourhood. Safety, health and environmental factors considered are noise, emissions, prevention of diesel spills, fire suppression and the storage of diesel fuel on site. Aggreko’s Quality and OHSE manuals appear to be fully documented, accredited and stringently followed by Aggreko for this type of work and installation to ensure all risks and hazards are mitigated and addressed.
The proposal provides:
Embedded generation at the Rosebud zone substation to address the needs of the RIT-D.
RIT-D Final Project Assessment Report
Lower Mornington Peninsula Supply Area Project № UE-DOA-S-17-001
Page 39 of 69
Non-network solution provided for five years supplied as a full turnkey package which includes all equipment required, servicing and maintenance, in-house engineering capability, quick deployment and commissioning of reliable equipment, fuel management to avoid spills, low noise level configuration, etc.
Generators proposed to be double stacked and all after sales support will be handled by Aggreko staff which includes 24/7 servicing and maintenance and fuel management.
Flexibility for expansion in power demand within the five-year support period. The main limiting factor for any further consideration after five years is real estate in the area where more generators can be placed.
Mindful of environmental concerns in operating diesel generators in a zone substation with nearby residents.
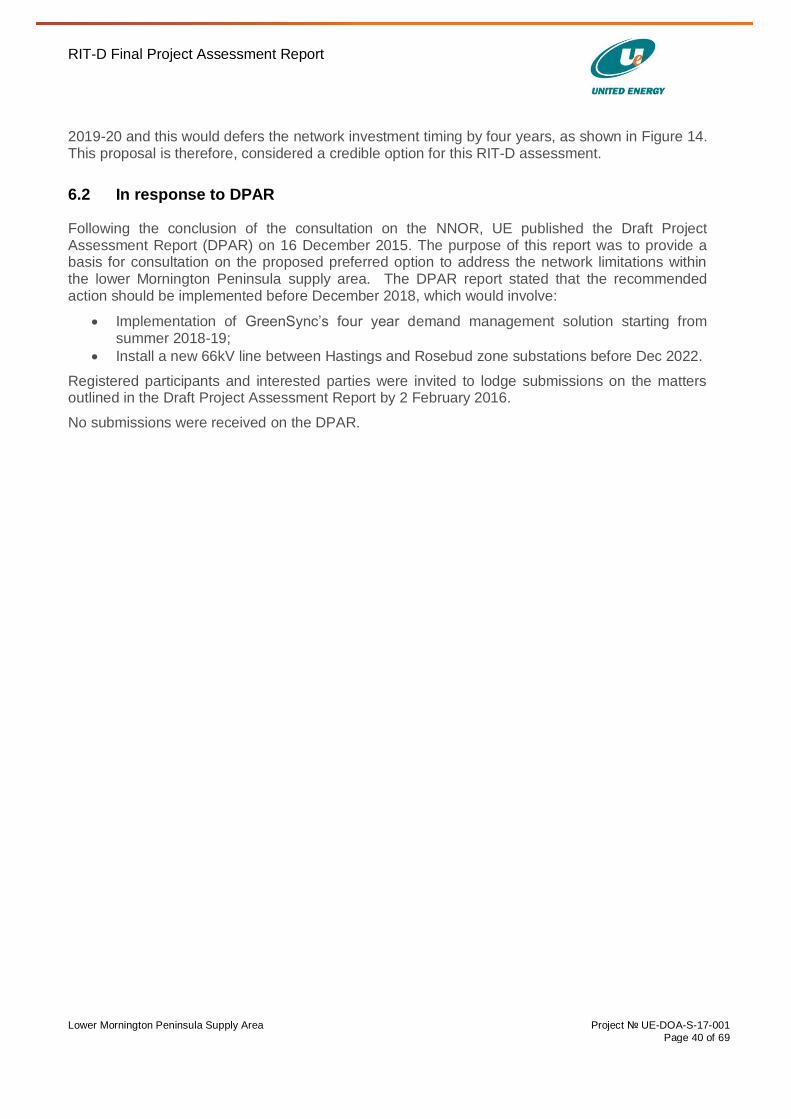
Table 16 – Aggreko’s five year non-network solution start year variation
Non-network support start
year
Cost ($,000)
Market Benefits ($,000)
Net Economic Benefit ($,000)
2017 $28,403 $56,230 $27,828
2018 $27,619 $55,849 $28,230
2019 $26,019 $55,212 $29,194
2020 $24,518 $54,330 $29,812
2021 $23,114 $52,577 $29,462
Figure 14 - NPV of Aggreko five year support to defer Network Augmentation
The economic assessment of Aggreko’s embedded generation support proposal confirmed a positive net market benefit. The net economic benefit of this option is maximised if implemented in
$25,000
$26,000
$27,000
$28,000
$29,000
$30,000
$31,000
2017 2018 2019 2020 2021
Net
Eco
no
mic
Ben
efit
($,0
00)
Non-network support start year
Aggreko + Network Augmentation
RIT-D Final Project Assessment Report
Lower Mornington Peninsula Supply Area Project № UE-DOA-S-17-001
Page 40 of 69
2019-20 and this would defers the network investment timing by four years, as shown in Figure 14. This proposal is therefore, considered a credible option for this RIT-D assessment.
6.2 In response to DPAR
Following the conclusion of the consultation on the NNOR, UE published the Draft Project Assessment Report (DPAR) on 16 December 2015. The purpose of this report was to provide a basis for consultation on the proposed preferred option to address the network limitations within the lower Mornington Peninsula supply area. The DPAR report stated that the recommended action should be implemented before December 2018, which would involve:
Implementation of GreenSync’s four year demand management solution starting from summer 2018-19;
Install a new 66kV line between Hastings and Rosebud zone substations before Dec 2022.
Registered participants and interested parties were invited to lodge submissions on the matters outlined in the Draft Project Assessment Report by 2 February 2016.
No submissions were received on the DPAR.
RIT-D Final Project Assessment Report
Lower Mornington Peninsula Supply Area Project № UE-DOA-S-17-001
Page 41 of 69
7 Credible options included in this RIT-D
UE presented seven network options in the NNOR published on 26 November 2014. Five of these options were regarded as not being credible for the reasons set out in that report. Out of the two remaining credible options, the least cost option was selected for this RIT-D, as both options attracted identical market benefits. UE received submission from two non-network service providers. Both these credible non-network options have been considered for further detailed assessment and application of the RIT-D. A summary of the credible ‘Network Investment’ option (Option 1) and the two credible ‘Non-Network plus deferred Network Investment’ options (Option 2 and Option 3) are presented in the table below to address the identified need. Table 17 – Credible options under consideration
Option Description
1 Install a new HGS-RBD 66 kV line
This option includes:
Installing approximately 53 km of new 66 kV line from Hastings (HGS) zone substation to Rosebud (RBD) zone substation. The new line would be constructed along the south-eastern coast (along the road reserve) of the Mornington Peninsula. Most of the route would involve the reconstruction of existing overhead pole lines.
Installing three 66 kV circuit breakers, one at RBD and two at HGS zone substations.
Upgrade the TBTS-HGS No.1 and No.2 feeder exits at Tyabb Terminal Station (TBTS).
This option will:
Addresses the thermal limitations by reducing utilisation of the constrained sub-transmission network.
Addresses the voltage limitation by improving voltage regulation in the lower Mornington Peninsula.
Addresses the risk of bushfire-related incidents leading to outage of both the DMA-RBD 66 kV lines.
Facilitates the sub-transmission connection of a future zone substation in the Flinders / Shoreham area.
The estimated capital cost of this option is 29.5 million (± 10%) in 2015-16 AUD. Annual operating and maintenance costs are anticipated to be around 0.5% of the capital cost.26
The above-estimate includes the cost of the TBTS-HGS No.1 and No.2 feeder exit upgrade works which would be undertaken by AusNet Transmission Group.
The estimated commissioning date is before summer 2020-21.
The estimated total annual cost of this option is $1,805,400. This cost provides a broad upper bound indication of the maximum contribution from UE which may be available to non-network service providers to avoid this augmentation.
2 GreenSync non-network solution + Deferred Option 1
This option is a hybrid of a non-network solution and network investment project.
Stage 1 - GreenSync non-network solution
26 Based on the average maintenance cost of overhead lines per km.
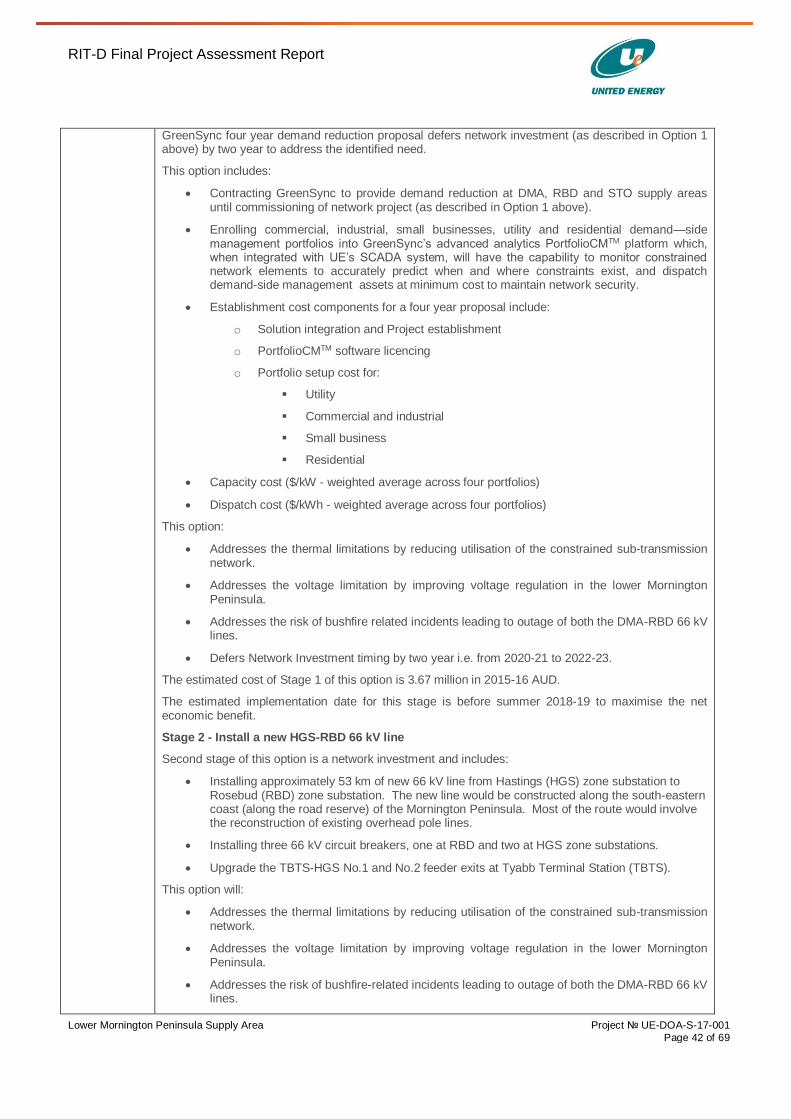
RIT-D Final Project Assessment Report
Lower Mornington Peninsula Supply Area Project № UE-DOA-S-17-001
Page 42 of 69
GreenSync four year demand reduction proposal defers network investment (as described in Option 1 above) by two year to address the identified need.
This option includes:
Contracting GreenSync to provide demand reduction at DMA, RBD and STO supply areas until commissioning of network project (as described in Option 1 above).
Enrolling commercial, industrial, small businesses, utility and residential demand—side management portfolios into GreenSync’s advanced analytics PortfolioCMTM platform which, when integrated with UE’s SCADA system, will have the capability to monitor constrained network elements to accurately predict when and where constraints exist, and dispatch demand-side management assets at minimum cost to maintain network security.
Establishment cost components for a four year proposal include:
o Solution integration and Project establishment
o PortfolioCMTM software licencing
o Portfolio setup cost for:
Utility
Commercial and industrial
Small business
Residential
Capacity cost ($/kW - weighted average across four portfolios)
Dispatch cost ($/kWh - weighted average across four portfolios)
This option:
Addresses the thermal limitations by reducing utilisation of the constrained sub-transmission network.
Addresses the voltage limitation by improving voltage regulation in the lower Mornington Peninsula.
Addresses the risk of bushfire related incidents leading to outage of both the DMA-RBD 66 kV lines.
Defers Network Investment timing by two year i.e. from 2020-21 to 2022-23.
The estimated cost of Stage 1 of this option is 3.67 million in 2015-16 AUD.
The estimated implementation date for this stage is before summer 2018-19 to maximise the net economic benefit.
Stage 2 - Install a new HGS-RBD 66 kV line
Second stage of this option is a network investment and includes:
Installing approximately 53 km of new 66 kV line from Hastings (HGS) zone substation to Rosebud (RBD) zone substation. The new line would be constructed along the south-eastern coast (along the road reserve) of the Mornington Peninsula. Most of the route would involve the reconstruction of existing overhead pole lines.
Installing three 66 kV circuit breakers, one at RBD and two at HGS zone substations.
Upgrade the TBTS-HGS No.1 and No.2 feeder exits at Tyabb Terminal Station (TBTS).
This option will:
Addresses the thermal limitations by reducing utilisation of the constrained sub-transmission network.
Addresses the voltage limitation by improving voltage regulation in the lower Mornington Peninsula.
Addresses the risk of bushfire-related incidents leading to outage of both the DMA-RBD 66 kV lines.
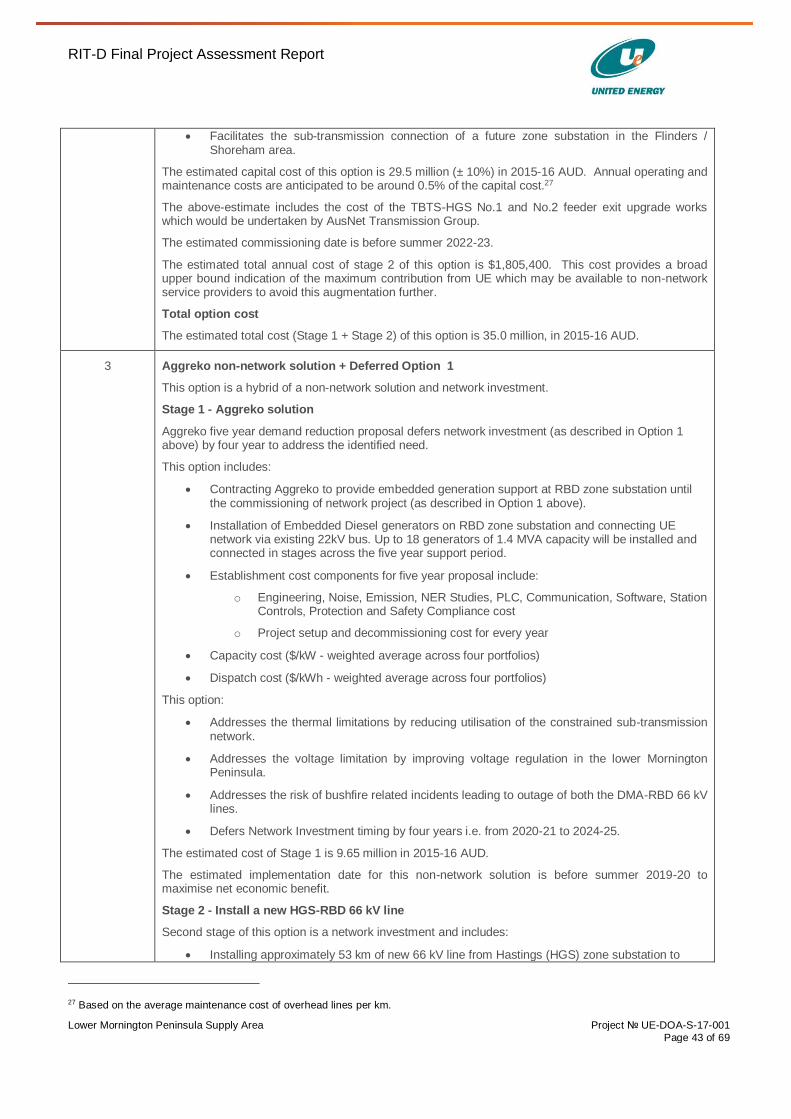
RIT-D Final Project Assessment Report
Lower Mornington Peninsula Supply Area Project № UE-DOA-S-17-001
Page 43 of 69
Facilitates the sub-transmission connection of a future zone substation in the Flinders / Shoreham area.
The estimated capital cost of this option is 29.5 million (± 10%) in 2015-16 AUD. Annual operating and maintenance costs are anticipated to be around 0.5% of the capital cost.27
The above-estimate includes the cost of the TBTS-HGS No.1 and No.2 feeder exit upgrade works which would be undertaken by AusNet Transmission Group.
The estimated commissioning date is before summer 2022-23.
The estimated total annual cost of stage 2 of this option is $1,805,400. This cost provides a broad upper bound indication of the maximum contribution from UE which may be available to non-network service providers to avoid this augmentation further.
Total option cost
The estimated total cost (Stage 1 + Stage 2) of this option is 35.0 million, in 2015-16 AUD.
3 Aggreko non-network solution + Deferred Option 1
This option is a hybrid of a non-network solution and network investment.
Stage 1 - Aggreko solution
Aggreko five year demand reduction proposal defers network investment (as described in Option 1 above) by four year to address the identified need.
This option includes:
Contracting Aggreko to provide embedded generation support at RBD zone substation until the commissioning of network project (as described in Option 1 above).
Installation of Embedded Diesel generators on RBD zone substation and connecting UE network via existing 22kV bus. Up to 18 generators of 1.4 MVA capacity will be installed and connected in stages across the five year support period.
Establishment cost components for five year proposal include:
o Engineering, Noise, Emission, NER Studies, PLC, Communication, Software, Station Controls, Protection and Safety Compliance cost
o Project setup and decommissioning cost for every year
Capacity cost ($/kW - weighted average across four portfolios)
Dispatch cost ($/kWh - weighted average across four portfolios)
This option:
Addresses the thermal limitations by reducing utilisation of the constrained sub-transmission network.
Addresses the voltage limitation by improving voltage regulation in the lower Mornington Peninsula.
Addresses the risk of bushfire related incidents leading to outage of both the DMA-RBD 66 kV lines.
Defers Network Investment timing by four years i.e. from 2020-21 to 2024-25.
The estimated cost of Stage 1 is 9.65 million in 2015-16 AUD.
The estimated implementation date for this non-network solution is before summer 2019-20 to maximise net economic benefit.
Stage 2 - Install a new HGS-RBD 66 kV line
Second stage of this option is a network investment and includes:
Installing approximately 53 km of new 66 kV line from Hastings (HGS) zone substation to
27 Based on the average maintenance cost of overhead lines per km.
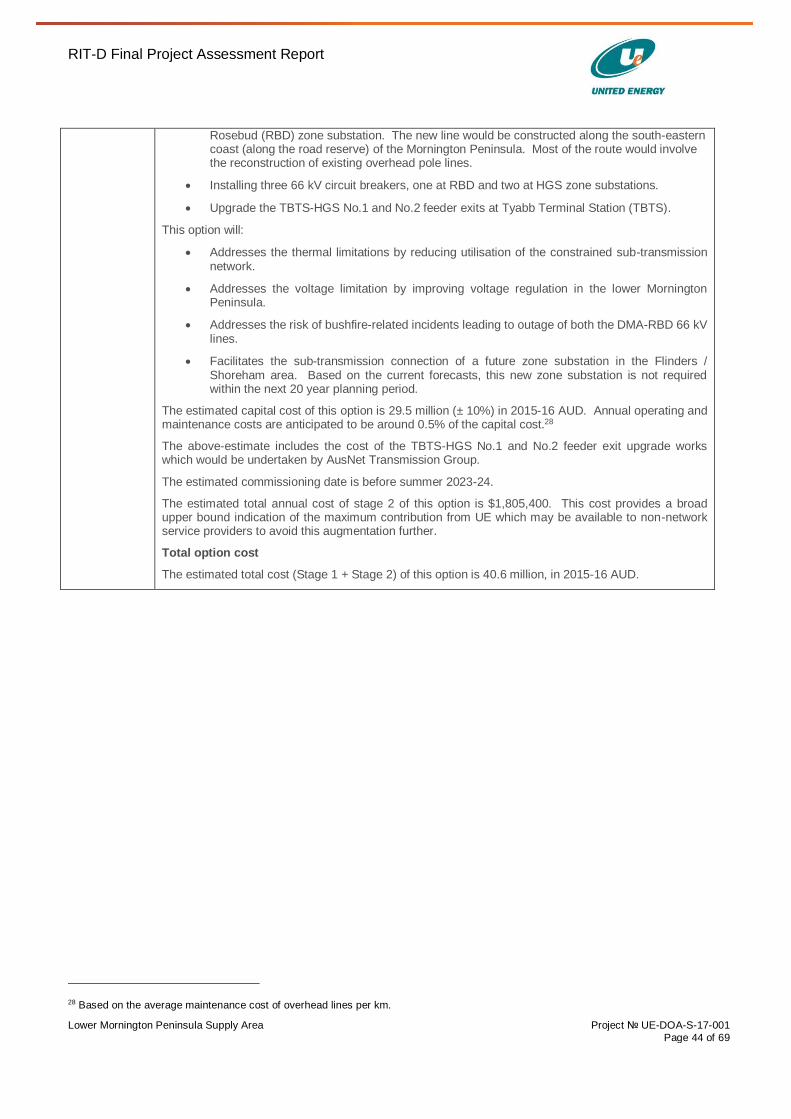
RIT-D Final Project Assessment Report
Lower Mornington Peninsula Supply Area Project № UE-DOA-S-17-001
Page 44 of 69
Rosebud (RBD) zone substation. The new line would be constructed along the south-eastern coast (along the road reserve) of the Mornington Peninsula. Most of the route would involve the reconstruction of existing overhead pole lines.
Installing three 66 kV circuit breakers, one at RBD and two at HGS zone substations.
Upgrade the TBTS-HGS No.1 and No.2 feeder exits at Tyabb Terminal Station (TBTS).
This option will:
Addresses the thermal limitations by reducing utilisation of the constrained sub-transmission network.
Addresses the voltage limitation by improving voltage regulation in the lower Mornington Peninsula.
Addresses the risk of bushfire-related incidents leading to outage of both the DMA-RBD 66 kV lines.
Facilitates the sub-transmission connection of a future zone substation in the Flinders / Shoreham area. Based on the current forecasts, this new zone substation is not required within the next 20 year planning period.
The estimated capital cost of this option is 29.5 million (± 10%) in 2015-16 AUD. Annual operating and maintenance costs are anticipated to be around 0.5% of the capital cost.28
The above-estimate includes the cost of the TBTS-HGS No.1 and No.2 feeder exit upgrade works which would be undertaken by AusNet Transmission Group.
The estimated commissioning date is before summer 2023-24.
The estimated total annual cost of stage 2 of this option is $1,805,400. This cost provides a broad upper bound indication of the maximum contribution from UE which may be available to non-network service providers to avoid this augmentation further.
Total option cost
The estimated total cost (Stage 1 + Stage 2) of this option is 40.6 million, in 2015-16 AUD.
28 Based on the average maintenance cost of overhead lines per km.
RIT-D Final Project Assessment Report
Lower Mornington Peninsula Supply Area Project № UE-DOA-S-17-001
Page 45 of 69
8 Market modelling methodology
The RIT-D requires market benefits to be calculated by comparing the ‘state of the world’ in the base case (where no action is undertaken by UE) with the ‘state of the world’ w ith each of the credible options in place. The ‘state of the world’ means a reasonable and mutually consistent description of all of the relevant supply and demand characteristics and conditions that may affect the calculation of the market benefits over the period of assessment.29 The uncertainty associated with the future state of the world is addressed by considering a number of reasonable scenarios (Refer to Section 9.3).
In order to calculate the outcomes in the relevant ‘state of the world’, UE has developed the risk assessment model which incorporates the key variables that drive market benefits, as discussed in Section 5.
The RIT-D assessment has been undertaken over a twenty-year period (i.e. 2016 - 2035). The modelling discussed in Section 8.1.1 to Section 8.1.2 below has been undertaken across a ten-year study horizon. The market benefits calculated in the final year of the modelling period (i.e. 2024-25) has been applied as the assumed annual market benefit that would continue to arise for a further ten years. This approach of adopting an extended analysis period, based on continuation of an assumed end value is one which has been adopted in similar assessments.30 This approach is reasonable given the long-lived nature of the investments considered in this RIT-D assessment.
8.1 Classes of market benefits considered
The purpose of the RIT-D is to identify the credible option that maximise the present value of net market benefits to all those who produce, consume and transport electricity in the National Electricity Market (NEM).31
In order to measure the increase in net market benefit, UE has analysed the classes of market benefits required to be considered by the RIT-D.32 The market benefits considered not to be material have been identified in Section 8.2 of this FPAR.
The classes of market benefits that are considered material and have been quantified in this RIT-D assessment are:
Changes in involuntary load shedding;
Changes in NEM generation dispatch; and
Changes in network losses.
29 AER: “AER – Final RIT-D Application Guidelines – August 2013”, Section 11.1.
Available http://www.aer.gov.au/node/19146 30 AEMO: Regional Victorian Thermal Upgrade RIT-T – Project Assessment Draft Report, March 2013. Available: http://www.aemo.com.au/Electricity/Planning/Regulatory-Investment-Tests-for-Transmission/Regional-Victorian-Thermal-
Capacity-Upgrade Powerlink and TransGrid: Development of the Queensland – NSW interconnector, March 2014. Available: http://www.transgrid.com.au/network/consultations/Pages/CurrentConsultations.aspx 31 AER: “AER – Final RIT-D Application Guidelines – August 2013”, Section 1.1. Available http://www.aer.gov.au/node/19146 32 NER: clause 5.17.1(c) paragraph 4.
RIT-D Final Project Assessment Report
Lower Mornington Peninsula Supply Area Project № UE-DOA-S-17-001
Page 46 of 69
8.1.1 Changes in involuntary load shedding
Reducing the demand within the lower Mornington Peninsula supply area during high demand periods will keep lower Mornington Peninsula maximum demand below 120 MVA and therefore maintains the electricity supply reliability for the customers connected to the network. The most critical contingency, when lower Mornington Peninsula maximum demand is above 120 MVA, is voltage collapse in this region. For UE to maintain regulatory compliance the maximum demand in the lower Mornington Peninsula should be managed within 120 MVA at all times. This will maintain reliability for this region by avoiding potential supply interruptions and the consequent risk of involuntary load shedding. Thermal limitations also arise at demand levels above N-1 capability of the sub-transmission network. As there is a low probability associated with a sub-transmission line major outage during maximum demand periods, the thermal risk is significantly lower as compared to the risk due to voltage limitation.
UE has used the risk assessment model to calculate the impact of changes in involuntary load shedding by comparing the expected unserved energy under the base case (where no action is undertaken by UE) with each of the credible options in place. Specifically, the model estimates the customer value of lost load by estimating the magnitude of unserved energy in each hour over the modelling period (expressed in kWh), after considering the impact of load transfers, and applying the locational VCR (expressed in $/kWh).
An increase in the customer value of lost load (compared to the base case) makes a negative contribution to the market benefit of a credible option while a reduction in the customer value of lost load (compared to the base case) makes a positive contribution to the market benefit of a credible option.
The expected unserved energy arising from demand levels above the voltage collapse or thermal limitations within the lower Mornington Peninsula area has been quantified as follows:
1. Identify the expected unserved energy at DMA, RBD and STO zone substations under system normal conditions (i.e. N condition) when total demand is above 120 MVA as shown in Table 4.
2. Identify the incremental expected unserved energy at RBD and STO zone substations due to loss of any one of the two DMA to RBD 66 kV lines (N-1 condition).
3. Identify the incremental expected unserved energy at DMA, RBD and STO zone substations following loss of the MTN to DMA 66 kV line (N-1 condition).
4. Identify the incremental expected unserved energy at DMA, RBD and STO zone substations following loss of the TBTS to DMA 66 kV line (N-1 condition).
5. Identify the incremental expected unserved energy at MTN, FSH, DMA, RBD and STO zone substations following loss of the TBTS to MTN 66 kV line (N-1 condition).
The combined expected unserved energy from (1) to (5) represents the expected unserved energy due to insufficient network capability (both voltage and thermal) to meet the maximum demand within the lower Mornington Peninsula region. The weighted average of this expected unserved energy will define the maximum reduction in involuntary load shedding which is likely to be needed as shown in Figure 1.
The customer value of energy at risk was calculated by identifying the expected unserved energy due to both voltage and thermal limitations i.e. due to demand excursion beyond 120 MVA within
RIT-D Final Project Assessment Report
Lower Mornington Peninsula Supply Area Project № UE-DOA-S-17-001
Page 47 of 69
the lower Mornington Peninsula (DMA, RBD and STO zone substations) and demand excursions above the thermal rating of sub-transmission lines in the area and multiplying it by the average locational VCR $32,126 per MWh.
The identified customer value of energy at risk was treated as a market benefit to justify all credible options discussed in Table 17. Market benefits were calculated depending upon the amount of reduction in involuntary load shedding achieved by implementing each credible option. In each credible option, full market benefits are achieved from the commissioning year of the network augmentation until 2035.
8.1.2 Changes in NEM generation dispatch
During high demand events, non-network service providers will offset the peak demand by using their demand reduction portfolios or embedded generation at a distribution network level. This will reduce the amount of generation dispatch required in the NEM. Victorian electricity spot price for 2015 has been identified as $50 per MWh by averaging out 10 Victorian highest demand intervals. This number was verified to be very close to the electricity spot price when lower Mornington Peninsula peak demand occurred on 2 January 2012 between 1600 to 1730 hrs.
The reduction in involuntary load shedding achieved by each option was multiplied by the electricity spot price to determine this second class of market benefits for each option. Although these benefits are negligibly small, they have been included in this RIT-D assessment for the purpose of completeness.
8.1.3 Changes in network losses
Reducing the power flow within the lower Mornington Peninsula area during the high demand periods can lead to a reduction in network losses compared with the level of network losses which would occur under ‘do nothing’.
The market benefits associated with the change in network losses have been quantified by a direct calculation of the likely MWh impact on the losses for each year of the modelling horizon. Specifically, losses on the sub-transmission lines and zone substations have been estimated by multiplying the network losses at the time of maximum demand by the loss load factor of 7.7%33. This MWh figure for losses has then been multiplied by the value of those losses, as measured by the average Victorian spot price for 2015, in accordance with the methodology prescribed in the RIT-D Applications Guidelines34. Reduction in network losses due to network augmentation has been calculated as 4.67 MW (3,150 MWh) in 2020-21, increasing up to 8.86 MW (5,976 MWh) in 2024-25. Although the reduction in network losses due of demand curtailment, implemented by the non-network service providers, is significantly low, however, for the purpose of completeness it has been included in this RIT-D assessment.
The average Victorian spot price for 2015 has been assumed to be $50 per MWh in this RIT-D assessment. This value has been derived from the average monthly Victorian spot prices published on AEMO’s website35.
33 The load loss factor of TBTS sub-transmission loop has been estimated by using a PSSE model. 34 AER: “AER – Final RIT-D Application Guidelines – August 2013”, Example 22. Available http://www.aer.gov.au/node/19146
35 AEMO: Average Victorian spot prices. Available at: http://www.aemo.com.au/Electricity/Data/Price-and-Demand/Average-Price-Tables
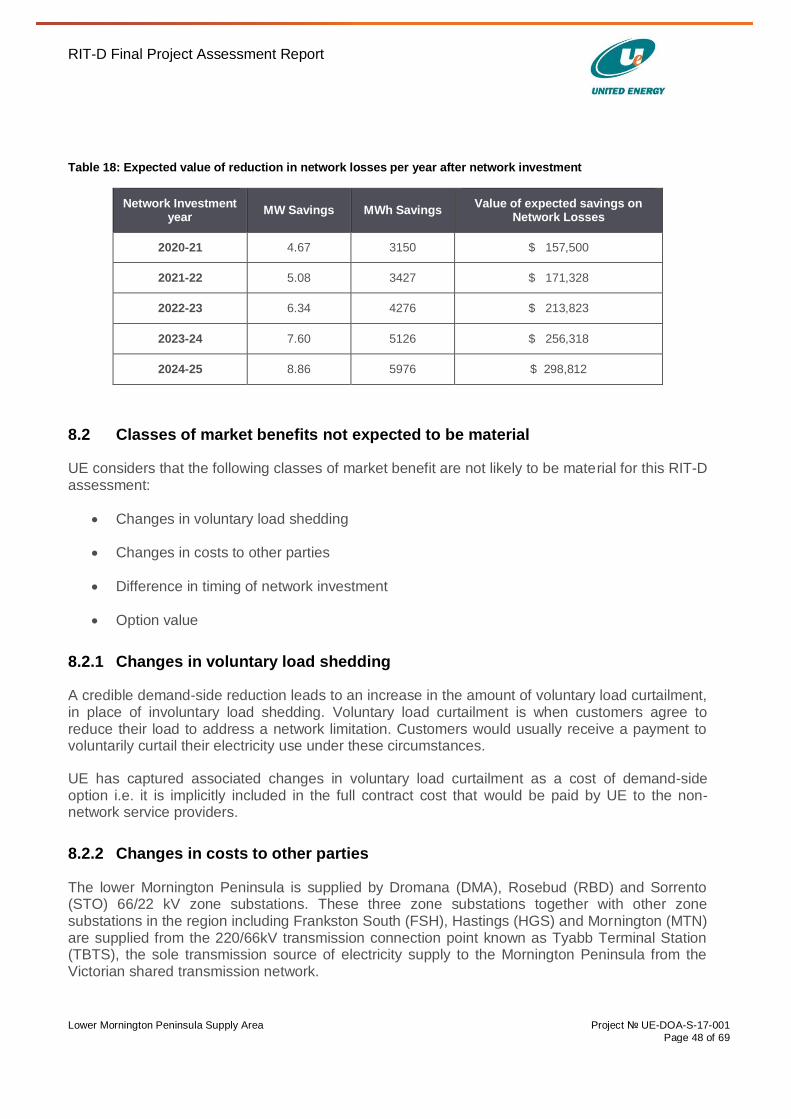
RIT-D Final Project Assessment Report
Lower Mornington Peninsula Supply Area Project № UE-DOA-S-17-001
Page 48 of 69
Table 18: Expected value of reduction in network losses per year after network investment
Network Investment year
MW Savings MWh Savings Value of expected savings on
Network Losses
2020-21 4.67 3150 $ 157,500
2021-22 5.08 3427 $ 171,328
2022-23 6.34 4276 $ 213,823
2023-24 7.60 5126 $ 256,318
2024-25 8.86 5976 $ 298,812
8.2 Classes of market benefits not expected to be material
UE considers that the following classes of market benefit are not likely to be material for this RIT-D assessment:
Changes in voluntary load shedding
Changes in costs to other parties
Difference in timing of network investment
Option value
8.2.1 Changes in voluntary load shedding
A credible demand-side reduction leads to an increase in the amount of voluntary load curtailment, in place of involuntary load shedding. Voluntary load curtailment is when customers agree to reduce their load to address a network limitation. Customers would usually receive a payment to voluntarily curtail their electricity use under these circumstances.
UE has captured associated changes in voluntary load curtailment as a cost of demand-side option i.e. it is implicitly included in the full contract cost that would be paid by UE to the non-network service providers.
8.2.2 Changes in costs to other parties
The lower Mornington Peninsula is supplied by Dromana (DMA), Rosebud (RBD) and Sorrento (STO) 66/22 kV zone substations. These three zone substations together with other zone substations in the region including Frankston South (FSH), Hastings (HGS) and Mornington (MTN) are supplied from the 220/66kV transmission connection point known as Tyabb Terminal Station (TBTS), the sole transmission source of electricity supply to the Mornington Peninsula from the Victorian shared transmission network.
RIT-D Final Project Assessment Report
Lower Mornington Peninsula Supply Area Project № UE-DOA-S-17-001
Page 49 of 69
All credible options considered in this RIT-D assessment address the ‘identified need’ within UE’s distribution network in the Mornington Peninsula. UE does not propose to transfer load from another transmission connection point to TBTS (or vice versa) under each of the credible option. UE therefore does not consider any transmission investments would be affected by the credible options.
As a result, UE has not estimated any market benefit associated with changes in costs to other parties.
8.2.3 Difference in timing of distribution investment
All credible options considered in this RIT-D assessment address the ‘identified need’ within the lower Mornington Peninsula supply area. At this stage no further distribution investments are anticipated within this region within the next 20 year planning horizon. Implementation of these options may affect the timing of other distribution investments for unrelated identified needs. However, these credible options are not expected to materially change the timing of future investments being considered by UE.
UE therefore has not estimated any additional distribution investment market benefit.
8.2.4 Option value
UE notes the AER’s view that option value is likely to arise where there is uncertainty regarding future outcomes, the information that is available in the future is likely to change and the credible options considered by the RIT-D proponent are sufficiently flexible to respond to that change.36
UE also notes the AER’s view that appropriate identification of credible option (and reasonable scenarios) captures any option value as a class of market benefit under the RIT-D.
UE considers that the estimation of any option value benefits captured via the scenario analysis and comparison of the credible option under those scenarios would be adequate to meet the NER requirements to consider option value as a class of market benefit. UE therefore does not propose to estimate any additional option value market benefit for this RIT-D assessment.
8.3 Quantification of costs for each credible option
The capital and operating cost assumptions for each credible option considered in this RIT-D assessment are summarised in Table 19.
Table 19 – Summary of project costs
Option Capital cost Operational cost
Do Nothing Zero Expected value of unserved energy valued at VCR provided in Table 9.
Option 1 $29.5 million Expected value of unserved energy valued at VCR provided in Table 9.
Asset operating and maintenance expenditure of 0.5% per
36 AER: “AER – Final RIT-D Application Guidelines – August 2013”, Section A6. Available http://www.aer.gov.au/node/19146
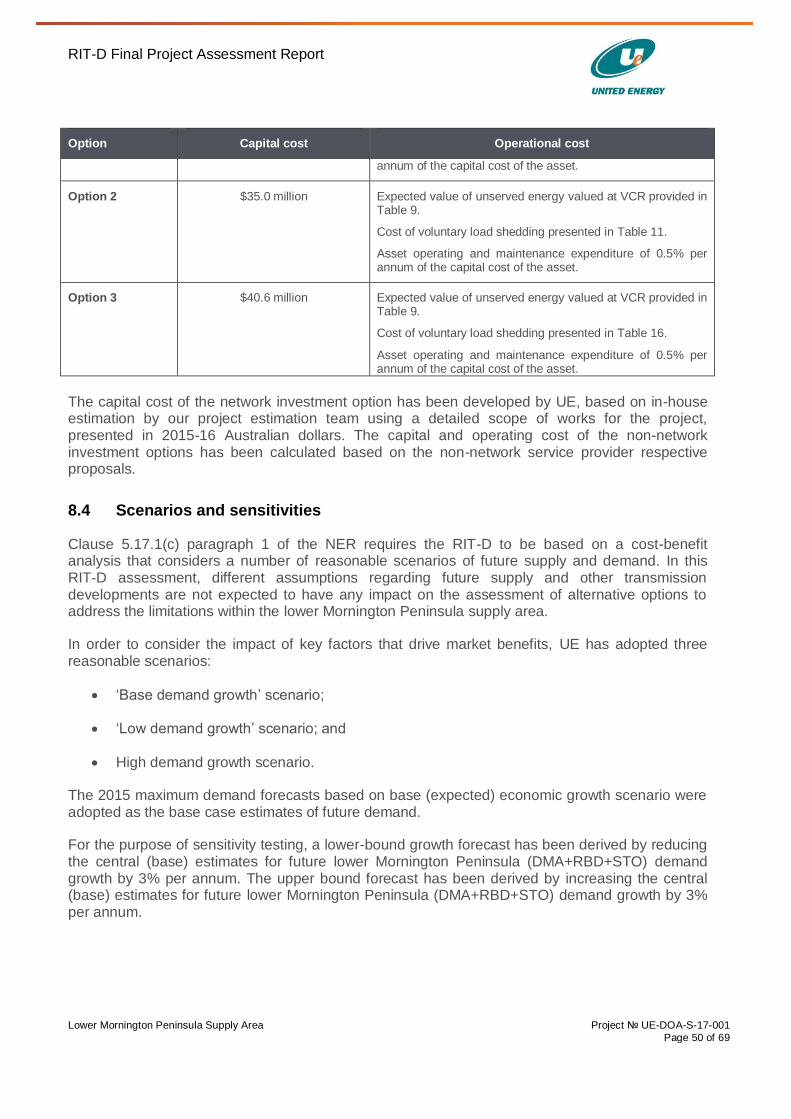
RIT-D Final Project Assessment Report
Lower Mornington Peninsula Supply Area Project № UE-DOA-S-17-001
Page 50 of 69
Option Capital cost Operational cost
annum of the capital cost of the asset.
Option 2 $35.0 million Expected value of unserved energy valued at VCR provided in Table 9.
Cost of voluntary load shedding presented in Table 11.
Asset operating and maintenance expenditure of 0.5% per annum of the capital cost of the asset.
Option 3 $40.6 million Expected value of unserved energy valued at VCR provided in Table 9.
Cost of voluntary load shedding presented in Table 16.
Asset operating and maintenance expenditure of 0.5% per annum of the capital cost of the asset.
The capital cost of the network investment option has been developed by UE, based on in-house estimation by our project estimation team using a detailed scope of works for the project, presented in 2015-16 Australian dollars. The capital and operating cost of the non-network investment options has been calculated based on the non-network service provider respective proposals.
8.4 Scenarios and sensitivities
Clause 5.17.1(c) paragraph 1 of the NER requires the RIT-D to be based on a cost-benefit analysis that considers a number of reasonable scenarios of future supply and demand. In this RIT-D assessment, different assumptions regarding future supply and other transmission developments are not expected to have any impact on the assessment of alternative options to address the limitations within the lower Mornington Peninsula supply area.
In order to consider the impact of key factors that drive market benefits, UE has adopted three reasonable scenarios:
‘Base demand growth’ scenario;
‘Low demand growth’ scenario; and
High demand growth scenario.
The 2015 maximum demand forecasts based on base (expected) economic growth scenario were adopted as the base case estimates of future demand.
For the purpose of sensitivity testing, a lower-bound growth forecast has been derived by reducing the central (base) estimates for future lower Mornington Peninsula (DMA+RBD+STO) demand growth by 3% per annum. The upper bound forecast has been derived by increasing the central (base) estimates for future lower Mornington Peninsula (DMA+RBD+STO) demand growth by 3% per annum.
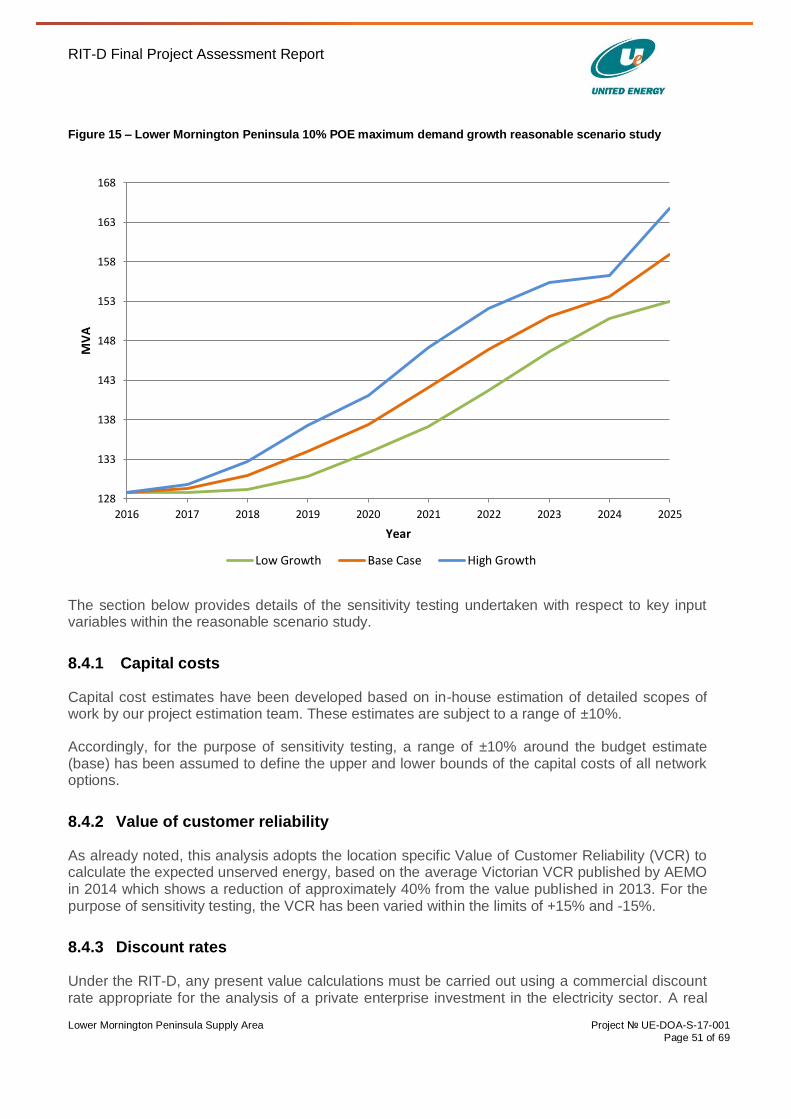
RIT-D Final Project Assessment Report
Lower Mornington Peninsula Supply Area Project № UE-DOA-S-17-001
Page 51 of 69
Figure 15 – Lower Mornington Peninsula 10% POE maximum demand growth reasonable scenario study
The section below provides details of the sensitivity testing undertaken with respect to key input variables within the reasonable scenario study.
8.4.1 Capital costs
Capital cost estimates have been developed based on in-house estimation of detailed scopes of work by our project estimation team. These estimates are subject to a range of ±10%.
Accordingly, for the purpose of sensitivity testing, a range of ±10% around the budget estimate (base) has been assumed to define the upper and lower bounds of the capital costs of all network options.
8.4.2 Value of customer reliability
As already noted, this analysis adopts the location specific Value of Customer Reliability (VCR) to calculate the expected unserved energy, based on the average Victorian VCR published by AEMO in 2014 which shows a reduction of approximately 40% from the value published in 2013. For the purpose of sensitivity testing, the VCR has been varied within the limits of +15% and -15%.
8.4.3 Discount rates
Under the RIT-D, any present value calculations must be carried out using a commercial discount rate appropriate for the analysis of a private enterprise investment in the electricity sector. A real
128
133
138
143
148
153
158
163
168
2016 2017 2018 2019 2020 2021 2022 2023 2024 2025
MV
A
Year
Low Growth Base Case High Growth
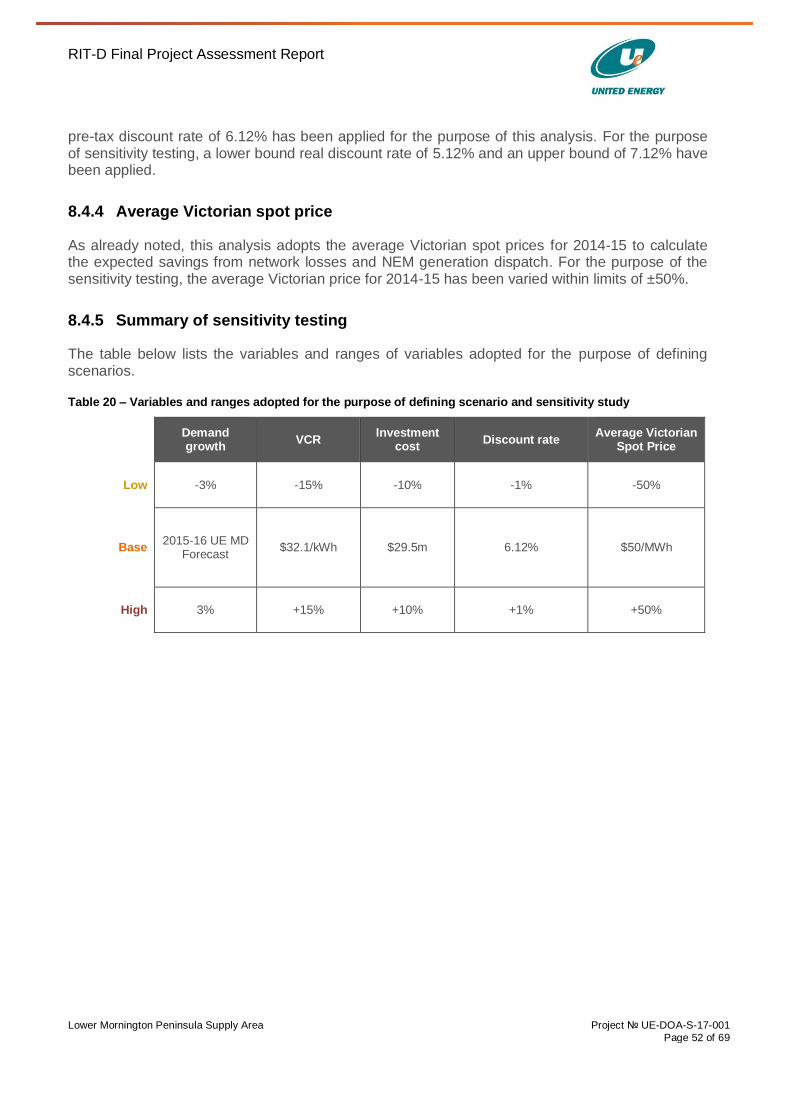
RIT-D Final Project Assessment Report
Lower Mornington Peninsula Supply Area Project № UE-DOA-S-17-001
Page 52 of 69
pre-tax discount rate of 6.12% has been applied for the purpose of this analysis. For the purpose of sensitivity testing, a lower bound real discount rate of 5.12% and an upper bound of 7.12% have been applied.
8.4.4 Average Victorian spot price
As already noted, this analysis adopts the average Victorian spot prices for 2014-15 to calculate the expected savings from network losses and NEM generation dispatch. For the purpose of the sensitivity testing, the average Victorian price for 2014-15 has been varied within limits of ±50%.
8.4.5 Summary of sensitivity testing
The table below lists the variables and ranges of variables adopted for the purpose of defining scenarios.
Table 20 – Variables and ranges adopted for the purpose of defining scenario and sensitivity study
Demand growth
VCR Investment
cost Discount rate
Average Victorian Spot Price
Low -3% -15% -10% -1% -50%
Base 2015-16 UE MD
Forecast $32.1/kWh $29.5m 6.12% $50/MWh
High 3% +15% +10% +1% +50%
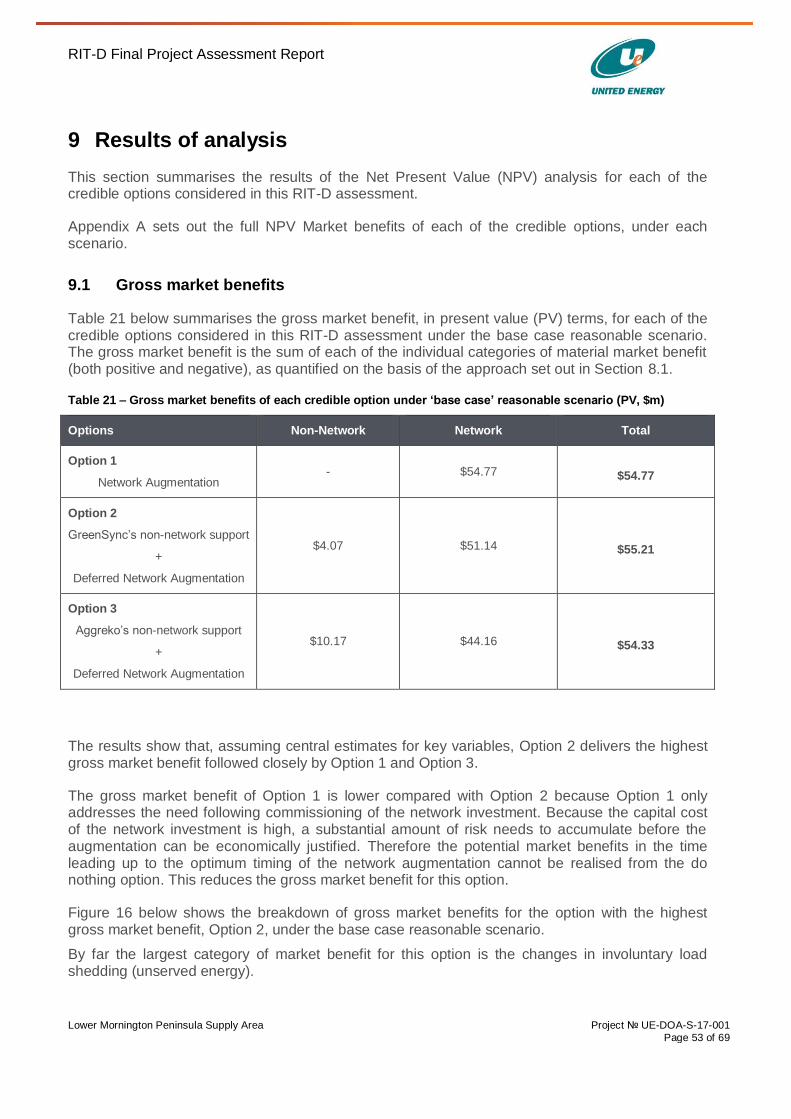
RIT-D Final Project Assessment Report
Lower Mornington Peninsula Supply Area Project № UE-DOA-S-17-001
Page 53 of 69
9 Results of analysis
This section summarises the results of the Net Present Value (NPV) analysis for each of the credible options considered in this RIT-D assessment.
Appendix A sets out the full NPV Market benefits of each of the credible options, under each scenario.
9.1 Gross market benefits
Table 21 below summarises the gross market benefit, in present value (PV) terms, for each of the credible options considered in this RIT-D assessment under the base case reasonable scenario. The gross market benefit is the sum of each of the individual categories of material market benefit (both positive and negative), as quantified on the basis of the approach set out in Section 8.1.
Table 21 – Gross market benefits of each credible option under ‘base case’ reasonable scenario (PV, $m)
Options Non-Network Network Total
Option 1
Network Augmentation - $54.77 $54.77
Option 2
GreenSync’s non-network support
+
Deferred Network Augmentation
$4.07 $51.14 $55.21
Option 3
Aggreko’s non-network support
+
Deferred Network Augmentation
$10.17 $44.16 $54.33
The results show that, assuming central estimates for key variables, Option 2 delivers the highest gross market benefit followed closely by Option 1 and Option 3.
The gross market benefit of Option 1 is lower compared with Option 2 because Option 1 only addresses the need following commissioning of the network investment. Because the capital cost of the network investment is high, a substantial amount of risk needs to accumulate before the augmentation can be economically justified. Therefore the potential market benefits in the time leading up to the optimum timing of the network augmentation cannot be realised from the do nothing option. This reduces the gross market benefit for this option.
Figure 16 below shows the breakdown of gross market benefits for the option with the highest gross market benefit, Option 2, under the base case reasonable scenario.
By far the largest category of market benefit for this option is the changes in involuntary load shedding (unserved energy).
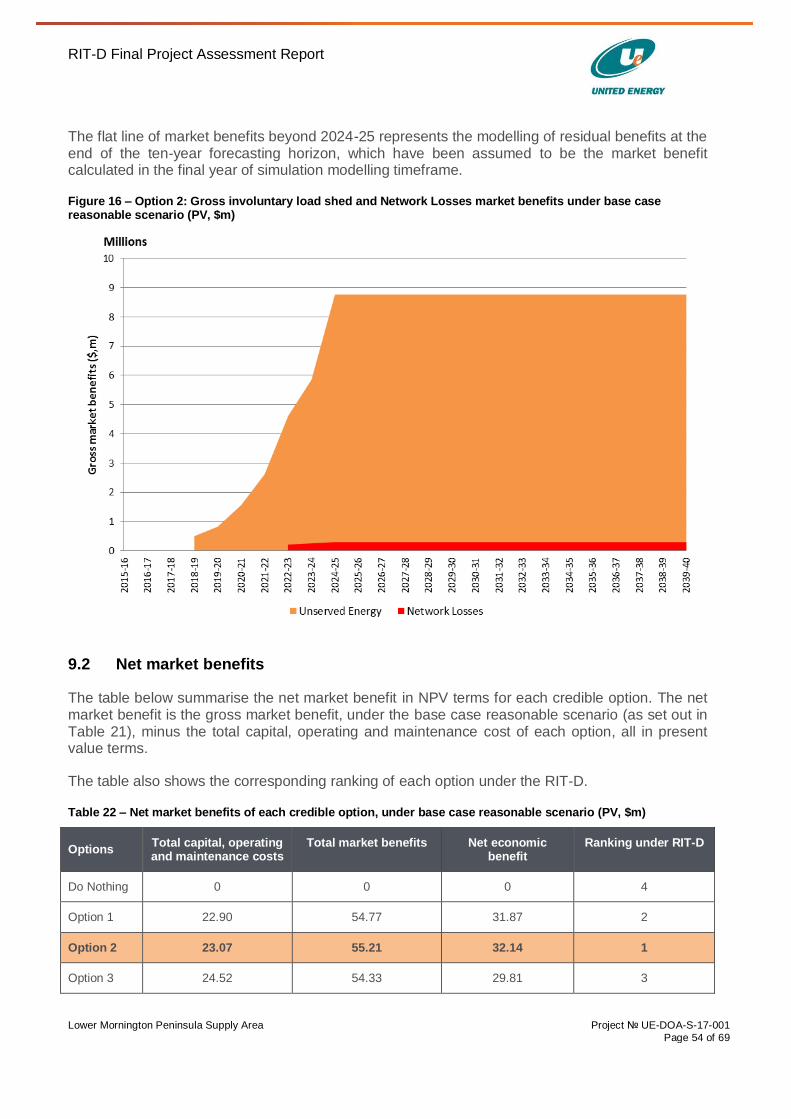
RIT-D Final Project Assessment Report
Lower Mornington Peninsula Supply Area Project № UE-DOA-S-17-001
Page 54 of 69
The flat line of market benefits beyond 2024-25 represents the modelling of residual benefits at the end of the ten-year forecasting horizon, which have been assumed to be the market benefit calculated in the final year of simulation modelling timeframe.
Figure 16 – Option 2: Gross involuntary load shed and Network Losses market benefits under base case reasonable scenario (PV, $m)
9.2 Net market benefits
The table below summarise the net market benefit in NPV terms for each credible option. The net market benefit is the gross market benefit, under the base case reasonable scenario (as set out in Table 21), minus the total capital, operating and maintenance cost of each option, all in present value terms.
The table also shows the corresponding ranking of each option under the RIT-D.
Table 22 – Net market benefits of each credible option, under base case reasonable scenario (PV, $m)
Options Total capital, operating and maintenance costs
Total market benefits Net economic benefit
Ranking under RIT-D
Do Nothing 0 0 0 4
Option 1 22.90 54.77 31.87 2
Option 2 23.07 55.21 32.14 1
Option 3 24.52 54.33 29.81 3
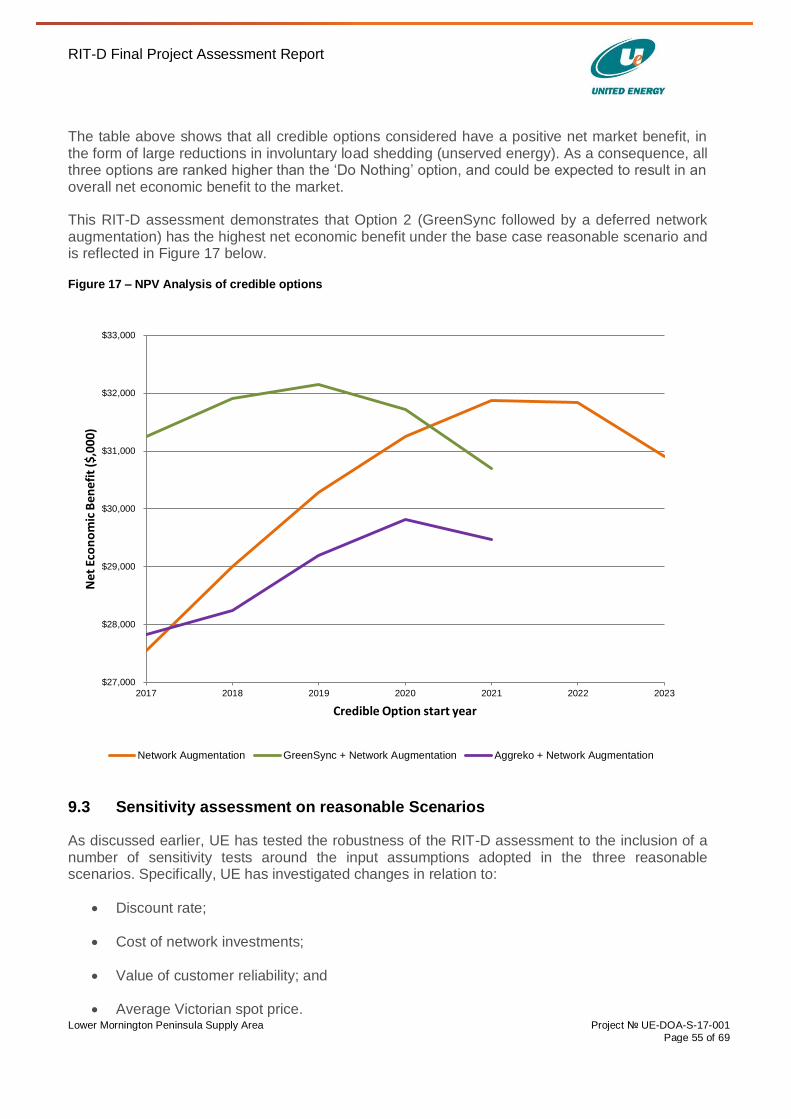
RIT-D Final Project Assessment Report
Lower Mornington Peninsula Supply Area Project № UE-DOA-S-17-001
Page 55 of 69
The table above shows that all credible options considered have a positive net market benefit, in the form of large reductions in involuntary load shedding (unserved energy). As a consequence, all three options are ranked higher than the ‘Do Nothing’ option, and could be expected to result in an overall net economic benefit to the market.
This RIT-D assessment demonstrates that Option 2 (GreenSync followed by a deferred network augmentation) has the highest net economic benefit under the base case reasonable scenario and is reflected in Figure 17 below.
Figure 17 – NPV Analysis of credible options
9.3 Sensitivity assessment on reasonable Scenarios
As discussed earlier, UE has tested the robustness of the RIT-D assessment to the inclusion of a number of sensitivity tests around the input assumptions adopted in the three reasonable scenarios. Specifically, UE has investigated changes in relation to:
Discount rate;
Cost of network investments;
Value of customer reliability; and
Average Victorian spot price.
$27,000
$28,000
$29,000
$30,000
$31,000
$32,000
$33,000
2017 2018 2019 2020 2021 2022 2023
Net
Eco
no
mic
Ben
efit
($,
000)
Credible Option start year
Network Augmentation GreenSync + Network Augmentation Aggreko + Network Augmentation
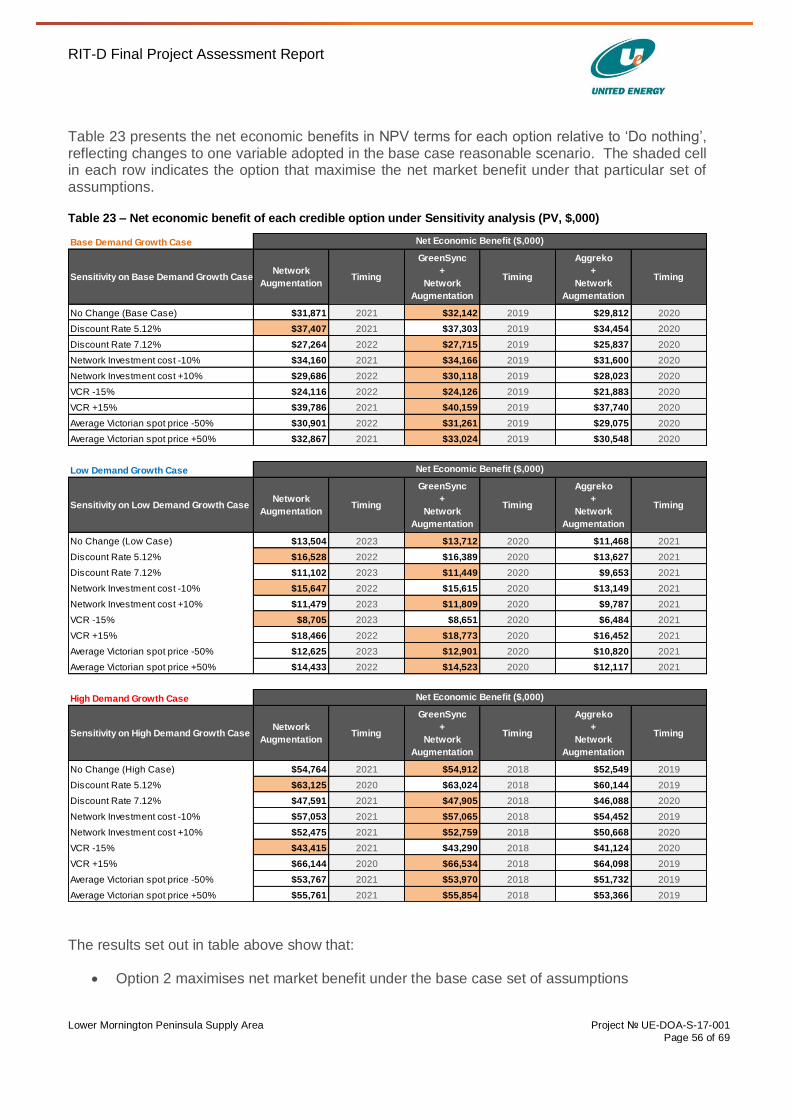
RIT-D Final Project Assessment Report
Lower Mornington Peninsula Supply Area Project № UE-DOA-S-17-001
Page 56 of 69
Table 23 presents the net economic benefits in NPV terms for each option relative to ‘Do nothing’, reflecting changes to one variable adopted in the base case reasonable scenario. The shaded cell in each row indicates the option that maximise the net market benefit under that particular set of assumptions.
Table 23 – Net economic benefit of each credible option under Sensitivity analysis (PV, $,000)
The results set out in table above show that:
Option 2 maximises net market benefit under the base case set of assumptions
Base Demand Growth Case
Sensitivity on Base Demand Growth CaseNetwork
AugmentationTiming
GreenSync
+
Network
Augmentation
Timing
Aggreko
+
Network
Augmentation
Timing
No Change (Base Case) $31,871 2021 $32,142 2019 $29,812 2020
Discount Rate 5.12% $37,407 2021 $37,303 2019 $34,454 2020
Discount Rate 7.12% $27,264 2022 $27,715 2019 $25,837 2020
Network Investment cost -10% $34,160 2021 $34,166 2019 $31,600 2020
Network Investment cost +10% $29,686 2022 $30,118 2019 $28,023 2020
VCR -15% $24,116 2022 $24,126 2019 $21,883 2020
VCR +15% $39,786 2021 $40,159 2019 $37,740 2020
Average Victorian spot price -50% $30,901 2022 $31,261 2019 $29,075 2020
Average Victorian spot price +50% $32,867 2021 $33,024 2019 $30,548 2020
Low Demand Growth Case
Sensitivity on Low Demand Growth CaseNetwork
AugmentationTiming
GreenSync
+
Network
Augmentation
Timing
Aggreko
+
Network
Augmentation
Timing
No Change (Low Case) $13,504 2023 $13,712 2020 $11,468 2021
Discount Rate 5.12% $16,528 2022 $16,389 2020 $13,627 2021
Discount Rate 7.12% $11,102 2023 $11,449 2020 $9,653 2021
Network Investment cost -10% $15,647 2022 $15,615 2020 $13,149 2021
Network Investment cost +10% $11,479 2023 $11,809 2020 $9,787 2021
VCR -15% $8,705 2023 $8,651 2020 $6,484 2021
VCR +15% $18,466 2022 $18,773 2020 $16,452 2021
Average Victorian spot price -50% $12,625 2023 $12,901 2020 $10,820 2021
Average Victorian spot price +50% $14,433 2022 $14,523 2020 $12,117 2021
High Demand Growth Case
Sensitivity on High Demand Growth CaseNetwork
AugmentationTiming
GreenSync
+
Network
Augmentation
Timing
Aggreko
+
Network
Augmentation
Timing
No Change (High Case) $54,764 2021 $54,912 2018 $52,549 2019
Discount Rate 5.12% $63,125 2020 $63,024 2018 $60,144 2019
Discount Rate 7.12% $47,591 2021 $47,905 2018 $46,088 2020
Network Investment cost -10% $57,053 2021 $57,065 2018 $54,452 2019
Network Investment cost +10% $52,475 2021 $52,759 2018 $50,668 2020
VCR -15% $43,415 2021 $43,290 2018 $41,124 2020
VCR +15% $66,144 2020 $66,534 2018 $64,098 2019
Average Victorian spot price -50% $53,767 2021 $53,970 2018 $51,732 2019
Average Victorian spot price +50% $55,761 2021 $55,854 2018 $53,366 2019
Net Economic Benefit ($,000)
Net Economic Benefit ($,000)
Net Economic Benefit ($,000)
RIT-D Final Project Assessment Report
Lower Mornington Peninsula Supply Area Project № UE-DOA-S-17-001
Page 57 of 69
Option 2 maximises net market benefit under majority of scenarios involving the variation of assumptions within plausible limits
Option 1 is found to have higher market benefit in 1 out of the 9 study cases under base scenario, when the discount rate is low
Option 1 is also found to have higher market benefit in 3 out of 9 study cases under low demand growth scenario and 2 out of 9 study cases under high demand growth scenarios, especially when the discount rate and VCR is lower than the base case assumption
Option 3 has a lower market benefit under all studied cases by a material margin
Under the RIT-D, the preferred option should maximise the present value of the net economic benefit to all those who produce, consume and transport electricity in the National Electricity Market (NEM).37 This RIT-D assessment clearly demonstrates that Option 2 maximises net economic benefit under majority of the reasonable scenarios considered. Therefore Option 2 is considered the proposed preferred option to address the ‘identified need’.
The results above also demonstrate that applying weightings for each reasonable scenario (and undertaking sensitivity assessment on the weightings adopted) would not alter the outcome of this RIT-D. Although applying different weightings may result in a change in the overall magnitude of net market benefit of each option, Option 2 is still expected to be ranked first.
As a result, UE does not consider any detailed assessment required to identify probability to each reasonable scenario is warranted in this instance.
9.4 Economic timing
Table 23 above shows the expected timing of the proposed preferred option under each reasonable scenario. The table above show that:
The timing of the proposed preferred option (Option 2) is 2018-19 under the ‘base case’ reasonable scenario (i.e. under the most likely scenario).
There may be scope for deferring the proposed preferred option by one year if:
o the maximum demand growth at DMA, RBD and STO is 3% per annum lower than base estimates – that is, the maximum demand at lower Mornington Peninsula is approximately 2-3 MW per annum lower than the base case forecast.
The proposed preferred option may be implemented a year earlier if:
o The maximum demand growth at DMA, RBD and STO is 3% per annum higher than base estimates.
The expected implementation timing of the preferred option is no later than December 2018.
37 AER: “AER – Final RIT-D Application Guidelines – August 2013”, Section 1.1. Available http://www.aer.gov.au/node/19146
RIT-D Final Project Assessment Report
Lower Mornington Peninsula Supply Area Project № UE-DOA-S-17-001
Page 58 of 69
10 Proposed preferred option
The previous section has presented the results of the NPV analysis conducted for this RIT-D assessment. The NER requires the FPAR to include the identification of the preferred option under the RIT-D. This should be the option with the greatest net economic benefit and which is therefore expected to maximise the present value of the net market benefits to all those who produce, consume and transport electricity in the market.
This RIT-D assessment clearly demonstrates that Option 2 maximise the present value of net market benefits under the majority of reasonable scenarios considered. The preferred option for investment is therefore Option 2: Implementation of GreenSync’s demand reduction solution, followed by a deferred network investment. This recommended option has two stages of implementation:
Stage 1 - GreenSync demand reduction solution
First stage is to implement GreenSync four year demand reduction proposal in 2018-19 to defer network investment by two years. It includes:
Contracting GreenSync to provide demand reduction at DMA, RBD and STO supply area until the commissioning of new Hastings to Rosebud 66kV line project;
Enrolling C&I, Small Businesses, Utility and Residential DSM portfolios into GreenSync advanced analytics PortfolioCMTM platform which, when integrated with UE SCADA system, will have the capability to monitor constrained network elements to accurately predict when and where constraint exist, and dispatch DSM assets at minimum cost to maintain network security;
Establishment cost;
Customer payments for voluntary load shedding.
The estimated capital cost of Stage 1 is $3.67 million in 2015-16 AUD.
Stage 2 - Install a new 66 kV line from Hastings to Rosebud
Implement second stage of the preferred option before summer 2022-23, which includes:
Installing approximately 53 km of new 66 kV line from Hastings (HGS) zone substation to Rosebud (RBD) zone substation. The new line would be constructed along the south-eastern coast (along the road reserve) of the Mornington Peninsula. Most of the route would involve the reconstruction of existing overhead pole lines.
Installing three 66 kV circuit breakers, one at RBD and two at HGS zone substations.
Upgrade the TBTS-HGS No.1 and No.2 feeder exits at Tyabb Terminal Station (TBTS).
The estimated capital cost of Stage 2 is 29.5 million (± 10%) in 2015-16 AUD. Annual operating and maintenance costs are anticipated to be around 0.5% of the capital cost. The expected commissioning date of network augmentation is no later than December 2022 which is consistent with the base case scenarios identified above.
Total Cost
The estimated total capital and operational cost (Stage 1 + Stage 2) of this recommended option is 35.0 million, in 2015-16 AUD.
RIT-D Final Project Assessment Report
Lower Mornington Peninsula Supply Area Project № UE-DOA-S-17-001
Page 59 of 69
11 Submission
11.1 Next steps
This FPAR represents the final stage of the RIT-D process.
In accordance with the provisions set out in clause 5.17.5(c) of the NER, Registered Participants or interested parties may, within 30 days after the publication of this report, dispute the conclusions made by UE in this report with the Australian Energy Regulatory (AER). Accordingly, Registered Participants and interested parties who wish to dispute the recommendation outlined in this report must do so by 1st August 2016.
Any parties raising such a dispute are also required to notify the United Energy Manager Network Planning at [email protected].
All submissions will be published on UE’s website.38
If no formal dispute is raised, UE will commence with the investment activities necessary to proceed with the implementation of the preferred option.
38 If you do not want your submission to be publically available, please clearly stipulate this at the time of lodgment.
RIT-D Final Project Assessment Report
Lower Mornington Peninsula Supply Area Project № UE-DOA-S-17-001
Page 60 of 69
12 Checklist of compliance with NER clauses
This section sets out a compliance checklist which demonstrates the compliance of this FPAR with the requirements of clause 5.17.4(r) of the NER.
NER Clause Summary of requirements Relevant section in
FPAR
5.17.4(j)(1) A description of the identified need for investment Section 4
5.17.4(j)(2) The assumptions used in identifying the need (including, in the case of proposed reliability corrective action, why the RIT-D proponent considers reliability corrective action is necessary).
Section 5
5.17.4(j)(3) Summary of, and commentary on, the submissions on the non-network options report
Section 6
5.17.4(j)(4) A description of each credible option Section 7
5.17.4(j)(5) A quantification of each applicable market benefit for each credible option Section 9.1
5.17.4(j)(6) A quantification of each applicable cost for each credible option, including breakdown of operating and capital expenditure
Section 8.3
5.17.4(j)(7) A detailed description of methodologies used in quantifying each class of market benefit
Section 8.1
5.17.4(j)(8) Where relevant, the reasons why UE has determined that a class or classes of market benefits do not apply to a credible option
Section 8.2
5.17.4(j)(9) The results of a net present value analysis for each option and accompanying explanatory statements regarding the results
Section 9
5.17.4(j)(10) The identification of the proposed preferred option Section 10
5.17.4(j)(11) Details of the proposed preferred option Section 10
5.17.4(j)(12) Contact details of suitable staff at UE Section 11
5.17.4(r)(1)(ii) Summary of, and commentary on, the submissions on the Draft Project Assessment Report
Section 6

RIT-D Final Project Assessment Report
Lower Mornington Peninsula Supply Area Project № UE-DOA-S-17-001
Page 61 of 69
13 Abbreviations and Glossary
Abbreviations
AEMO Australian Energy Market Operator
AER Australian Energy Regulator
DAPR Distribution Annual Planning Report
DMA Dromana zone substation
DPAR Draft Project Assessment Report
DSED Demand Side Engagement Document
FPAR Final Project Assessment Report
HGS Hastings zone substation
LMP Lower Mornington Peninsula
MTN Mornington zone substation
NEM National Electricity Market
NER National Electricity Rules
NNOR Non Network Options Report
PoE Probability of Exceedance
PSSE Power System Simulator for Engineers
RBD Rosebud zone substation
RIT-D Regulatory Investment Test for Distribution
STO Sorrento zone substation
TBTS Tyabb Terminal Station
UE United Energy Distribution Pty Ltd
VCR Value of Customer Reliability
RIT-D Final Project Assessment Report
Lower Mornington Peninsula Supply Area Project № UE-DOA-S-17-001
Page 62 of 69
Glossary
Term Definition
1-in-2 peak day The 1-in-2 peak day demand projection has a 50%
probability of exceedance (PoE). This projected level
of demand is expected, on average, to be exceeded
once in two years.
1-in-10 peak day The 1-in-10 peak day demand projection has a 10%
probability of exceedance (PoE). This projected level
of demand is expected, on average, to be exceeded
once in ten years.
Credible option An option that:
Addresses the identified ‘need’;
Is commercially and technically feasible; and
Can be implemented in sufficient time to meet
the identified ‘need’.
Expected Energy at Risk The expected amount of energy that cannot be
supplied each year because there is insufficient
capacity to meet demand, taking into account
equipment unavailability and load-at-risk.
Identified ‘need’ Any capacity or voltage limitation on the distribution
system that will give rise to Expected Energy at Risk.
Limitation Any limitations on the operation of the distribution
system that will give rise to expected energy at risk.
Network option A means by which an identified ‘need’ can be fully or
partly addressed by expenditure on the distribution
asset.
Non-network option A means by which an identified ‘need’ can be fully or
partially addressed other than by a network option.
Non-network service provider A party who provides a non-network option
Potential credible option An option has the potential to be a credible option
based on an initial assessment of the identified ‘need’.
Preferred option A credible option that maximise the present value of net
economic benefit to all those who produce, consume
and transport electricity in the market. The preferred
option can be a network option, non-network option, or
do nothing (i.e. status quo).
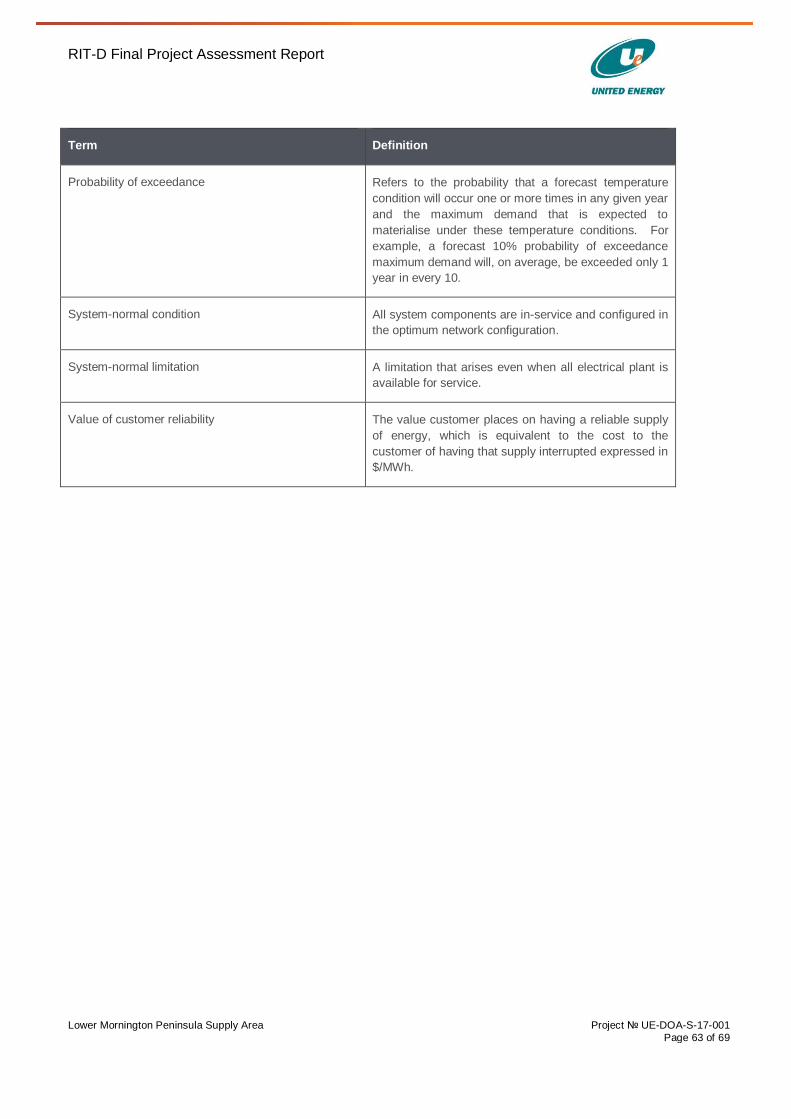
RIT-D Final Project Assessment Report
Lower Mornington Peninsula Supply Area Project № UE-DOA-S-17-001
Page 63 of 69
Term Definition
Probability of exceedance Refers to the probability that a forecast temperature
condition will occur one or more times in any given year
and the maximum demand that is expected to
materialise under these temperature conditions. For
example, a forecast 10% probability of exceedance
maximum demand will, on average, be exceeded only 1
year in every 10.
System-normal condition All system components are in-service and configured in
the optimum network configuration.
System-normal limitation A limitation that arises even when all electrical plant is
available for service.
Value of customer reliability The value customer places on having a reliable supply
of energy, which is equivalent to the cost to the
customer of having that supply interrupted expressed in
$/MWh.
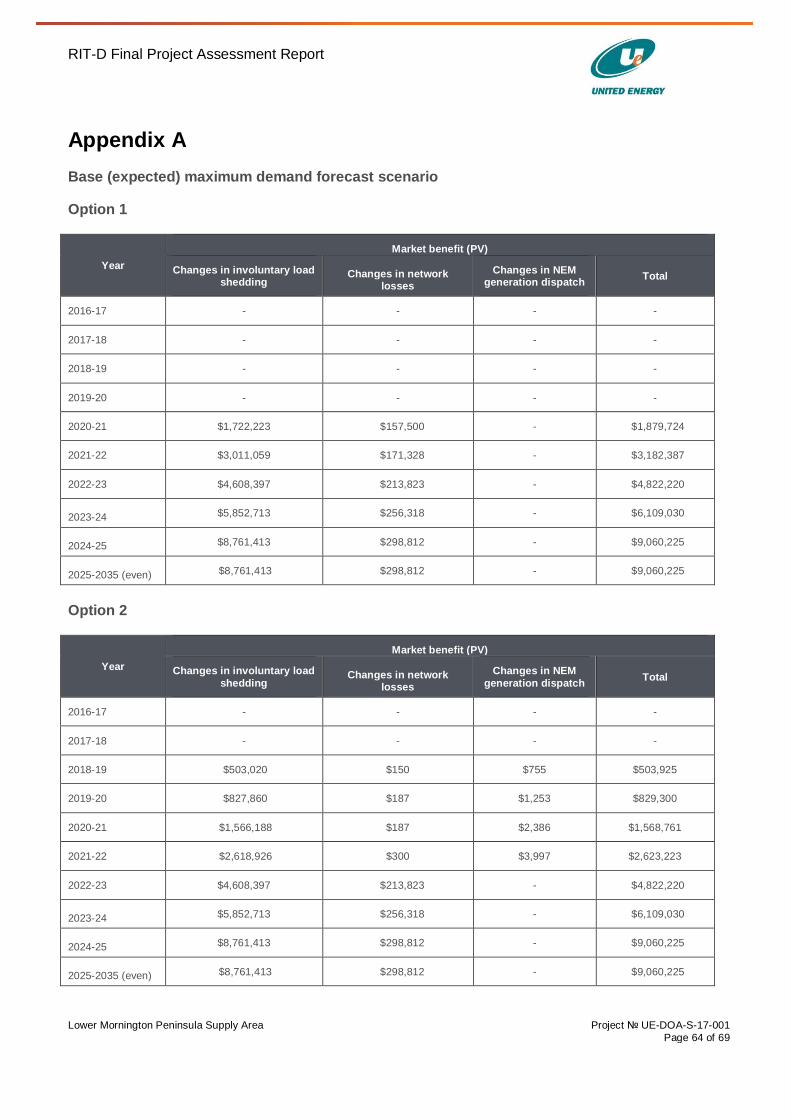
RIT-D Final Project Assessment Report
Lower Mornington Peninsula Supply Area Project № UE-DOA-S-17-001
Page 64 of 69
Appendix A
Base (expected) maximum demand forecast scenario
Option 1
Year
Market benefit (PV)
Changes in involuntary load shedding
Changes in network losses
Changes in NEM generation dispatch
Total
2016-17 - - - -
2017-18 - - - -
2018-19 - - - -
2019-20 - - - -
2020-21 $1,722,223 $157,500 - $1,879,724
2021-22 $3,011,059 $171,328 - $3,182,387
2022-23 $4,608,397 $213,823 - $4,822,220
2023-24 $5,852,713 $256,318 - $6,109,030
2024-25 $8,761,413 $298,812 - $9,060,225
2025-2035 (even) $8,761,413 $298,812 - $9,060,225
Option 2
Year
Market benefit (PV)
Changes in involuntary load
shedding Changes in network
losses
Changes in NEM
generation dispatch Total
2016-17 - - - -
2017-18 - - - -
2018-19 $503,020 $150 $755 $503,925
2019-20 $827,860 $187 $1,253 $829,300
2020-21 $1,566,188 $187 $2,386 $1,568,761
2021-22 $2,618,926 $300 $3,997 $2,623,223
2022-23 $4,608,397 $213,823 - $4,822,220
2023-24 $5,852,713 $256,318 - $6,109,030
2024-25 $8,761,413 $298,812 - $9,060,225
2025-2035 (even) $8,761,413 $298,812 - $9,060,225

RIT-D Final Project Assessment Report
Lower Mornington Peninsula Supply Area Project № UE-DOA-S-17-001
Page 65 of 69
Option 3
Year
Market benefit (PV)
Changes in involuntary load
shedding Changes in network
losses
Changes in NEM
generation dispatch Total
2016-17 - - - -
2017-18 - - - -
2018-19 - - - -
2019-20 $744,255 $187 $1,128 $745,570
2020-21 $1,520,775 $187 $2,320 $1,523,282
2021-22 $2,814,874 $300 $4,303 $2,819,477
2022-23 $4,455,044 $487 $6,824 $4,462,355
2023-24 $5,674,037 $712 $8,700 $5,683,449
2024-25 $8,761,413 $298,812 - $9,060,225
2025-2035 (even) $8,761,413 $298,812 - $9,060,225
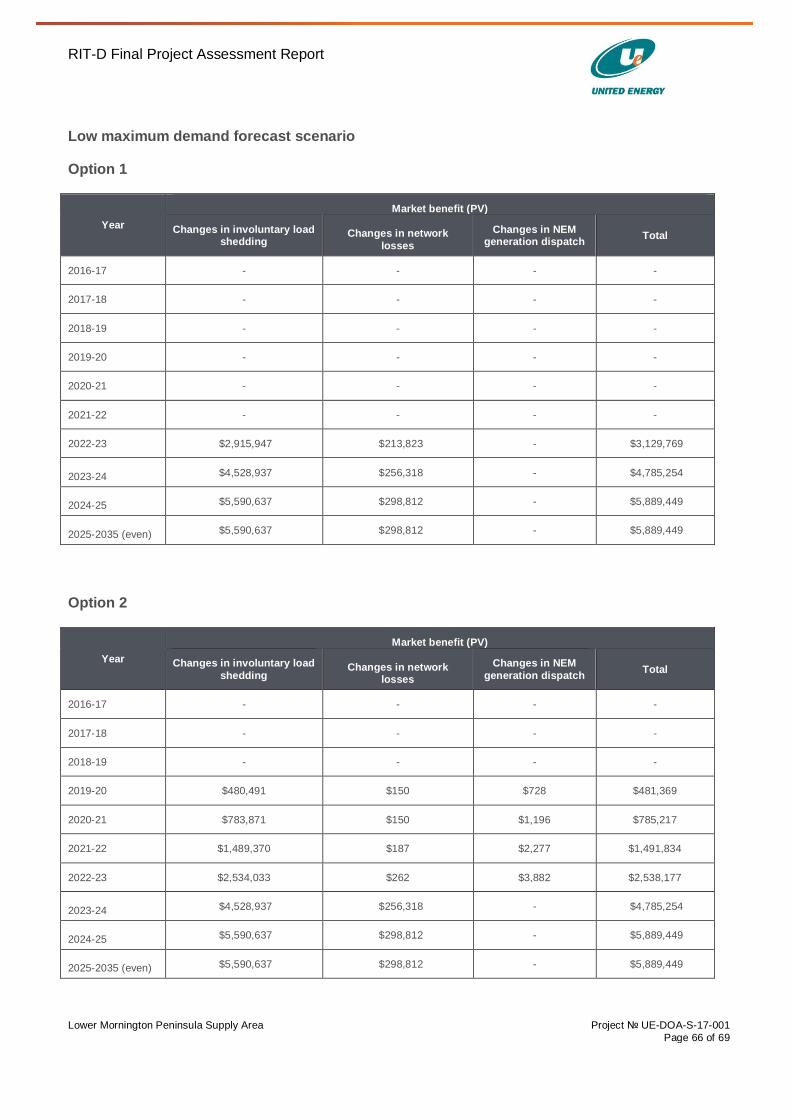
RIT-D Final Project Assessment Report
Lower Mornington Peninsula Supply Area Project № UE-DOA-S-17-001
Page 66 of 69
Low maximum demand forecast scenario
Option 1
Year
Market benefit (PV)
Changes in involuntary load shedding
Changes in network
losses
Changes in NEM generation dispatch
Total
2016-17 - - - -
2017-18 - - - -
2018-19 - - - -
2019-20 - - - -
2020-21 - - - -
2021-22 - - - -
2022-23 $2,915,947 $213,823 - $3,129,769
2023-24 $4,528,937 $256,318 - $4,785,254
2024-25 $5,590,637 $298,812 - $5,889,449
2025-2035 (even) $5,590,637 $298,812 - $5,889,449
Option 2
Year
Market benefit (PV)
Changes in involuntary load
shedding Changes in network
losses
Changes in NEM
generation dispatch Total
2016-17 - - - -
2017-18 - - - -
2018-19 - - - -
2019-20 $480,491 $150 $728 $481,369
2020-21 $783,871 $150 $1,196 $785,217
2021-22 $1,489,370 $187 $2,277 $1,491,834
2022-23 $2,534,033 $262 $3,882 $2,538,177
2023-24 $4,528,937 $256,318 - $4,785,254
2024-25 $5,590,637 $298,812 - $5,889,449
2025-2035 (even) $5,590,637 $298,812 - $5,889,449
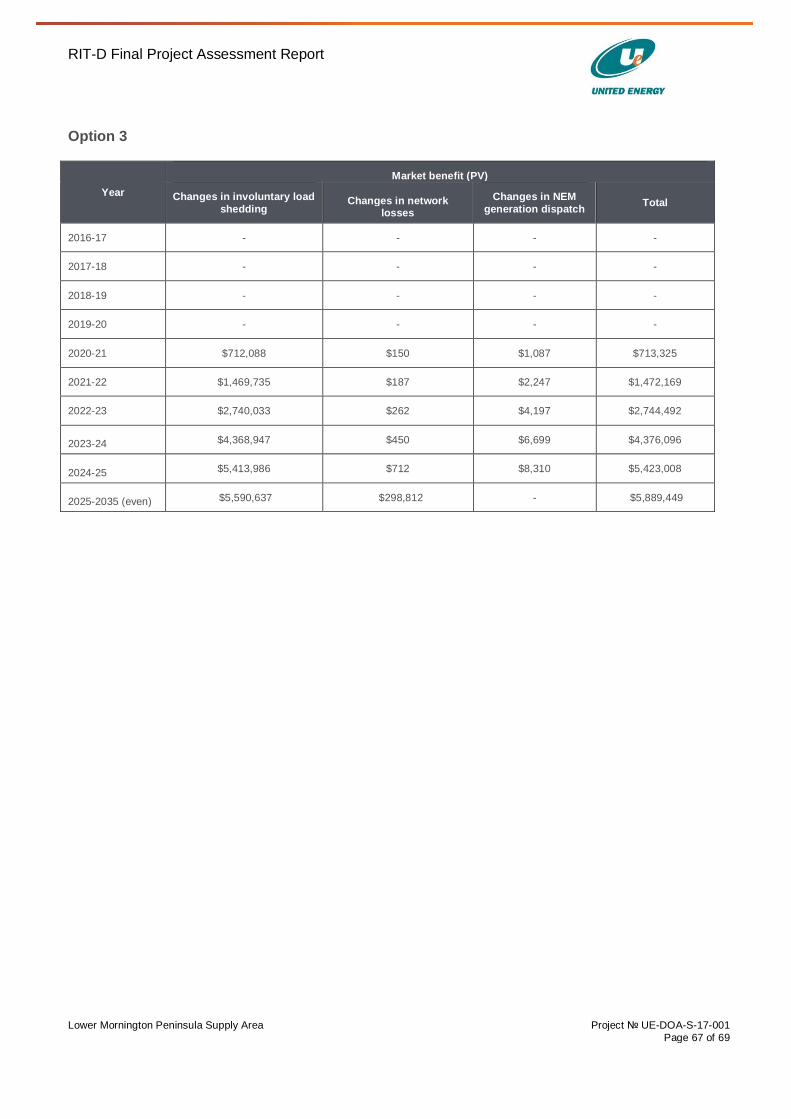
RIT-D Final Project Assessment Report
Lower Mornington Peninsula Supply Area Project № UE-DOA-S-17-001
Page 67 of 69
Option 3
Year
Market benefit (PV)
Changes in involuntary load
shedding Changes in network
losses
Changes in NEM
generation dispatch Total
2016-17 - - - -
2017-18 - - - -
2018-19 - - - -
2019-20 - - - -
2020-21 $712,088 $150 $1,087 $713,325
2021-22 $1,469,735 $187 $2,247 $1,472,169
2022-23 $2,740,033 $262 $4,197 $2,744,492
2023-24 $4,368,947 $450 $6,699 $4,376,096
2024-25 $5,413,986 $712 $8,310 $5,423,008
2025-2035 (even) $5,590,637 $298,812 - $5,889,449
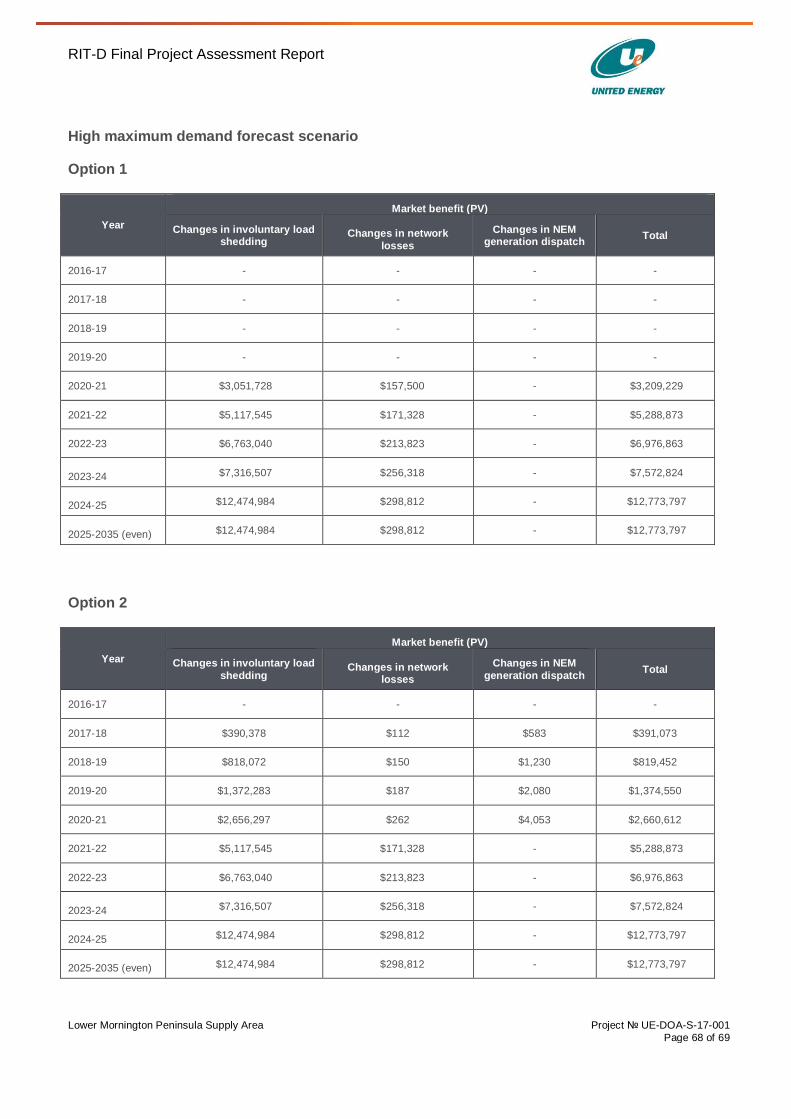
RIT-D Final Project Assessment Report
Lower Mornington Peninsula Supply Area Project № UE-DOA-S-17-001
Page 68 of 69
High maximum demand forecast scenario
Option 1
Year
Market benefit (PV)
Changes in involuntary load shedding
Changes in network
losses
Changes in NEM generation dispatch
Total
2016-17 - - - -
2017-18 - - - -
2018-19 - - - -
2019-20 - - - -
2020-21 $3,051,728 $157,500 - $3,209,229
2021-22 $5,117,545 $171,328 - $5,288,873
2022-23 $6,763,040 $213,823 - $6,976,863
2023-24 $7,316,507 $256,318 - $7,572,824
2024-25 $12,474,984 $298,812 - $12,773,797
2025-2035 (even) $12,474,984 $298,812 - $12,773,797
Option 2
Year
Market benefit (PV)
Changes in involuntary load
shedding Changes in network
losses
Changes in NEM
generation dispatch Total
2016-17 - - - -
2017-18 $390,378 $112 $583 $391,073
2018-19 $818,072 $150 $1,230 $819,452
2019-20 $1,372,283 $187 $2,080 $1,374,550
2020-21 $2,656,297 $262 $4,053 $2,660,612
2021-22 $5,117,545 $171,328 - $5,288,873
2022-23 $6,763,040 $213,823 - $6,976,863
2023-24 $7,316,507 $256,318 - $7,572,824
2024-25 $12,474,984 $298,812 - $12,773,797
2025-2035 (even) $12,474,984 $298,812 - $12,773,797
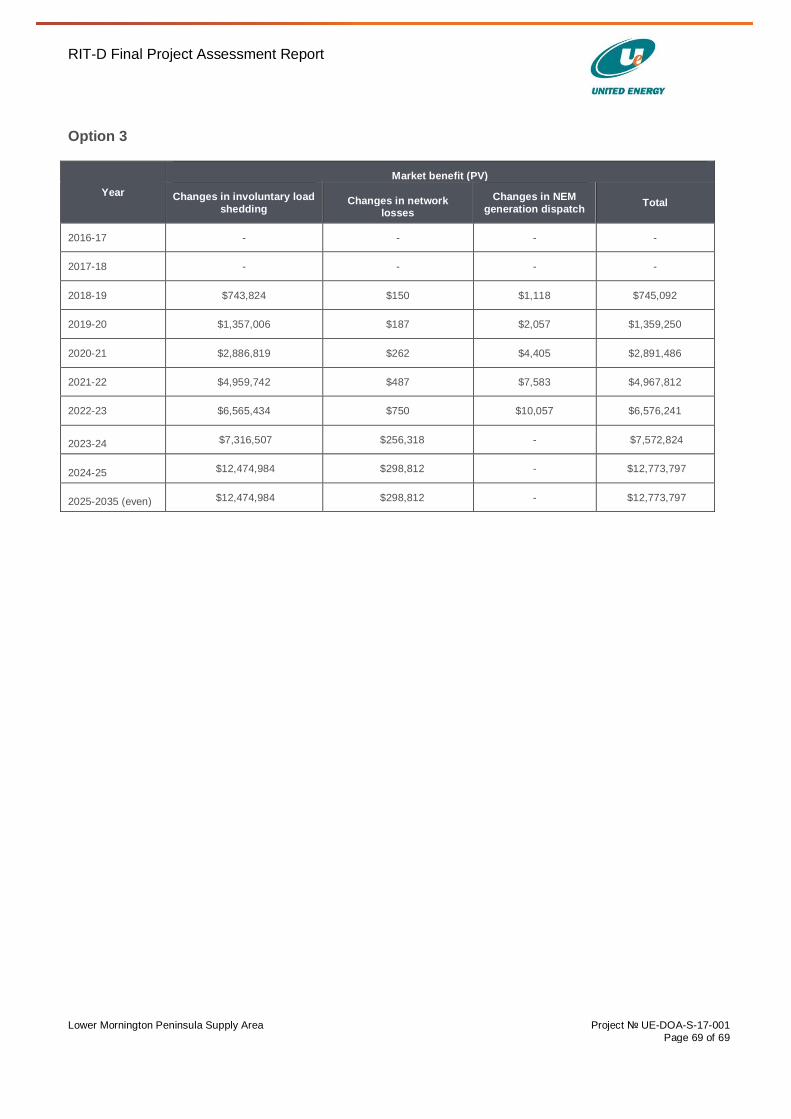
RIT-D Final Project Assessment Report
Lower Mornington Peninsula Supply Area Project № UE-DOA-S-17-001
Page 69 of 69
Option 3
Year
Market benefit (PV)
Changes in involuntary load
shedding Changes in network
losses
Changes in NEM
generation dispatch Total
2016-17 - - - -
2017-18 - - - -
2018-19 $743,824 $150 $1,118 $745,092
2019-20 $1,357,006 $187 $2,057 $1,359,250
2020-21 $2,886,819 $262 $4,405 $2,891,486
2021-22 $4,959,742 $487 $7,583 $4,967,812
2022-23 $6,565,434 $750 $10,057 $6,576,241
2023-24 $7,316,507 $256,318 - $7,572,824
2024-25 $12,474,984 $298,812 - $12,773,797
2025-2035 (even) $12,474,984 $298,812 - $12,773,797