Embed Size (px)
Citation preview

Palm Beach Harbor®
FINAL INTEGRATED GENERAL REEVALUATION REPORT AND ENVIRONMENTAL IMPACT STATEMENT
SAN FRANCISCO BAY TO STOCKTON, CALIFORNIA NAVIGATION STUDY
APPENDIX D: Economic Analysis
JANUARY 2020

This page is intentionally left blank.

APPENDIX D: ECONOMIC ANALYSIS
Table of Contents Introduction ............................................................................................................................................... 5
Purpose ................................................................................................................................................... 5
Existing Conditions ................................................................................................................................... 5
Economic Study Area......................................................................................................................... 8
Cargo and Vessel Profile ............................................................................................................... 8
Facilities and Infrastructure ........................................................................................................... 8
Carriers and Route Groups ............................................................................................................. 12
Existing Fleet ........................................................................................................................................ 12
Shipping Operations ......................................................................................................................... 13
Underkeel Clearance ................................................................................................................... 14
Tide Use............................................................................................................................................. 14
Future Condition .................................................................................................................................... 14
Commodity Forecast ........................................................................................................................ 14
Baseline............................................................................................................................................. 14
Trade Forecast ................................................................................................................................ 15
Vessel Fleet .......................................................................................................................................... 16
Forecasted Vessel Fleet ............................................................................................................... 16
Transportation Cost Savings Benefit Analysis ................................................................................. 17
Alternatives .......................................................................................................................................... 17
Methodology ...................................................................................................................................... 18
HarborSym Model ............................................................................................................................ 2
Vessel Call List ................................................................................................................................... 3
Origin-Destination Transportation Cost Savings Benefits by Project Depth......................... 6
Initial Project Costs of Deepening....................................................................................................... 6
NED Cost – Financial ........................................................................................................................... 6
NED Cost – Economic ......................................................................................................................... 7
NED Channel Deepening Cost ........................................................................................................ 7
Preliminary Results – Net Benefits and Benefit-Cost Ratio ............................................................ 7
San Francisco Bay to Stockton Navigation Improvement
D-2

APPENDIX D: ECONOMIC ANALYSIS
Recommended Plan Benefit and Cost Update ............................................................................. 8
Sediment Trap Cost Savings Analysis ................................................................................................. 9
Sensitivity Analysis .................................................................................................................................. 10
Scenario 1 ............................................................................................................................................ 11
Scenario 2 ............................................................................................................................................ 11
Scenario 3 ............................................................................................................................................ 11
Summary of Sensitivity Analysis ...................................................................................................... 11
Multiport Analysis ................................................................................................................................... 12
Sea Level Rise.......................................................................................................................................... 13
Socioeconomic and Regional Analysis........................................................................................... 13
Population............................................................................................................................................ 13
Employment ........................................................................................................................................ 14
Wage Earnings by Sector ................................................................................................................ 17
Median Household Income for Selected Counties ................................................................. 17
Social Characteristics ....................................................................................................................... 18
Regional Economic Development Analysis ............................................................................... 22
Figure 1: Project Area Map and Existing Channel Features ........................................................ 6 Figure 2: Major Ports in the Area.......................................................................................................... 7 Figure 3: Facility Users.............................................................................................................................. 9 Figure 4: Without-Project Forecasted Vessels ................................................................................ 17
: AEO 2019 Forecast ............................................................................................................... 12Figure 5Figure 6: Study Area .............................................................................................................................. 18
Table 1: Route Group Information .................................................................................................... 12 Table 2: Tankers by Class - Year 2000 ............................................................................................... 13 Table 3: Tankers by Class - Year 2015 ............................................................................................... 13 Table 4: Vessel Types and Attributes ................................................................................................ 13 Table 5: Historical Imports and Exports............................................................................................. 15 Table 6: Channel Commodity Forecast 2020-2040 (metric tons)............................................. 16 Table 7: Vessel Class Inputs ................................................................................................................... 4 Table 8: Bulk Vessel Fleet Forecast ...................................................................................................... 5 Table 9: With-Project Forecasted Panamax Vessels ...................................................................... 5
San Francisco Bay to Stockton Navigation Improvement
D-3

APPENDIX D: ECONOMIC ANALYSIS
Table 10: AAEQ Transportation Costs................................................................................................. 6 Table 11: Project Cost ............................................................................................................................. 7 Table 12: Project Results ......................................................................................................................... 8 Table 13: Updated Project Cost .......................................................................................................... 9 Table 14: Benefits, Costs, Net Benefits, and BCR (excludes Sediment Trap benefits) .......... 9 Table 15: Sediment Trap Cost Savings Analysis ............................................................................. 10 Table 16: Summary of Recommended Plan, Net Benefits, and BCR (with Sediment Trap benefits).................................................................................................................................................... 10 Table 17: Sensitivity Analysis Summary ............................................................................................. 12 Table 18: Population ............................................................................................................................. 14 Table 19: Population Projections ....................................................................................................... 14 Table 20: California Private Sector Annual Employment, 2014................................................. 15 Table 21: California Average Annual Wage Earnings per Employee, 2014.......................... 16 Table 22: California Median Household Income for Selected Counties ............................... 17 Table 23: California State Unemployment Rates for Selected Counties ............................... 18 Table 24: Bay Area Population Growth, 1980-2010 ...................................................................... 19 Table 25: Racial Composition............................................................................................................. 20 Table 26: Age Distribution, 2010 ......................................................................................................... 21 Table 27: Regional Income and Poverty Data.............................................................................. 21 Table 28: Education Attainment........................................................................................................ 22 Table 29: Project Information.............................................................................................................. 22 Table 30: Economic Impact Regions ............................................................................................... 23 Table 31: Input Assumptions (Spending and LPCs) ...................................................................... 23 Table 32: Overall Summary Economic Impacts ............................................................................ 24 Table 33: Economic Impact at Regional Level ............................................................................. 25 Table 34: Economic Impact at State Level .................................................................................... 27 Table 35: Economic Impact at National Level.............................................................................. 28 Table 36: Impact Region Definition (2008)...................................................................................... 30 Table 37: Impact Region Definition (2008)...................................................................................... 31 Table 38: Top Ten Industries Affected by Work Activity (2008) ................................................. 32
San Francisco Bay to Stockton Navigation Improvement
D-4

APPENDIX D: ECONOMIC ANALYSIS
Introduction Purpose The purpose of this report is to describe the National Economic Development (NED) benefits associated with a range of potential future deepening projects of the Pinole Shoal Channel and Suisun Bay Ship Channel. The proposed navigation improvements evaluated in this study include the deepening of the channel from current depth of -35 feet mean lower low water (MLLW) to incremental depths up to -38 feet MLLW.
This analysis describes recent historical throughput at the oil terminals serviced by the channel. The report additionally describes projections of the commodity tonnages expected to pass through the oil terminals over the 50-year period of analysis. The economic benefits of the proposed channel improvements are calculated as the estimated transportation cost savings resulting from a lower cost of moving goods as a result of the ability of shipper to more fully load tankers on a deeper navigation channel.
This analysis is conducted in accordance with ER 1105-2-100 (Planning Guidance Notebook -PGN) and IWR 10-R-4 (National Economic Development Procedures Manual Deep Draft Navigation). Data for the calculation of shipping costs is provided by the IWR Vessel Operating Costs, Economic Guidance Memorandum 17-04: Deep Draft Operating Costs FY 2016, Waterborne Commerce Statistics, the Western States Petroleum Association (WSPA) and its members, interviews with various shipping companies, and the San Francisco Bay Bar Pilots’ Association. Project benefits presented in this appendix are for a 50-year period of analysis. The FY 2016 Federal Discount rate of 3.125% was used for alternative evaluation, and the analysis for the recommended plan has been updated to incorporate the FY 2020 Federal Discount Rate of 2.75%.
Existing Conditions The scope of this economic analysis includes the Pinole Shoal Channel and Suisun Bay Channel, which begins in Central San Francisco Bay at the West Richmond Channel and terminates at Avon. It includes portions of the John F. Baldwin (JFB) Ship Channel including the West Richmond Channel, Pinole Shoal Channel and Bulls Head Reach Channel. Figure 1 shows a map of the area.
The San Francisco Bay to Stockton project was authorized and completed circa 1965 to 35 feet Mean Lower Low Water (MLLW) and is still maintained to that depth. The Ship Channel to Avon provides deep draft navigation to oil refineries and various other deep draft facilities in the Carquinez Strait region.
Figure 1 also shows the existing channel depths through the project area. The bar entrance through the Golden Gate Bridge is at its authorized depth of 55 feet, which is consistent with the channel leading to the Port of Oakland – the second largest container
San Francisco Bay to Stockton Navigation Improvement
D-5

A
WEST RICHMOND CHANNEL
CURRENT DE9Tii ·35 FT A UTHORIZED OE?TH -45 FT
I
• San Francisco 'i
0 (")
"' .,,. z
Napa 1
PINOLE SHOJJ.. CHANNEL
CURREN T DEPTH -35 FT AUTHORIZED DEPTH •45 FT
Vallejo
RICHMONOl ONG V"1ARF MA,'iEUVERiHG AREA ANO
SOUTiiAMPTONSHOAlCliANNEL 1
COMPLETED TO AUTHORIZED DEPTH OF -45 FT.
- Berkeley ,,.
Oakland
Alameda
San Leandro
Fairfield
SUISUN BAY CHANNEL
C URRENT DEPTH .JS FT AUTiiORIZEO DEPTH ~5 FT
Concord
Walnut Creek
...
Al
APPENDIX D: ECONOMIC ANALYSIS
port by volume on the U.S. West Coast. Ships heading north through the bay have 45 feet of water to the Port of Richmond, which is both an oil and bulk Port and the location of the Chevron terminal.
Figure 1: Project Area Map and Existing Channel Features
Oil has been imported along the JFB Ship Channel since at least the late 19th century. There are currently five refineries in northern California, four of which are located within the project area. The four refineries are owned by Shell, Tesoro, ConocoPhillips, and Valero. The fifth (Chevron) is located nearby at the Port of Richmond. Because of the size of the California market for transportation fuel, and because the state’s refineries require a unique blend of gasoline, a forecast of the state’s demand and of the demand
San Francisco Bay to Stockton Navigation Improvement
D-6

APPENDIX D: ECONOMIC ANALYSIS
for imported fuel needs to go beyond the national perspective. Crude oil production has fallen in California; consequently, demand has been met increasingly more by imports. Figure 2 shows the location of adjacent ports and the oil refineries.
Figure 2: Major Ports in the Area
According to the California Energy Commission, imports of crude oil to California have increased at an average annual rate of 1.2 percent over the last ten years. While no explicit growth rate forecast was found in the Commission’s latest available presentation from 2011, the Commission does state that crude oil imports are expected to continue to grow over approximately the next twenty years at a relatively low rate. The Commission predicts that an increase in imports to California will be required to make up for the decline in California-sourced crude over time. Most of the largest crude fields in the
San Francisco Bay to Stockton Navigation Improvement
D-7

APPENDIX D: ECONOMIC ANALYSIS
central valley of California have been producing since the early 1900’s. As crude fields age, production decreases and the amount of reserves in the field decrease as well. As such, the amount of crude produced and available to California refineries is decreasing.
Economic Study Area The Pinole Shoal Channel and Suisan Bay Channel is located in the Sacramento-San Joaquin Delta Region of Central California. The channel flows through Contra Costa and Solano counties and serve the marine terminals of the oil refineries along the Channel along with other facilities.
Cargo and Vessel Profile According to data from the Waterborne Commerce Statistics Center, 20 million to 27 million tons of commodities moved through Carquinez Straight annually between 2005 and 2013. In terms of both tonnage and value, the most important commodity that moves through the study is crude oil. Most of the crude oil moving through the channel is imported from foreign countries, although a small percentage of crude comes from domestic sources.
Crude oil import vessels can generally be classified into two groups. The first group is comprised of Aframax and Suezmax tankers with DWTs between 80,000 and 150,000 DWTs. These vessels have design drafts of as much as 57 feet, and arrive in Northern California only after having lightered elsewhere, typically Southern California. The second group is comprised of Panamax tankers that are about 750 feet long, with a design draft of about 45 feet and a beam of about 105 feet.
While in theory both groups of shipments could potentially benefit from a deepening project, significant benefits would not be expected to accrue to the larger group of vessels unless the project depth gets beyond 45 feet. Even with the project deepened to its authorized depth, it will still generally make economic sense for the larger vessels to continue to lighter at a deeper facility before arriving at one of the project area refineries. On the other hand, the shipments on the Panamax vessels would be the ones expected to benefit significantly from a deepening of the navigation channel. Tankers also export a significant amount of gasoline, diesel and other products from the project area refineries.
Facilities and Infrastructure The facilities that use the deep draft navigation channel are listed below beginning with western most facility moving inland to the east. Figure 3 displays the layout of the dock locations.
San Francisco Bay to Stockton Navigation Improvement
D-8

..... \ • '
// ' ' • ' ' Sen P•b!o \.illr10 ' .. , ' .. ' ' Su,•un
' .. ,
' @ 0,, ... , .. ' CD ® ., <o'>''"
8 9
4 5 ' ' ' ' l•• <I' ' " ' ' ' ' ' • n • nl
Richmond ' .. ~-· Richmond Channel
Western Reach Channel Users ...
C.ntrei 1: Phillips 66 Oleum Dock {ROD 3, 4, & S) SF Bey
2: NuStar Energy Selby Dock (ROD 8)
3: C&H Sugar (CRM 1)
4: Shell (MRZ 2 & 3)
5: Tesoro Amorco Dock {MRZ 5) •
.... lfl 6: Plains All American (MRZ 6) lr.n .. ,,o
7: Tesoro Avon (MRZ 7 & 8) San
Francisco 8: Benicia Port Terminal {Am Ports) {BNC 1, 2, & 3)
.. .,,,, 9: Valero {BNC 4) SF Bay
( 11\ Miles A
0 2.5 5 10 N
APPENDIX D: ECONOMIC ANALYSIS
Figure 3: Facility Users
San Francisco Bay to Stockton Navigation Improvement
D-9

APPENDIX D: ECONOMIC ANALYSIS
Phillips 66 Oleum operates three docks located in the waters off Rodeo, California, at the eastern end of the Pinole Shoal Channel. Crude oil is received by pipelines from California oil fields and also from tankers. The facility has a total capacity of 1 million barrels of crude oil and 2.9 million barrels of petroleum products. The dock has three berthing areas totaling about 2,500 feet. The berths can accommodate vessels up to 1,000 feet length overall. Crude oil pipelines extend from the dock areas to 45 steel storage tanks. The maximum depth of the dock is 40 feet. Based on data from 2011 to 2013, 46% of vessel calls had arrival drafts of 30 feet or greater, 54% had arrival drafts of 29 or less.
NuStar Energy is a privately owned trans-shipper of petroleum products located in Crockett, California. NuStar Energy does not own products shipped through the facility; rather, it warehouses products for its customers. The facility has 24 storage tanks with a capacity of 3.04 million barrels per day. Crude is delivered to refineries through the Kinder Morgan pipeline system and by sea. It operates one dock for offloading petroleum products to storage tanks. The dock has one berth with a draft of 40 feet MLLW and can accommodate vessels with a maximum length of 831 feet length overall (LOA) and 100,000 dead weight tons. NuStar Energy is also services by trucks and rail. Based on data from 2011 to 2013, the distribution of arrival drafts are 33% vessel drafts from 30 feet to 37 feet and 67% arrival drafts of 29 feet and less. Only one vessel had an arrival draft of 37 feet.
California and Hawaii (C&H) Sugar is located east of the Carquinez Bridge on the southern shore of Carquinez Strait, in Crockett, California. The port contains five berths that can accommodate vessels up to 750 feet length overall, with depths up to 36 feet MLLW. It receives unrefined sugar and supplies and ships packaged refined sugar. The current capacity is approximately 112,000 tons of sugar. The facility is also serviced by the Union Pacific Railroad. C&H Sugar is a non-benefitting terminal based on data of arrival drafts with a max of 34 feet. Based on data from 2011 to 2013, the terminal’s vessel calls are about half (50%) arrival draft 30 to 34 feet and about half with drafts less than 30 feet.
Shell Oil Refinery is located on approximately 1,100 acres along the southern shore of Carquinez Strait in Martinez, California. The refinery is a tanker and barge petroleum loading and unloading facility that imports and refines crude and exports refined petroleum products. It converts approximately 165,000 barrels of crude oil per day into gasoline, jet fuel, diesel, petroleum coke, industrial fuel oil, liquefied petroleum gas, asphalt, and sulfur. The docking facilities provide four berthing areas. Berths 1 and 2 are on the channel side and are currently in operation. The berths can accommodate vessels up to 1,000 feet length overall with depths of up to 39 feet MLLW. Berths 3 and 4 are on the south side of the dock (inland side) and not currently maintained (State Lands Commission, 2011).
San Francisco Bay to Stockton Navigation Improvement
D-10

APPENDIX D: ECONOMIC ANALYSIS
Amorco Marine Oil Terminal is owned and operated by Tesoro Refining and Marketing Company (Tesoro). The terminal is a tanker and barge petroleum unloading facility (i.e., import only) used by Golden Eagle Refinery, located in Martinez, Contra Costa County, California. The terminal imports crude oil to Tesoro’s Amorco Tank Farm immediately upland where it later transferred to Tesoro’s Golden Eagle Refinery for refining. The single berth dock is approximately 1,130 feet long by 150 feet wide with a depth of 38 to 40 feet MLLW. The terminal can accommodate up to 190,000 dead-weight ton (DWT) vessels with displacements up to 200,000 DWT. The current throughput of the terminal is 16.9 million barrels, with a maximum throughput of 26.8 barrels per year (State Lands Commission, 2014).
The Plains All American Oil Terminal is a 225-acre site located on the south shore of Carquinez Strait, in Martinez, California. The oil terminal owns and operates the Shore Terminal docks in Martinez. The dock is a single vessel berth with associated pumps and pipelines to transport crude to upland storage tanks and refinery. The dock is approximately 100 feet long, 40 feet wide, with a 38-foot MLLW berthing area that operates as a barge and tanker loading and unloading facility. The dock can currently handle vessels up to 950 feet length overall and 150,000 DWT displacements (State Lands Commission 2014). The deepest drafting vessel calling this terminal based on 2011-2013 data is 35 feet. Therefore it is assumed vessels calling this terminal will not benefit from a deeper drafting channel in the economic analysis.
Tesoro Avon Marine Terminal is owned and operated by Tesoro Refining and Marketing Company (Tesoro). The terminal is a tanker and barge petroleum export facility associated with the Golden Eagle Refinery, located in Contra Costa County, California. The facility exports refined petroleum products, including premium fuel oil, gas oil, diesel, and cutter stock, from the refinery to tanker vessels for export. The Avon terminal is a multi-berth terminal facility consisting of two berths, Berth 1 and Berth 5; however, the terminal currently supports only one berth, Berth 1. The docking facility is approximately 1,520 feet long and ranges from 20 to 80 feet wide. The terminal can accommodate vessels up to 113,635 DWT with displacements of up to 102,600 long tons. Annual shop and barge traffic averages 124 vessels per year (between 2004 and 2013) and the throughput ranges from about 5.1 to 12.8 million barrels per year. Future estimates of oil throughput are 10 to 15 million barrels per year (State Lands Commission 2005).
The Port of Benicia is located in the Benicia Industrial Park, immediately west of the Martinez Bridge. It is a small port (640 acres) owned and operated by AMPORTS, one of North America’s largest auto processors, processing more than 1 million vehicles each year. The port also provides break bulk service. The port is located near rail service. It can handle up to three 38-foot deep MLLW draft vessels along its 2,400-foot long wharf.
San Francisco Bay to Stockton Navigation Improvement
D-11

APPENDIX D: ECONOMIC ANALYSIS
According to Waterborne Commerce Data from 2011-2013, only five vessels called with drafts of about 35 feet out of approximately 349 vessels calling the facility.
Valero Refinery is located on the northeastern shore of Carquinez Strait, in Benicia, Solano County, California. The facility currently processes crude oil received by pipeline and marine tanker and barge vessels. It also has significant asphalt production capabilities, producing 25 percent of the asphalt supply in northern California. Currently, Valero refines domestic crude from the San Joaquin Valley (delivered by pipeline) and Alaska North Slope (delivered by tanker or barge), as well as foreign sour crude. The refinery has a throughput capacity of 170,000 barrels per day.
Carriers and Route Groups Vessels calling regularly at a port usually follow specific trade routes and patterns. The trade routes are a function of the commodity carried by the ship and the inland commodity hinterlands. In the economic model HarborSym, explained in Section 4.1.1, these trade routes are called ‘Route Groups’. In looking at the data from 2011 to 2013, nine route groups emerged for vessel operation. One vessel is included in the ‘default’ route group. Some regions were combined into a route group because the vessel calls were limited in that region. Table 1 shows the route groups identified for this study and their description.
Table 1: Route Group Information
HarborSym Route Group Name Route Group Description Canada Canada
Central America Mexico, El Salvador, Guatemala, Honduras, Panama
Default Identified for vessels that did not have route group information in the existing condition
East Asia China, Japan, Singapore, South Korea Eastern Atlantic Middle East, West Coast Africa USA Los Angeles, South California Western Atlantic Caribbean, East Coast South America Western South America Columbia, Ecuador Pacific Alaska, Hawaii
Existing Fleet Data for the current fleet was obtained from Waterborne Commerce of the United States, the oil refineries and the San Francisco Bar Pilots Association. Tables 2 and 3 display the general trend for tankers. Larger vessels comprise a greater percentage of the vessel fleet moving crude and other oil products. In the year 2000, the three smallest classes
San Francisco Bay to Stockton Navigation Improvement
D-12

APPENDIX D: ECONOMIC ANALYSIS
(20k, 25k, and 35k deadweight tons) comprised 53% of the vessel fleet; in 2015 those three classes comprised just 18 percent of the fleet.
Table 2: Tankers by Class - Year 2000
DWT 20k 25k 35k 50k 60k 70k 80k 90k 110k 150k 165k
Vessel Calls 28 79 102 44 34 15 7 15 14 14 35
Percentage of Calls 7% 20% 26% 11% 9% 4% 2% 4% 4% 4% 9%
Table 3: Tankers by Class - Year 2015
DWT 20k 25k 35k 50k 60k 70k 80k 90k 110k 150k 165k
Vessel Calls 1 1 59 27 34 72 0 34 75 34 0
Percentage of Calls 0% 0% 18% 8% 10% 21% 0% 10% 22% 10% 0%
Table 4 shows vessel fleet data for foreign deep draft vessels calling the refineries. The vessels presented below are separated based on deadweight tons (DWT) and the same vessel types and subtypes used in the HarborSym model. All vessels used in the analysis are tankers. Pilot’s logs and data from the Waterborne Commerce Statistics Center were used to determine the vessel classes.
Table 4: Vessel Types and Attributes
Vessel Type Capacity (DWT) Maximum Design Draft
Maximum Beam
Maximum Length Overall
Tons Per Inch (TPI)
Panamax Medium 16,000-40,000 40 101 700 100 Panamax 35,000-77,000 45 106 760 154 Aframax 77,001-120,000 50 160 920 238 Suezmax 120,001-195,000 55 165 960 299
Shipping Operations Vessel operations have implications for the shipping costs associated with the movement of cargo. The analysis uses assumptions relating to vessel operations based on discussions with the San Francisco Bay Bar Pilots. These assumptions include conditions related to tidal delays and underkeel clearance requirements. All assumptions affect the calculations used to determine potential project benefits.
San Francisco Bay to Stockton Navigation Improvement
D-13
APPENDIX D: ECONOMIC ANALYSIS
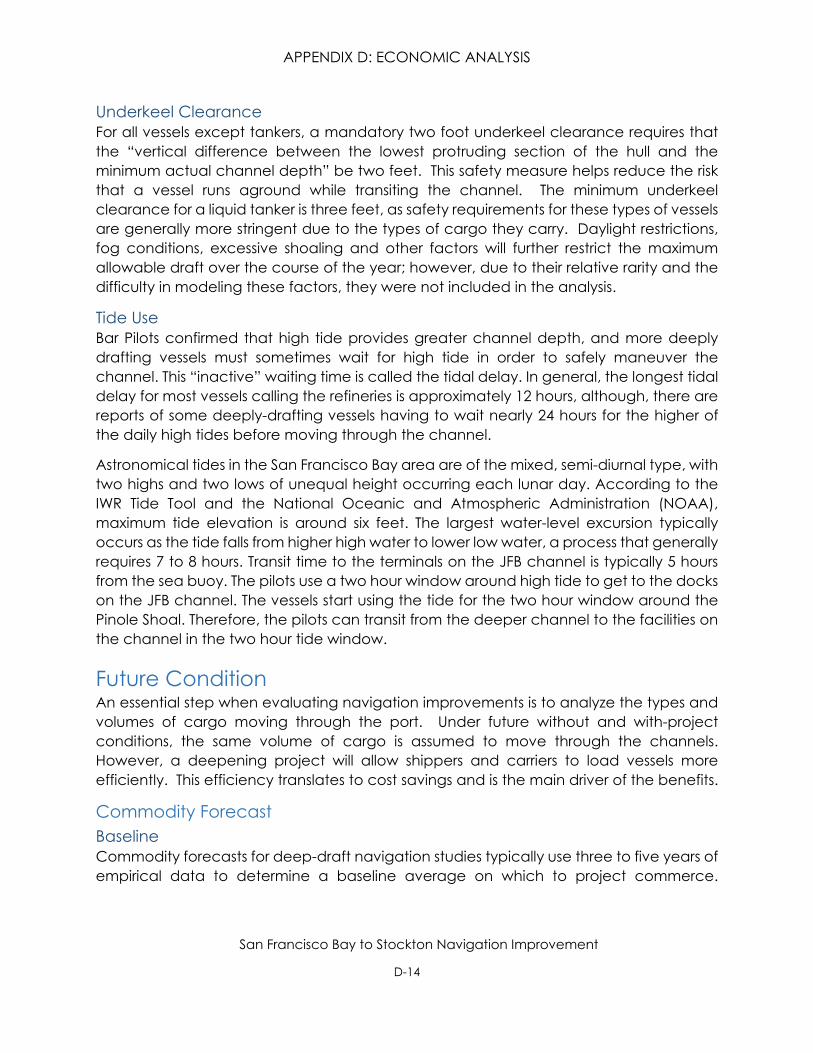
Underkeel Clearance For all vessels except tankers, a mandatory two foot underkeel clearance requires that the “vertical difference between the lowest protruding section of the hull and the minimum actual channel depth” be two feet. This safety measure helps reduce the risk that a vessel runs aground while transiting the channel. The minimum underkeel clearance for a liquid tanker is three feet, as safety requirements for these types of vessels are generally more stringent due to the types of cargo they carry. Daylight restrictions, fog conditions, excessive shoaling and other factors will further restrict the maximum allowable draft over the course of the year; however, due to their relative rarity and the difficulty in modeling these factors, they were not included in the analysis.
Tide Use Bar Pilots confirmed that high tide provides greater channel depth, and more deeply drafting vessels must sometimes wait for high tide in order to safely maneuver the channel. This “inactive” waiting time is called the tidal delay. In general, the longest tidal delay for most vessels calling the refineries is approximately 12 hours, although, there are reports of some deeply-drafting vessels having to wait nearly 24 hours for the higher of the daily high tides before moving through the channel.
Astronomical tides in the San Francisco Bay area are of the mixed, semi-diurnal type, with two highs and two lows of unequal height occurring each lunar day. According to the IWR Tide Tool and the National Oceanic and Atmospheric Administration (NOAA), maximum tide elevation is around six feet. The largest water-level excursion typically occurs as the tide falls from higher high water to lower low water, a process that generally requires 7 to 8 hours. Transit time to the terminals on the JFB channel is typically 5 hours from the sea buoy. The pilots use a two hour window around high tide to get to the docks on the JFB channel. The vessels start using the tide for the two hour window around the Pinole Shoal. Therefore, the pilots can transit from the deeper channel to the facilities on the channel in the two hour tide window.
Future Condition An essential step when evaluating navigation improvements is to analyze the types and volumes of cargo moving through the port. Under future without and with-project conditions, the same volume of cargo is assumed to move through the channels. However, a deepening project will allow shippers and carriers to load vessels more efficiently. This efficiency translates to cost savings and is the main driver of the benefits.
Commodity Forecast Baseline Commodity forecasts for deep-draft navigation studies typically use three to five years of empirical data to determine a baseline average on which to project commerce.
San Francisco Bay to Stockton Navigation Improvement
D-14

APPENDIX D: ECONOMIC ANALYSIS
Baseline averages over a longer period of time can lead to an underestimation of port growth. To minimize the impact of potential anomalies in trade volume on a long-term forecast, three years of empirical data (2011-2013) were used to establish the baseline for the commodity forecast.
Table 5 shows historical imports and exports moving through the oil terminals from 2011 to 2015. Crude oil is the main commodity being imported to the terminals, while petroleum products are being exported from the terminals. For the analysis baseline, the average of 2011 to 2013 was used. The 2014 and 2015 data were not available at the time the commodity and fleet forecasts were developed but were added to show the import/export trend. Crude oil imports grew by approximately 23 percent from 2013 to 2014, and then decreased by approximately 3 percent from 2014 to 2015. Petroleum exports decreased by approximately 1 percent from 2013 to 2014, and decreased by 26 percent from 2014 and 2015. The Sensitivity Analysis section of this appendix documents the results of a range of potential commodity growth rates.
Table 5: Historical Imports and Exports
2011 2012 2013 2014 2015 2011-2013
3-year Average
Total Crude Imports
7,864,000 7,729,700 7,292,500 8,960,400 8,701,500 7,628,700
Total Petroleum
Exports 1,813,300 1,950,000 2,109,400 2,082,100 1,542,800 1,957,600
Trade Forecast The commodity forecast in this analysis is based on the Annual Energy Outlook 2015. The U.S. Energy Information Administration produced the Annual Energy Outlook 2015 (AEO2015) to present long-term annual projections of energy supply, demand, and pricing through 2040. The AEO2015 results are presented as six cases, each of which contains projections under an alternative, internally-consistent set of assumptions. The six cases the report focuses on are as follows: Reference Case, Low and High economic growth cases, Low and High Oil Price cases, and High Oil and Gas Resource case. According to the report, all cases maintain crude oil imports into the West Coast through 2040. The high levels of crude oil imports support growing levels of gasoline, diesel and jet fuel. The reference case is used for the growth rates of crude oil imports and petroleum and other liquids exports. The description for the reference case in the AEO2015 has real
San Francisco Bay to Stockton Navigation Improvement
D-15

APPENDIX D: ECONOMIC ANALYSIS
gross domestic product (GDP) growing at an average annual rate of 2.4% from 2013 to 2040. The reference case is also under the assumption that current laws and regulations remain generally unchanged throughout the projection period. This analysis focuses on the main oil refineries that import crude oil and export petroleum products. According to the AEO2015, the growth rate for crude oil imports is an annual rate of 0.3%. According to the same report, the growth rate for petroleum and other liquid exports is an annual rate of 2.4%.
Table 6 shows the commodity forecast for the base year 2020, 2030, and 2040. The AEO2015 report ends at year 2040. Even though capacity is not yet reached, the tonnage is held constant after year 2040.
Table 6: Channel Commodity Forecast 2020-2040 (metric tons)
Commodity 2020 2030 2040 Growth Rate
Total Crude Imports 7,790,000 8,027,000 8,271,000 0.3%
Total Petroleum and Other Liquid Exports 2,311,000 2,930,000 3,714,000 2.4%
Vessel Fleet In addition to a commodity forecast, a forecast of the future fleet is required when evaluating navigation projects.
Forecasted Vessel Fleet Using the fleet mix associated with the current imports and exports, the tonnage and the number of vessels are determined by dock and type of vessel. From the existing condition data, vessel classes were determined as shown in Table 4 calling a specific dock and the cargo tonnage being imported or exported over the dock. Based on the tonnage and number of vessel calls, the average tons per vessel were determined by size and by dock. It was assumed the percent of tonnage by vessel class in the existing condition would be the same in the future conditions for Aframax and Suezmax vessels. Therefore, this percentage of the vessel used is carried over into the forecasted years in order to approximate the tonnage by vessel class for years 2020, 2030 and 2040. Cargo tonnage is forecasted by dock and import or export and is the same for each forecasted year for all future conditions, only the fleet characteristics change.
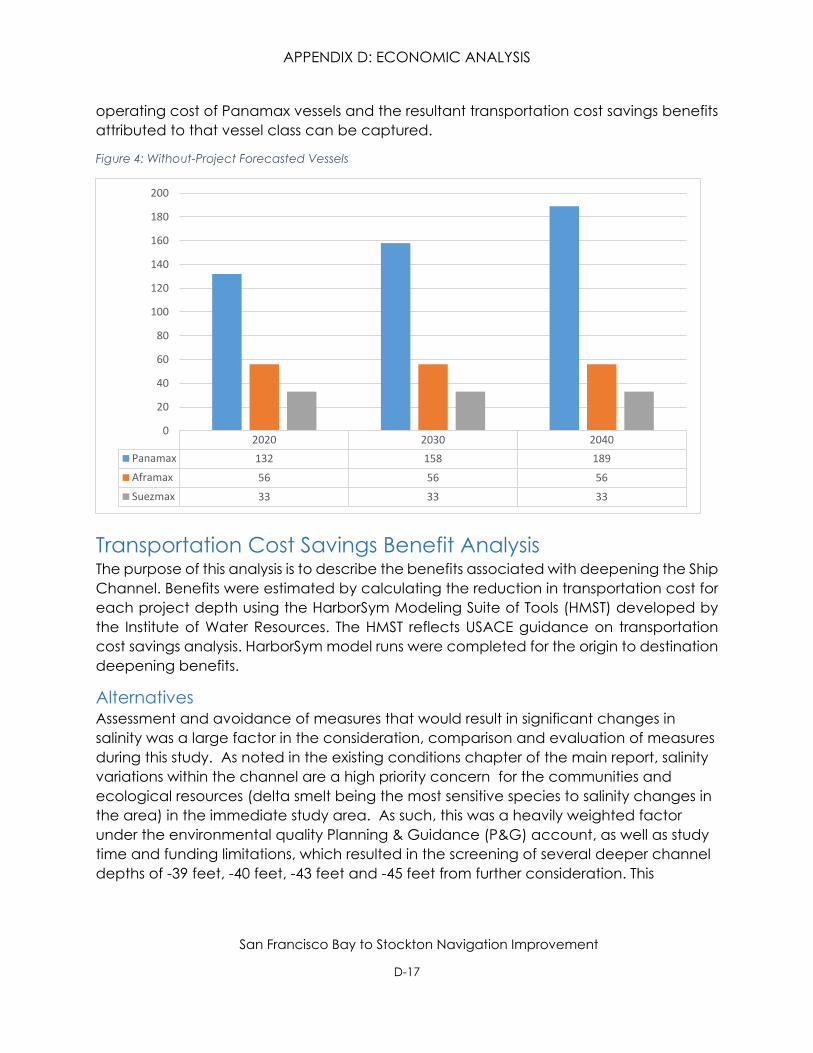
Figure 4 shows the forecast of vessels calling the terminals for the future without-project condition. The number of Aframax and Suezmax vessels remained the same as the existing condition in the forecasted years because the Panamax vessels are the main benefitting class. Therefore, with Aframax and Suezmax vessels being held constant, the
San Francisco Bay to Stockton Navigation Improvement
D-16
■
■
■
APPENDIX D: ECONOMIC ANALYSIS
operating cost of Panamax vessels and the resultant transportation cost savings benefits attributed to that vessel class can be captured.
Figure 4: Without-Project Forecasted Vessels
200
180
160
140
120
100
80
60
40
20
2020 2030 2040 Panamax 132 158 189 Aframax 56 56 56 Suezmax 33 33 33
0
Transportation Cost Savings Benefit Analysis The purpose of this analysis is to describe the benefits associated with deepening the Ship Channel. Benefits were estimated by calculating the reduction in transportation cost for each project depth using the HarborSym Modeling Suite of Tools (HMST) developed by the Institute of Water Resources. The HMST reflects USACE guidance on transportation cost savings analysis. HarborSym model runs were completed for the origin to destination deepening benefits.
Alternatives Assessment and avoidance of measures that would result in significant changes in salinity was a large factor in the consideration, comparison and evaluation of measures during this study. As noted in the existing conditions chapter of the main report, salinity variations within the channel are a high priority concern for the communities and ecological resources (delta smelt being the most sensitive species to salinity changes in the area) in the immediate study area. As such, this was a heavily weighted factor under the environmental quality Planning & Guidance (P&G) account, as well as study time and funding limitations, which resulted in the screening of several deeper channel depths of -39 feet, -40 feet, -43 feet and -45 feet from further consideration. This
San Francisco Bay to Stockton Navigation Improvement
D-17

APPENDIX D: ECONOMIC ANALYSIS
screening process was approved by USACE HQ and USACE Office of Water Project Review.
The -36 foot MLLW alternative was not analyzed in detail due to the observation that benefits were increasing beyond the -37 foot MLLW alternative (i.e., the benefits for the -38 foot MLLW alternative were greater than the benefits for the -37 foot MLLW alternative). Depths of -37 foot MLLW and -38 foot MLLW were analyzed in detail, for Pinole Shoal and Bulls Head reach portion of Suisun Bay to Avon. These depths were considered to be the increments that would be most likely to efficiently address the problems and objectives.
Non-structural and structural measures were compared and evaluated against a set of 12 different screening criteria to assess positive benefits and attributes which could be attained, worth a total of 2 points each, for a total maximum score of 26 points. Points were assigned as follows: Does Not Meet = 0; Partially Meets = 1; Fully Meets = 2. Negative scores up to -2 points were assigned for areas where negative effects could occur. The total score of each measure was then determined, and only measures which scored greater than 13 (over half of the total available points) were carried forward to be combined into alternatives.
Measures which were screened out include all non-structural alternatives, as they are already being implemented or did not compete well relative to other measures.
Measures carried forward as feasible ways to alleviate problems, meet objectives, show benefits under the P&G accounts, meet P&G screening criteria, and have low risk in terms of adverse environmental effects include the no-action plan, deepening alternatives at the -37 foot and -38 foot MLLW depth, sediment trap at the -42 foot depth plus 2 feet of overdepth (based on the shoaling analysis titled Bulls Head Deposition HydroSurvey Tech Memo- 2015), and removal of the rocky obstruction in Pinole Shoal channel.
These remaining measures were then combined into alternatives, which became the final array. These alternatives include the no-action alternative and two deepening alternatives (to depths of -37 feet and -38 feet MLLW), both which include dredged material being beneficially used at existing permitted beneficial use sites, Cullinan Ranch and Montezuma Wetlands, which is the least-cost placement option. Both deepening alternatives also include a sediment trap measure at Bulls Head Reach, as well as the measure addressing removal of the rocky obstruction to increase navigability and maintain navigation safety.
Methodology Channel improvement modifications result in reduced transportation cost by allowing a more efficient use of vessels. The HMST was designed to allow users to model these
San Francisco Bay to Stockton Navigation Improvement
D-18

APPENDIX D: ECONOMIC ANALYSIS
benefits. With a deepened channel, carriers will be able to load vessels more efficiently and thereby reduce transiting costs. The primary effect from channel deepening that can induce changes in vessel utilization is an increase in a vessel’s loading capacity. Channel restrictions can limit a vessel’s capacity by limiting its ability to load to its design draft. Deepening the channel can reduce this constraint and the vessel’s capacity can increase towards its design capacity if commodities are available to transit, vessel loading practices allow and the weight of the commodity on the vessel will lower it deeper in the water. This increase in vessel capacity utilization can result in fewer trips being required to transport forecasted cargo.
The US Army Corps of Engineer certified model HarborSym was used in this analysis. To begin, HarborSym was set up with the basic required variables. To estimate origin to destination cost savings benefits, the Bulk Loading Tool (BLT), a module within the HMST was used to generate a vessel call list based on the commodity forecast for a given year and available channel depth under the various alternatives. The resulting vessel traffic was simulated using HarborSym, producing average annual vessel origin to destination transportation costs. The transportation cost savings benefits were then calculated from the existing 35 foot channel for project depths of 37 feet and 38 feet.
HarborSym Model IWR developed HarborSym as a planning level, general purpose model to analyze the transportation costs of various waterway modifications to a channel. It is a Monte Carlo simulation model of vessel movements at a port for use in economic analysis. HarborSym concentrates on specific vessel movements and transit rules on the waterway, fleet and loading changes, as well as incorporating calculations for both within harbor costs and associated costs with the ocean voyage.
HarborSym represents a port as a tree-structured network of reaches, docks, anchorages and turning areas. Vessel movements are simulated along the reaches moving from the bar to dock and then exiting the port. The driving parameter for the HarborSym model is a vessel call at the port.The HarborSym analysis revolves around the factors that characterize or affect a vessel movement within the Harbor.
HarborSym is an event driven model. Vessel calls are processed individually and the interactions with other vessels are taken into account. For each iteration, the vessel calls for an iteration that fall within the simulation period are accumulated and placed in a queue based on arrival time. When a vessel arrives at the port, the route to all of the docks in the vessel call is determined. This route is comprised of discrete legs (contiguous sets of reaches, from the entry to the dock, from a dock to another dock, and from the final dock to the exit). The vessel attempts to move along the initial leg of the route. Potential conflicts with other vessels that have previously entered the system are evaluated according to the user-defined set of rules for each reach within the current leg, based on information maintained by the simulation as to the current and projected future state of each reach. If a rule activation occurs, such as no passing allowed in a given reach, the arriving vessel must either delay entry or proceed as far as possible to
San Francisco Bay to Stockton Navigation Improvement D-2

APPENDIX D: ECONOMIC ANALYSIS
an available anchorage, waiting there until it can attempt to continue the journey. Vessels move from reach to reach, eventually arriving at the dock that is the terminus of the leg.
After the cargo exchange calculations are completed and the time the vessel spends at the dock has been determined, the vessel attempts to exit the dock, starting a new leg of the vessel call. Rules for moving to the next destination (another dock or an exit of the harbor) are checked in a similar manner to the rule checking on arrival, before it is determined that the vessel can proceed on the next leg. As with the entry into the system, the vessel may need to delay departure and re-try at a later time to avoid rule violations and, similarly, the waiting time at the dock is recorded.
Each vessel call has a known (calculated) associated cost, based on time spent in the harbor and ocean voyage and cost per hour. Also, for each vessel call, the total quantity of commodity transferred to the port (both import and export) is known, in terms of commodity category, quantity, tonnage and value. The basic problem is to allocate the total cost of the call to the various commodity transfers that are made. Each vessel call may have multiple dock visits and multiple commodity transfers at each visit, but each commodity transfer record refers to a single commodity and specifies the import and export tonnage. Also, at the commodity level, the “tons per unit” for the commodity is known, so that each commodity transfer can be associated with an export and import tonnage. As noted above, the process is greatly simplified if all commodity transfers within a call are for categories that are measured in the same unit, but that need not be the case.
When a vessel leaves the system, the total tonnage, export tonnage, and import tonnage transferred by the call are available, as is the total cost of the call. The cost per ton can be calculated at the call level (divide total cost by respective total of tonnage). Once these values are available, it is possible to cycle through all of the commodity transfers for the vessel call. Each commodity transfer for a call is associated with a single vessel class and unit of measure. Multiplying the tons or value in the transfer by the appropriate per ton cost and the cost totals by class and unit for the iteration can be incremented. In this fashion, the total cost of each vessel call is allocated proportionately to the units of measure that are carried by the call, both on a tonnage and a value basis. Note that this approach does not require that each class or call carry only a commensurate unit of measure. The model calculates import and export tons, import and export value, and import and export allocated cost. This information allows for the calculation of total tons and total cost, allowing for the derivation of the desired metrics at the class and total level. The model can thus deliver a high level of detail on individual vessel, class, and commodity level totals and costs.
Vessel Call List The forecasted commodities for the ship channel were allocated to the future fleet using the BLT. The user must provide data to specify the framework for generating the synthetic
San Francisco Bay to Stockton Navigation Improvement D-3

APPENDIX D: ECONOMIC ANALYSIS
vessel call list. The BLT relies on much of the information and data from HarborSym, but has additional data specific requirements. Within the BLT, the input requirements include:
• Commodity forecasts (annual import/export) at each dock; • Description of the available fleet by vessel class, including:
o Statistical data describing the cumulative distribution function for deadweight tons of vessels within the class,
o Regression information for deriving length overall (LOA), beam and design draft from capacity,
o Regression information for calculating TPI based on beam, design draft, capacity and LOA;
o The number of potential calls that can be made annually by each vessel class;
• Logical constraints describing: o Commodities that can be carried by each vessel class, o Vessel classes that can be serviced at each dock, o Parameters, defined at the vessel class/commodity level for determination
of how individual calls and commodity transfers are generated, such as commodity loading factors, allocation priorities, and commodity flow direction (import or export calls).
Procedures exist, using the Extreme Optimization package and some Access routines, to populate much of the required forecast information based on an examination of an existing vessel call list created from historical data. Statistical measures, commodity transfer amounts, and logical constraints can all be derived from an examination of a set of historical calls that have been stored in a HarborSym database. The system populator function facilitates data entry by providing a basis for the forecasts, which the user can edit as necessary.
Load Factor Analysis A Load Factor Analysis (LFA) is the analytical effort to evaluate the disposition of a vessel carrying capacity according to both weight and volume, and evaluate resulting influences for immersion and associated transit draft as they relate to needs for waterway system depth. A LFA was conducted for this study in order to determine how many calls would be needed to satisfy the commodity forecast for the Future Without Project condition and the Future With-Project condition. The table below shows the vessel class inputs for the LFA.
Table 7: Vessel Class Inputs
Without Project 37 Feet 38 Feet
Vessel Class Import
Fraction Most Likely
Export Fraction
Most Likely
Import Fraction
Most Likely
Export Fraction
Most Likely
Import Fraction
Most Likely
Export Fraction
Most Likely
Panamax 68 66 71 67 72 68
San Francisco Bay to Stockton Navigation Improvement D-4

■ ■ ■
APPENDIX D: ECONOMIC ANALYSIS
Aframax 55 40 58 41 59 42 Suezmax 51 - 53 - 54 -
Bulk Loading Tool Data The bulk fleet was developed using historical calls from 2011 to 2013. Growth was assumed in traffic until 2040 and then assumed constant from 2040 to 2069. Table 8 shows the resultant bulk vessel fleet. Table 9 shows the forecasted Panamax vessel fleet.
Table 8: Bulk Vessel Fleet Forecast
2020 2030 2040 35 feet 37 feet 38 feet 35 feet 37 feet 38 feet 35 feet 37 feet 38 feet
Panamax Import 56 46 45 62 54 50 66 58 54
Aframax Import 52 52 52 52 52 52 52 52 52
Suezmax Import 33 33 33 33 33 33 33 33 33
Panamax Export 76 74 72 96 95 94 123 118 118
Aframax Export 4 4 4 4 4 4 4 4 4
Total 221 209 206 247 238 233 278 265 261
Table 9: With-Project Forecasted Panamax Vessels
200 189
2020 2030 2040
Existing Condition 37 Feet 38 Feet
132
158
120
149
176
117
144
172
0
20
40
60
80
100
120
140
160
180
Num
ber o
f Cal
ls
San Francisco Bay to Stockton Navigation Improvement D-5

APPENDIX D: ECONOMIC ANALYSIS
Origin-Destination Transportation Cost Savings Benefits by Project Depth Transportation cost benefits were estimated using the HarborSym Model and reported using the Economic Reporter, a tool that summarizes and annualizes HarborSym results from multiple simulations. This tool collects the transportation costs from various model run output files and generates the transportation cost reduction for all project years, and then produces an Average Annual Equivalent (AAEQ). Transportation costs were estimated for a 50-year period of analysis for the years 2020 through 2069. Transportation costs were estimated using HarborSym for the years 2020, 2030 and 2040. The transportation costs were held constant beyond 2040. The present value was estimated by interpolating between the modeled years. For initial screening of alternatives the FY 2016 Federal Discount rate of 3.125 percent was used and the results are presented below.
Table 10: AAEQ Transportation Costs
Alternative AAEQ Transportation Cost (FY2016 Discount Rate)
AAEQ Transportation Cost Reduction Benefit
No Action - 35 foot channel $209,846,000 Alternative 1 - 37 foot channel $202,221,000 $7,625,000 Alternative 2 - 38 foot channel $198,534,000 $11,312,000
Initial Project Costs of Deepening In the evaluation and comparison of project depth alternatives, which is necessary to arrive at the selected plan, NED costs play a critical role. NED costs include both the financial and economic costs associated with a project throughout its lifecycle. Each of these types of costs and their sources are discussed in this section of the report. Additionally, the NED costs for the depth alternatives being considered in this analysis will be identified.
NED Cost – Financial Financial costs of the proposed project consist of the construction and mitigation costs accrued during construction of the project and over its lifecycle. More specifically these costs include:
• Land Construction Costs • Dredging Costs • Preconstruction, Engineering, and Design Costs (PED) • Supervision and Administration Costs (S&A) • Contingency Costs • Supervision, Inspection, and Overhead Costs (SIOH) • Mitigation Costs
Based on discussions with the terminal owners, it was determined that no additional investments were needed in order to capture with-project benefits. Therefore, additional investments from terminal owners were not included in the cost estimate.
San Francisco Bay to Stockton Navigation Improvement D-6
APPENDIX D: ECONOMIC ANALYSIS
San Francisco District cost engineers prepared the cost estimate for the two proposed deepening alternatives for use in the economic analysis. The sum of these costs is used to determine Interest During Construction (IDC), which represents the economic cost of building a project. The next section defines IDC and provides an explanation as to how it is calculated and included in the analysis. Together, these costs represent the estimated first cost of construction.
Another financial cost not included above is the annual cost accrued over the life of a project due to Operation, Maintenance, Repair, Replacement, and Rehabilitation (OMRR&R) activities that represent an increase over the current OMRR&R costs to maintain the channel. OMRR&R was excluded from the list of financial costs above because it is not included in the calculation of IDC. IDC takes into account only those costs incurred during construction.
NED Cost – Economic Interest During Construction (IDC) represents an economic cost of building a project that is considered in the selection of the recommended plan, but does not factor in as a paid cost. IDC is the cost of the foregone opportunity to invest the money required to construct a project for another use. The hypothetical return on another investment, measured as IDC, is counted as an NED cost. As an economic, rather than a financial, cost, IDC is not considered in the determination of cost-sharing responsibilities.
IDC reflects that project construction costs are not incurred in one lump sum, but as a flow over the construction period. This analysis assumes that construction expenditures are incurred at a constant rate over the period of construction, an assumption which is supported by the NED Manual for Deep Draft Navigation.
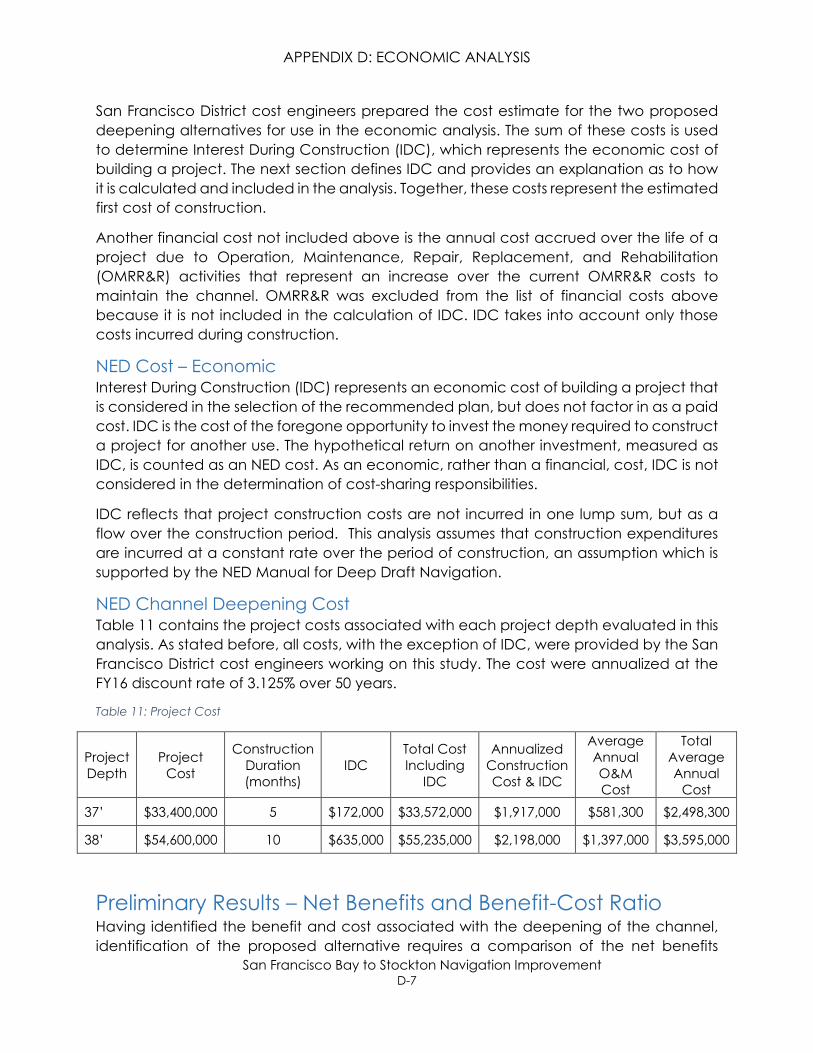
NED Channel Deepening Cost Table 11 contains the project costs associated with each project depth evaluated in this analysis. As stated before, all costs, with the exception of IDC, were provided by the San Francisco District cost engineers working on this study. The cost were annualized at the FY16 discount rate of 3.125% over 50 years.
Table 11: Project Cost
Project Depth
Project Cost
Construction Duration (months)
IDC Total Cost Including
IDC
Annualized Construction Cost & IDC
Average Annual O&M Cost
Total Average Annual
Cost 37’ $33,400,000 5 $172,000 $33,572,000 $1,917,000 $581,300 $2,498,300
38’ $54,600,000 10 $635,000 $55,235,000 $2,198,000 $1,397,000 $3,595,000
Preliminary Results – Net Benefits and Benefit-Cost Ratio Having identified the benefit and cost associated with the deepening of the channel, identification of the proposed alternative requires a comparison of the net benefits
San Francisco Bay to Stockton Navigation Improvement D-7
APPENDIX D: ECONOMIC ANALYSIS
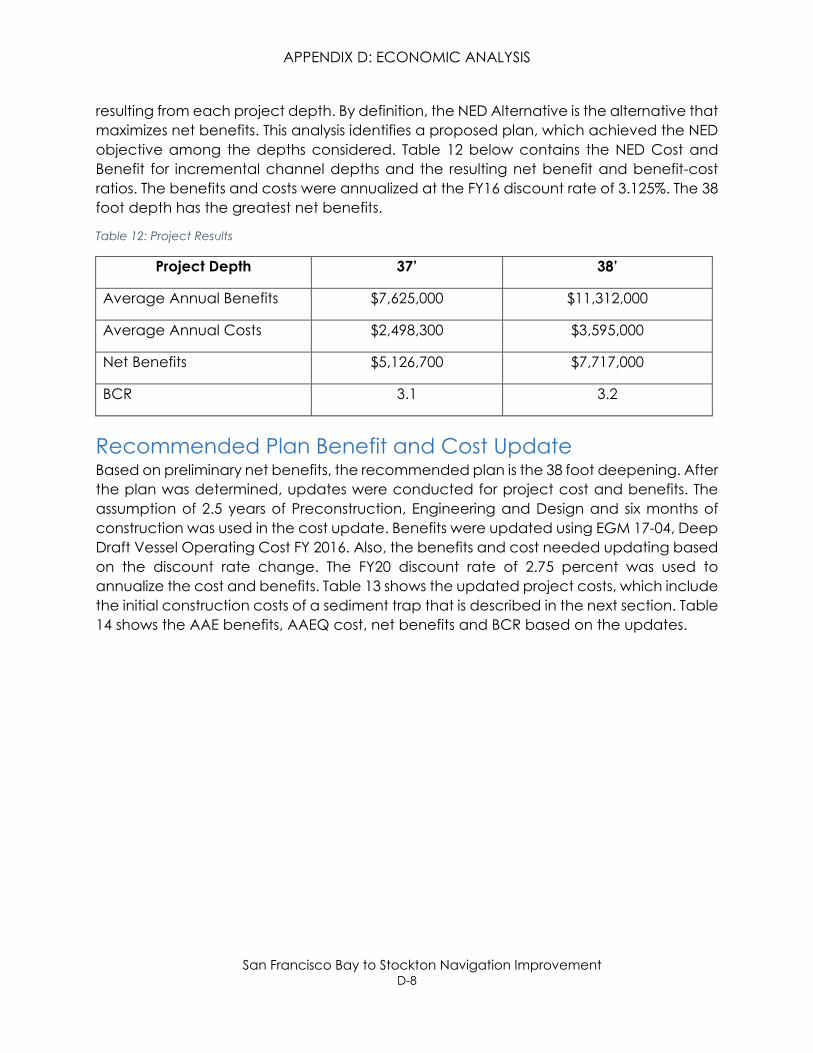
resulting from each project depth. By definition, the NED Alternative is the alternative that maximizes net benefits. This analysis identifies a proposed plan, which achieved the NED objective among the depths considered. Table 12 below contains the NED Cost and Benefit for incremental channel depths and the resulting net benefit and benefit-cost ratios. The benefits and costs were annualized at the FY16 discount rate of 3.125%. The 38 foot depth has the greatest net benefits.
Table 12: Project Results
Project Depth 37’ 38’
Average Annual Benefits $7,625,000 $11,312,000
Average Annual Costs $2,498,300 $3,595,000
Net Benefits $5,126,700 $7,717,000
BCR 3.1 3.2
Recommended Plan Benefit and Cost Update Based on preliminary net benefits, the recommended plan is the 38 foot deepening. After the plan was determined, updates were conducted for project cost and benefits. The assumption of 2.5 years of Preconstruction, Engineering and Design and six months of construction was used in the cost update. Benefits were updated using EGM 17-04, Deep Draft Vessel Operating Cost FY 2016. Also, the benefits and cost needed updating based on the discount rate change. The FY20 discount rate of 2.75 percent was used to annualize the cost and benefits. Table 13 shows the updated project costs, which include the initial construction costs of a sediment trap that is described in the next section. Table 14 shows the AAE benefits, AAEQ cost, net benefits and BCR based on the updates.
San Francisco Bay to Stockton Navigation Improvement D-8

APPENDIX D: ECONOMIC ANALYSIS
Table 13: Updated Project Cost
Project Depth 38' Federal Discount Rate 2.75% (FY20) PED Duration (Years) 2.5 Construction Duration (months) 6 PED Cost $1,910,000 Construction Cost $52,283,000 Sediment Trap Cost $3,047,000 Total Construction & PED Costs $57,240,000 IDC $470,000 Total Cost Including IDC $57,710,000 Annualized Construction Cost & IDC $2,053,000 Average Annual O&M Cost $1,030,000 Total Average Annual Cost $3,083,000
Table 14: Benefits, Costs, Net Benefits, and BCR (excludes Sediment Trap benefits)
Project Depth 38’ Federal Discount Rate 2.75% (FY20) Average Annual Benefits $12,885,000 Average Annual Costs $3,083,000 Net Benefits $9,802,000 BCR 4.2
Sediment Trap Cost Savings Analysis A sediment trap was identified as a potential alternative to reduce the occurrences of emergency dredging events in the channel. The strategy is not to reduce the volume of material required to be dredged, but rather, for more material to be trapped in the settling basin or under the channel, rather than the channel itself. This allows for cost savings by reducing the number of maintenance dredging events while providing an operational channel for longer periods of time. Table 15 below shows the cost savings related to the sediment trap. Table 16 displays a summary of the recommended plan, net benefits, and BCR.
San Francisco Bay to Stockton Navigation Improvement D-9

APPENDIX D: ECONOMIC ANALYSIS
Table 15: Sediment Trap Cost Savings Analysis
O&M Alternatives Total Present Value
Average Annual O&M Cost
Maintenance Costs without Project, with existing emergency maintenance
$26,997,170 $1,000,000
Maintenance Costs with-Project, without Sediment Trap
$26,997,170 $1,000,000
Maintenance Costs with-Project, with Sediment Trap
$8,586,679 $318,058
Savings (Benefits) $18,410,491 $681,942 Sediment Trap Net Benefits - $363,884 Sediment Trap BCR - 1.9
Table 16: Summary of Recommended Plan, Net Benefits, and BCR (with Sediment Trap benefits)
Project (Depth) 38 Feet Federal Discount Rate 2.75% (FY20) Net Present Value Benefits $347,851,000 Total Costs with IDC $57,710,000 Annualized Transportation Cost Savings (Benefits) $12,885,000 Annual Advanced Maintenance Cost Savings (Benefits) $682,000 Total Average Annual Benefits $13,567,000 Total Average Annual Costs $3,083,000 Average Annual Net NED Benefits $10,484,000 BCR 4.4
Sensitivity Analysis Risk and Uncertainty techniques should be used in deep draft navigation studies in the form of sensitivity analysis. The analysis used the growth rates for crude petroleum imports and petroleum product exports from the AEO 2015. Since 2015, additional energy outlooks have been published. Crude oil import growth has fluctuated around 0% and petroleum products exports have declined. To capture the uncertainty of the projected commodity volumes, three sensitivity scenarios are analyzed to display the variance in project benefits based on a change in the commodity forecast and the resultant fleet forecast. The sensitivity scenarios are as follows:
1. 0.3% growth in imported crude oil and 2.4% growth in exported petroleum products from the baseline until 2020, and then held all tonnage constant from 2020 to 2069.
2. Zero growth in imported crude oil and same export growth as original analysis.
San Francisco Bay to Stockton Navigation Improvement D-10

APPENDIX D: ECONOMIC ANALYSIS
3. Same import growth as original analysis of crude oil growth and zero growth for exports.
Scenario 1 The State of California adopted the Zero Emission Vehicle (ZEV) regulation in 1990 which aims to reduce emissions from mobile sources and attain health-based air quality standards. In January 2018, Executive Order B-48-18 (2018 ZEV Action Plan) was signed with the goal of having 200 hydrogen fueling stations and 250,000 electric vehicle chargers to support 1.5 million ZEVs in California by 2025 and 5 million ZEVs by 2030. For more information on the ZEV regulation, please see Economic Addendum 1. In order to evaluate the effect this regulation would have on the commodity forecast, the import tonnage was forecasted to grow by 0.3% from the baseline until 2020 and the export tonnage was forecasted to grow by 2.4% from the baseline until 2020. The commodities were then held constant from 2020 to 2069. Fifty iterations were ran in the HarborSym model to determine the average annual equivalent (AAE) benefits for growing the baseline average until 2020 and then holding tonnage constant from 2020 to 2069. Using all assumptions from the original analysis, the AAE benefits are $11,985,000. The AAE cost remain at $3,083,000. The net benefits are $8,902,000.
Scenario 2 The second sensitivity scenario analyzed zero growth of imported crude oil and 2.4% growth rate of exported crude oil. The 3-year average baseline tonnage (as shown in Table 5) for imports was held constant throughout the 50-year period of analysis. Using all assumptions from the original analysis, the AAE benefits are $12,402,000. The AAE cost remain at $3,083,000. The net benefits are $9,319,000.
Scenario 3 The third sensitivity scenario analyzed the expected AEO 2015 imported crude oil growth rate of 0.3% and zero growth for exports. The 3-year average baseline tonnage (as shown in Table 5) for exports was held constant throughout the 50-year period of analysis. Using all assumptions from the original analysis, the AAE benefits are $10,258,000. The AAE cost remain at $3,083,000. The net benefits are $7,175,000.
Summary of Sensitivity Analysis The figure below displays the most recent forecast for crude oil imports and petroleum product exports from the AEO 2019 report, which was published in January of 2019. Imports of crude oil are expected to grow at a rate of -0.2% between 2017 and 2050, while exports of petroleum products are expected to grow at a rate of 0.6% during the same time period.
San Francisco Bay to Stockton Navigation Improvement D-11

25
APPENDIX D: ECONOMIC ANALYSIS
Figure 5: AEO 2019 Forecast
10
15
20
Qua
ds
5
0 2017 2022 2027 2032 2037 2042 2047
Imports: Crude Oil Exports: Petroleum
Table 17 below displays a summary of the sensitivity analysis scenarios. In all three growth scenarios, the project is still justified.
Table 17: Sensitivity Analysis Summary
Import Growth Rate
Export Growth Rate
AAE Benefits AAE Costs Net Benefits BCR
Scenario 1 .3% until 2020 2.4% until 2020 $11,985,000 $3,083,000 $8,902,000 3.9 Scenario 2 0% 2.4% $12,402,000 $3,083,000 $9,319,000 4.0 Scenario 3 0.3% 0% $10,258,000 $3,083,000 $7,175,000 3.3
Multiport Analysis Multiport analysis presents the results of an assessment of potential effects the deepening of San Francisco Bay to Stockton could have on other ports. The multiport analysis considers factors related to port competition such as proximity, hinterland overlap, commodity throughput and sea, port and land based transportation options and costs. Since the purpose of a multiport analysis is to estimate potential changes in the with-project condition traffic forecasts, only the commodities affecting benefits and handled by alternative ports would be evaluated.
Multiport analysis calls for a systematic determination of alternative routing possibilities, regional port analyses and intermodal networks. Representatives from Contra Costa
San Francisco Bay to Stockton Navigation Improvement D-12

APPENDIX D: ECONOMIC ANALYSIS
County and the oil refineries were contacted to gain additional knowledge regarding multiport analysis. The benefitting commodities are imported and exported directly to the facilities adjacent to the study channel. Therefore, transportation cost are expected to be lowest with goods transported on the Stockton Ship Channel. Los Angeles is the closest port with refineries and is over 400 miles away. The commodity movements are currently taking place and are expected to continue through the same channel.
The hinterland can be classified as captive since the imported and exporting benefitting commodity rely exclusively on the terminals that exist along the SF Bay to Stockton channel. Alternative ports are not expected to be used in the period of analysis that would affect traffic projections. It is concluded that deepening alone will not cause traffic to be diverted from or to other ports.
Sea Level Rise Sea level rise is not anticipated to impact costs or benefits of the recommended plan. This determination was made by following the procedures outlined in ER 1110-2-8162. Baseline, intermediate, and high sea level rise values were estimated over the life of the project using the official USACE sea level change calculator tool. In the future without-project condition, sea level rise could be expected to increase by 0.36 feet (baseline), 0.85 feet (intermediate), and 2.38 feet (high) over the next 50 years.
The highest sea level change scenario was chosen for evaluation in the model because it was anticipated to have the most impact to hydrodynamics and salinity for the recommended plan. As demonstrated in Appendix B, the modeling results found that there would be no changes to hydrodynamics for the recommended plan when compared to without-project conditions for the high scenario, and it is anticipated a similar result would occur for the low and medium scenarios if they were run. The modeling results found that the changes to salinity for the recommended plan when compared to without-project conditions would not be significant for the high scenario, and it anticipated a similar result would occur for the low and medium scenarios if they were run.
Socioeconomic and Regional Analysis The socioeconomics of the community area are summarized in this section. The parameters used to describe the demographic and socioeconomic environment include recent trends in population for Alameda County, Contra Costa County, Marin County, San Francisco County, and San Mateo County that makes up the immediate economic study area of the San Francisco to Stockton Navigation Project.
Population California is ranked as the largest state in the Union in terms of resident population as of 2016, with 37.3 million residents. Between the years 1990 and 2010, California’s population increased by 25.2%, from 29.8 million to 37.3 million persons, as shown in Table 18, which is higher than the national growth over the same historical period. All counties within the
San Francisco Bay to Stockton Navigation Improvement D-13

APPENDIX D: ECONOMIC ANALYSIS
immediate economic regions of San Francisco Bay have seen a growth in population according to 2010 census data.
Census data from 2010 show increases in population across the Bay Area. With a 21.6 percent growth rate, San Joaquin County was the fastest growing county in the Bay Area between 2000 and 2010, followed by Contra Costa County (10.6 percent), Solano County (4.8 percent), San Francisco County (3.7 percent), and Marin County (2.1 percent). San Francisco is the largest city in the Bay Area, with a population of more than 800,000, followed by Stockton (291,707), Concord (122,067), and Vallejo (115,942).
Table 18: Population
Population Percent Change
Geography 1990 2000 2010 1990-2000
2000-2010 1990-2010
San Francisco County 723,959 776,733 805,235 7.3% 3.7% 11.2% Marin County 230,096 247,289 252,409 7.5% 2.1% 9.7% Contra Costa County 803,732 948,816 1,049,025 18.1% 10.6% 30.5% Solano County 340,421 394,542 413,344 15.9% 4.8% 21.4% San Joaquin County 480,628 563,598 685,306 17.3% 21.6% 42.6% California 29,760,021 33,871,648 37,253,956 13.8% 10.0% 25.2% United States 248,709,873 281,421,906 308,745,538 13.2% 9.7% 24.1%
Future population projections were retrieved from the California Department of Transportation database. The population projections for selected counties are shown in Table 19 below.
Table 19: Population Projections
Population Population Projections Percent Change
Geography 2010 2020 2030 2040 2010-2020
2020-2030
2030-2040
San Francisco County 805,235 891,887 937,307 966,226 10.76% 5.09% 3.09%
Marin County 252,409 268,343 276,771 283,676 6.31% 3.14% 2.49% Contra Costa County 1,049,025 1,181,384 1,303,375 1,400,195 12.62% 10.33% 7.43%
Solano County 413,344 448,451 480,348 509,217 8.49% 7.11% 6.01% San Joaquin County 685,306 786,738 883,911 973,872 14.80% 12.35% 10.18%
California 37,253,956 40,639,392 43,939,250 46,804,202 9.09% 8.12% 6.52% United States 308,745,538 332,639,000 355,101,000 373,528,000 7.74% 6.75% 5.19%
Employment California private sector annual employment in 2014 totaled 13.5 million, with average annual wage of $69,880 as shown in Tables 20 and 21, respectively. Of the major industry
San Francisco Bay to Stockton Navigation Improvement D-14

APPENDIX D: ECONOMIC ANALYSIS
sectors within the State, the Health Care and Social Assistance sector employs the most persons, with 2,000,372 employees. Retail Trade and Accommodation and Food Services follow closely behind in total employed persons, with 1,623,371 and 504,176 employees, respectively.
County industry sectors yield employment distributions similar to the State level, with few exceptions. In San Francisco County, Professional and Technical Services is predominant compared to other counties in the Bay area and the State of California.
Table 20: California Private Sector Annual Employment, 2014
California Private Sector Annual Employment - 2014
Industry San Joaquin County
Contra Costa County
Solano County
San Francisco County
Marin County California
Agriculture, Forestry, Fishing, and Hunting 15,588 787 1,788 144 415,444
Mining, Quarrying, and Oil and Gas Extraction
80 579 270 27 28,629
Utilities 1,255 551 57,627 Construction 8,897 21,213 8,368 16,741 5,969 669,766 Manufacturing 18,295 15,276 10,782 9,924 3,426 1,264,114 Wholesale Trade 11,109 9,184 4,326 13,896 2,804 709,154 Retail Trade 25,819 41,455 17,323 45,693 14,127 1,623,371 Transportation and Warehousing 13,668 3,369 446,430
Information 2,076 8,304 1,081 27,879 2,563 456,992 Finance and Insurance 5,003 18,191 3,460 37,175 4,623 515,504
Real Estate and Rental and Leasing 2,507 6,814 1,355 13,107 2,224 264,129
Professional and Technical Services 4,744 24,887 3,967 107,096 9,868 1,171,165
Management of Companies and Enterprises
1,812 8,439 801 20,881 2,163 225,792
Administrative and Waste Services 11,477 20,269 4,613 38,846 6,120 1,023,130
Education Services 4,258 6,388 1,532 18,173 3,451 317,066 Health Care and Social Assistance 29,781 53,885 21,522 64,801 15,770 2,000,372
Arts, Entertainment, and Recreation 2,395 5,968 3,470 13,260 2,722 276,312
Accommodation and Food Services 16,527 30,273 11,619 75,813 12,307 1,471,800
Other Services, Except Public Administration 6,104 11,852 3,610 27,266 5,478 504,176
Unclassified 499 1,019 274 2,682 487 60,740 Total 181,894 284,783 104,081 533,404 94,102 13,501,713
San Francisco Bay to Stockton Navigation Improvement D-15

APPENDIX D: ECONOMIC ANALYSIS
Table 21: California Average Annual Wage Earnings per Employee, 2014
California Average Annual Wage Earnings per Employee - 2014
Industry San Joaquin County
Contra Costa County
Solano County
San Francisco County
Marin County California
Agriculture, Forestry, Fishing, and Hunting
$29,133 $31,234 $31,914 $44,314 $28,751
Mining, Quarrying, and Oil and Gas Extraction
$81,296 $152,629 $77,908 $192,224 $138,053
Utilities $101,237 $130,209 $114,900 Construction $51,002 $68,495 $66,574 $82,935 $62,553 $59,464 Manufacturing $50,391 $97,310 $107,126 $98,581 $103,869 $81,368 Wholesale Trade $54,615 $86,975 $61,557 $94,749 $87,640 $71,780 Retail Trade $27,914 $32,314 $28,238 $46,042 $38,234 $33,175 Transportation and Warehousing
$48,572 $41,994 $50,140
Information $54,435 $97,741 $51,194 $175,718 $104,017 $136,214 Finance and Insurance $57,783 $97,375 $60,779 $230,075 $129,519 $108,336
Real Estate and Rental and Leasing
$37,246 $61,820 $39,402 $95,192 $64,791 $59,119
Professional and Technical Services
$53,330 $100,081 $54,110 $134,921 $92,565 $103,921
Management of Companies and Enterprises
$75,536 $137,355 $80,898 $178,209 $184,232 $118,880
Administrative and Waste Services
$27,231 $47,904 $37,184 $61,541 $48,566 $39,477
Education Services $37,994 $37,170 $43,330 $50,908 $50,346 $48,787
Health Care and Social Assistance $44,536 $60,518 $59,541 $45,530 $53,254 $46,848
Arts, Entertainment, and Recreation
$19,899 $22,950 $21,607 $64,872 $33,214 $53,678
Accommodation and Food Services
$15,100 $19,032 $16,318 $30,593 $23,287 $20,570
Other Services, Except Public Administration
$29,049 $34,901 $35,073 $45,842 $37,567 $35,023
San Francisco Bay to Stockton Navigation Improvement D-16

APPENDIX D: ECONOMIC ANALYSIS
Unclassified $30,638 $49,596 $26,292 $65,269 $58,748 $49,119 Total Average $46,347 $68,633 $53,562 $96,529 $73,275 $69,880
Wage Earnings by Sector Of the private sector industries, Mining, Quarrying, and Oil and Gas Extraction sector employees are paid the highest in average annual earnings, slightly over $138,000, followed by Information sector employees, earning on average $136,214. The average annual earnings of Mining, Quarrying, and Oil and Gas Extraction sector employees nearly doubles the average annual wage earnings across all industry sectors. In December of 2014, the unemployment rate in California was 7 percent, higher than all but two other locations in the U.S. (Mississippi and Washington, D.C.). In October of 2015, California experienced the largest job growth in the country, adding nearly 41,200 new jobs and bumping its unemployment rate down to 5.8 percent.
Median Household Income for Selected Counties Median household incomes for selected counties in California are shown in Table 22, with Marin County showing the highest median household income, followed by Contra Costa County, San Francisco County, Solano County, and San Joaquin County. Median household incomes for the Bay Area are higher than the State average of $61,094, except for San Joaquin County.
Table 22: California Median Household Income for Selected Counties
California Median Household Income for Selected Counties
Geography Median Household Income
% of State Median Household Income
San Francisco County $75,604 123.8% Marin County $90,839 148.7% Contra Costa County $78,756 128.9% Solano County $67,177 110.0% San Joaquin County $53,380 87.4% California $61,094 100.0%
As shown in Table 23 below, the unemployment rates in the Bay Area counties were mostly lower than the State and National Average.
San Francisco Bay to Stockton Navigation Improvement D-17
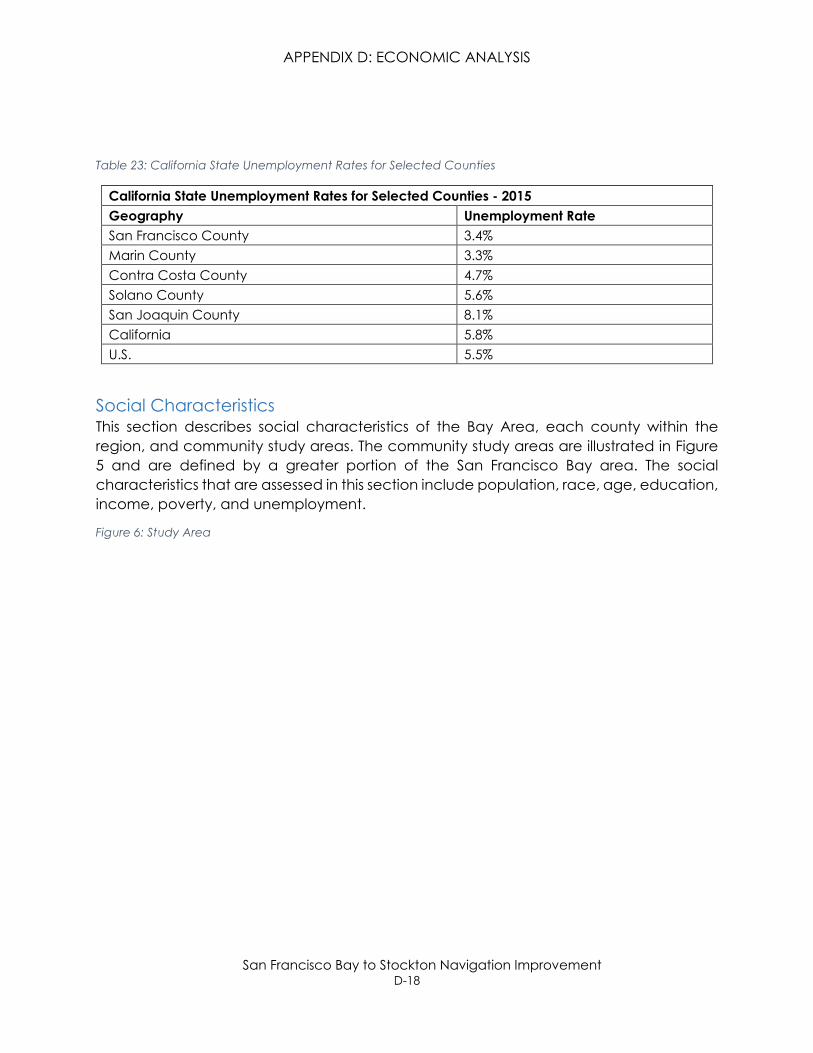
APPENDIX D: ECONOMIC ANALYSIS
Table 23: California State Unemployment Rates for Selected Counties
California State Unemployment Rates for Selected Counties - 2015 Geography Unemployment Rate San Francisco County 3.4% Marin County 3.3% Contra Costa County 4.7% Solano County 5.6% San Joaquin County 8.1% California 5.8% U.S. 5.5%
Social Characteristics This section describes social characteristics of the Bay Area, each county within the region, and community study areas. The community study areas are illustrated in Figure 5 and are defined by a greater portion of the San Francisco Bay area. The social characteristics that are assessed in this section include population, race, age, education, income, poverty, and unemployment.
Figure 6: Study Area
San Francisco Bay to Stockton Navigation Improvement D-18

APPENDIX D: ECONOMIC ANALYSIS
The population growth trends from 1980 through 2010 for the San Francisco Bay area are shown in Table 24. The region as a whole has experienced a rapid rate of growth since 1980. According to 2010 U.S. Census data, the Bay Area has a 49.8 percent growth between 1980 and 2010, with a net population increase of 1,064,877 residents.
Table 24: Bay Area Population Growth, 1980-2010
Bay Area Population Growth, 1980-2010
Population Percent
Increase 1980-2010
Geography 1980 1990 2000 2010 San Francisco County 678,974 723,959 776,733 805,235 18.6% Marin County 222,592 230,096 247,289 252,409 13.4% Contra Costa County 656,331 803,732 948,816 1,049,025 59.8% Solano County 235,203 340,421 394,542 413,344 75.7% San Joaquin County 347,342 480,628 563,598 685,306 97.3% Bay Area 2,140,442 2,578,836 2,930,978 3,205,319 49.8% California 23,667,902 29,760,021 33,871,648 37,253,956 57.4% United States 226,542,199 248,709,873 281,421,906 308,745,538 36.3%
San Francisco Bay to Stockton Navigation Improvement D-19

APPENDIX D: ECONOMIC ANALYSIS
Population density varied extensively for the five counties from a low of 485 persons per square mile in Marin County to a high of 17,179 persons per square mile in San Francisco County.
As shown in Table 25, the Bay Area and the State of California have mostly higher percentages of minority populations than the United States according to the 2010 U.S. Census. In the Bay Area, San Francisco County has a higher percentage of minority populations than the other counties. In 2010, the Bay Area as a whole had more of a diverse racial composition compared to the U.S., where approximately 55 percent of the population identified as White, 8.3% of the population identified as Black or African American, 18.5 percent of the population identified as Asian, and 11.1 percent of the population identified as Other.
Table 25: Racial Composition
Racial Compositio n 2010
San Francisc o County
Marin County
Contra Costa County
Solano County
San Joaquin County
Bay Area Californi a U.S.
White No. 390,387 201,963 614,512 210,751 349,287 1,766,900 21,453,93
4 223,553,26 5
% 48.5% 80.0% 58.6% 51.0% 51.0% 55.1% 57.6% 72.4% Black or African American
No. 48,870 6,987 97,161 60,750 51,744 265,512 2,299,072 38,929,319
% 6.1% 2.8% 9.3% 14.7% 7.6% 8.3% 6.2% 12.6% American Indian and Alaska Native
No. 4,024 1,523 6,122 3,212 7,196 22,077 362,801 2,932,248
% 0.5% 0.6% 0.6% 0.8% 1.1% 0.7% 1.0% 0.9%
Asian No. 267,915 13,761 151,469 60,473 98,472 592,090 4,861,007 14,674,252 % 33.3% 5.5% 14.4% 14.6% 14.4% 18.5% 13.0% 4.8%
Native Hawaiian and Other Pacific Islander
No. 3,359 509 4,845 3,564 3,758 16,035 144,386 540,013
% 0.4% 0.2% 0.5% 0.9% 0.5% 0.5% 0.4% 0.2%
Other No. 53,021 16,973 112,691 43,236 131,054 356,975 6,317,372 19,107,368 % 6.6% 6.7% 10.7% 10.5% 19.1% 11.1% 17.0% 6.2%
Two or More Races
No. 37,659 10,693 62,225 31,358 43,795 185,730 1,815,384 9,009,073 % 4.7% 4.2% 5.9% 7.6% 6.4% 5.8% 4.9% 2.9%
Total Population
No. 805,235 252,409 1,049,025 413,344 685,306 3,205,319 37,253,95 6
308,745,53 8
% 100% 100% 100.0% 100.0% 100.0% 100.0% 100.0% 100.0%
The age characteristics of the Bay Area are shown in Table 26. As a whole, the Bay Area in 2010 had a higher median age than the State of California and equaled the median age for the United States. San Francisco County, Marin County, and Contra Costa County all had median ages higher than or equal to the State and National median age. Solano County’s median age was higher than the State level, but lower than the National level. San Joaquin County was the only area to have a median age lower than both State and National levels.
San Francisco Bay to Stockton Navigation Improvement D-20

APPENDIX D: ECONOMIC ANALYSIS
Table 26: Age Distribution, 2010
Age Distribution 2010
San Francisco County
Marin County
Contra Costa County
Solano County
San Joaquin County
Bay Area California U.S.
Under 18 No. 124,570 56,452 287,513 113,222 223,585 805,342 10,452,042 74,181,467
% 15.5% 22.4% 27.4% 27.4% 32.6% 25.1% 28.1% 24.0%
18-64 No. 570,823 153,765 631,074 253,275 390,540 1,999,477 22,555,400 194,296,087
% 70.9% 60.9% 60.2% 61.3% 57.0% 62.4% 60.5% 62.9%
65 or Above No. 109,842 42,192 130,438 46,847 71,181 400,500 4,246,514 40,267,984
% 13.6% 16.7% 12.4% 11.3% 10.4% 12.5% 11.4% 13.0%
Total Population
No. 805,235 252,409 1,049,025 413,344 685,306 3,205,319 37,253,956 308,745,538
% 100% 100% 100% 100% 100% 100% 100% 100%
Median Age 38.5 37.2 38.5 36.9 32.7 37.2 35.2 37.2
The 2010 U.S. Census income and poverty data for the Bay Area and the State of California are summarized in Table 27. All counties had higher median household incomes than the State of California, with the exception of San Joaquin County at $59,900.
Table 27: Regional Income and Poverty Data
Regional Income and Poverty Data
San Francisco County
Marin County
Contra Costa County
Solano County
San Joaquin County
California U.S.
Median Household Income $75,604 $90,839 $78,756 $67,177 $59,900 $61,094 $53,046 Per Capita Income $48,486 $56,791 $38,219 $28,929 $22,589 $29,527 $28,155 Percent of People Below Poverty Level 13.5% 7.7% 10.5% 13.0% 18.2% 15.9% 15.4%
Marin County had the highest median household income and per capita income, while San Joaquin County had the lowest median household income and per capita income. San Joaquin County had the highest percentage of people living below poverty level (18.2 percent) when compared to other counties in the region and to the State of California. San Francisco County, Marin County, Contra Costa County, and Solano County all had lower percentages of people living below poverty level compared to the State of California.
As shown in Table 28, all counties in the Bay Area had a higher percentage of people over the age of 25 that graduated high school or higher when compared to the State of California and the United States, except for San Joaquin County. San Francisco County, Marin County, and Contra Costa County had higher percentages of people over the age of 25 that earned a Bachelor’s Degree or higher when compared to the State of
San Francisco Bay to Stockton Navigation Improvement D-21

APPENDIX D: ECONOMIC ANALYSIS
California and the United States. Solano County and San Joaquin County had lower percentages of people over the age of 25 that earned a Bachelor’s Degree or higher, at 24.3 percent and 18.1 percent, respectively.
Table 28: Education Attainment
Geography High School Graduate or Higher - Persons 25 Years or Older
Bachelor's Degree or Higher - 25 Years and Older
San Francisco County 86.3% 52.4% Marin County 92.4% 54.6% Contra Costa County 88.8% 39.0% Solano County 87.2% 24.3% San Joaquin County 77.3% 18.1% California 81.2% 30.7% U.S. 86.0% 28.8%
Regional Economic Development Analysis This report provides estimates of the economic impacts of Civil Works Budget Analysis for San Francisco to Stockton Navigation Project.
The U.S Army Corps of Engineers (USACE) Institute for Water Resources, the Louis Berger Group and Michigan State University has developed a regional economic impact modeling tool called RECONS (Regional ECONomic System) to provide estimates of regional and national job creation, and retention and other economic measures such as income, value added, and sales. This modeling tool automates calculations and generates estimates of jobs and other economic measures, such as income and sales associated with USACE's ARRA spending, annual Civil Work program spending and stem-from effects for Ports, Inland Water Way, FUSRAP and Recreation. This is done by extracting multipliers and other economic measures from more than 1,500 regional economic models that were built specifically for USACE's project locations. These multipliers were then imported to a database and the tool matches various spending profiles to the matching industry sectors by location to produce economic impact estimates. The tool will be used as a means to document the performance of direct investment spending of the USACE as directed by the American Recovery and Reinvestment Act (ARRA). The Tool will also allow the USACE to evaluate project and program expenditures associated with the annual expenditure by the USACE.
Table 29 provides the project information while Table 30 provides the economic impact regions for the San Francisco to Stockton Navigation Project.
Table 29: Project Information
Project Name: San Francisco to Stockton Navigation Project Project ID: 22526
San Francisco Bay to Stockton Navigation Improvement D-22
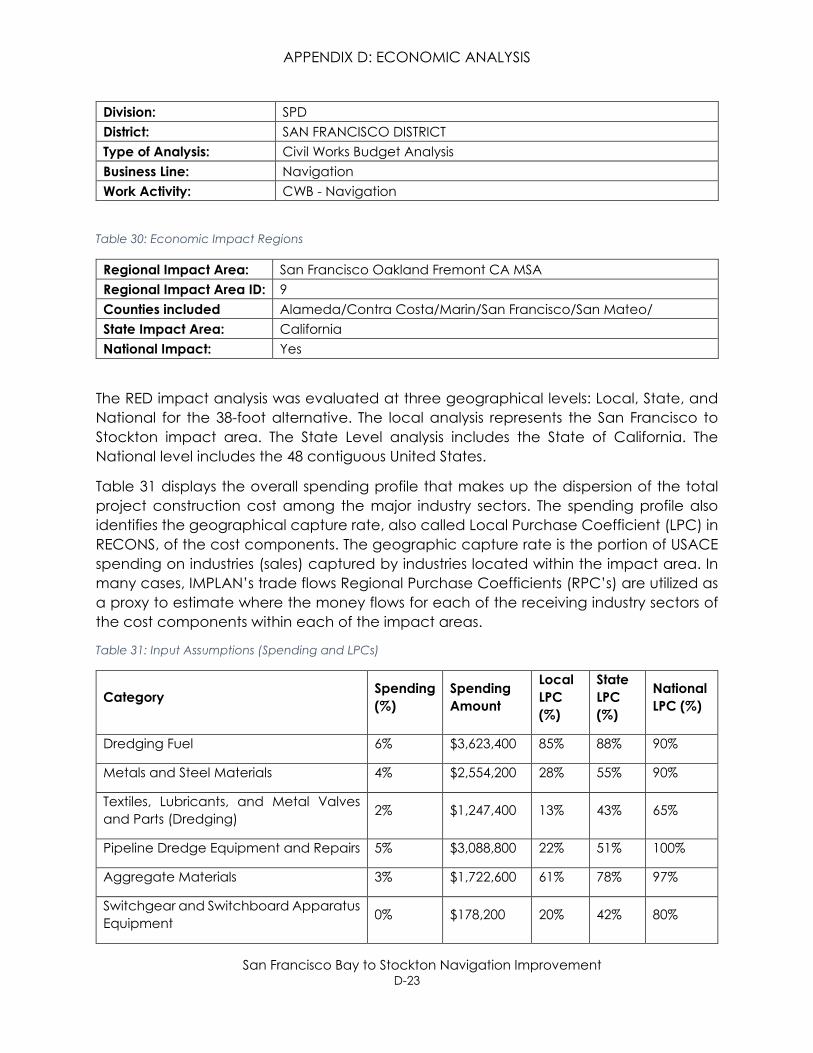
APPENDIX D: ECONOMIC ANALYSIS
Division: SPD District: SAN FRANCISCO DISTRICT Type of Analysis: Civil Works Budget Analysis Business Line: Navigation Work Activity: CWB - Navigation
Table 30: Economic Impact Regions
Regional Impact Area: San Francisco Oakland Fremont CA MSA Regional Impact Area ID: 9 Counties included Alameda/Contra Costa/Marin/San Francisco/San Mateo/ State Impact Area: California National Impact: Yes
The RED impact analysis was evaluated at three geographical levels: Local, State, and National for the 38-foot alternative. The local analysis represents the San Francisco to Stockton impact area. The State Level analysis includes the State of California. The National level includes the 48 contiguous United States.
Table 31 displays the overall spending profile that makes up the dispersion of the total project construction cost among the major industry sectors. The spending profile also identifies the geographical capture rate, also called Local Purchase Coefficient (LPC) in RECONS, of the cost components. The geographic capture rate is the portion of USACE spending on industries (sales) captured by industries located within the impact area. In many cases, IMPLAN’s trade flows Regional Purchase Coefficients (RPC’s) are utilized as a proxy to estimate where the money flows for each of the receiving industry sectors of the cost components within each of the impact areas.
Table 31: Input Assumptions (Spending and LPCs)
Category Spending (%)
Spending Amount
Local LPC (%)
State LPC (%)
National LPC (%)
Dredging Fuel 6% $3,623,400 85% 88% 90%
Metals and Steel Materials 4% $2,554,200 28% 55% 90%
Textiles, Lubricants, and Metal Valves and Parts (Dredging) 2% $1,247,400 13% 43% 65%
Pipeline Dredge Equipment and Repairs 5% $3,088,800 22% 51% 100%
Aggregate Materials 3% $1,722,600 61% 78% 97%
Switchgear and Switchboard Apparatus Equipment 0% $178,200 20% 42% 80%
San Francisco Bay to Stockton Navigation Improvement D-23

APPENDIX D: ECONOMIC ANALYSIS
Hopper Equipment and Repairs 2% $1,128,600 1% 10% 97%
Construction of Other New Nonresidential Structures 14% $8,078,400 100% 100% 100%
Industrial and Machinery Equipment Rental and Leasing 7% $4,336,200 75% 99% 100%
Planning, Environmental, Engineering and Design Studies and Services 5% $2,732,400 100% 100% 100%
USACE Overhead 7% $3,920,400 56% 60% 100%
Repair and Maintenance Construction Activities 4% $2,435,400 100% 100% 100%
Industrial Machinery and Equipment Repair and Maintenance 11% $6,237,000 73% 100% 100%
USACE Wages and Benefits 13% $7,900,200 75% 100% 100%
Private Sector Labor or Staff Augmentation 15% $9,088,200 100% 100% 100%
All Other Food Manufacturing 2% $1,128,600 29% 75% 90%
Total 100% $59,400,000 - - -
The USACE is planning on expending $59,400,000 on the project. Of this total project expenditure $44,268,102 will be captured within the regional impact area. The rest will be leaked out to the state or the nation. The expenditures made by the USACE for various services and products are expected to generate additional economic activity in that can be measured in jobs, income, sales and gross regional product as summarized in the following table and includes impacts to the region, the State impact area, and the Nation. Table 32 is the overall economic impacts for this analysis.
The labor income represents all forms of employment earnings. In IMPLAN’s regional economic model, it is the sum of employee compensation and proprietor income. The Gross Regional Product (GRP) which is also known as value added, is equal to gross industry output (i.e., sales or gross revenues The GRP, which is also known as value added, is equal to gross industry output (i.e., sales or gross revenues) less its intermediate inputs (i.e., the consumption of goods and services purchased from other U.S. industries or imported). The number of jobs equates to the labor income.
Table 32: Overall Summary Economic Impacts
Impact Areas Regional State National
Total Spending $59,400,000 $59,400,000 $59,400,000
San Francisco Bay to Stockton Navigation Improvement D-24

APPENDIX D: ECONOMIC ANALYSIS
Direct Impact
Output $44,268,102 $52,211,881 $58,090,611
Job 427.81 475.08 522.24
Labor Income $28,119,060 $32,385,718 $34,804,593
GRP $32,016,341 $37,382,072 $40,289,984
Total Impact
Output $82,613,168 $107,813,402 $154,629,362
Job 669.54 840.66 1,138.77
Labor Income $42,280,851 $51,368,682 $66,309,480
GRP $56,121,709 $70,500,608 $94,858,168
Tables 33, 34, and 35 present the economic impacts by industry sector both for each geographical region. Note that Labor -5001- is the largest impact area at the regional, state, and national levels, implying that all the labor demand can be met at the regional level.
Table 33: Economic Impact at Regional Level
IMPLAN No. Industry Sector Sales Jobs Labor
Income GRP
Direct Effects
115 Petroleum refineries $2,707,634 0.33 $99,239 $432,406
171 Steel product manufacturing from purchased steel $410,901 0.77 $110,719 $125,591
198 Valve and fittings other than plumbing manufacturing $33,492 0.10 $7,934 $16,300
201 Fabricated pipe and pipe fitting manufacturing $208,569 0.75 $57,810 $91,121
26 Mining and quarrying sand, gravel, clay, and ceramic and refractory minerals
$498,618 3.84 $180,080 $235,885
268 Switchgear and switchboard apparatus manufacturing $11,919 0.03 $4,409 $6,725
San Francisco Bay to Stockton Navigation Improvement D-25

APPENDIX D: ECONOMIC ANALYSIS
290 Ship building and repairing $5,320 0.02 $1,916 $2,278
319 Wholesale trade businesses $1,009,772 5.19 $475,337 $798,537
322 Retail Stores - Electronics and appliances $5,686 0.04 $3,165 $3,961
323 Retail Stores - Building material and garden supply $213,842 2.27 $107,766 $151,451
324 Retail Stores - Food and beverage $6,951 0.09 $3,732 $5,206
326 Retail Stores - Gasoline stations $63,723 0.37 $28,688 $45,740
332 Transport by air $3,376 0.01 $1,046 $1,731
333 Transport by rail $35,879 0.11 $11,120 $19,106
334 Transport by water $15,830 0.03 $4,927 $8,296
335 Transport by truck $617,407 5.45 $246,506 $308,797
337 Transport by pipeline $9,084 0.01 $6,440 $6,328
36 Construction of other new nonresidential structures $8,078,400 45.04 $3,656,742 $4,441,541
365 Commercial and industrial machinery and equipment rental and leasing
$3,255,137 10.30 $945,648 $1,869,909
375 Environmental and other technical consulting services $2,731,145 22.97 $1,982,938 $1,988,958
386 Business support services $2,179,582 31.51 $1,508,667 $1,494,821
39 Maintenance and repair construction of nonresidential structures
$2,424,543 14.89 $1,193,475 $1,456,532
417 Commercial and industrial machinery and equipment repair and maintenance
$4,524,807 32.67 $2,919,281 $3,446,328
439 * Employment and payroll only (federal govt, non-military) $5,925,150 40.55 $5,449,268 $5,925,150
5001 Labor $9,088,200 209.86 $9,088,200 $9,088,200
69 All other food manufacturing $203,133 0.61 $24,006 $45,442
Total Direct Effects $44,268,102 427.81 $28,119,060 $32,016,341
Secondary Effects $38,345,066 241.73 $14,161,791 $24,105,369
San Francisco Bay to Stockton Navigation Improvement D-26

APPENDIX D: ECONOMIC ANALYSIS
Total Effects $82,613,168 669.54 $42,280,851 $56,121,709
Table 34: Economic Impact at State Level
IMPLAN No. Industry Sector Sales Jobs Labor
Income GRP
Direct Effects
115 Petroleum refineries $2,707,634 0.33 $99,239 $432,406
171 Steel product manufacturing from purchased steel $1,001,381 2.01 $269,827 $306,071
198 Valve and fittings other than plumbing manufacturing $368,436 1.14 $94,376 $184,086
201 Fabricated pipe and pipe fitting manufacturing $943,202 3.57 $261,430 $412,071
26 Mining and quarrying sand, gravel, clay, and ceramic and refractory minerals
$588,450 4.53 $220,503 $284,882
268 Switchgear and switchboard apparatus manufacturing $45,043 0.13 $16,663 $25,415
290 Ship building and repairing $94,511 0.39 $34,032 $40,470
319 Wholesale trade businesses $1,362,370 7.11 $641,318 $1,077,374
322 Retail Stores - Electronics and appliances $5,688 0.04 $3,167 $3,963
323 Retail Stores - Building material and garden supply $268,755 2.88 $135,439 $190,342
324 Retail Stores - Food and beverage $7,880 0.11 $4,230 $5,901
326 Retail Stores - Gasoline stations $97,292 0.57 $43,801 $69,836
332 Transport by air $3,376 0.01 $1,046 $1,731
333 Transport by rail $54,167 0.16 $16,932 $28,943
334 Transport by water $15,830 0.03 $4,927 $8,296
335 Transport by truck $839,182 7.41 $347,047 $429,699
337 Transport by pipeline $18,843 0.02 $13,358 $13,126
San Francisco Bay to Stockton Navigation Improvement D-27

APPENDIX D: ECONOMIC ANALYSIS
36 Construction of other new nonresidential structures $8,078,400 45.04 $3,656,742 $4,441,541
365 Commercial and industrial machinery and equipment rental and leasing
$4,289,115 13.71 $1,246,029 $2,463,877
375 Environmental and other technical consulting services $2,731,145 22.97 $1,982,938 $1,988,958
386 Business support services $2,355,222 34.27 $1,630,242 $1,615,280
39 Maintenance and repair construction of nonresidential structures
$2,431,824 14.94 $1,197,059 $1,460,906
417 Commercial and industrial machinery and equipment repair and maintenance
$6,237,000 46.02 $4,023,941 $4,750,423
439 * Employment and payroll only (federal govt, non-military) $7,897,222 55.79 $7,262,952 $7,897,223
5001 Labor $9,088,200 209.86 $9,088,200 $9,088,200
69 All other food manufacturing $681,711 2.05 $90,279 $161,053
Total Direct Effects $52,211,881 475.08 $32,385,718 $37,382,072
Secondary Effects $55,601,521 365.58 $18,982,964 $33,118,536
Total Effects $107,813,402 840.66 $51,368,682 $70,500,608
Table 35: Economic Impact at National Level
IMPLAN No. Industry Sector Sales Jobs Labor
Income GRP
Direct Effects
115 Petroleum refineries $2,713,009 0.34 $99,456 $433,390
171 Steel product manufacturing from purchased steel $1,850,195 3.85 $498,544 $565,509
198 Valve and fittings other than plumbing manufacturing $639,659 2.05 $164,374 $319,951
201 Fabricated pipe and pipe fitting manufacturing $2,439,379 9.31 $676,130 $1,065,729
San Francisco Bay to Stockton Navigation Improvement D-28

APPENDIX D: ECONOMIC ANALYSIS
26 Mining and quarrying sand, gravel, clay, and ceramic and refractory minerals
$850,897 6.55 $342,362 $432,370
268 Switchgear and switchboard apparatus manufacturing $111,418 0.33 $41,218 $62,867
290 Ship building and repairing $1,079,692 4.50 $388,778 $462,330
319 Wholesale trade businesses $1,380,842 7.24 $650,014 $1,091,982
322 Retail Stores - Electronics and appliances $5,702 0.04 $3,175 $3,973
323 Retail Stores - Building material and garden supply $318,908 3.55 $160,713 $225,862
324 Retail Stores - Food and beverage $7,900 0.11 $4,241 $5,917
326 Retail Stores - Gasoline stations $97,830 0.81 $44,043 $70,221
332 Transport by air $3,453 0.01 $1,070 $1,770
333 Transport by rail $70,455 0.21 $22,158 $37,786
334 Transport by water $19,836 0.04 $6,175 $10,395
335 Transport by truck $890,082 7.86 $370,123 $457,447
337 Transport by pipeline $39,844 0.05 $28,246 $27,755
36 Construction of other new nonresidential structures $8,078,400 45.04 $3,656,742 $4,441,541
365 Commercial and industrial machinery and equipment rental and leasing
$4,329,865 13.91 $1,257,867 $2,487,286
375 Environmental and other technical consulting services $2,732,038 22.97 $1,983,586 $1,989,608
386 Business support services $3,919,162 62.01 $2,712,774 $2,687,876
39 Maintenance and repair construction of nonresidential structures
$2,434,706 14.97 $1,198,478 $1,462,638
417 Commercial and industrial machinery and equipment repair and maintenance
$6,237,000 48.25 $4,023,941 $4,750,423
439 * Employment and payroll only (federal govt, non-military) $7,900,199 55.82 $7,265,690 $7,900,200
San Francisco Bay to Stockton Navigation Improvement D-29

APPENDIX D: ECONOMIC ANALYSIS
5001 Labor $9,088,200 209.86 $9,088,200 $9,088,200
69 All other food manufacturing $851,941 2.56 $116,499 $206,959
Total Direct Effects $58,090,611 522.24 $34,804,593 $40,289,984
Secondary Effects $96,538,751 616.54 $31,504,887 $54,568,184
Total Effects $154,629,362 1,138.77 $66,309,480 $94,858,168
Total San Francisco to Stockton Navigation Project economic impact for the State of California (Table 34) is composed of $107,813,402 in sales, approximately 840 jobs, $51.4 million in labor income and a contribution of $70 million to GRP.
Table 36 represents the demographic data of the impact region. In 2008, the combined metropolitan impact area of San Francisco to Stockton had a population of 4,354,010 with an area of 2,532 square miles and a total personal income of $259 billion.
Table 36: Impact Region Definition (2008)
Regional Impact Area ID: 9 Regional Impact Area Name: San Francisco Oakland Fremont CA MSA Impact Area Type Metropolitan Impact Area State Impact Region:: California
County FIPS Area (sq. mi) Population Households Total Personal Income (in millions)
Alameda 06001 744 1,516,873 544,601 $71,596 Contra Costa 06013 760 1,063,951 377,174 $59,044 Marin 06041 525 256,201 104,325 $22,352 San Francisco 06075 47 787,580 335,420 $56,037 San Mateo 06081 455 729,405 260,698 $50,014 Total 2,532 4,354,010 1,622,218 $259,043
Table 37 shows the impact region for 19 selected sectors. It displays the geographical capture amounts for the San Francisco-Oakland-Fremont MSA, which is that portion of USACE spending that is captured in the impact area. The labor income represents all forms of employment earnings (in IMPLAN’s regional economic model, it is the sum of
San Francisco Bay to Stockton Navigation Improvement D-30

APPENDIX D: ECONOMIC ANALYSIS
employee compensation and proprietor income). The GRP is equal to gross industry output (i.e., sales or gross revenues) less its intermediate inputs (i.e., the consumption of goods and services purchased from other U.S. industries or imported). The number of jobs equates to the labor income. The total San Francisco-Oakland-Fremont MSA is composed of $590 billion in output (sales), $2.9 million employment, $201 billion in labor income and a contribution of $313 billion to GRP.
Table 37: Impact Region Definition (2008)
Regional Impact Area ID: 9 Regional Impact Area Name: San Francisco Oakland Fremont CA MSA Impact Area Type Metropolitan Impact Area State Impact Region:: California
Section Output (millions)
Labor Income (millions)
GRP (millions) Employment
Accommodations and Food Service $14,797 $5,490 $8,522 195,211 Administrative and Waste Management Services $14,548 $7,545 $9,792 166,043
Agriculture, Forestry, Fishing and Hunting $678 $219 $294 5,302 Arts, Entertainment, and Recreation $6,282 $2,423 $3,549 76,937 Construction $26,668 $12,197 $13,381 159,427 Education $12,107 $9,351 $10,535 178,454 Finance, Insurance, Real Estate, Rental and Leasing $87,689 $26,962 $56,871 352,878
Government $26,298 $19,428 $21,541 211,725 Health Care and Social Assistance $26,228 $15,005 $17,653 228,988 Imputed Rents $41,484 $5,238 $27,170 176,251 Information $41,511 $9,514 $19,542 81,536 Management of Companies and Enterprises $13,582 $6,721 $8,997 45,963
Manufacturing $137,230 $16,610 $25,925 144,824 Mining $2,572 $627 $1,570 4,214 Professional, Scientific, and Technical Services $69,247 $37,306 $43,692 401,095
Retail Trade $25,945 $10,851 $18,003 279,566 Transportation and Warehousing $13,926 $5,583 $7,810 85,982 Utilities $9,295 $1,761 $5,190 9,097 Wholesale Trade $20,129 $7,722 $13,239 88,779 Total $590,215 $200,553 $313,277 2,892,273
The following tables shows the top ten industries that typically benefit from the types of expenditures made for this project by the USACE. This analysis was conducted at the
San Francisco Bay to Stockton Navigation Improvement D-31

APPENDIX D: ECONOMIC ANALYSIS
national level and thus it cannot be guaranteed that these industries would be present in the regional impact area as analyzed.
Table 38: Top Ten Industries Affected by Work Activity (2008)
Project: San Francisco to Stockton Navigation Project Business Line: Navigation Work Activity: CWB - Navigation
Rank Industry (millions)
IMPLAN No.
% of Total Employment
1 * Employment and payroll only (federal govt, non-military) 439 8 %
2 Business support services 386 7 % 3 Construction of other new nonresidential structures 36 6 % 4 Food services and drinking places 413 5 %
5 Commercial and industrial machinery and equipment repair and maintenance 417 4 %
6 Real estate establishments 360 3 % 7 Wholesale trade businesses 319 3 % 8 Employment services 382 3 %
9 Maintenance and repair construction of nonresidential structures 39 3 %
10 Offices of physicians, dentists, and other health practitioners 394 2 %
43 %
San Francisco Bay to Stockton Navigation Improvement D-32