Embed Size (px)
Citation preview

Technology Integration 2017 Annual Progress Report
Vehicle Technologies Office

(This page intentionally left blank)

FY 2017 Annual Progress Report
Disclaimer i
Disclaimer This report was prepared as an account of work sponsored by an agency of the Unites States government. Neither the United States government nor any agency thereof, nor any of their employees, makes any warranty, expressed or implied, or assumes any legal liability or responsibility for the accuracy, completeness, or usefulness of any information, apparatus, product, or process disclosed, or represents that its use would not infringe privately owned rights. Reference herein to any specific commercial product, process, or service by trade name, trademark, manufacturer, or otherwise does not necessarily constitute or imply its endorsement, recommendation, or favoring by the Unites States government or any agency thereof. The views and opinions of authors expressed herein do not necessarily state or reflect those of the United States government or any agency thereof.

Technology Integration
ii Acknowledgements
Acknowledgements We would like to acknowledge the principal investigators and their teams from industry, academia, the national laboratories, and Clean Cities coalitions who prepared the project abstracts. In addition, we would like to thank the project managers at the National Energy Technology Laboratory for their continuing support in administering these projects. We would also like to express our appreciation to Allegheny Science and Technology (AST) for their technical support in preparing, editing, compiling, and publishing the 2017 Technology Integration Annual Progress Report.

FY 2017 Annual Progress Report
Acronyms iii
Acronyms 3D Three Dimensional AAA American Automobile Association AAPEX Automotive Aftermarket Products Expo ACT Expo Advanced Clean Transportation Expo ADAS Advanced Driver Assistance Systems AFDC Alternative Fuels Data Center AFLEET Tool Alternative Fuel Life-Cycle Environmental and Economic Transportation Tool AFPR Alternative Fuel Price Report AFV Alternative Fuel Vehicle AHJ Authority Having Jurisdiction ANL Argonne National Laboratory ANSI American National Standards Institute API Application Programming Interface ASME American Society of Mechanical Engineers ASU Arizona State University AVTC Advanced Vehicle Technology Competition BEV Battery Electric Vehicle BMV Bureau of Motor Vehicles CARB California Air Resources Board CAV Connected and Automated Vehicles CDC Community Development Corporation CFO Clean Fuels Ohio CH2 Compressed Hydrogen CMAQ Congestion Mitigation and Air Quality CNG Compressed Natural Gas COG Council of Governments CSULA California State University Los Angeles CSU Colorado State University CTS Contract Transportation Services CVEF Clean Vehicle Education Foundation DC Direct Current DCFC Direct Current Fast Charger DOE Department of Energy DOER Department of Energy Resources DOT Department of Transportation E&EC Emissions and Energy Consumption EEMS Energy Efficient Mobility Systems EERE Energy Efficiency and Renewable Energy EIA Energy Information Administration EISA Energy Independence and Security Act of 2007 EMS Emergency Medical Services EOP Emergency Operations Plan EPA Environmental Protection Agency EPAct Energy Policy Act of 1992 ERAU Embry Riddle Aeronautical University EV Electric Vehicle EVI-Pro Electric Vehicle Infrastructure Projection EVSE Electric Vehicle Supply Equipment

Technology Integration
iv Acronyms
F4F Fleets for the Future FAST Act Fixing America’s Surface Transportation Act FCDICE Fire College Department of Insurance Continuing Education System FDAC OOE Florida Department of Agriculture and Consumer Services, Office of Energy FEI Fuel Economy Information FHWA Federal Highway Administration FOA Funding Opportunity Announcement FPRF Fire Protection Research Foundation FY Fiscal Year GHG Greenhouse Gas GIS Geographic Information System GM General Motors GNA Gladstein, Neandross & Associates GPO Government Publishing Office GREET Greenhouse gases, Regulated Emissions, and Energy use in Transportation GT Georgie Tech GTI Gas Technology Institute H2 Hydrogen HDV Heavy Duty Vehicle HESS Hybrid Energy Storage System HEV Hybrid-electric Vehicle IAAI International Association of Arson Investigators IACP International Association of Chiefs of Police IAEM International Association of Emergency Managers IAFC International Association of Fire Chiefs IAFF International Association of Fire Fighters ICC International Code Council IEEE Institute of Electrical and Electronics Engineers IFMA International Fire Marshals Association INCOG Indian Nations Council of Governments INL Idaho National Laboratory iREV Initiative for Resiliency in Energy through Vehicles KFRTI Kansas Fire & Rescue Training Institute kWh Kilowatt Hour L2 Level 2 LDV Light Duty Vehicle LNG Liquefied Natural Gas LPG Liquefied Petroleum Gas (Propane) M2M Michigan to Montana MAC McMaster University MACC Massachusetts Clean Cities MAPC Metropolitan Area Planning Council MARC Mid-America Regional Council MEC Metropolitan Energy Center MidwestEVOLVE Midwest Electric Vehicle Opportunities: Learning eVents, Experience MOVES Motor Vehicle Emission Simulator MPG Miles Per Gallon MPH Miles per hour MSADA Massachusetts State Auto Dealers Association MSU Mississippi State University MWCOG Metropolitan Washington Council of Governments
FY 2017 Annual Progress Report
Acronyms v
MY Model Year NACAA National Association of Clean Air Agencies NAFTC National Alternative Fuels Training Consortium NAFTD North American Fire Training Directors NAFTD North American Fire Training Directors NARC National Association of Regional Councils NASA National Aeronautics and Space Administration NASEO National Association of State Energy Officials NASFM National Association of State Fire Marshals NASPO National Association of State Procurement Officers NATA North American Towing Academy NBB National Biodiesel Board NCCETC North Carolina Clean Energy Technology Center NCTCOG North Central Texas Council of Governments NDA Non-Disclosure Agreement NDEW National Drive Electric Week NESCAUM Northeast States for Coordinated Air Use Management NFPA National Fire Protection Association NGA National Governors Association NGV Natural Gas Vehicle NHTSA National Highway Traffic Safety Administration NJPA National Joint Powers Alliance NOx Oxides of Nitrogen NREL National Renewable Energy Laboratory NSA National Sheriffs Association NTEA National Truck Equipment Association NVFC National Volunteer Fire Council NYCDOT New York City Department of Transportation NYSP New York State Policy OEM Original Equipment Manufacturer ORNL Oak Ridge National Laboratory OSU Ohio State University PAG Pima Association of Governments PDF Portable Document Format PEV Plug-in Electric Vehicle PG&E Pacific Gas and Electric PGE Portland General Electric PHEV Plug-in Hybrid Electric Vehicle PI Principal Investigator PIA Plug In America PMP Performance Metrics Plan PSU Pennsylvania State University PY Project Year R&D Research and Development RAQC Regional Air Quality Council RFI Request for Information RFP Request for Proposals RNG Renewable Natural Gas SADI Southeast Alternative Fuel Vehicle Demonstration Initiative SAE Society of Automotive Engineers SAF-D Safe Alternative Fuels Deployments in Mid-America

Technology Integration
vi Acronyms
SCORM Shareable Content Object Reference Model SCOS Smart Columbus Operating System SEMA Specialty Equipment Market Association SFP State and Fuel Providers SLC Salt Lake City SMART Systems and Modeling for Accelerated Research in Transportation SME Subject Matter Expert SOPO Statement of Project Objectives SOx Sulfur Oxides STEM Science Technology Engineering and Mathematics TA Technical Assistance TBD To Be Determined TC4 Twin Cities Clean Cities Coalition TCO Total Cost of Ownership TIC Technologist in Cities TJCOG Triangle J Council of Governments TRAA Tow and Recovery Association of America TRS Technical Response Service UA University of Alabama UCCC Utah Clean Cities Coalition UCF University of Central Florida UF Utility Factor USFA United States Fire Administration USU Utah State University UT University of Tennessee, Knoxville UU University of Utah UW University of Washington UWAFT University of Waterloo Alternative Fuels Team VADA Vermont Vehicle and Automotive Distributors Association VCC Virginia Clean Cities VEIC Vermont Energy Investment Corporation VT Virginia Tech VTO Vehicle Technologies Office VW Volkswagen WSU Wayne State University WTW Well to Wheels WVU West Virginia University ZEV Zero Emission Vehicle

FY 2017 Annual Progress Report
Executive Summary vii
Executive Summary The 2017 Technology Integration Annual Progress Report covers 27 multi-year projects funded by the Vehicle Technologies Office. The report includes information on 20 competitively awarded projects, ranging from training on alternative fuels and vehicles for first responders, to safety training and design for maintenance facilities housing gaseous fuel vehicles, to electric vehicle community partner programs. It also includes seven projects conducted by several of VTO’s national laboratory partners, Argonne National Laboratory, Oak Ridge National Laboratory and the National Renewable Energy Laboratory. These projects range from a Technical Assistance project for business, industry, government and individuals, to the EcoCar 3 Student Competition, and the Fuel Economy Information Project. The projects involve partnerships between private industry, the public sector and, in many cases, non-profit organizations, and incorporate an educational component designed to enable the sharing of best practices and lessons learned. Data collected from these projects is used to inform the future direction of VTO-funded research.

Technology Integration
viii Table of Contents
Table of Contents Acknowledgements ........................................................................................................................................... ii
Acronyms ............................................................................................................................................................ iii
Executive Summary ......................................................................................................................................... vii
Vehicle Technologies Office Overview ............................................................................................................ 1 Vehicle Technologies Office Organization Chart .................................................................................. 1
Technology Integration Program Overview .................................................................................................... 2 Introduction ............................................................................................................................................ 2 Goals ....................................................................................................................................................... 2 Program Organization Matrix ................................................................................................................. 2
I. Alternative Fuel Vehicle Initiatives ........................................................................................................... 4 I.1 Alternative Fuel Vehicle Curriculum Development and Outreach Initiative (National
Alternative Fuels Training Consortium) ......................................................................................... 4 I.2 Southeast AFV Demonstration Initiative (SADI) ........................................................................... 7 I.3 Creating an Alternative Fuel Training Network for Florida (University of Central Florida) ....... 11 I.4 Nationwide Alternative Fuel Vehicle (AFV) Emergency Responder, Recovery,
Reconstruction and Investigation Training (National Fire Protection Association) ..................... 16 I.5 Initiative for Resiliency in Energy through Vehicles (iREV) (National Association of State
Energy Officials) .......................................................................................................................... 22 I.6 Alternative Fuel Vehicle Demonstration and Enhanced Driver Experience (Penske Truck
Leasing Co., L.P.) ......................................................................................................................... 27 I.7 Safe Alternative Fuels Deployments in Mid-America (SAF-D): A Combined AFV and Fire
and Rescue Training Initiative (Metropolitan Energy Center) ..................................................... 32 I.8 Plug-In Hybrid Electric Vehicle Demonstration Program and Social Media Campaign (ASG
Renaissance) ................................................................................................................................. 37 I.9 Filling Critical Gaps through Innovative Cradle-to-Grave Training (North Central Texas
Council of Governments) ............................................................................................................. 44 I.10 Midwest D.R.I.V.E.S. Initiative: Demonstrating Reliable Innovative Vehicle Energy
Solutions (Clean Fuels Ohio) ....................................................................................................... 49 I.11 Drive Electric Orlando (Florida Department of Agriculture and Consumer Services, Office
of Energy) ..................................................................................................................................... 56 I.12 Aggregated Alternative Technology Alliance (National Association of Regional Councils) ...... 61 I.13 AFV Aggregated Purchasing Initiative: Increasing Nationwide ZEV Adoption - Enhanced
Joint Procurement Process for Public Fleets (CALSTART) ........................................................ 67 I.14 Midwest Electric Vehicle Opportunities: Learning eVents, Experience (MidwestEVOLVE)
(American Lung Association in Minnesota) ................................................................................. 71 I.15 Northwest Electric Showcase Project (Forth, formerly Drive Oregon) ........................................ 75 I.16 Accelerating PEV Adoption in New England (Plug In America) ................................................ 79 I.17 Safety Training and Design, Permitting and Operational Guidance for Garage Facilities
Maintaining and Parking Natural Gas, Propane and Hydrogen Vehicles (Marathon Technical Services USA, Inc.) ...................................................................................................................... 87

FY 2017 Annual Progress Report
Table of Contents ix
I.18 Training For Cost-Effective, Code-Compliant, Maintenance Facilities for Gaseous Fuel Vehicles (Gas Technology Institute) ............................................................................................ 91
I.19 U.S. Fuels Across America’s Highways - Michigan to Montana (M2M) (Gas Technology Institute) ..................................................................................................................................... 94
I.20 WestSmart EV: Western Smart Plug-in Electric Vehicle Community Partnership (PacifiCorp). 98
II. National Laboratory Projects ................................................................................................................ 103 II.1 Alternative Fuels Data Center (National Renewable Energy Laboratory) ................................. 103 II.2 AFLEET Tool (Argonne National Laboratory) .......................................................................... 111 II.3 EcoCAR 3 Advanced Vehicle Technology Competition (Argonne National Laboratory) ........ 114 II.4 Fuel Economy Information Project (Oak Ridge National Laboratory) ...................................... 122 II.5 EPAct Regulatory Programs (National Renewable Energy Laboratory) ................................... 130 II.6 Technical Assistance/Technical Response Service (National Renewable Energy Laboratory) . 132 II.7 Technologist-in-Cities (National Renewable Energy Laboratory) ............................................. 139

Technology Integration
x List of Tables
List of Figures Figure I.3.1: Map of fire departments with NAFTC trained instructors ..................................................... 13
Figure I.3.2: Workforce Board engagement strategy .................................................................................. 15
Figure I.4.1: Filming hybrid-electric vehicle accident scene recreation for accident investigation team training program ..................................................................................................................... 16
Figure I.4.2: EV display at debut of Fire Service classroom training, NFPA Conference & Expo 2016, Las Vegas, NV ............................................................................................................. 17
Figure I.4.3: Fire Service AFV Safety train-the-trainer classroom training, Alameda County, CA ........... 18
Figure I.4.4: PowerPoint slide from AFV Safety classroom training course on medium & heavy duty CNG vehicles ......................................................................................................................... 19
Figure I.4.5: PowerPoint presentation for AFV Safety training for fire investigators ................................ 20
Figure I.5.1: iREV Tracking Tool ............................................................................................................... 24
Figure I.6.1: CNG Vehicle Rental Program Participant Handbook for Neenah, WI (Source: Penske Truck Leasing Co., L.P.) ........................................................................................................ 29
Figure I.7.1: Cover and excerpts from classroom course Instructor Guide (University of Kansas, Kansas Fire and Rescue Training Institute) ........................................................................... 33
Figure I.7.2: PowerPoint slides for Incident Response Module, Lesson 2 and Lesson 3 (University of Kansas, Kansas Fire and Rescue Training Institute) .............................................................. 34
Figure I.7.3: Jeremy Moore, co-founder of FS Circle Solutions, giving instruction during the Kansas pilot training session to KFRTI instructors and fire fighters, and to the project team. (Photo credit: David Albrecht) ............................................................................................... 35
Figure I.9.1: Marketing and promotion of trainings ................................................................................... 45
Figure I.9.2: Recommendations .................................................................................................................. 46
Figure I.11.1: Drive Electric Orlando volunteer partners ........................................................................... 57
Figure I.11.2: 2018 Chevrolet Volt ............................................................................................................. 58
Figure I.11.3: Drive Electric Orlando brochure .......................................................................................... 59
Figure I.13.1: Fleet survey respondents by state ......................................................................................... 68
Figure I.13.2: Reasons for interest in EVs .................................................................................................. 68
Figure I.15.1: EV 101 flier (Produced by Forth/Brink) .............................................................................. 77
Figure I.16.1: Dealer salesperson knowledge self-assessment findings (Plug In America 2017) .............. 85
Figure I.18.1: A typical alarm system indicator (Clean Energy Fuels)....................................................... 93
Figure I.19.1: Existing stations on M2M corridor (blue – DCFC, red – propane, green – CNG) .............. 96
Figure I.20.1: WestSmart EV three-year project implementation plan....................................................... 99

FY 2017 Annual Progress Report
Table of Contents xi
Figure I.20.2: WestSmart EV major task diagram .................................................................................... 100
Figure II.1.1: Sources of visits to the AFDC ............................................................................................ 106
Figure II.1.2: Interest in alternative fuel information by subject (page views) in FY17........................... 107
Figure II.1.3: Interest in Alternative Fuel Station Locator information by subject (page views) in FY17 ................................................................................................................................... 107
Figure II.1.4: Alternative Fuel Station Locator mobile app usage after Android launch in May 2017 .... 109
Figure II.1.5: Growth of station data API hits .......................................................................................... 110
Figure II.3.1: Emissions and energy consumption event testing results from EcoCAR 3 Year 3 competition ......................................................................................................................... 118
Figure II.4.1: Traffic on FuelEconomy.gov has grown steadily after its launch in 1999, peaking in 2013 when fuel prices were high. ....................................................................................... 127
Figure II.7.1: A heat map of existing trip destinations from industry probe data, nicknamed "Columbus Fire" ................................................................................................................. 141

Technology Integration
xii List of Tables
List of Tables Table I.3.1: Roster of Fire Departments with Trained Instructors by County and Coalition Region ......... 14
Table I.4.1: Classroom Training Locations ................................................................................................ 20
Table I.6.1: Freightliner Cascadia 113” Specifications .............................................................................. 27
Table I.6.2: Project Milestones and Descriptions with Anticipated and Actual Completion Dates ........... 30
Table I.8.1: Year 1 Program Metrics .......................................................................................................... 40
Table I.8.2: Year 2 Program Metrics .......................................................................................................... 40
Table I.8.3: Overall Program Metrics 2015-2017 ....................................................................................... 41
Table I.8.4: Total Content Pieces ................................................................................................................ 41
Table I.8.5: Total Program Reach ............................................................................................................... 42
Table I.8.6: Total Program Views ............................................................................................................... 42
Table I.8.7: Total Program Engagement ..................................................................................................... 42
Table I.9.1: Training Evaluation Response Summary ................................................................................ 47
Table I.10.1: Targeted Market Segments and Vehicle Duty Types ............................................................ 50
Table I.10.2: Vehicle Providers, Fuel Types, Vehicle Models and Duty Types ......................................... 51
Table I.10.3: Midwest DRIVES Vehicle Demonstrations .......................................................................... 52
Table I.11.1: Cumulative EV Utilization Rates for Fiscal Year 2017 ........................................................ 60
Table I.13.1: Elements of Potential Solicitation for a Multi-state EV Agreement ..................................... 69
Table I.15.1: FY 2017 Regional Ride and Drive Events ............................................................................ 78
Table I.16.1: Distribution of PEV Showcase Events by Project Partner (Plan versus Actual) ................... 82
Table I.16.2: Workplace Test Drive Results ............................................................................................... 82
Table I.16.3: Workplace Survey Results .................................................................................................... 83
Table II.1.1: Top Referrers to the AFDC Website in 2017 ....................................................................... 106
Table II.1.2: Primary AFDC Tools in FY17 - Usage and Audience Segment .......................................... 108
Table II.3.1: EcoCAR 3 Year 3 Vehicle Milestone Results ..................................................................... 117
Table II.3.2: Number of Teams Attempting and Completing Competition Testing Events ..................... 117
Table II.3.3: Students Graduating from EcoCAR 3 Universities, FY17, by Discipline ........................... 118
Table II.3.4: EcoCAR 3 Social Media Results ......................................................................................... 119
Table II.3.5: EcoCAR 3 Team Publications in FY2017 ........................................................................... 119

FY 2017 Annual Progress Report
(This page intentionally left blank)


FY 2017 Annual Progress Report
Vehicle Technologies Office Overview 1
Vehicle Technologies Office Overview Vehicles move our nation. Vehicles transport more than $36 billion worth of goods each day1 and move people more than 3 trillion vehicle-miles each year2. Growing our national economy requires transportation and transportation requires energy. The average U.S. household spends nearly one-fifth of its total family expenditures on transportation3, making transportation the most expensive spending category after housing. The transportation sector accounts for 70% of U.S. petroleum use. The United States imports 25% of the petroleum consumed – sending more than $10 billon per month4 overseas for crude oil. To strengthen national security, enable future economic growth, and increase transportation energy efficiency, the Vehicle Technologies Office (VTO) funds early-stage, high-risk research on innovative vehicle and transportation technologies. VTO leverages the unique capabilities and world-class expertise of the national laboratory system to develop innovations in electrification, advanced combustion engines and fuels, advanced materials, and energy efficient mobility systems. VTO is uniquely positioned to address early-stage challenges due to strategic public-private research partnerships with industry (e.g. U.S. DRIVE, 21st Century Truck Partnership). These partnerships leverage relevant expertise to prevent duplication of effort, focus DOE research on critical R&D barriers, and accelerate progress. VTO focuses on research that industry does not have the technical capability to undertake on its own, usually due to a high degree of scientific or technical uncertainty, or it is too far from market realization to merit industry resources. VTO’s research generates knowledge that industry can advance to deploy innovative energy technologies to support affordable, secure, and efficient transportation systems across America. Vehicle Technologies Office Organization Chart
1 https://ops.fhwa.dot.gov/publications/fhwahop16083/ch1.htm#t1 2 https://www.fhwa.dot.gov/policyinformation/statistics/2015/vm1.cfm 3 https://www.fhwa.dot.gov/policyinformation/statistics/2015/vm1.cfm 4 https://www.bls.gov/cex/2015/standard/multiyr.pdf
Technology Integration
2 Technology Integration Program Overview
Technology Integration Program Overview Introduction VTO's Technology Integration Program supports a broad technology portfolio that includes alternative fuels, energy efficient mobility systems and technologies, and other efficient advanced technologies that can reduce transportation energy costs for businesses and consumers. The program provides objective, unbiased data and real-world lessons learned to inform future research needs and support local decision making. It also includes projects to disseminate data, information, and insight, as well as online tools and technology assistance to cities and regions working to implement alternative fuels and energy efficient mobility technologies and systems. Goals The Technology Integration Program’s goals are to strengthen national security through fuel diversity and the use of domestic fuel sources, reduce transportation energy costs for businesses and consumers, and enable energy resiliency with affordable alternatives to conventional fuels that may face unusually high demand in emergency situations. Program Organization Matrix The Technology Integration Program’s activities can be broken out into several distinct areas: Technology Integration Tools and Resources • The Alternative Fuels Data Center provides information, data and tools to help transportation decision
makers find ways to reduce cost and improve energy efficiency.
• FuelEconomy.gov provides access to general information, widgets to help car buyers, and comprehensive fuel economy data.
• Energy Efficient Mobility Systems (EEMS) envisions an affordable, efficient, safe, and accessible transportation future in which mobility is decoupled from energy consumption.
• The Clean Cities Coalition Network supports the nation’s energy and economic security by building partnerships to advance affordable, domestic transportation fuels and technologies. The Technology Integration Program assists this network of nearly 100 coalitions nationwide through its tools and resources.
Advanced Vehicle Technology Competitions For more than 25 years, the Vehicle Technologies Office has sponsored advanced vehicle technology competitions (AVTCs) in partnership with the North American auto industry to educate and develop the next generation of automotive engineers. VTO's advanced vehicle technology competitions provide hands-on, real-world experience, and focus on science, technology, engineering, and math, to support the development of a workforce trained in advanced vehicle technologies. Launched in 2014, EcoCAR 3 is the latest iteration of the advanced vehicle technology competitions. EcoCAR 3 challenges 16 teams from North American universities to redesign the Chevrolet Camaro into a hybrid-electric car that will increase fuel efficiency, while maintaining the muscle and performance expected from this iconic American car. These teams are tasked to incorporate innovative ideas, solve complex engineering challenges, and apply the latest cutting-edge technologies. Teams have four years (2014-2018) to harness those ideas into the ultimate
FY 2017 Annual Progress Report
Technology Integration Program Overview 3
energy-efficient, high performance vehicle. The Camaro will keep its familiar body design, while student teams develop and integrate energy innovations that maximize performance, while retaining the safety and high consumer standards of the Camaro. Alternative Fuels Regulatory Activity The Alternative Fuels Regulatory activity provides technical and analytical support for the implementation of federal legislation related to the deployment of alternative fuels and fuel-efficient fleet vehicles. Relevant legislation includes the Energy Policy Act (EPAct) of 1992, EPAct 2005, the Energy Conservation Reauthorization Act of 1998, the Energy Independence and Security Act (EISA) of 2007, and other amendments to EPAct. EPAct regulated fleets include State & Alternative Fuel Provider Fleets and Federal Fleets (managed by the Federal Energy Management Program).

Technology Integration
4 Alternative Fuel Vehicle Initiatives
I. Alternative Fuel Vehicle Initiatives I.1 Alternative Fuel Vehicle Curriculum Development and Outreach Initiative
(National Alternative Fuels Training Consortium)
Micheal Smyth, Principal Investigator West Virginia University Research Corporation, National Alternative Fuels Training Consortium PO Box 6704, West Virginia University, Morgantown WV, 26506-6704 Phone: (304) 293-7882 E-mail: [email protected] Dennis Smith, Technology Manager U.S. Department of Energy Phone: (202) 586-1791 E-mail: [email protected] Start Date: June 1, 2015 End Date: May 31, 2018 Total Project Cost: $1,001,511 DOE share: $800,000 Non-DOE share: $201,511
Project Introduction For the Alternative Fuel Vehicle Curriculum Development and Outreach Initiative project, the National Alternative Fuels Training Consortium (NAFTC) will develop curricula and conduct training related to alternative fuel and advanced technology vehicles, for a wide range of individuals and organizations. This project focuses on developing training materials that do not yet exist in critical areas, such as for towing and recycling operators, and vehicle repair facilities. In addition to the educational materials, the NAFTC will conduct marketing and outreach activities to promote this training, specifically, and greater AFV adoption, in general. Through online courses and train-the-trainer workshops, the project will have a national impact and establish resources and materials that will last beyond the project’s completion date.
Objectives The Alternative Fuel Vehicle Curriculum Development and Outreach Initiative project’s main objectives are to: • Develop curricula and conduct alternative fuel vehicle (AFV) and electric vehicle (EV) training,
covering underserved (and critical) areas: o collision repair o fueling, repair, maintenance and conversion facilities o online training for towing and roadside assistance personnel o online training for automotive recycling personnel
• Market and promote the dissemination of project-related curricula and training materials, while leveraging existing resources.
Approach The NAFTC uses an award-winning and industry-endorsed curriculum development process. This process includes working closely with the US DOE, content experts and project partners to define the purpose, scope, objectives, and expectations for project curricula. The NAFTC uses the information garnered from this process to create topical and detailed outlines, and to research and create course content. Following the development of these initial documents, the NAFTC develops materials for use with the instructor’s manual, including presentations, lesson plans, practical exercises, learning activities, and review questions.

FY 2017 Annual Progress Report
Alternative Fuel Vehicle Initiatives 5
Draft materials go through an internal (alpha) review process, then NAFTC recruits subject matter experts and incorporates their recommendations in the materials. NAFTC’s national trainer conducts beta testing with selected audiences; the data, feedback, and comments from these trainings will be used to make further revisions. NAFTC will create the final draft of the instructor’s manual and participant’s manual/booklets, for use with each classroom curricula. This curriculum development process will be followed for the above-listed classroom curricula. Online course development will build upon the classroom curriculum development process by leveraging materials that have been/will be developed for the classroom curricula. These leveraged materials will be used to develop online training utilizing a SCORM-compliant approach. NAFTC develops the marketing and outreach materials with the oversight of a national advisory committee, then creates initial materials and reviews them internally, with external expertise solicited as needed. The developed materials are then presented to the advisory committee for review. After collecting the comments from the reviewers, NAFTC communications staff finalize the materials and organize them in an online toolbox, for use by trainers and project partners.
Results The NAFTC has made substantial progress on the various components of the Alternative Fuel Vehicle Curriculum Development and Outreach Initiative project. Under the task to develop curricula and conduct AFV and EV training: • NAFTC finalized the content for the Online AFV/EV Training for Towing and Roadside Assistance
Personnel and Online AFV/EV Training for Automotive Recycling Personnel curricula, and solidified the subject matter experts. During early 2018, these SMEs will receive selected components of the online courses to review.
• NAFTC substantially completed the narratives for the AFV/EV Collision Repair Training and AFV/EV Fueling, Repair, Maintenance and Conversion Facility Training during the last quarter of FY 2017. Subject matter experts have been identified and external review is expected to be completed during the first quarter of 2018.
Under the task to market and conduct outreach for the curricula: • NAFTC developed an online toolbox microsite that will go live, along with the launch of the four
project-related curricula. • An Internal Advisory Committee was formed and convened to develop numerous promotional materials
to be launched once the curricula have been cleared. These materials included flyers, posters, and audience profiles.
• Project materials have been shared at various venues, including Automotive Aftermarket Products Expo (AAPEX), which has over 180,000 attendees.
Conclusions The NAFTC has made progress on the Alternative Fuel Vehicle Curriculum Development and Outreach Initiative project, and the project is on track for completion in 2018. The training materials and related promotional items fill key gaps in the extant literature related to alternative fuel vehicles. Providing education for those working in the towing and recycling industries is a key component to safely dealing with AFVs. Providing information about facility requirements and details about repairing

Technology Integration
6 Alternative Fuel Vehicle Initiatives
AFVs will result in more repair facilities being able to accommodate this growing segment of the automotive industry.

FY 2017 Annual Progress Report
Alternative Fuel Vehicle Initiatives 7
I.2 Southeast AFV Demonstration Initiative (SADI)
Andrea Eilers, Principal Investigator Triangle J Council of Governments 4307 Emperor Blvd, Suite 110 Durham, NC 27703 Phone: (919) 558-2705 E-mail: [email protected] Mark Smith, Program Manager U.S. Department of Energy Phone: (202) 287-5151 E-mail: [email protected] Start Date: July 15, 2015 End Date: January 14, 2018 Total Project Cost: $741,881 DOE share: $365,985 Non-DOE share: $375,896
Project Introduction The Southeast Alternative Fuel Vehicle Demonstration Initiative (SADI) is a project funded by the Department of Energy (DOE) aimed at increasing the number of alternative fuel and advanced technology vehicles in North Carolina, South Carolina and Tennessee. Working with key partners, Triangle J Council of Governments (TJCOG) is acting as the lead agency and is providing administrative oversight of the project. SADI’s goal is to provide best practices, objective data, and informational materials to potential end-users, to promote acceptance of advanced vehicles and alternative fuels. Additionally, project partners are supporting pioneering uses of market-ready vehicles and alternative fuels in key markets. Education Partners include four Clean Cities coalitions: Land of Sky Clean Fuels Coalition (Asheville, North Carolina); Centralina Clean Fuels Coalition (Charlotte, North Carolina); Palmetto Clean Fuels Coalition (South Carolina) and Tennessee Clean Fuels; as well as the North Carolina Clean Energy Technology Center (NCCETC). Technology Partners include Alliance AutoGas, ICOM NA, Johnston North America, Lighting Hybrids and Mainstay Fuel Technologies.
Objectives SADI’s objective is to create and implement high impact and highly innovative approaches to increasing the acceptance and use of alternative fuel vehicles (AFVs), through hands-on experiences. This is being accomplished by: • Providing technology partners with opportunities to demonstrate AFVs, while providing stakeholders
with opportunities to test different technologies, to help inform their future vehicle procurements • Providing expertise and guidance to fleets considering alternative fuel and vehicle options • Helping fleets overcome barriers to alternative fuel adoption
o Providing a neutral third party to work through vehicle procurement options for fleets, and to be a trusted resource for fleet managers
• SADI supports the DOE Energy Efficiency and Renewable Energy (EERE) Strategic Plan’s Goal 1 - Accelerate the Development and Adoption of Sustainable Transportation Technologies. This is being

Technology Integration
8 Alternative Fuel Vehicle Initiatives
done through Pathway 2 - Replacing conventional fuels with cost-competitive, domestically produced, sustainable alternatives (alternative fuels) that reduce pollution
Approach Task 1: Overall Project Management and Planning As the primary grant administrator, TJCOG has worked to manage and execute the SADI program through securing contracts with program participants, including technology and education partners. Task 2: Implement Demonstration Projects Technology partners conducted AFV demonstration projects over a 3-state region, in North Carolina, South Carolina and Tennessee. To date, the project has reached 76 unique fleets, with over 244 individual drivers participating in the demonstrations. The education partners in each region were responsible for identifying fleets to participate in the demonstration opportunities. The fleets initially selected were based on existing contacts and partnerships formed through Clean Cities coalitions, and by determining users with fleet profiles that matched the available vehicle offerings. The Clean Cities coalitions spread the word about the demonstration opportunities through coalition meetings, email marketing, presentations at local conference, and individual outreach. This organically led to additional vehicle placements, through regional contacts that were established. Although not a formal partner, PSNC Energy, a natural gas provider, also worked with the education partners to publicize the demonstration projects, and to provide access to compressed natural gas (CNG) for project vehicles. Technology partners provided CNG, liquefied petroleum gas (also known as LPG, or propane) and hybrid-electric vehicles for demonstration, as follows: • Alliance AutoGas
o Ford F-150 (LPG) o Ford Explorer Police Interceptor (LPG) o Ford Transit (LPG)
• ICOM North America o Ford Explorer (LPG) o Chevy Transit (CNG)
• Johnston North America o VS651 Street Sweeper (CNG)
• Lighting Hybrids o Ford E450 shuttle bus (hybrid retrofit) o Freightliner M2 box truck (hybrid retrofit)
• Mainstay Fuel Technologies o Freightliner Cascadia (CNG)
The project was originally designed to include three Nissan Leafs and two propane-powered school buses in the demonstrations, and to track the use 24 commuters riding in E85 vanpool vans operated by Enterprise; however, it proved more difficult than anticipated to bring all the potential technology partners on board. Task 3: Conduct Driver Training NCCETC created an EcoDriving training video that was shown to all project participants. For the Ford and Chevy vehicles, the Education Partners demonstrated how the bi-fuel switchover system worked, and fueling station personnel conducted fueling demonstrations for each user. For the Freightliner trucks and the VS651 street sweeper, the technology partners conducted a more in-depth training on the fuel system and proper operation of the vehicles. Depending on the vehicle, the education partners also distributed handouts containing vehicle specifications.
FY 2017 Annual Progress Report
Alternative Fuel Vehicle Initiatives 9
Task 4: Collect Vehicle Usage Data Education partners submitted information on fleet participation to TJCOG on a quarterly basis. TJCOG was responsible for data management, and tracked which fleets were participating in demonstrations, how many drivers participated, and how long they had the vehicle(s). TJCOG also followed up with drivers to determine their knowledge about alternative fuels before and after the demonstrations, and to ask about any questions or concerns they had about the vehicles. Approximately 100 drivers responded to these post-demonstration inquiries. The education partners then had the opportunity to go back to the drivers and address any issues they had raised and correct any misconceptions they may have had about alternative fuels. Task 5: Publicize Successes, Best Practices, & Lessons Learned Each education partner created at least one case study, based on a demonstration conducted by a fleet in its region. These case studies are posted on individual education partner websites and distributed via social media, and will be posted on the SADI website, as a way to share success stories and provide educational resources for ongoing engagement with potential AFV users.
Results To date, project milestones include the following: Technology Provider Commitments Obtained TJCOG coordinated contract development and obtained commitments to participate in the project from Alliance Autogas, ICOM NA, Mainstay Fuel Technologies, Lighting Hybrids and Johnston North America. Attempts to obtain commitments from Nissan to include three Leafs in the project were unsuccessful. Nissan required that TJCOG provide insurance, and TJCOG eventually concluded that it could not take on the liability associated with having the Leafs participate. Similarly, the original plan to include two propane school buses in the demonstrations had to be modified. One bus company had a school bus it had planned to include in the project, but it found a buyer for that vehicle, so it was unavailable. Another company determined that North Carolina was not a hot market for alternative fuel school buses, as the Department of Instruction was not on board, and it also declined to participate in the project. After a legal review, Enterprise also declined to participate in SADI, so no E85 vanpool vans were included. Data Management Plan Completed TJCOG worked with the project partners to develop and execute a data management plan, and submitted it to DOE on June 16, 2016. Marketing Plans Developed The project partners developed customized marketing materials for each vehicle and region, based on the demonstration schedule, and TJCOG submitted the marketing plan to DOE on June 16, 2016. Data Collection Website Developed TJCOG developed a data collection website, which will continue to be updated through the end of the project. Test Drive Data Obtained The original plan called for the use of telematics on the demonstration vehicles; however, many of the participating fleets already used telematics on their vehicles, and had access to the data on vehicle and fuel use. Additionally, several fleets were not overly concerned with the telematics data, but were more interested in other aspects of the demonstration project. With fewer technology partners than anticipated participating in the project, there was less cost share available, and therefore a need to reduce expenses. Discontinuing the

Technology Integration
10 Alternative Fuel Vehicle Initiatives
telematics portion of the project was one of the easiest ways to save money. Other forms of quantity and quality of test drive data have been collected throughout the project to track and quantify impact. Driver Training Conducted The project partners have conducted individual driver training throughout the duration of the project. School Bus Report As the anticipated participation of one or more school bus technology partners did not occur, this deliverable was no longer applicable. Participation Targets Modified SADI’s original participation targets called for 900 individual driver demonstrations. This number relied heavily on the availability of three Nissan Leafs that were to be rotated among new fleets, including state and local government agencies and elected officials, every three days, for a total of 250 demonstrations. Original plans also called for having up to 60 school districts participate in the propane school bus demonstrations, and for including E85 vanpool vans. As the mix of available vehicles was different than what was originally anticipated, the project partners had to revise the participation targets accordingly. To date, 76 fleets and 244 individual drivers have participated in the demonstrations, within the 3-state region (North Carolina, South Carolina and Tennessee). One of the reasons potential technology partners gave for not participating in SADI was an unwillingness to commit to making their vehicle(s) available for a year and a half, as required by the project. TJCOG found, however, that a number of potential partners were willing to participate in shorter demonstrations by providing one or more vehicles to fleets on an individual, as-needed, basis. While they were unable to commit to SADI’s timeframe, this willingness to participate on a more limited level bodes well for conducting future, short-term, vehicle demonstrations, and introducing more fleets to AFVs. Vehicle Purchases After participating in the demonstration program, several fleets had indicated that they were interested in pursuing alternative fuel vehicle purchases, but none had been finalized. SADI participation was heavily weighted toward local government agencies and universities, and the timeline for their vehicle purchases is strongly based on budget cycles and available purchasing incentives. North Carolina previously had incentives available, but they have expired, resulting in delayed vehicle purchases. Fleet managers are also anticipating that money from the Volkswagen Clean Diesel settlement, which can be applied toward the purchase of cleaner vehicles, will be made available in the near future, and many are waiting for that funding before committing to any new vehicle purchases.
Conclusions The SADI project will continue through early January 2018. As a result of this project, Clean Cities Coalitions, AFV vendors and fleet managers have developed new partnerships. These partnerships and collaborations will extend beyond the project period and help to bolster adoption and support of alternative fuel technologies throughout the Southeast. SADI has worked to remove barriers to alternative fuel fleet adoption, market these opportunities and build synergies with fleets and private industry; however, the requirement for technology partners to commit to a one and a half year time period discouraged many potential partners from participating. The project partners have determined that conducting shorter-term demonstrations would result in more technology partners, and a wider range of vehicles being made available.

FY 2017 Annual Progress Report
Alternative Fuel Vehicle Initiatives 11
I.3 Creating an Alternative Fuel Training Network for Florida (University of Central Florida)
Colleen McCann Kettles, Principal Investigator University of Central Florida, Florida Solar Energy Center 1679 Clearlake Road, Cocoa, FL 32922 Phone: (321) 638-1004 E-mail: [email protected]
Linda Bluestein, Technology Manager U.S. Department of Energy Phone: (202) 586-6116 E-mail: [email protected] Start Date: September 1, 2015 End Date: February 28, 2018 Total Project Cost: $750,000 DOE share: $600,000 Non-DOE share: $150,000
Project Introduction This project addresses the lack of technical expertise with new fuels and vehicle technologies in the emergency response sector, by establishing a network of instructors trained to teach first responder safety training to Florida’s fire fighters. It also addresses consumer reluctance to purchase new technologies by alleviating concerns about safe operation of alternative fuel vehicles (AFVs). It is designed to ramp up the ranks of Florida first responders who are trained to handle emergency events involving AFVs. In Florida, there are currently less than 100 first responders, and even fewer instructors, who have received some level of training in this area. Florida is poised for a significant growth spurt in AFVs, and the growth of a trained public safety workforce is essential to maintain that trend. Florida is also developing refueling infrastructure at the same time that vehicles are being introduced to the consumer and fleet markets. There is concern among stakeholders, particularly vendors, that this upward momentum might stall without the implementation of measures to increase consumer and business awareness of AFVs. Among those measures is safety training of first responders and others in the public safety sector. Providing first responders with the knowledge and tools that they need when responding to an emergency event involving an AFV is essential for their level of comfort, and the residual effect of their confidence on the drivers of those vehicles is significant. The project partners are the key to the successful deployment of this project, and include the four designated Florida Clean Cities Coalitions (Central Florida, North Florida, Southeast Florida, and Tampa Bay), and three training partners: the National Alternative Fuels Training Consortium (NAFTC), the Florida State Fire College (FSFC), and the North American Towing Academy (NATA). NAFTC has developed a comprehensive curriculum on Alternative Fuel Safety, including several courses targeting first responders and their instructors. The FSFC oversees and accredits all fire fighter training on behalf of the Florida State Fire Marshal. NATA provides professional training and certification programs for tow truck operators.
Objectives The primary objective of this project is to establish an AFV training network for the state of Florida that provides alternative fuel safety and technical training to current and future emergency first responders, public safety officials, and critical service providers. The project will provide multiple levels of training and assessment to assure that the effort will achieve a broad impact across the alternative fuel user community. This project will:

Technology Integration
12 Alternative Fuel Vehicle Initiatives
• Create and implement high impact and highly innovative approaches to increasing the acceptance and deployment of AFVs, through safety related training
• Establish an AFV training network for the state of Florida that provides safety and technical training on electric drive, CNG and propane vehicles to current and future emergency first responders, public safety officials, and instructors, at educational institutions that prepare the first responder workforce
• Integrate AFV Safety First Responder Training into the curriculum approved by the Florida State Fire Marshall
Approach The initial approach to project implementation was modified immediately after convening the project team and partners. The Florida State Fire College was not expected to be actively engaged until initial training was offered; however, the Fire College was an enthusiastic partner at the outset and had an early impact in terms of securing Fire Marshal approval of the training curriculum through the Fire College Department of Insurance Continuing Education System (FCDICE). FCDICE is run by the Bureau of Firefighter Standards and Training, which approves courses for fire fighters, maintains class rosters, and approves instructors, as well as training providers. The next steps in implementation (with the task participants identified) included: • Identify training participants (Coalition Partners) • Obtain Florida State Fire College approvals via FCDICE (UCF) • Schedule and promote Train the Trainer Workshops (UCF)
o Secure demonstration vehicles (UCF, Coalition Partners) o Conduct training (NAFTC, Coalition Partners) o Enroll fire fighter instructors (UCF) o Assess training (UCF)
• Create directory of first responder AFV safety training instructors (UCF) • Schedule fire fighter workshops (Trained Instructors)
o Secure Demonstration Vehicles (Coalition Partners) o Conduct training (Trained Instructors) o Assess training (UCF) o Conduct tow operator training (UCF, NATA and NAFTC)
• Develop public education toolkit for first responders using Clean Cities outreach materials (UCF) • Identify Workforce Board funding opportunities (UCF, Workforce Consultant)
Results The project has established a comprehensive database of Florida’s fire departments and public safety training institutions that has served as the basis for creating a network of certified AFV safety training instructors. The Clean Cities coalition partners supported the development of the database. We are still in the process of coordinating the training efforts of certified instructors and have a tentative schedule for tow operator training in early 2018. The most significant achievement, which was considered initially to be the greatest challenge, was the program approval by the Florida State Fire College and the recognition within the FCDICE System of the following: • Approved Educational Provider • Approved Train the Trainer course • Approved First Responder course • Approved course instructors

FY 2017 Annual Progress Report
Alternative Fuel Vehicle Initiatives 13
The four designated coalitions were responsible for coordinating the NAFTC training conducted in their regions, as well as the subsequent outreach to the trained instructors for assistance in conducting workshops to their fellow fire fighters. The map displayed in Figure I.3.1 shows that most of the Florida peninsula now has trained and certified instructors. The panhandle was not included, because the West Florida coalition is not yet an officially designated Clean Cities coalition, and as a result was not included in the project funding. Additionally, the workshops offered were somewhat remote from this region.
Figure I.3.1: Map of fire departments with NAFTC trained instructors
The following milestones were achieved with the support of the projects partners • Scheduled and promoted workshops and arranged for demonstration vehicles • Completed Train the Trainer workshops in each Coalition Region and at the state level • Compiled workshop evaluations showing a high level of satisfaction • Created database of trained instructors • Planning is in progress for First Responder workshops to be taught by trained instructors • Coordinated Tow Operator training curriculum with NAFTC • Trained 73 instructors state-wide • Covered 22 of 67 counties. See Table I.3.1.

Technology Integration
14 Alternative Fuel Vehicle Initiatives
Table I.3.1: Roster of Fire Departments with Trained Instructors by County and Coalition Region Fire Department County Coalition
Flagler County Fire Department High Springs Fire Department
Marion County Fire Rescue Melbourne Fire Department
NASA/KSC Fire Rescue Orange County Fire and Rescue Rainbow Lakes Fire Department
St. Cloud Fire Rescue St. Lucie County Fire District
The Villages Public Safety Dept.
Flagler Alachua Marion Brevard Brevard Orange Marion Osceola St. Lucie
Lake
Central Florida Clean Cities Coalition
Jacksonville Fire and Rescue Department Nassau County Fire Rescue
St. Johns County Fire Rescue State of Florida Fire Marshal Office
Duval Nassau
St. Johns Duval
North Florida Clean Fuels Coalition
Boca Raton Fire Rescue Broward Sheriff Office Fire Rescue City of Lauderhill Fire Department
Delray Beach Fire Rescue Islamorada Fire Rescue Miami Dade Fire Rescue Miramar Fire Department
Sunrise Fire Rescue
Palm Beach Broward Broward
Palm Beach Monroe
Dade Broward Broward
Southeast Florida Clean Cities Coalition
Bradenton Fire Department Cape Coral Fire Department
Cedar Hammock Fire Department City of Tampa Fire Marshal's Office
Dunedin Fire Department Hillsborough County Fire Rescue
Levy County Department of Public Safety Manatee Technical College
North Port Fire Rescue Palm Harbor Fire Rescue Public Safety Specialists Polk County Fire Rescue
Southern Manatee Fire Rescue St. Petersburg Fire Rescue
Tampa Fire Rescue
Manatee Lee
Manatee Hillsborough
Pinellas Hillsborough
Levy Manatee Sarasota Pinellas
Hillsborough Polk
Manatee Pinellas
Hillsborough
Tampa Bay Clean Cities Coalition
Since money to support training programs is not always readily available, and program sustainability is a desirable outcome, one of the objectives of this project was to identify alternative means of funding first responder training. The project retained a workforce agency consultant to identify opportunities to access formula funding available from the US Department of Labor, to support new and incumbent worker training to upgrade their skills, particularly in areas of new technology. Through a series of interviews and questionnaires, the consultant determined that the prospects were good to pursue utilizing workforce funds for first responder AFV safety training. All pertinent occupations are currently included in the State and local workforce board issued Targeted Occupations List, a prerequisite for accessing training funds. The consultant concluded that meeting this major criteria could be the stimulus for garnering industry support to move forward to complete the remaining criteria to access workforce funding. The consultant also recommended a strategy for developing

FY 2017 Annual Progress Report
Alternative Fuel Vehicle Initiatives 15
a stronger relationship with the local workforce boards in order to secure funding. That strategy is illustrated in Figure I.3.2.
Figure I.3.2: Workforce Board engagement strategy
Conclusions This project has successfully established Florida’s AFV Safety Training Network of Fire Fighters with the approval of the Florida State Fire Marshal. The designated Florida Clean Cities coalitions have collectively created a database of Florida Fire Fighter Training Institutions and Certified Instructors, and have facilitated AFV Safety Training workshops. The project has also identified Workforce Development Board funding as a source of training funding for program sustainability. The project is in the process of providing AFV Safety Training to the National Tow Operator Training Organization in cooperation with NAFTC.
Develop a local partnership of
industry, community and
educational stakeholders to meet with local
workforce boards
Present data gathered by the partnership to local workforce
boards to garner support of industry
occupations and training
Provide local workforce boards
with data to support inclusion
of industry occupations on
the Regional Targed
Occupation List
Engage local educational
institutions for inclusion in the local Training
Provider list and offer AFV trainings
Discuss with local workforce boards other methods of delivery for AFV
training (Webinars, OJT,
EWT, IWTs)

Technology Integration
16 Alternative Fuel Vehicle Initiatives
I.4 Nationwide Alternative Fuel Vehicle (AFV) Emergency Responder, Recovery, Reconstruction and Investigation Training (National Fire Protection Association)
Andrew Klock, Principal Investigator National Fire Protection Association 1 Batterymarch Park Quincy, MA 02169 Phone: (617) 984-7089 E-mail: [email protected]
Dennis Smith, Technology Manager U.S. Department of Energy Phone: (202) 586-1791 E-mail: [email protected] Start Date: May 29, 2015 End Date: May 28, 2017 Total Project Cost: $872,501 DOE share: $685,000 Non-DOE share: $187,501
Project Introduction NFPA designed this project to provide training and reference materials to first and second responders and investigators across the country, who come in contact with alternative fuel vehicle (AFV) incidents, so that each will know how to handle crashes, fires, water immersions, and other incidents involving not only electric and hybrid-electric vehicles, but fuel cell and gaseous fuel vehicles as well. With this DOE funding opportunity, NFPA committed to establishing train-the-trainer, classroom, and online training programs, as well as on-scene reference materials and supplemental materials customized for the entire spectrum of responder, recovery, reconstruction, and investigation operations following incidents involving these vehicles.
Figure I.4.1: Filming hybrid-electric vehicle accident scene recreation for accident investigation team training program
NFPA partnered with sub-recipient Virginia Clean Cities (VCC) and worked with Clean Cities coalitions across the country, as well as more than 42 auto manufacturers that sell AFVs in the United States, to facilitate the sharing of AFV safety information, by incorporating the material into training courses and reference materials. NFPA also partnered with four respected fire service subject matter experts (SMEs) in AFV technology and safety, extrication, and vehicle rescue. NFPA also worked with the Fire Protection Research Foundation (FPRF), Argonne National Laboratory (ANL), the International Association of Fire Fighters (IAFF), the International Association of Fire Chiefs (IAFC), the National Volunteer Fire Council (NVFC), the

FY 2017 Annual Progress Report
Alternative Fuel Vehicle Initiatives 17
International Fire Marshals Association (IFMA), the National Association of State Fire Marshals (NASFM), the Metro Fire Chiefs, the United States Fire Administration (USFA), the North American Fire Training Directors (NAFTD), the International Association of Chiefs of Police (IACP), the National Sheriffs Association (NSA), the New York State Police (NYSP), the Society of Automotive Engineers (SAE), the American National Standards Institute (ANSI), and the Tow and Recovery Association of America (TRAA) in creating course materials (see Figure I.4.1).
Objectives NFPA’s primary objective for this project was to develop and deliver alternative fuel safety and technical training to emergency first responders, public safety officials, and critical service providers in need of vital safety knowledge for working with AFVs involved in incidents. The project was designed to develop new, cutting-edge training programs, update and expand upon existing programs, and deliver codes and standard-compliant safety training to responder and investigation professionals. The safety training encompassed electric, hybrid-electric, hydrogen and gaseous fuel vehicles, as well as refueling infrastructure for those fuels (see Figure I.4.2). NFPA also planned to widely distribute approximately 20 free fire service train the trainer classroom trainings to 15 selected states.
Approach To accomplish the stated objectives, NFPA targeted five key groups and established approaches for developing and delivering training for each, as follows:
1. U.S. Fire Service: Incorporate gaseous fuels and fueling infrastructure into existing classroom courses, and provide no-cost, online and train the trainer classroom training, course materials and extrication manuals to the U.S. fire service, which includes paid and volunteer fire departments across the country
2. Emergency Medical Services (EMS): Create and host a freely available, self-paced, online AFV safety training program for the country’s EMS community
3. Fire Investigators: Create a train-the-trainer classroom course and provide 3 classroom train-the-trainer sessions to fire investigation associations, free of charge
4. Tow & Salvage: Incorporate gaseous fuels and infrastructure into NFPA’s existing training video series, and host the series on NFPA’s website free of charge for the tow & salvage community
5. Crash Reconstruction Teams (Law Enforcement): Create and host an awareness training video series free of charge for U.S. Crash Reconstruction Teams on NFPA’s website
Figure I.4.2: EV display at debut of Fire Service classroom training, NFPA Conference & Expo 2016, Las Vegas, NV

Technology Integration
18 Alternative Fuel Vehicle Initiatives
Based on its research of the fire service and fire investigator communities’ needs, NFPA determined that hands-on classroom training was the best approach to take. The classroom programs will be provided by NFPA’s SME instructors, for training officers in selected states with high AFV populations. These train the trainer classroom programs will make it possible to propagate the training for fire fighters and fire investigators throughout the states where the initial trainings occurred, and to jump start nationwide training program deliveries. NFPA partnered with the state fire training directors, the IAFC, Metropolitan Fire Chiefs, the National Volunteer Fire Council (NVFC), and a technical advisory panel consisting of representatives from the U.S. fire service, law enforcement, EMS, and tow/salvage organizations, to develop and deliver the training. NFPA planned to provide each participating state with one or two train the trainer classes, depending on the state’s geographic size. In addition, NFPA provided the trainers in each state with the necessary course materials and resources to allow them to propagate the training through the departments in their respective states. Virginia Clean Cities (VCC) was responsible for coordinating the training effort, by working with Clean Cities coalitions in each of the selected states, to schedule classes and market the training to Clean Cities stakeholders.
Results First year activities included the formation of NFPA’s project technical advisory panel, and conducting first responder research. NFPA also convened an Alternative Fuels Vehicle Safety Summit, in Detroit, Michigan on June 23, 2016. This summit involved a diverse group of more than 35 stakeholders from around the country, including representatives from OEMs, the responder communities, research organizations, national laboratories, and utilities. The summit addressed the implementation of electronic badging technologies; clarified the tactical firefighting approach for the venting of gaseous fuel storage vessels; addressed the needs of investigators to re-power damaged vehicles to harvest post event data; and continued to address the problem of stranded energy (energy left in the battery after an accident or fire) and its potential impact on subsequent fire re-ignition and shock hazards for emergency responders and investigators. The first year also included the onboarding of a state-of-the-art educational product development team, including a web developer, a videographer, a graphics developer, and a publisher. These steps facilitated the development of NFPA’s advanced AFV safety curriculum. SMEs at ANL provided previously collected study data and validated NFPA’s gaseous fuels training. NFPA’s depth of experience in working directly with emergency responders on safety issues related to emerging technologies, and developing and administering training courses throughout the country, enabled the creation of highly engaging, quality training experiences (see Figures I.4.3 and I.4.4).
Figure I.4.3: Fire Service AFV Safety train-the-trainer classroom training, Alameda County, CA
FY 2017 Annual Progress Report
Alternative Fuel Vehicle Initiatives 19
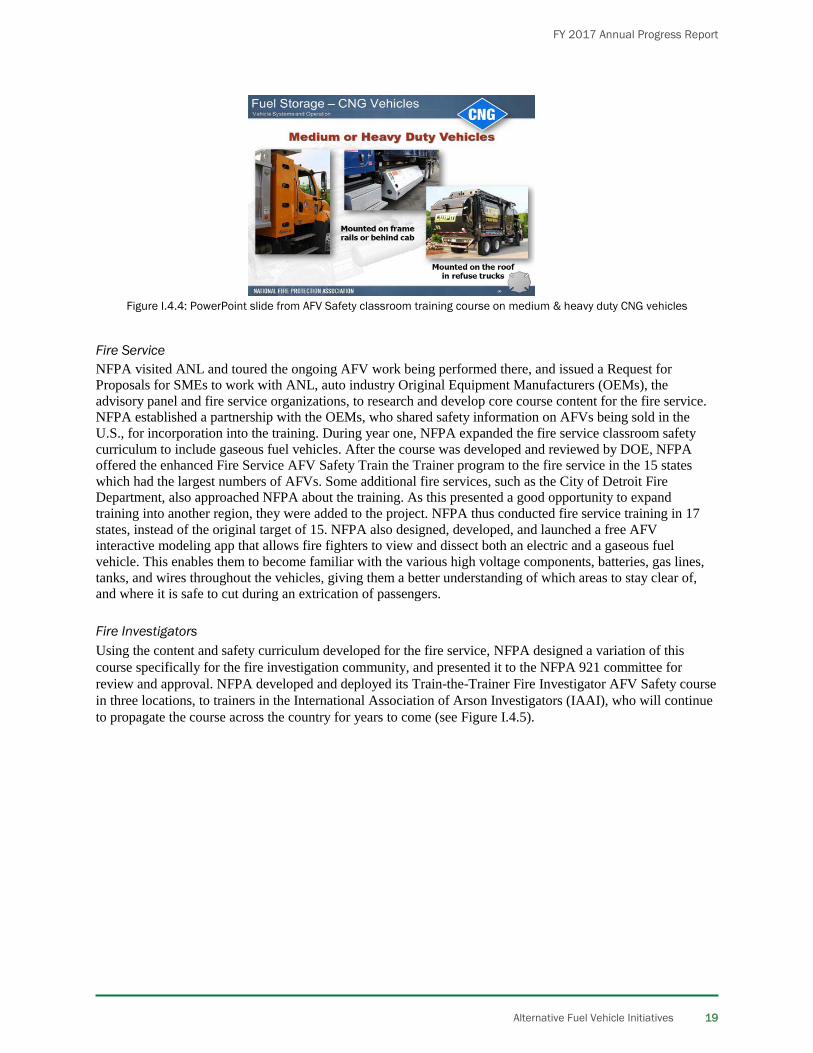
Figure I.4.4: PowerPoint slide from AFV Safety classroom training course on medium & heavy duty CNG vehicles
Fire Service NFPA visited ANL and toured the ongoing AFV work being performed there, and issued a Request for Proposals for SMEs to work with ANL, auto industry Original Equipment Manufacturers (OEMs), the advisory panel and fire service organizations, to research and develop core course content for the fire service. NFPA established a partnership with the OEMs, who shared safety information on AFVs being sold in the U.S., for incorporation into the training. During year one, NFPA expanded the fire service classroom safety curriculum to include gaseous fuel vehicles. After the course was developed and reviewed by DOE, NFPA offered the enhanced Fire Service AFV Safety Train the Trainer program to the fire service in the 15 states which had the largest numbers of AFVs. Some additional fire services, such as the City of Detroit Fire Department, also approached NFPA about the training. As this presented a good opportunity to expand training into another region, they were added to the project. NFPA thus conducted fire service training in 17 states, instead of the original target of 15. NFPA also designed, developed, and launched a free AFV interactive modeling app that allows fire fighters to view and dissect both an electric and a gaseous fuel vehicle. This enables them to become familiar with the various high voltage components, batteries, gas lines, tanks, and wires throughout the vehicles, giving them a better understanding of which areas to stay clear of, and where it is safe to cut during an extrication of passengers. Fire Investigators Using the content and safety curriculum developed for the fire service, NFPA designed a variation of this course specifically for the fire investigation community, and presented it to the NFPA 921 committee for review and approval. NFPA developed and deployed its Train-the-Trainer Fire Investigator AFV Safety course in three locations, to trainers in the International Association of Arson Investigators (IAAI), who will continue to propagate the course across the country for years to come (see Figure I.4.5).

Technology Integration
20 Alternative Fuel Vehicle Initiatives
Figure I.4.5: PowerPoint presentation for AFV Safety training for fire investigators
In year two of the project, NFPA implemented a plan to propagate these classroom and online, state-of-the-art training programs throughout the nation’s firefighter and fire investigation divisions and ranks, free of charge, and trained over 1,250 emergency responder trainers in 21 classrooms across 17 states. See Table I.4.1. NFPA advertised these AFV Safety programs throughout the country, leveraging Clean Cities Coalitions and NFPA connections, to target key audiences and bolster attendance at trainings.
Table I.4.1: Classroom Training Locations State Location
Nevada Las Vegas Regional Fire Departments, NV California Los Angeles Fire Department, Los Angeles, CA California Alameda County Emergency Services, Dublin, CA New York Albany Regional Fire Departments, NY
New Jersey Middlesex Fire Academy, Edison, NJ Connecticut Connecticut Fire Academy
Texas Temple Fire Training Center, Waco/Temple, TX Michigan Detroit, MI Fire Department (2 trainings) Florida Florida State Fire College, Ocala, FL Florida Tampa Fire Rescue, Tampa, FL Georgia City of Decatur Recreation Center, Decatur, GA Oregon Portland Convention Center, Portland, OR
Wisconsin Milwaukee Technical College, Oak Creek, WI Pennsylvania Community College of Allegheny County, Oakdale, PA Pennsylvania Philadelphia Fire Academy, Philadelphia, PA
Arizona Arizona State Univ. - Scottsdale, AZ Oklahoma MetroTech Spring Lake Campus, Oklahoma City, OK Missouri St Louis Fire Academy, Saint Louis, MO Indiana Jackson County Learning Center, Seymour, IN Virginia VA Department of Fire Programs, Richmond, VA
Emergency Medical Services, Crash Reconstruction, and Tow and Salvage NFPA designed, developed, and launched a free AFV online course that caters specifically to the needs of EMS personnel, and includes two educational, interactive 3D AFV models. NFPA also produced a free educational safety video series that includes five videos addressing AFV safety for crash reconstruction personnel, as well as four new safety training videos on gaseous fuel AFV safety, for the tow/salvage

FY 2017 Annual Progress Report
Alternative Fuel Vehicle Initiatives 21
communities. The EMS online program and the tow/salvage video series are available on NFPA’s AFV website [1]. In total, 10 training videos and 2 interactive apps were developed during this project.
Conclusions The outcomes of this project were significant. It met or exceeded every objective initially set forth in the statement of project objectives (SOPO). NFPA completed and disseminated all deliverables on time and within budget to the responder and investigation communities, and most are accessible free of charge on NFPA’s AFV website. As a direct result of these efforts during the performance period, NFPA trained 975 fire service training officers, and 240 fire investigator trainers; additionally, over 53,000 emergency responders across the country have accessed NFPA’s AFV website to retrieve this valuable safety material over the last two years. Throughout this project, it became evident that some Clean Cities coalitions lacked connections to their local and regional fire service organizations. In many of these cases, NFPA, with the support of Virginia Clean Cities, helped to foster those relationships. NFPA is proud to report that all emergency responders in the United States that come in contact with AFVs now have access to up-to-date training, videos, 3D models, and quick reference information, enabling them to better understand how to safely handle these technologies in emergency situations.
References [1] AFVTechSafety.org
Key Publications Alternative Fuel Vehicle Safety Summit Findings, available at https://www.nfpa.org/news-and-research/fire-statistics-and-reports/research-reports/proceedings/2016-proceedings/alternative-fuel-vehicle-safety-summit NFPA AFV Safety Training Gaseous Fuel Vehicle Safety Instructor’s Guide (Fire Service Edition) NFPA AFV Safety Training Gaseous Fuel Safety Student Manual (Fire Service Edition) NFPA AFV Safety Training Instructor’s Guide (Fire Investigation Edition) NFPA AFV Safety Training Student Manual (Fire Investigation Edition)

Technology Integration
22 Alternative Fuel Vehicle Initiatives
I.5 Initiative for Resiliency in Energy through Vehicles (iREV) (National Association of State Energy Officials)
Cassie Powers, Principal Investigator National Association of State Energy Officials 1300 North 17th Street, Suite 1275 Arlington, Virginia, 22209 Phone: (703) 299-8800 E-mail: [email protected]
Linda Bluestein, Technology Manager U.S. Department of Energy Phone: (202) 586-6116 E-mail: [email protected] Start Date: May 15, 2015 End Date: December 31, 2017 Total Project Cost: $1,095,276 DOE share: $875,000 Non-DOE share: $220,276
Project Introduction Vehicles that run on alternative fuels – such as biodiesel, electricity, natural gas, and propane – can help diversify an emergency response fleet and build system resilience. In the aftermath of Hurricane Sandy, gasoline and diesel were in short supply throughout New York and New Jersey. Communities that had access to alternative fuel vehicles (AFVs) were able to use those vehicles to evacuate residents, transport clinic patients to medical treatments, help those staying behind gather emergency goods such as food and water, and assist with post-hurricane cleanup operations. Integrating AFVs into emergency operations and related plans can allow jurisdictions to rely on a diversified pool of fuel resources in the event of a gasoline or diesel fuel disruption. The Initiative for Resiliency in Energy through Vehicles (iREV) project provides information on alternative fuels and vehicles to the emergency planning and response communities; this information can then assist emergency managers in developing plans to activate AFV fleets to perform essential services, in the event that a storm or other emergency disrupts a state’s primary fuel supply.
Objectives iREV is a nationwide project to equip emergency planners with the tools, information, and intra-and interstate coordination strategies needed to incorporate alternative fuels into emergency management and preparedness operations, including state and local energy security and assurance efforts. iREV will accomplish three objectives: • Create customized tools and information for emergency management decision-makers to examine the
potential costs, benefits, and trade-offs of incorporating alternative fuels into their emergency plans. This will include the iREV-Tracking Tool (iREV-T) [1], to help state and local governments optimize their investments in AFVs.
• Promote intra- and interstate coordination and education among emergency planning and response entities at the local, state, and regional levels, on key issues and strategies associated with incorporating alternative fuels into their plans.
• Increase the prevalence of alternative fuels in existing and future state and local emergency planning and response operations using a multi-pronged approach: one-on-one partnerships with state and local emergency planning and response entities; direct engagement with energy assurance planners and

FY 2017 Annual Progress Report
Alternative Fuel Vehicle Initiatives 23
emergency management education and certification programs; and targeted communications and messaging to key stakeholder groups.
Approach iREV will achieve its objectives by undertaking a series of deliverables-oriented tasks that will enable emergency planners and energy policymakers to integrate AFVs into emergency planning activities and build more resilient communities. These tasks include the following: • Create tools and resources to support state and local decision-making regarding the use of alternative
fuels in emergency preparedness and response operations • NASEO will work to launch a Steering Committee, comprised of project partners from across the
country, to direct iREV’s work. The Steering Committee will inform the development of the iREV webpage, as well as four policy- and plan-oriented case studies, a baseline study of the inclusion of AFVs and infrastructure in current state and local plans, the collection of AFV and fleet inventory data from partner locations, and the development of iREV-T, an alternative fuel-focused decision support tool able to analyze AFV and fleet inventory data.
• Educate and promote horizontal coordination among state and local emergency management agencies and Clean Cities coalitions
• NASEO will hold 3-4 regional “Ready for Day 1” workshops for local emergency planners and policymakers, to provide information on the resiliency benefits of incorporating AFVs in their emergency plans. Through these workshops and additional outreach, NASEO will obtain commitments from emergency managers to support the creation of iREV Policy and Planning Toolkits for their states and localities. NASEO will also package workshop findings and lessons learned into a “Workshop in a Box” for Clean Cities stakeholders, so that AFV preparedness workshops can be replicated in jurisdictions across the country.
• Incorporate iREV tools and recommendations into emergency preparedness and response channels • NASEO will create iREV Policy and Planning Toolkits for 2-3 jurisdictions that will enable them to
review their emergency plans and data on local AFVs, and make customized recommendations on how to integrate AFVs into emergency planning processes and their local fleets. In addition, NASEO will create an iREV Course Package that synthesizes findings and materials from the project, and will work to incorporate the Course Package into partners’ education and certification programs. NASEO will also create approximately four Insight Briefs that synthesize project findings, using messaging and pertinent information geared toward a variety of audiences, and disseminate the briefs via the project team’s networks.
• Support planning and coordination between State Energy Offices and Clean Cities Coalitions regarding AFVs and infrastructure
• A recent court settlement between the U.S. Department of Justice, the State of California and Volkswagen will provide over $2.9 billion to states, Indian Tribes, D.C. and Puerto Rico for eligible mitigation actions to reduce oxides of nitrogen (NOx) emissions from vehicles. To leverage funding from the Volkswagen settlement for resiliency efforts that include AFVs, NASEO will work with State Energy Offices, Clean Cities Coordinators, and other key partners to develop a Model Beneficiary Mitigation Plan for states, and will disseminate the model plan via webinars, conference calls, and in-person meetings. In addition, NASEO will provide technical support to State Energy Offices, Clean Cities Coalitions, and others on AFV program design under the Volkswagen settlement, as needed.
Results NASEO has developed a series of four case studies that outline the benefits of AFVs, highlight ways that alternative fuels have helped states and communities during emergencies, and recommend actions that states can take to integrate AFVs into future emergency plans. These case studies provide emergency planners with basic information on biodiesel, electric, natural gas, and propane vehicles, and a framework for including

Technology Integration
24 Alternative Fuel Vehicle Initiatives
AFVs in the emergency planning process. They were developed with extensive input from the iREV Steering Committee, and have been used as foundational educational materials for the emergency management community. They have been widely disseminated through the International Association of Emergency Managers’ network, as well as via Clean Cities Coalitions and State Energy Offices. The four case studies are:
• Biodiesel Fueled Vehicles and Emergency Response (June 2016). This case study examines the benefits and considerations of incorporating biodiesel vehicles into emergency fleets, and features lessons learned from both New York City and Florida Power & Light’s use of biodiesel during emergency situations.
• Electric Vehicles and Emergency Response (June 2016). The iREV electric vehicle case study examines the benefits and considerations of incorporating EVs into emergency fleets, and highlights ways that Pacific Gas and Electric (PG&E) has used electric utility trucks as an exportable power resource, and how EVs proved to be a valuable asset in the aftermath of the Great East Japan Earthquake.
• Natural Gas Vehicles and Emergency Response (June 2016). This case study highlights the benefits and considerations associated with incorporating natural gas vehicles into emergency fleets, and examines how the Port Authority of New York and New Jersey, Atlantic City, New Jersey, and Trussville, Alabama have used alternative fuels during disasters.
• Propane Vehicles and Emergency Response (June 2016). The iREV propane vehicle case study explores the benefits and considerations of incorporating propane vehicles into emergency fleets, and features lessons learned from the police force in Sandy Springs, Georgia, as well as Boston Public Schools.
NASEO conducted a Baseline Assessment [6] to review the current status of AFVs in emergency plans, and to recommend ways that states can include AFVs in future plans. NASEO reviewed each state’s Emergency Operations Plan (EOP) and Energy Assurance Plan, as well as EOPs from 20 of the country’s largest municipalities. The assessment revealed that few states or municipalities have incorporated AFVs into their emergency plans, and that there is significant opportunity for AFV inclusion moving forward. NASEO also developed the iREV-Tracking Tool to help emergency planners understand the AFV and infrastructure assets and options at their disposal, and optimize planning and investment based on their specific fuel supplies, geography, and risk profiles (see Figure I.5.1). The iREV-Tracking Tool, or iREV-T, combines data from the Alternative Fuels Data Center, on-the-ground fleet and infrastructure information relayed through partner Clean Cities Coalitions, and disaster readiness tools being used at the national level to support critical infrastructure and homeland security. Since iREV-T was launched in spring 2017, emergency managers, State Energy Offices, and Clean Cities Coalitions have expressed interest in learning about the tool and using it for emergency planning exercises. It has also been used by the iREV pilot jurisdictions, as described below.
Figure I.5.1: iREV Tracking Tool

FY 2017 Annual Progress Report
Alternative Fuel Vehicle Initiatives 25
To disseminate project findings and raise awareness of alternative fuels, NASEO held three regional workshops for emergency managers: a northeast workshop in Providence, Rhode Island, in conjunction with the Rhode Island Emergency Management Association’s annual conference; a southeast workshop in Savannah, Georgia, in conjunction with the International Association of Emergency Managers’ (IAEM’s) annual meeting; and a stand-alone workshop in Long Beach, California. NASEO, in partnership with the National Governors Association (NGA), also held a fourth Policy Workshop in Denver, Colorado, to which State Energy Offices and State Emergency Management agencies from across the country were invited, to learn about the resiliency benefits of AFVs and discuss ways that states can successfully work across agencies. Each workshop was structured differently, e.g., the Savannah meeting was held as two breakout sessions within the larger IAEM conference, while the Long Beach meeting was designed as a half-day roundtable with local emergency managers. At each workshop, however, NASEO introduced the audience to the topic of AFVs and resilience, reviewed the case studies, demonstrated the iREV-T tool, and engaged the audience in a discussion. Building off the workshop discussions, NASEO identified two jurisdictions – Lancaster County, Pennsylvania, and the state of Tennessee – to serve as pilot communities for the iREV project. For each jurisdiction, NASEO created an iREV Policy and Planning Toolkit that was used to review existing emergency plans and local fleet and infrastructure data. NASEO worked with the emergency manager in each pilot community to learn about the local planning process; partnered with the local Clean Cities Coalition to collect AFV and infrastructure data and incorporate this data into the iREV-T tool; and presented recommendations for integrating AFVs into the community’s future emergency plans. NASEO is also working with partner organizations IAEM and NGA to incorporate information and tools from iREV into a Course Package that will be used by their members in the years ahead. This Course Package presents informational materials from the project that are tailored to each audience, and is being worked into each organization’s educational curriculum. NASEO is also finalizing a series of short issue briefs aimed at specific audiences. In addition to the activities listed above, NASEO, in partnership with project partner the Vermont Energy Investment Corporation (VEIC), has developed a Volkswagen Settlement Beneficiary Mitigation Plan Toolkit for state agencies to reference as they develop their Beneficiary Mitigation Plans under the Volkswagen (VW) settlement. The VW settlement provides $2.9 billion to states, territories and Indian Tribes to invest in vehicle retrofit or replacement projects, and is an unprecedented opportunity to support AFV adoption. The Toolkit is a go-to document for states that also provides information on how funding from the settlement may be used to enhance resiliency through the adoption of AFVs. The Toolkit has been widely referenced by state agencies, and is linked to or referenced on numerous states’ VW Settlement websites. NASEO has also provided significant technical support to states and Clean Cities Coalitions on the VW Settlement, continuing to discuss ways the settlement may be used to enhance resiliency. NASEO, in partnership with the National Association of Clean Air Agencies (NACAA) launched the NASEO & NACAA VW Clearinghouse, a one-stop shop for stakeholders for information on the settlement. NASEO will continue to provide support to states and Clean Cities Coalitions in the coming months.
Conclusions NASEO will be finalizing remaining deliverables by the end of the 2017 calendar year. Several key findings resulted from this project:
1. Education for new audiences is needed. Through the iREV workshops, exhibiting at emergency management conferences and through ongoing engagement with emergency managers, NASEO and the iREV project partners have discovered that the emergency management community is largely unfamiliar with alternative fuels and has not considered them as an asset to emergency planning. There is

Technology Integration
26 Alternative Fuel Vehicle Initiatives
significant opportunity to further engage this community, provide them with basic information on alternative fuels, and discuss ways that AFVs can be used during emergencies.
2. Generator data is needed for AFV infrastructure locations. Emergency managers and other stakeholders were intrigued by the iREV-T and expressed interest in using the tool for their emergency planning exercises. However, iREV-T users repeatedly asked if the AFV infrastructure data noted whether a backup generator was available at specific locations. Without backup generators, stations would not be available during power outages, and emergency managers would not be able to rely on those stations for use during emergencies. Moving forward, AFV infrastructure data should note whether a generator is available on-site.
3. There is significant interest in, and opportunity for, integrating AFVs into emergency plans. A number of states and communities expressed interest in launching an “iREV Pilot” in their jurisdictions. Due to resource constraints, NASEO was initially able to work with only two jurisdictions, but is hoping to further engage other communities to help them build resiliency through the use of AFVs. The two pilot jurisdictions selected for the project were ready partners and have been open to the recommendations suggested in the Policy and Planning Toolkits. NASEO is optimistic that the pilot communities will adopt these recommendations in future iterations of their emergency plans. This readiness also signifies that additional communities may be interested in including AFVs in future planning processes. In a parallel initiative, NASEO has been working with several states to integrate AFVs into their state Motor Fuel Contingency Plans and other energy assurance efforts. NASEO will continue to work with these states and other interested communities to provide information on AFVs and their importance in emergency planning in the months ahead.
References [1] https://irev.ctc.com/Account/Login?ReturnUrl=%2FProtected%2FMap.aspx
Key Publications Powers, C., Biodiesel Fueled Vehicles and Emergency Response. June 2016. http://naseo.org/data/sites/1/documents/publications/iREV%20Biodiesel%20Case%20Study.pdf Powers, C., Electric Vehicles and Emergency Response. June 2016. http://naseo.org/data/sites/1/documents/publications/iREV%20EV%20Case%20Study.pdf Powers, C., Natural Gas Vehicles and Emergency Response. June 2016. http://naseo.org/data/sites/1/documents/publications/iREV%20Natural%20Gas%20Case%20Study.pdf Powers, C., Propane Vehicles and Emergency Response. June 2016. http://naseo.org/data/sites/1/documents/publications/iREV%20Propane%20Case%20Study.pdf Horton, R., Baseline Assessment: Alternative Fuel Vehicles in State and Municipal Emergency Operations Plans. December 2016. http://www.naseo.org/data/sites/1/documents/publications/iREV_BaselineAssessmentMemo_Final.pdf Malmgren, I. and Cassie Powers, Volkswagen Settlement: Beneficiary Mitigation Plan Toolkit, March 2017

FY 2017 Annual Progress Report
Alternative Fuel Vehicle Initiatives 27
I.6 Alternative Fuel Vehicle Demonstration and Enhanced Driver Experience (Penske Truck Leasing Co., L.P.)
Dean Stapleton, Principal Investigator Penske Truck Leasing Co., L.P. 2675 Morgantown Road Reading, PA 19607 Phone: (610) 796-5256 E-mail: [email protected]
Mark Smith, Program Manager U.S. Department of Energy Phone: (202) 287-5151 E-mail: [email protected] Start Date: July 15, 2015 End Date: July 14, 2018 Total Project Cost: $814,701 DOE share: $400,000 Non-DOE share: $414,701
Project Introduction Penske Truck Leasing Co., L.P. (Penske) is deploying a targeted alternative fuel vehicle (AFV) demonstration project that allows new drivers and fleets to "try out" cost-effective and clean-burning heavy-duty AFVs via Penske's rental services. All of the project vehicles run on compressed natural gas (CNG). The demonstration units provided by Penske are 2015 Freightliner Cascadia 113” tandem axle day cabs. One CNG unit is available at each of the demonstration locations (Baltimore, MD; Baton Rouge, LA; and Neenah, Wisconsin). The vehicle specifications are provided to participants, and are shown in Table I.6.1, below.
Table I.6.1: Freightliner Cascadia 113” Specifications MPG 5.0-5.5
Chassis Weight 17,397 lbs. Range 490-539 miles, 115 DGE Engine Cummins ISX 12G 11.9L 400HP 1450 lb/ft torque
Transmission Allison automatic 4000HS 6-speed or manual Wheelbase 192”
Turning Radius 28’ 0” Overall Added Length 25” for back of cab tank monitoring
The project directly supports the goals of the Vehicle Technologies Office by demonstrating a cutting-edge alternative transportation program that ultimately reduces reliance on imported petroleum and lowers greenhouse gas emissions, while potentially providing overall operational savings. The project is a hands-on, high impact, highly innovative AFV demonstration in American-based fleets that is designed to increase the acceptance of alternative fuels and spur the market for AFVs. Penske’s commitment to a highly visible, widespread demonstration will send a strong signal to tens of thousands of U.S. fleets that AFVs are critical to the rapidly evolving transportation sector. In a market study completed by project partner Gladstein, Neandross & Associates (GNA), an overwhelming 84% of the fleets currently using CNG anticipated increasing their use of natural gas in the future. These findings strongly suggest that the key to a self-sustaining, thriving AFV market is fleets using the technology in everyday operations.

Technology Integration
28 Alternative Fuel Vehicle Initiatives
The project will generate success stories based on the fleets that are participating in the full-service AFV demonstration. As fleet managers often rely heavily on the experiences of their peers, these successes, along with the resulting data and expanded AFV knowledge among local technicians and fleet managers, will amplify the project’s impacts, contributing towards broader regional acceptance of AFVs. The main projects partners are GNA and the Clean Cities coalitions located closest to the Penske branches offering the rental program: Wisconsin Clean Cities, Louisiana Clean Fuels, and the Maryland Clean Cities Coalition (managed by the Maryland Energy Administration).
Objectives The demonstration’s technical objective is to accelerate the market penetration of AFVs, through rentals in three strategically selected geographic areas. The project leverages Penske’s existing CNG fueling infrastructure and maintenance garages to enable successful demonstrations that will lead to long-term AFV adoption, an increase in the use of domestically produced fuels, and overall cost savings for fleets. Despite major advances in the technology and an increase in the adoption of AFVs, Penske has seen first-hand the challenges faced by some customers as they try to integrate AFVs into everyday operations. These fleets face issues including determining the proper vehicle specifications, understanding if and when AFVs are operationally compatible, financing the high incremental cost of AFVs, and learning how to use the vehicles to maximize benefits. Another project objective is to address the market barriers to introducing AFVs in regions with high potential for using alternative fuels, but where fleets do not traditionally use AFVs in their daily operations. Penske has taken a comprehensive approach that brings together AFV marketing, demonstration, customer support, data analysis and education. This approach will enable Penske to pursue a more aggressive strategy to target potential AFV fleets and ultimately lead to cost savings for American fleets.
Approach The specific project areas are the regions of Neenah, Wisconsin; Baltimore, Maryland; and Baton Rouge, Louisiana. Penske is providing the equipment and facilities used for the project, including Penske's garages, all of which are AFV-capable. Over the past four years, Penske has developed processes at each of the proposed sites for the safe maintenance of natural gas vehicles (NGVs). With over 25 years of experience with alternative fuels, all vehicle maintenance for the program is completed by Penske mechanics; for fleet managers and drivers, Penske provided a video, participant handbook and brochure with operating guidelines and vehicle information, as well as contact information for any questions or concerns. Penske’s approach was formed to directly address the common barriers to adoption of AFVs. Penske developed a proactive marketing plan to target the most probable fleets, provide comprehensive technical support, educate fleets about AFV benefits, and finally to measure progress of acceptance and integration of AFVs into fleet operations. An example of the rental flow is as follows:
1. Penske creates and shares marketing and education materials with Clean Cities coalitions 2. Clean Cities coalitions distribute the materials 3. Customers contact local Penske branch location 4. Penske qualifies the customer 5. The unit is rented and returned 6. The customer completes the follow up survey 7. Penske follows up as needed and possibly requests a case study
The project is being conducted in three 1-year budget periods that are generally aligned with the major go/no go decision points. Budget Period 1 saw the data analysis of existing Penske customers, customer need

FY 2017 Annual Progress Report
Alternative Fuel Vehicle Initiatives 29
classifications, applications, and infrastructure, to begin deployment of AFVs in the targeted regions. This phase also included the creation of marketing and educational materials, as well as the beginning of an email marketing campaign and partnership efforts. In Budget Periods 2 and 3, demonstrations of the AFVs in the targeted geographies were initiated, and surveying, data collection and training efforts have ramped up. Penske has distributed follow-up surveys to the participating fleets and will use this information to create at least three case studies of findings and lessons learned. Penske’s partner, GNA, will work with Penske’s marketing team to assemble the case studies, which will be shared with the Clean Cities coalitions, for distribution. The Clean Cities coalition partners provide direct outreach to prospective fleets. During monthly calls, Clean Cities partners provide suggestions on how to grow and promote the program, as well as updates from visiting and meeting with their local Penske branch. GNA organizes the monthly check-in calls and acts as project manager for the demonstration project. Examples of GNA’s tasks include: quarterly report and invoice preparation, development of email campaigns, and coordination with Clean Cities coalitions, Penske branch staff, and prospective customers.
Results During year one, Penske built relationships with Clean Cities coordinators in each of the three selected locations. Penske conducted preliminary research on AFVs, infrastructure, and potential users, to lay the groundwork for a successful demonstration program.
Figure I.6.1: CNG Vehicle Rental Program Participant Handbook for Neenah, WI (Source: Penske Truck Leasing Co., L.P.)
During year two, Penske created materials, including a Participant Handbook (see Figure I.6.1), to introduce consumers to AFVs and equip them with information, to ensure a successful rental experience.

Technology Integration
30 Alternative Fuel Vehicle Initiatives
Penske utilized several channels externally and internally to increase program awareness with consumers and to train local sales teams at each branch. These channels enabled Penske sales team members to share program details and allowed fleets within a 200 mile radius of each Penske location to passively receive information about the program. Fiscal year 2016 (FY16) was focused on setting up the rental program, while FY17 focused on marketing and increasing rental numbers. This focus will carry over into FY18, with the addition of developing case studies and identifying other opportunities to share the program’s successes. Table I.6.2 displays the anticipated and actual completion dates of the project’s milestones.
Table I.6.2: Project Milestones and Descriptions with Anticipated and Actual Completion Dates
Milestone Description Anticipated Completion
Date
Actual Completion Date
Map Finalize and vet local infrastructure map 1/2016 3/2016
AFV Market Assessment
Market assessment completed 3/2016 3/2016
Identify AFVs Create list of AFVs to be used for the project 4/2016 4/2016
Select Fleets Finalize selections; list submitted to DOE 4/2016 6/2016
Demonstrations 50% demonstrations complete 12/2016 TBD
Case Studies Complete case studies based on initial demonstrations
Q1 2017 TBD
Demonstrations 100% demonstrations complete 07/2017 TBD
Outreach Conduct webinar or speak at industry events(s); press releases issued and all content posted on website
Q2 2017 TBD
Penske offers services to almost every industry, but it typically targets the following customers: bottled and canned soft drinks; groceries; manufacturing industries; owner-operation (individual); and roasted coffee. In April 2017, GNA used the FleetSeek database used to gather information on fleets within a 200 mile radius of each project location. This resulted in over 58,000 real contacts of fleet owners and operators. GNA used this contact list to launch a highly automated email campaign utilizing Eloqua that encourages responses by: • Emailing again with a different subject line within five days of the first email, if the first email was never
opened or deleted • Emailing again, with a different subject line and the same content, within five days of the first email, if
the first email was opened • Emailing again within five days of the first email, if the email was opened and the contact us form was
clicked on but not filled out Penske anticipates re-using this tool to remind fleets of the program and to generate new interest from recently added or updated contacts. Initially, rental periods were intended to range between 30 and 90 days. As a response to customer feedback, the rental period requirement was removed, and this led to a significant increase in interest in the program, and activity. To date, 28 demonstrations have occurred. The units arrived at each location in late 2016 and early 2017. Three out of the 28 demonstrations took place in 2016; the remaining 25 occurred in 2017. Due to a dramatic increase in activity after the removing of the rental length requirement, Penske anticipates completing 30 additional demonstrations by July 2018.

FY 2017 Annual Progress Report
Alternative Fuel Vehicle Initiatives 31
Penske’s key accomplishments to date include completing key data analysis and building strong relationships with the local branch locations and Clean Cities coalitions. The Neenah, Wisconsin branch has seen the most activity, compared to the other two branches. One of the Neenah renters converted into a long-term lease, and there are other potential leases pending in Wisconsin as a result of the program. Furthermore, as a result of the automated email campaign released in April 2017, over 20 new fleets have indicated interest in the program.
Conclusions The project began in July 2015 and is expected to end on July 15, 2018. The key challenges to date include a slow start due to market conditions, delays in vehicle demonstration unit deliveries, and a lack of interest in taking the units out for longer than a few days at a time. As alternative fuels work to gain traction in a diesel-dominated industry, Penske, GNA, and the Clean Cities coalitions are working diligently to drive interest to the program. Penske also found through the email campaign that there is a lot of interest outside of the pilot areas, and that some of the Penske branch locations themselves have more interest in AFVs than others. Penske’s approach to facing these challenges has included conducting outreach now, as a precursor for growth into other areas, requesting and receiving approval for shorter rental periods, building on the collaboration with Clean Cities and Local Motor Carriers, and conducting automated email campaign efforts. Looking forward, Penske anticipates completing a total of 60-80 demonstrations before July 2018. As CNG prices remain stable, and diesel prices fluctuate, Penske anticipates interest in CNG will continue to increase. As rentals are completed, customer survey information is collected, which allows Penske to aggregate data on each customer’s experience. These items move Penske towards achieving its overall goals of exposing fleets to AFV operations with lower upfront costs, and increasing the integration of AFVs into fleets that currently utilize long-term leases for traditionally-fueled vehicles.
Key Publications CNG Vehicle Rental Program Participant Handbook, available upon request via email, or at the Neenah, Wisconsin; Baltimore, Maryland; or Baton Rouge, Louisiana Penske branch locations.

Technology Integration
32 Alternative Fuel Vehicle Initiatives
I.7 Safe Alternative Fuels Deployments in Mid-America (SAF-D): A Combined AFV and Fire and Rescue Training Initiative (Metropolitan Energy Center)
Kelly Gilbert, Principal Investigator Metropolitan Energy Center, Inc. 3810 Paseo Blvd Kansas City, MO 64109 Phone: (816) 531-7283 E-mail: [email protected]
Dennis Smith, Technology Manager U.S. Department of Energy Phone: (202) 586-1791 E-mail: [email protected] Start Date: July 1, 2015 End Date: July 31, 2017 Total Project Cost: $312,420 DOE share: $250,000 Non-DOE share: $62,420
Project Introduction There is an evolving body of work available to fire service professionals regarding how to safely respond to incidents involving alternative fuel vehicles (AFVs), such as those that operate on biofuels, natural gas, propane, and electricity; however, Fire and Rescue Training Institutes in Missouri and Kansas (the Institutes) felt strongly that there were some important gaps that needed to be addressed. Retail-priced training systems can be cost-prohibitive for local fire departments and state fire & rescue institutes, and rigid 12- to 16-hour training systems don’t allow the flexibility necessary for volunteer and rural fire departments to participate. Online training resources must be developed for those hard-to-reach departments. Our project, “Safe Alternative Fuel Deployments—a Combined AFV and Fire & Rescue Training Initiative”, tackled these issues by developing and providing low cost training options, for integration into existing state fire training institutions. These resources are made available nationwide through the North American Fire Training Directors (NAFTD) association. The project team consisted of representatives of the Institutes, staff of Metropolitan Energy Center, the DOE Project Manager, and representatives of FS Circle Solutions, the subject matter experts hired to assist in developing the curriculum.
Objectives At the conclusion of this project, the Institutes will have a curriculum and instructional materials to effectively provide classroom training in AFV safety. At least 20 instructors in the two-state area will be equipped to conduct training on AFV safety. The online alternative fuel training resource will be publicly available. The Institutes will have relationships and access to resources to update information as needed. At least 50 first responders will have received direct training. In addition, the training results will be demonstrated to stakeholder groups in the Kansas City Regional and Central Kansas Clean Cities Coalitions, introduced to Clean Cities stakeholders across the North Central Clean Cities Region and offered to the national body of fire training directors through NAFTD.
Approach A key principle of the project was to ensure that the end product meets the needs of fire fighters by working with an advisory committee that includes representatives from state fire training systems across the U.S., local fire fighters, and national experts in alternative fuel safety. FS Circle Solutions drew in experienced fire

FY 2017 Annual Progress Report
Alternative Fuel Vehicle Initiatives 33
services personnel from around the country as an advisory committee at key moments during the curriculum development process. Kansas Fire & Rescue Training Institute (KFRTI) developed the curriculum and holds the copyright. Project team members met once per month by conference call through June 2017 to discuss and review the development of the training curriculum, including approach; scope and limitations of the classroom course; scope and limitations of media in the training materials; roles; and production schedule. In addition, the project team and advisory committee held two 1.5-day meetings to discuss in detail the project schedule and curriculum planning process, and to review the draft curriculum materials. The team determined that two 4-hour training modules were needed for fire fighters: one for basic alternative fuel safety considerations, including how to determine where AFVs are operated in their community; and one to guide incident response. Both use incident video to assist understanding and to generate conversation and participation in the classroom. The Institutes piloted draft classroom curriculum with fire fighters and instructors from Kansas and Missouri, along with members of the advisory committee, to refine the instruction materials. A final draft was reviewed and further refined by DOE. Both institutes provided train the trainer instruction. The final classroom materials were adapted to the Blackboard online learning system, which can be exported for use by the Moodle online learning system. Along the way, Glenn Pribbenow, Director of the KFRTI, invited NAFTD members to participate. Project team members presented to the NAFTD national conference in September 2016, and invited members to attend the train the trainer instruction, and to download the training materials for use within their institutes. The materials included a letter of introduction and explanation regarding the online course.
Results Classroom curriculum and materials are available to instructors for download, and the final course is available to fire fighters. The Instructor package is available for download upon request from KFRTI. It includes a Microsoft PowerPoint slide deck, an instructor guide in PDF and Microsoft Word, and embedded images and video (see Figure I.7.1).
Figure I.7.1: Cover and excerpts from classroom course Instructor Guide (University of Kansas, Kansas Fire and Rescue Training Institute)

Technology Integration
34 Alternative Fuel Vehicle Initiatives
Firefighter instruction is available upon request from KFRTI, and the Missouri Fire Training Institute will offer the training as a part of its regular course schedule (see Figure I.7.2).
Figure I.7.1: PowerPoint slides for Incident Response Module, Lesson 2 and Lesson 3 (University of Kansas, Kansas Fire and Rescue Training Institute)
The project team originally sought to use an online learning platform that would work for a majority, or at least a large number, of training institutes across the U.S.; however, through a survey, it became apparent that a wide variety of platforms are used nationwide. As a result, the project team decided to build the online course on the system in use by KFRTI (Blackboard). KFRTI’s files may also be exported for use in Moodle, another popular online learning system, upon request. The course is available for training to Kansas fire fighters Through the program, the Institutes trained instructors in Missouri and Kansas and provided classroom trainings to fire fighters, both to pilot the training, and after the classroom training was finalized in January 2017. • Instructors trained: 28 • Fire fighters trained: 60
See Figure I.7.3.

FY 2017 Annual Progress Report
Alternative Fuel Vehicle Initiatives 35
Figure I.7.2: Jeremy Moore, co-founder of FS Circle Solutions, giving instruction during the Kansas pilot training session to KFRTI instructors and fire fighters, and to the project team. (Photo credit: David Albrecht)
Conclusions KFRTI collected course evaluations during train the trainer instruction as well as from fire fighters. In response to course evaluations organized on a 5-point Likert scale, the weighted mean score from instructors for the AFV Awareness class was 3.0; the weighted mean score for the Incident Response course was 3.2. Fire fighters from Coffeyville, Kansas, a southeastern city on the border with Oklahoma, evaluated the course and presentation with a weighted mean score of 3.34, ranking between Agree and Strongly Agree (that the training was effective). Fire fighters from Anthony, Kansas, a city in south central Kansas of just over 2,000 citizens, gave it a weighted mean score of 3.13. When asked which parts of the presentation were most beneficial, participants responded that it was all helpful. They found that learning about AFVs in general, and about hybrid-electric vehicles, in particular, was helpful. When asked which parts of the presentation were least beneficial, some said that the presentation was a bit repetitive, and some said learning about propane (LPG) was least helpful. When asked on which topics they would like to see additional training delivered, respondents frequently requested more training on electric vehicles and hybrids. They also requested that there be a hands-on component to the training, with actual AFVs present. Lessons Learned • To make the biggest impact, it is essential that training about AFVs is integrated into existing training
protocols for decision-making in critical incidents. Ultimately, the more technical insights regarding fuel properties and vehicle technology, while interesting to the students, must culminate in answers to the question, “if you are faced with this situation on the highway, what do you do?”
• Rural and volunteer fire departments are hungry for any information. In the participant evaluations for the two rural fire departments at which the training was conducted, when asked what additional training they would like to see in this area, some respondents said, “Just more training in general” would be helpful.

Technology Integration
36 Alternative Fuel Vehicle Initiatives
• There is no standard software for online training in fire departments or fire training institutes; instead a number of formats are in use. This presents a challenge for the development of shareable online curricula, necessitating either additional resources to make the training available in a variety of platforms, or acceptance that the training will only reach part of the potential market.
• Obtaining permissions for the use of images and videos that may be searched and downloaded from the web is a painstaking but essential part of the work to ensure that the end products can be shared without future copyright or trademark challenges.
• It is critical to embed video or web content in classroom materials, as compared to providing live links, particularly for use in rural communities that may not have reliable internet access.
References [1] https://www.enrole.com/kupce/jsp/course.jsp?categoryId=10014&courseId=AFV [2] https://www.enrole.com/kupce/jsp/session.jsp?sessionId=FF18073O&courseId=AFVOL&categoryId=10014
Key Publications Introduction to Alternative Fuel Vehicle Safety and Alternative Fuel Vehicle Incident Response Copyright © by Kansas Fire & Rescue Training Institute at the University of Kansas. Alternative Fuel Vehicle Safety & Response (Online course). Because the online course is currently only available on a KFRTI learning site that is monitored for unauthorized users, only active Kansas Fire fighters may register for it. If you are not an active Kansas Firefighter, contact the Institute at [email protected] or call the toll-free phone number (866-804-8841) to request special permission to take this class. Enrollments are monitored daily and unauthorized (non-Kansas fire fighters) will be removed from the course and their registration fee refunded.

FY 2017 Annual Progress Report
Alternative Fuel Vehicle Initiatives 37
I.8 Plug-In Hybrid Electric Vehicle Demonstration Program and Social Media Campaign (ASG Renaissance)
Lizabeth Ardisana, Principal Investigator ASG Renaissance 22226 Garrison Dearborn, MI 48124 Phone: (313) 203-3030 E-mail: [email protected]
Debra Salem, Principal Investigator ASG Renaissance 22226 Garrison Dearborn, MI 48124 Phone: (313) 203-3032 E-mail: [email protected]
Mark Smith, Technology Manager U.S. Department of Energy Phone: (202) 287-5151 E-mail: [email protected] Start Date: July 1, 2015 End Date: July 1, 2017 Total Project Cost: $958,367 DOE share: $450,000 Non-DOE share: $508,397
Project Introduction In the last five years, there has been a seismic shift away from traditional forms of consumer marketing and advertising, toward the use of interactive, experiential marketing and social media. According to a recent study by Dealer.com, 38 percent of new vehicle shoppers have used or will use social media to research their next vehicle purchase. Of the 15.6 million vehicles sold in the U.S. last year, this equates to 5.9 million vehicle sales that were influenced by social media networks – or more vehicles than the top 15 best-selling nameplates sold last year combined. Among vehicle purchasers who used social media while shopping, 41 percent said they saw a post that caused them to add a brand or model to their consideration [1]. In its 2014 Social Media Benchmark Study—Auto, JD Powers found that one-fifth of consumers use social media as their primary source of information about automotive brands, and nearly one-third of social media users get recommendations about a product or service from friends and family exclusively through social media [2]. While automotive original equipment manufacturers (OEMs) have increased their attention to social media, there have been few attempts to use social media to promote the use and sale of alternative fuel vehicles (AFVs) – specifically electric vehicles (EVs) and plug-in hybrid electric vehicles (PHEVs) – aside from grassroots programs coordinated by organizations such as Plug-in America and Sierra Club. The Plug-In Hybrid Electric Vehicle Demonstration Program and Social Media Campaign sought to leverage the power and influence of social media to create greater awareness of PEVs and a better understanding of their benefits, and to ease individuals’ minds regarding their risks/downsides. The project directly engaged “social media influencers,” individuals who have access to a large on-line audience, and who have the ability to influence the behavior or opinion of others, to promote the use of PHEVs.

Technology Integration
38 Alternative Fuel Vehicle Initiatives
ASG partnered with Empire Clean Cities (New York), New York City Department of Transportation (NYCDOT), Massachusetts Clean Cities Coalition, New Jersey Clean Cities Coalition, Eastern Pennsylvania Clean Cities, Greater Washington Regional Clean Cities Coalition and the Ford Motor Company to develop and execute the program.
Objectives The program’s primary objective was to create and implement a high impact and highly innovative approach to increasing the acceptance and deployment of PHEVs. Rather than conducting an advertising or communications campaign that originated from a government, corporate or other organizational authority, the program directly engaged social media influencers, and put each of them in the driver’s seat of a PHEV, for either a one month or five month demonstration period. Those influencers were then able to share their first-hand experiences across their social media channels, as part of a campaign dubbed “Driving on Energi.” The program was designed to raise customer awareness regarding the availability, practicality and benefits of PHEVs in several key Northeastern markets, and to dispel the myths about the downsides of PHEVs. Other program objectives included: • Securing 50 or more social media influencers to take part in one month and five month PHEV loans • Securing 400 or more pieces of social media content over the two-year duration of the program • Reaching an estimated four million people through social media • Securing 200,000 total program views • Securing 100,000 total program engagements • Reaching a total media value of $450,000
Approach In collaboration with the program partners, ASG was responsible for the overall program design, which included identifying and defining the program goals, expectations and requirements for the social media influencers. ASG also developed an online application submission process and evaluation criteria for selecting the participants, and created the program evaluation metrics. ASG was responsible for overall program management, which included interfacing with the various partners, securing and on-boarding the social media influencers, managing the logistics and timing of vehicle deliveries and returns, and managing digital content. ASG developed a dedicated program website (http://www.drivingonenergi.com), and maintained it throughout the duration of the program. The website housed specific data regarding EVs, and aggregated the content submitted by the social media influencers. This site also linked to other high profile EV/AFV websites such as MissionElectric.org, GoElectricDrive.org and AutoBlogGreen.com. Additionally, ASG developed and maintained multiple social media pages on Facebook (www.facebook.com/drivingonenergi), Twitter (https://twitter.com/drivingonenergi) and Instagram (www.instagram.com/drivingonenergi). The program managers monitored all of the social media influencers’ posts throughout the program and commented, retweeted, and shared the content across the program’s social media platforms. During the first year, Ford Motor Company provided ten Model Year 2015 (MY15) PHEVs, consisting of five CMAX Energis and five Fusion Energis, as loans, for a series of month-long extended test drives. The ten vehicles were rotated among 50 social media influencers throughout the year. In year two, Ford provided five MY16 PHEVs, a mix of CMAX Energis and Fusion Energis, as loans, for two rounds of five-month extended test drives. The demonstration vehicles were placed in targeted markets, in northeast states that had adopted the California Zero Emission Vehicle (ZEV) program, but where EV sales had been lower than anticipated.

FY 2017 Annual Progress Report
Alternative Fuel Vehicle Initiatives 39
These markets included Connecticut, Maryland, Massachusetts, New Jersey, New York, Rhode Island and Vermont. To identify the social media influencers, ASG used Tap Influence, a web-based software as a service (SaaS) program that connects brands with digital content creators. This software tool enabled ASG to recruit and collaborate with the social media influencers, create content assignments, and schedule the assignments, to ensure that the social media influencers worked in concert with the campaign. Additionally, the software tool measured the effectiveness of the campaign by tracking generated content and clicks, real-time performance, top performance, and total media value, including social media insights. In addition to using the Tap Influence tool, potential participants were also able to submit an online application, developed by ASG, to be considered for the program. ASG looked for the following characteristics when selecting the social media influencers: • Men and women, 25-60 years of age • A mix of married and single participants • Car owners and homeowners • An affinity for protecting the environment • Technology enthusiasts • Geography (Lives in or near Boston, New York, New Jersey, Philadelphia, or Washington DC) • A social media reach exceeding 10,000 followers
Using the Tap Influence platform, the program managers extended invitations to participate in the program to potential social media influencers. If the invitation was accepted, ASG began the onboarding process. For Year 1, onboarding included providing the social media influencers with information on the cars, introducing them to the local Clean Cities coordinator, and fulfilling program legal requirements. Most of the contact between the project team and the social media influencers during this stage was via phone calls and emails. Due to vehicle insurance requirements, the social media influencers were required to become part-time employees of ASG Renaissance for the duration of the vehicle loan, and ASG provided insurance coverage. Once a social media influencer was approved to drive, ASG mailed him or her a packet of information containing key messaging, infographics on hybrid performance and maximizing hybrid efficiency, and information on either the Ford C-Max Energi or Fusion Energi, whichever was assigned, to assist in drafting social media content. The social media influencers were each paid a $500 stipend for their participation. Empire Clean Cities focused on the deployment and management of the loaner vehicles, as well as coordinating the efforts with other Clean Cities coalitions in Boston, Philadelphia, New Jersey and Washington DC. Year One During Year 1, the social media influencers were required to create one blog post with two photos featuring the car, or a YouTube video and seven pieces of shared content, which could be any combination of Facebook, Twitter or Instagram posts. Additionally, they were required to post or share at least twice per week during the one-month duration of the vehicle loan. Year Two During the second year of the program, the project team held two, in-person, Driving on Energi immersion events, to provide the social media influencers with background information about plug-in hybrid electric vehicles as well as information about programs to encourage hybrid electric vehicle (HEV), PHEV and EV use in the region. For the first group of second year social media influencers, the half-day immersion event was held at the NYCDOT headquarters, on August 5, 2016. Event attendees included representatives from

Technology Integration
40 Alternative Fuel Vehicle Initiatives
NYCDOT, ASG Renaissance, Ford Motor Company, Empire Clean Cities, CALSTART and the five social media influencers chosen for the first round. The immersion event included a general overview of the program, as well as important safety information such as No Texting While Driving! The event also included information about PHEV technology and benefits. Ford regional office personnel did a vehicle walk-around with the social media influencers, demonstrating the features of the vehicle and answering questions. A similar event was held at the Ford Eastern Regional Office in Mahwah, New Jersey on January 11, 2017 for the second round of year two social media influencers. For Year 2, ASG modified the social media influencer requirements. They were required to create 80 pieces of shared content, which was any combination of Facebook, Twitter, Instagram, YouTube or blog posts. They also had to post original content a minimum of four times per week, and share at least twice per week during the five-month duration of the loan.
Results During the two-year project period, the Plug-In Hybrid Electric Vehicle Demonstration Program and Social Media Campaign accomplished several of the overall program metrics that were set during the planning stages. In the first year of the program, four of the program metrics were met, exceeding the total program goals. Key metrics included program reach, which was based on the number of followers the social media influencers had; program views, which included people who saw the social media posts, but did not interact with them; and program engagement, which was the number of people sharing information, through their own social media accounts. The metrics for Year 1 of the program are outlined in Table I.8.1.
Table I.8.1: Year 1 Program Metrics TASK PROGRAM GOAL RESULT
# of Influencers 50+ 59 # of Content Pieces 400+ 767 Total Program Reach 4 million 6.2 million Total Program Views 200,000 751,000 Total Program Engagement 100,000 15,000
(2.00%) Total Media Value $450,000 $ 212,771
As shown in Table 1, total program engagement and media value in the first year did not meet the original target goal. The initial goal of 50% engagement relative to program views, versus the industry average of 2% was unrealistic. For Year 1, the total media value was $212,771 versus a goal of $450,000. To increase this number, ASG engaged social media influencers with larger followings during Year 2 of the program. The metrics for year two of the program are outlined in Table I.8.2.
Table I.8.2: Year 2 Program Metrics TASK PROGRAM GOAL RESULT
# of Influencers 50+ 10
# of Content Pieces 400+ 555 Total Program Reach 4 million 18 million Total Program Views 200,000 1.8 million Total Program Engagement 100,000 32,000 Total Media Value $450,000 $454,244

FY 2017 Annual Progress Report
Alternative Fuel Vehicle Initiatives 41
The overall metrics at the conclusion of the program are outlined in Table I.8.3.
Table I.8.3: Overall Program Metrics 2015-2017 TASK PROGRAM GOAL RESULT
# of Influencers 50+ 69 # of Content Pieces 400+ 1322 Total Program Reach 4 million 24.2 million Total Program Views 200,000 2.6 million Total Program Engagement 100,000 47,000
(2.00%) Total Media Value $450,000 $667,015
Number of Social Media Influencers Using Tap Influence, ASG successfully recruited 59 social media influencers for the Year 1 one-month assignments, in the target regions of New York, New Jersey, Philadelphia, Washington DC and Boston. ASG recruited 10 social media influencers for the Year 2 five-month assignments, from New York, New Jersey and Connecticut. In addition to using the online tool, ASG used the Driving on Energi website to recruit social media influencers. These applicants were vetted, and if they met the program criteria they were on-boarded. In all, approximately 15 people submitted applications through the website and were considered for the program. The ones that were accepted are included in the overall number of social media influencers above. Content Pieces During the Year 2 five-month loan, the social media influencers were required to create 80 pieces of original content, which could be any combination of Facebook posts, Twitter Tweets, Twit pics, Instagram, YouTube and Google+ posts. Social media influencers were encouraged to include photos of the vehicles, such as showing it charging it at home or in public. The initial program goal was to obtain 400 content pieces across Facebook, Twitter, and Instagram, which were the platform priorities during the program. The program exceeded the goal of 400 posts, with the 10 social media influencers developing 583 content pieces during the second year of the program. Instagram, Facebook and Twitter were the primary social media channels used for the program, with some influencers also posting to Goggle+, YouTube, Vine and Pinterest. See Table I.8.4.
Table I.8.4: Total Content Pieces Platform # of Content Pieces
Twitter Posts 258 Facebook Posts 120 Instagram Posts 128
Google + 36 YouTube 8
Blog Posts 15 Vine 3
Pinterest 15 Total 583
Program Reach The program goal for total reach was 4 million. The program successfully reached this goal in the first year, and continued to improve during the second year, reaching 18 million. Table I.8.5 highlights reach by social media platforms.

Technology Integration
42 Alternative Fuel Vehicle Initiatives
Table I.8.4: Total Program Reach Platform Total Program Reach
Twitter Posts 14 million Facebook Posts 1.3million Instagram Posts 1.4 million
Google + 64,000 YouTube 36,000
Blog Posts 12,000 Vine 0
Pinterest 0 Total 18 million
Program Views The initial goal of reaching 200,000 program views was exceeded during Year 1 of the program, and continued to improve to 1.8 million views during Year 2. Total number of views at the conclusion of the program was 2.6 million. See Table I.8.6.
Table I.8.5: Total Program Views Platform Total Program Views
Twitter Posts 967,000 Facebook Posts 88,000 Instagram Posts 702,000
Google + 1,000 YouTube 1,000
Blog Posts 73,000 Vine 0
Pinterest 0 Total 1.8 million
Program Engagement During the first year of the program, the goal for program engagement was 100,000. This metric was not reached during the first year of the program, nor was it reached during year two. The social media influencers were required to post more content during Year 2; however, the engagement level went down. This indicated that the type of content being posted was not engaging enough for the audience to comment on and share it. Instagram was the leader in number of posts and engagements. Posts that included photos had higher engagement rates. See Table I.8.7.
Table I.8.6: Total Program Engagement Platform Total Engagement
Twitter Posts 3,000 Facebook Posts 4,000 Instagram Posts 13,000
Google + 108 YouTube 1,000
Blog Posts 7,000 Vine 0
Pinterest 13 Total 28,121

FY 2017 Annual Progress Report
Alternative Fuel Vehicle Initiatives 43
Conclusions The Plug-In Hybrid Electric Vehicle Demonstration Program and Social Media Campaign (Driving On Energi) was successful in meeting and exceeding many of the program goals. The use of Tap Influence, an online software as a service, facilitated the recruitment of social media influencers, based on program requirements. The Clean Cities partners provided support to coordinate vehicle deliveries transitions. Lessons Learned • Insurance requirements created significant on-boarding challenges and paperwork burden, resulting in an
approximately 50% drop rate. • Short vehicle loan periods and administrative “churn” led to similar posts without a lot of creativity. • The Clean Cities coordinators were responsible for coordinating vehicle exchanges; however, it was
difficult to control the transitions, and because of commitments by both parties, transitions between the coordinators and the next round of social media influencers were often delayed.
• The level of explanation and information provided to the social media influencers was unclear, and varied from city to city. This issue was addressed in Year 2, by holding an immersion event for all social media influencers, at the beginning of the 5-month loan period. The event included educational handouts about the specific car, PHEVs in general, key messaging, etc.
• The management and tracking of requirements for the social media influencers should be improved. Recommendations • Shorten the onboarding process, and reduce the amount of paperwork required. • Provide better guidance to social media influencers on crafting content. Influencers with a larger social
media following may be more creative in developing content. • Recommendations: Identify a central location in each city for the pick-up and delivery of vehicles.
Assign a dedicated program representative who is able to prepare the car (wash, clean and inspect car, provide walk-around, and explain how the car works) for the next social media influencer.
• Recommendations: Designate an OEM (Ford) to be present during vehicle transitions, to explain the car, and have a program manager onsite during the transition to interface with the influencers.
• Recommendation: Utilize a software as a service platform to better track social media influencer requirements.
• Restrict social media influencers from working with other automotive brands during the term of the loan. • Provide more AFV and PHEV events for influencers to attend, and make it a mandatory requirement.
Based on the content posted and shared during the two-year program, the comments were very positive, with no negative comments posted. Overall, the majority of social media influencers enjoyed their time with the assigned car. Based on the posts, they did not find charging to be an issue.
References [1] Hannigan, Mike. et. al., “The Rise of Loyalty, Advocacy & Influence.” Dealer Dot Com, Inc. 2012 [2] Tews, John. Positive Automotive Social Media Experience Impacts Purchase Decisions across All Generations.” April 10, 2014, September 19, 2014. http://www.jdpower.com/press-releases/2014-social-media-benchmark-study-auto
Key Publications Program Website: www.drivingonenergi.com Program Social Media Pages https://twitter.com/drivingonenergi https://www.facebook.com/drivingonenergi https://www.instagram.com/drivingonenergi/

Technology Integration
44 Alternative Fuel Vehicle Initiatives
I.9 Filling Critical Gaps through Innovative Cradle-to-Grave Training (North Central Texas Council of Governments)
Pamela Burns, Principal Investigator North Central Texas Council of Governments 616 Six Flags Drive Arlington, Texas 76011 Phone: (817) 704-2510 E-mail: [email protected]
Mark Smith, DOE Technology Manager U.S. Department of Energy Phone: (202) 287-5151 E-mail: [email protected] Start Date: June 15, 2015 End Date: October 14, 2017 Total Project Cost: $750,000 DOE share: $600,000 Non-DOE share: $150,000
Project Introduction The North Central Texas Council of Governments (NCTCOG) and the Dallas-Fort Worth Clean Cities (DFWCC) Coalition began implementing the Filling Critical Gaps (FCG) grant in 2015. This project has provided training on alternative fuels and alternative fuel vehicles (AFVs) to mechanics/technicians, first responders, public safety officials, and other critical service providers across a multi-state region. The project’s goal was to remove barriers to the use of AFVs, such as the lack of technical expertise with new fuels and vehicle technologies, and consumer reluctance to try these technologies, thereby helping to reduce US dependence on foreign oil, increase the viability and use of renewable energy technologies, and increase energy efficiency. The trainings were necessary to increase the number of professionals qualified to work with AFVs, improve technical knowledge, and increase consumer confidence with new fuels and AFVs. The grant provided 20 training classes with the National Alternative Fuels Training Consortium (NAFTC) for mechanics and first responders, and 10 training classes with FS Circle, focused on public safety officials, for a total of 30 classes. These classes were held in four states in the Clean Cities South Central region: Arkansas, Louisiana, Oklahoma, and Texas. Project sub-recipients were the Arkansas Energy Office (AEO), Louisiana Clean Fuels (LCF), Regional Planning Commission (RPC), Indian Nations Council of Governments (INCOG), Lone Star Clean Fuels Alliance (LSCFA), and NAFTC.
Objectives The objective of this project was to expand access to training on alternative fuels and AFVs, for mechanics/technicians, first responders, public safety officials, and other critical service providers across a multi-state region. This project was intended to demonstrate the need for regular training, and to create opportunities for these classes to continue, by using a Train the Trainer format.
Approach The project team utilized existing AFV curricula for trainings for first responders, public safety officials, and critical service providers, so that funding could be concentrated on training implementation, rather than curriculum development. The project team worked with vocational and community college instructors and institutions to include relevant AFV curricula in their regular course offerings, so that the trainings would be

FY 2017 Annual Progress Report
Alternative Fuel Vehicle Initiatives 45
sustained after the project period ended. In addition to training on AFVs and alternative fuels, the project also included compressed natural gas (CNG) station safety training for fire marshals and code officials, to deepen their understanding of CNG stations. The project team used a variety of methods to market the trainings, including meetings, newsletters, email correspondence, social media, website updates, paid advertising, and exhibits at conferences. Figure I.9.1 shows marketing efforts from DFWCC and its sub-recipients during the grant period.
Figure I.9.1: Marketing and promotion of trainings
Results DFWCC and its sub-recipients struggled with participant attendance at first, as the training topics were considered a lower priority than safety and hazmat training, and attendee work schedules (shift work for first responders) made participation difficult. After working with first responder associations, and making a few adjustments in the course hours, registration peaked slightly. The project team also worked with state agencies such as Departments of Health, State Fire Marshals and Police Academies to ensure that the courses would qualify for continuing education credits, which caused registration for the first responder courses to increase. The classes were originally structured as Train the Trainer courses, but they were opened up to additional non-trainer attendees from the participating organizations, to fill the initial classes. Approximately 90% of the attendees were trainers. DFWCC surveyed the grant’s sub-recipients to obtain feedback and recommendations for potential improvements to future trainings. Recommendations included expanding the reach to include more fire departments from smaller communities, as well as volunteer groups; developing partnerships with additional technical colleges, universities and police and fire associations; more online classes, especially for police and fire departments and other first responders; and more funding to provide lunch, make training more interactive and include vendor showcases (see Figure I.9.2).

Technology Integration
46 Alternative Fuel Vehicle Initiatives
Figure I.9.2: Recommendations
Overall, DFWCC and the sub-recipients were pleased with the attendance numbers. More than 350 first responders, alternative fuel technicians/mechanics, public safety officials, and other critical service providers registered and attended these AFV and CNG safety classes. By analyzing the successes and shortcomings of each event, DFWCC and the sub-recipients were able to develop best practices for hosting similar training. The Train-the-Trainer courses benefited the region because post-grant, the trainers that have attended the courses can go on to perform their own trainings and host their own classes. Trainings could be hosted more frequently, and in more rural areas, allowing for more potential attendees from niche markets. During the grant period, several community and technical colleges expressed interest in becoming NAFTC Associate Training Centers, but due to funding and staffing issues, these plans fell through. The fee for membership is $2,500 per year, and the colleges were unable to work through the financial obstacles, despite DFWCC offering subsidies. DFWCC is continuing to investigate becoming an NAFTC Government Member, which would allow it to manage and host the trainings at a reduced cost. DFWCC and the sub-recipients plan to work with a participant that attended a previous train the trainer class to host a future training using the NAFTC curriculum, and are looking at ways to pay for additional trainings, in the absence of federal grant money. DFWCC and the sub-recipients have expressed interest in finding sponsors to fund future trainings, and in collaborating with local gas and electric utilities to leverage their training facilities. The trainer could provide the training pro-bono, or it could be funded through the trainer’s organization and provided as in-kind to the DFWCC or potentially through a FEMA grant.
Conclusions Overall, training participants found the first responder courses to be beneficial. DFWCC and its sub-recipients asked participants to complete course evaluations after taking each training. Questions pertained to, among

FY 2017 Annual Progress Report
Alternative Fuel Vehicle Initiatives 47
other things, the instructor’s knowledge, ability to communicate complex topics, ability to present in a clear and effective manner and responsiveness to attendees’ questions. The attendees were also asked about the quality of course materials, whether they added to understanding of the topic, the relevance of the content, learning objectives and course structure. They were asked to indicate, on a scale of 1 to 5, with 1 being “Strongly Disagree” and 5 being “Strongly Agree”, whether they agreed with positive statements about the various aspects of the trainings, e.g., “The instructor was knowledgeable”. The results of the evaluations of trainings hosted by DFWCC are shown in Table I.9.1.
Table I.9.1: Training Evaluation Response Summary Evaluation Response Summary Strongly
Agree Agree Unsure Disagree Strongly
Disagree Number
of Courses
AFV First Responder Safety Training 86% 12% 1% 0% 0% 5 Part I: The Instructor 93% 7% 0% 0% 0% Part II: Course Materials 82% 15% 3% 1% 0% Part III: General Teaching and Learning
74% 23% 2% 1% 0%
Part IV: Course Facilities 98% 2% 0% 0% 0% Part V: I took this course for…
Work 23 Academic - Personal 3 Learn More 3 Other: -
CNG Fuel System Inspector Safety Training
91% 6% 2% 0% 0% 2
Part I: The Instructor 95% 5% 0% 0% 0% Part II: Course Materials 82% 12% 6% 0% 0% Part III: General Teaching and Learning
92% 4% 4% 0% 0%
Part IV: Course Facilities 96% 4% 0% 0% 0% Part V: I took this course for…
Work 15 Academic 4 Personal 2 Learn More 3 Other: -
For the AFVs First Responder Safety trainings, 86% of attendees indicated they “Strongly Agree” and 12% indicated they “Agree” with positive statements about the trainings. The CNG Fuel System Inspector Safety trainings received a 91% “Strongly Agree” and 6% “Agree” response to positive statements. Less than 2% in each training category rated “Unsure” and no attendees indicated that they “Disagree” or “Strongly Disagree” when responding to positive statements about the training. Evaluations from trainings hosted by the sub-recipients in other regions showed similar responses. Based on the training course evaluations, DFWCC concluded that the grant provided successful trainings to first responders, alternative fuel technicians/mechanics, public safety officials, and other critical service providers in the four states in the Clean Cities South Central region. Additionally, participants have expressed the desire to continue having these safety trainings in the near future to educate first responders and technicians on the ever-changing and evolving vehicle technologies.

Technology Integration
48 Alternative Fuel Vehicle Initiatives
Key Publications DFW Clean Cities Newsflash Article, February 2016 DFW Clean Cities Newsflash Article, March 2016 DFW Clean Cities Newsflash Article, May 2016 DFW Clean Cities Newsflash Article, June 2016 DFW Clean Cities Newsflash Article, July 2016 DFW Clean Cities Newsflash Article, August 2016 DFW Clean Cities Newsflash Article, April 2017 DFW Clean Cities Newsflash Article, May 2017 DFW Clean Cities Newsflash Article, July 2017 DFW Clean Cities Newsflash can be found online at https://www.dfwcleancities.org/publications
FY 2017 Annual Progress Report
Alternative Fuel Vehicle Initiatives 49
I.10 Midwest D.R.I.V.E.S. Initiative: Demonstrating Reliable Innovative Vehicle Energy Solutions (Clean Fuels Ohio)
Sam Spofforth, Principal Investigator Clean Fuels Ohio 530 West Spring Street, Suite 250 Columbus, OH 43215 Phone: (614) 884-7336; E-mail: [email protected]
Mark Smith, Program Manager U.S. Department of Energy Phone: (202) 287-5151 E-mail: [email protected] Start Date: August 6, 2015 End Date: August 5, 2017 Total Project Cost: $1,011,264 DOE share: $500,000 Non-DOE share: $511,264
Project Introduction The Midwest DRIVES Initiative was designed to reduce barriers to integrating Alternative Fuel Vehicles (AFVs) into fleets in a three state area (Ohio, Indiana and Michigan), by offering a wide range of medium-term (30-90 day average) AFV demonstrations to fleets. Through these demonstrations, fleets gained experience operating the vehicles, and the project collected data to provide validation for AFV purchases. Based on this data, the project performed analyses and created case studies to reveal cost-and fuel-saving opportunities relative to conventional vehicle models. Using these analyses, case studies, and information about financial incentives and leasing models, the project presented fleet education and outreach programming, to enable similar fleets across the nation to gain confidence in AFV adoption. This project supported Department of Energy (DOE) Vehicle Technologies Office goals by • Demonstrating and evaluating alternative fuels and fuel efficiency systems and vehicles • Providing data and information to end-users to promote the use of alternative fuels and fuel efficiency
systems. • Reducing consumer reluctance to purchase new technologies
Objectives The objective of this project was to create and implement high impact and highly innovative approaches to increasing the acceptance and use of Alternative Fuel Vehicles (AFVs) by fleets, through hands-on experiences with the vehicles. Overall Objectives: • Provide free vehicle demonstrations to public and private fleets across Ohio, Indiana, and Michigan • Incorporate data logging and generate case studies, based on vehicle demonstrations • Educate fleets on real-world performance of various alternative fuels and fuel efficient technologies
Fleets received a multitude of benefits from participation, leading them towards adoption, including a detailed case study on the vehicle demonstration, connection with industry for follow-up consultations, and follow-up from local Clean Cities coalitions regarding available grants and incentives.

Technology Integration
50 Alternative Fuel Vehicle Initiatives
Participating vehicle and equipment manufacturers included BYD, Cardinal Bus, DERIVE Technologies, GreenTech Automotive, ICOM North America/ Green Bridge Technologies, IMPCO, Lightning Hybrids, NatGasCar, Nissan North America, Optimus Technologies, Palmer Trucks, Roush CleanTech, Stag USA and Vanner.
Approach To execute such a comprehensive vehicle demonstration and analysis program, Clean Fuels Ohio (CFO) established partnerships in four core areas: 1) regional DOE Clean Cities coalition partners that were active in project implementation, reporting, outreach, education, and administration; 2) alternative fuel vehicle and system manufacturer partners that provided a diverse spectrum of alternative fuel vehicles and conversion systems for fleet demonstrations; 3) fleet partnerships consisting of both individual fleets and fleet member organizations that provided the core audience for vehicle demonstration and educational programing; and 4) expert technical partners that provided data logging equipment, infrastructure, analysis tools, case study reporting, and other informational resources. The following sections outline additional details on the approach, objectives, strategies, and activities of partners in each core area. Coalition Partnerships The Midwest DRIVES Initiative represented a unique partnership of six DOE Clean Cities coalitions, consisting of CFO, Earth Day Coalition (Ohio), South Shore (Indiana), Greater Indiana, Ann Arbor (Michigan), and Detroit (Michigan). Led by CFO, these coalitions coordinated overall project implementation and administration, and provided a distributed network of experienced management staff in key locations throughout Ohio, Indiana and Michigan, who worked directly with fleet and vehicle partners to ensure programmatic success. Fleet Deployment Partnerships The Midwest DRIVES Initiative targeted fleets across various market segments, applications, and duty cycles, as shown in Table I.10.1, to ensure programmatic impact and broad replicability with other fleets throughout the country.
Table I.10.1: Targeted Market Segments and Vehicle Duty Types
Public Fleets Private Fleets Vehicle Duty Types Municipal / City Fleets Delivery Fleets (Med-Heavy Duty) Light Duty Sedans/SUV fleets Public Transit Fleets Taxi and Shuttle Fleets Light Duty Pickup Trucks and Vans
Police, first responder, and Safety Patrol Fleets
Service Vehicle Fleets (utility vans, pick-up trucks, other work trucks)
Medium Duty Work Trucks and Utility vehicles
School Districts Regional Class 8 Haulers/Carriers Medium Duty Shuttles Universities Corporate Motor Pools Heavy Duty School Bus
Public Utilities Private Utilities Heavy Duty Trucks (class 8) Vehicle Provider Partnerships Collaborating coalitions secured partnerships with manufacturers and distributors of light, medium and heavy-duty alternative fuel and advanced technology vehicles. Collectively, these industry partners provided a wide range of vehicle fuels and technologies, including biofuel conversions, efficiency technologies, plug-in electric vehicles (PEVs), hybrids, compressed natural gas, and propane autogas vehicles. Vehicle manufacturers that participated in the Midwest DRIVES Initiative agreed to provide vehicles for fleet demonstration purposes as an in-kind, equipment match for the program. CFO identified vehicle providers through extensive outreach, utilizing in-person meetings, phone calls and email communication. See Table I.10.2.

FY 2017 Annual Progress Report
Alternative Fuel Vehicle Initiatives 51
Table I.10.2: Vehicle Providers, Fuel Types, Vehicle Models and Duty Types
The Midwest DRIVES Initiative solicited fleet participants by having Clean Cities coalitions conduct outreach and education, including newsletter announcements, in-person meetings and presentations, webinars and social media, to highlight the benefits of the program. The initiative then used selection criteria with an established rubric to determine the program’s final fleet participants. This rubric examined fleet type (public or private), fleet market segment (delivery, utility, motor pool, etc.), fleet vehicle type, operational/geographic location, access to fueling infrastructure, fleet size, and impact/replicability, i.e., how relevant the fleet application was to other fleets across the nation. CFO and coalition partners worked with each local fleet partner to schedule demonstration periods, vehicle transport, fueling arrangements, trainings, case study debriefings, and other logistics. These fleet demonstration partnerships produced useful lessons learned, detailed case studies, and educational content that will be leveraged to maximize the future integration of AFVs into additional fleets. Data Logging, Analysis, Case Studies CFO partnered with FleetCarma, a company working with fleet clients to analyze, deploy, and manage advanced-fuel fleet vehicles. For this project, FleetCarma provided data logging equipment for each demonstration vehicle, cloud-based data management, and robust analytics for each fleet trial. Analytics and case studies were designed to reveal cost- and fuel-saving opportunities relative to conventional vehicle models, should fleet partners elect to lease or purchase the AFVs they tested.
Results The Midwest DRIVES Initiative leveraged its diverse partnerships, numerous real-world fleet demonstrations, abundant data collection, and multifaceted outreach networks to create robust educational programming. This initiative produced four core types of educational materials related to fleet demonstration results: single page
Vehicle Provider Fuel Type & Vehicle Model Fleet Duty Type
BYD Electric: e6 Light Duty SUV
Cardinal Bus Propane Blue-Bird Type C Vision Bus School Bus
Derive Systems Efficiency: Vehicle Computer Optimization
Light, Medium, and Heavy Duty Vehicle
GreenTech Automotive (WM) Electric: GTA G2 EV Sedan Light Duty Sedan
ICOM/Greenbridge Technologies CNG: Chevy Trax Light Duty SUV
IMPCO CNG: Bi-fuel Chevy Cruze Light Duty Sedan
Lightning Hybrid Hydraulic Hybrid: Ford E-450 Shuttle Medium Duty Shuttle
NatGasCar CNG: F150 Light Duty Utility
Nissan Electric: Nissan LEAF Light Duty Sedan
Optimus Technologies Biofuel: Conversion System Med - Heavy Duty Truck
Palmer Trucks CNG: Class 8 Dedicated Kenworth Heavy Duty Dedicated Truck
Roush CleanTech Propane: F250 Light Duty Utility
Roush CleanTech Propane: E250 Light Duty Utility
Stag USA CNG: Bi-fuel Police Interceptor Law Enforcement
Stag USA Propane: Bi-fuel Police Interceptor Law Enforcement
Vanner Efficiency: Anti-Idling (Idle Watch II System) Med - Heavy Duty Truck

Technology Integration
52 Alternative Fuel Vehicle Initiatives
profiles, detailed case studies, video success stories, and fact sheets. Single page overviews of select fleet demonstrations consisted of information about lead fleet personnel, key data points, and quotes about fleet experiences, and were designed to be consumed quickly by a wide audience, including policy makers, management, and fleet personnel. Case studies consisted of more technical presentations of demonstration results, including tabular and graphic presentation of data with narrative, and were designed for more technically-oriented fleet audiences. The Midwest DRIVES Initiative generated twelve video success stories of representative demonstration partners. These success stories consisted of approximately two to three minutes of content, including interviews with key stakeholders (executives, fleet managers, drivers, and community members), interspersed with footage of fleet operations. CFO wrote the profiles, case studies and fact sheets, worked with MotorWeek to generate several of the fleet video success stories, and collaborated with Less Productions to film the remainder of the video success stories. In all, 80 vehicle demonstrations were completed, with 16 vehicles and technologies available for demonstration. See Table I.10.3. At least one demonstration was conducted with each vehicle technology provider. Over 2,200 driving events were logged, i.e., each time a vehicle was started up and driven constituted a driving event. After the demonstrations were completed, CFO generated case studies for each fleet.
Table I.10.3: Midwest DRIVES Vehicle Demonstrations
Vehicle # of Demos Organization City State Clean Cities Coalition
Demo Start Date
Demo End Date
Kenworth CNG 1 Fair Oaks Farms Fair Oaks IN Greater
Indiana 4/1/2016 4/22/2016
Nissan Leaf (Ohio) 1 AEP Ohio Columbus OH Clean Fuels
Ohio 4/26/2016 5/17/2016
Nissan Leaf (Ohio) 1 Franklin County Columbus OH Clean Fuels
Ohio 7/7/2016 7/28/2016
Roush Ford F250 1 Central Marine
Logistics Griffith IN South Shore 7/7/2016 7/28/2016
Nissan Leaf (Ohio) 1
Cuyahoga National
Park
Boston Heights OH Earth Day
Coalition 7/18/2016 8/8/2016
Nissan Leaf (Ohio) 1 Cleveland RTA Cleveland OH Earth Day
Coalition 7/18/2016 8/8/2016
Nissan Leaf (Ohio) 1 City of Hamilton Hamilton OH Clean Fuels
Ohio 7/18/2016 8/8/2016
Nissan Leaf (Ohio) 1 City of
Worthington Worthington OH Clean Fuels Ohio 7/26/2016 8/16/2016
Roush F250 1 City of East Chicago
East Chicago IN South
Shore 7/26/2016 8/16/2016
Nissan Leaf (GICC) 6 City of Fort
Wayne Fort Wayne IN Greater Indiana 8/1/2016 9/30/2016
Nissan Leaf (Ohio) 1 The Ohio State
University Columbus OH Clean Fuels Ohio 8/1/2016 8/22/2016
Green Bridge Technologies
Chevy Trax
1 City of Columbus Columbus OH Clean Fuels
Ohio 8/5/2016 8/26/2016
Lightning Hybrids E450
1 City of Columbus Columbus OH Clean Fuels
Ohio 8/5/2016 8/26/2016

FY 2017 Annual Progress Report
Alternative Fuel Vehicle Initiatives 53
Vehicle # of Demos Organization City State Clean Cities Coalition
Demo Start Date
Demo End Date
NatGasCar F150 1 City of
Columbus Columbus OH Clean Fuels Ohio 8/5/2016 8/26/2016
Nissan Leaf (Greater Indiana)
1 Indiana University Bloomington IN Greater
Indiana 8/5/2016 8/26/2016
Derive 4 City of Columbus Columbus OH Clean Fuels
Ohio 8/5/2016 8/26/2016
Nissan Leaf 1 City of Columbus Columbus OH Clean Fuels
Ohio 8/8/2016 9/12/2016
Nissan Leaf (Ohio) 1 City of Dublin Dublin OH Clean Fuels
Ohio 8/8/2016 9/12/2016
Green Bridge Technologies
Chevy Trax
1 City of Dublin Dublin OH Clean Fuels Ohio 8/9/2016 5/1/2017
Stag CNG Interceptor 1 City of Dublin Dublin OH Clean Fuels
Ohio 8/9/2016 8/13/2016
Roush F250 1 Lowell Schools Lowell IN South Shore 8/22/2016 9/12/2016
Roush F250 1 School of East Chicago, IN
East Chicago IN South
Shore 8/26/2016 8/31/2016
NatGasCar F150 1 Setterlin
Construction Columbus OH Clean Fuels Ohio 8/27/2016 9/2/2016
Stag Propane Interceptor 1 City of East
Chicago East
Chicago IN South Shore 9/1/2016 10/1/2016
Nissan Leaf (South Shore)
1 City of Hobart, IN Hobart IN South
Shore 9/7/2016 9/28/2016
BYD e6 1 Columbus
Yellow Cabs
Columbus OH Clean Fuels Ohio 9/8/2016 9/26/2016
Green Bridge Technologies
ChevyTrax 1 City of
Columbus Columbus OH Clean Fuels Ohio 9/9/2016 9/30/2016
Roush F250 1 TAG Property Landscaping Dayton OH Clean Fuels
Ohio 9/9/2016 9/30/2016
BYD e6 1 FirstEnergy Akron OH Clean Fuels Ohio 9/20/2016 9/21/2016
Nissan Leaf (South Shore) 1
Northern Indiana
Regional Planning
Commission
Portage IN South Shore 9/20/2016 9/27/2016
Roush CleanTech Bus 1
Hamilton Southeastern School District
Hamilton IN Greater indiana 9/30/2016 1/29/2017
Nissan Leaf 1 Grove City Grove City OH Clean Fuels Ohio 10/3/2016 10/24/2016

Technology Integration
54 Alternative Fuel Vehicle Initiatives
Vehicle # of Demos Organization City State Clean Cities Coalition
Demo Start Date
Demo End Date
Nissan Leaf (Ohio) 1 City of Dublin Dublin OH Clean Fuels
Ohio 10/5/2016 10/19/2016
Roush F250 1 City of Dayton Dayton OH Clean Fuels Ohio 10/5/2016 10/19/2016
Roush F250 1 City of Marion Marion OH Clean Fuels Ohio 10/5/2016 10/19/2016
Roush F250 1 City of Chelsea Chelsea MI Clean Energy
Coalition 10/21/2016 11/11/2016
Optimus Technologies 2 Zeeland Freight
Services Zeeland MI Clean Energy
Coalition 10/28/2016 5/1/2017
Nissan Leaf (Ohio) 1 City of
Cleveland Cleveland OH Earth Day Coalition 1/1/2017 1/22/2017
Green Bridge Technologies Chevy Trax
1 Setterlin Construction Columbus OH Clean Fuels
Ohio 1/20/2017 2/20/2017
Derive 10 City of Indianapolis Indianapolis IN Greater
Indiana 2/17/2017 5/1/2017
Nissan Leaf (Ohio) 1 Columbus Blue
Jackets Columbus OH Clean Fuels Ohio 4/3/2017 4/19/2017
Roush F250 1 City of Merrillville Merrillville IN South
Shores 4/13/2017 5/1/2017
BYD e6 1 Ohio EV Solutions Columbus OH Clean Fuels
Ohio 4/14/2017 4/24/2017
Nissan Leaf 1 FirstEnergy Akron OH Clean Fuels Ohio 5/1/2017 6/1/2017
Nissan Leaf (Ohio) 1 Grove City Grove City OH Clean Fuels
Ohio 5/15/2017 6/15/2017
Roush F250 1 City of Valparaiso Valparaiso IN South
Shores 5/24/2017 5/24/2017
Derive 10 Oberlin Police Department Oberlin OH Clean Fuels
Ohio 5/30/2017 6/30/2017
Roush F250 1 City of Carmel Carmel IN Greater Indiana 5/30/2017 6/30/2017
Nissan Leaf (South Shore)
1 City of Carmel Carmel IN South Shore 5/30/2017 6/30/2017
The project required close coordination of Clean Fuels Ohio and the Clean Cities coalition partners on tasks including individual fleet contracting, vehicle scheduling and logistics, data logger installation and management, case study generation and sharing of findings with other fleets. Project partners held monthly group discussions and utilized Google Drive to allow for efficient tracking of fleet and project progress. Clean Fuels Ohio and Clean Cities Coalition Partners plan to continue offering vehicle demonstration past Midwest Drives as part of Industry Collaboration.

FY 2017 Annual Progress Report
Alternative Fuel Vehicle Initiatives 55
Conclusions Midwest Drives tapped into a key market of fleet interest by offering easy access to vehicle demonstrations throughout Ohio, Indiana and Michigan. Many fleets are interested in learning more about, and test driving, alternative fuels, although they are often unaware of how to seek these opportunities. By partnering with several other Clean Cities coalitions, CFO was able to capitalize on a vast network of stakeholders, while further maximizing outreach to transportation associations and membership organizations with large audiences. Fleets were excited to test drive alternative fuel vehicles, often seeking out more than one option as part of their fact finding. To offer the best variety possible, OEMs played a critical role in the program. Midwest Drives decided to not offer monetary incentive/grant funding to OEMs and vehicle providers for their participation, but rather focused on the value proposition of new sales leads/fleet prospects that could be generated by lending a vehicle to the program. While some vehicle providers were not able to participate, due to the financial burden of dispatching a demonstration vehicle, a majority of those approached did participate in the program. It must be emphasized that vehicle providers and OEMs must be able to see and receive value for participating in demonstration programs such as Midwest DRIVES. Some vehicle partners had to withdraw from the project, due to lack of demonstration equipment or shifting priorities. CFO incorporated new vehicle partners throughout the project, to ensure diverse vehicle offerings. CFO also sought participation from fuel providers for refueling gaseous fuels. (EVs were able to use provided Level 1 charging or public charging options). There remained some logistical barriers for gaseous fuel fleet demonstration, however, as some areas lacked adequate refueling availability. Lessons Learned • Paperwork - The amount of paperwork required to participate did ultimately slow down the process of
dispatching demonstration vehicles to participants. While required, this contracting process remained a barrier for many fleets, often requiring their own legal review of agreements, clarification of terms, etc. Fortunately, CFO was able to find ways to expedite the contracting process; however, further streamlining would remove additional barriers, ultimately allowing fleets to more quickly test drive vehicles (while still maintaining all needed liability coverage for the demonstration).
• Vehicle Storage - The project’s original intent was to store all vehicles at Clean Cities coalitions when not in demonstration. It proved more efficient for vehicle providers to retain vehicles in between demonstrations.
• Fuel Price - Gasoline and diesel prices were $3.00 to $4.00 per gallon during program conceptualization and application development; however, those prices subsequently dropped. While demand remained for AFVs, this required a change of outreach tactics for the project partners.
• Data Loggers - Not all vehicles were able to properly interact with the data loggers provided through FleetCarma. As a result, NREL and other partners provided assistance in alternate pathways for calculating vehicle usage during the demonstration.
• Refueling – The project’s initial refueling assumptions remained relatively unchanged, depending on pre-existing infrastructure or creation of short-term refueling agreements with fuel providers.
Key Publications MotorWeek Feature: https://www.youtube.com/watch?v=vOi7Hj-2HjY Midwest Drives Hits 2,000 Demonstration Miles: http://www.cleanfuelsohio.org/single-post/2017/02/27/Midwest-Drives-Hits-One-Year-Milestone-2000-Miles-Driven Program Update on Clean Fuels Ohio Website: https://www.cleanfuelsohio.org/single-post/2017/09/21/City-of-Cleveland-Leverages-Midwest-DRIVES-to-Inform-Alternative-Fuel-Adoption-Path

Technology Integration
56 Alternative Fuel Vehicle Initiatives
I.11 Drive Electric Orlando (Florida Department of Agriculture and Consumer Services, Office of Energy)
April Groover Combs, Principal Investigator Florida Department of Agriculture and Consumer Services, Office of Energy (FDACS OOE) 600 S. Calhoun Street, Suite B04 Tallahassee, Florida 32399-0001 Phone: (850) 617-7470 E-mail: [email protected]
Linda Bluestein, DOE Technology Manager U.S. Department of Energy Phone: (202) 586-6116 E-mail: [email protected] Start Date: July 16, 2015 End Date: January 14, 2019 Total Project Cost: $849,060 DOE share: $400,000 Non-DOE share: $449,060
Project Introduction There are generally three barriers to widespread adoption of electric vehicles (EVs): technology cost and performance, charging infrastructure availability, and consumer acceptance. Drive Electric Orlando seeks to address this third barrier by providing an opportunity for consumers to experience an EV risk-free, for an extended period. By utilizing Drive Electric Orlando’s fully-integrated EV rental network, Orlando visitors have an opportunity to become familiar with the capabilities and benefits of EVs, in the process increasing consumer acceptance and adoption. While geographically limited to the greater Orlando area, Drive Electric Orlando will have a national impact, as this area hosts nearly 60 million nationwide visitors every year.
Drive Electric Orlando’s overall goal is to create extended test drive (rental) experiences that will substantially increase consumer awareness of the benefits and capabilities of EVs, with a long-term objective of increasing the likelihood that program participants will consider purchasing an EV the next time they are in the market for a passenger car. To introduce consumers across America, and around the world, to electric vehicles, Drive Electric Orlando is harnessing the power of its greatest asset—the Orlando tourism industry. By offering EVs as rental cars, Drive Electric Orlando can familiarize people with the benefits of this technology and advance its adoption nationwide.
Objectives The objective of this project is to provide scalable consumer education and vehicle demonstrations to allow visitors to Orlando, Florida to experience the benefits of EVs, and to increase the acceptance and adoption of Alternative Fuel Vehicles (AFVs).
Approach The Drive Electric Orlando team consists of the Florida Department of Agriculture and Consumer Services, Office of Energy; the Electrification Coalition; and the Central Florida Clean Cities Coalition. Together, the

FY 2017 Annual Progress Report
Alternative Fuel Vehicle Initiatives 57
Drive Electric Orlando team is building public and private partnerships, creating incentives for EV rental, elevating program awareness, and measuring success (see Figure I.11.1).
Figure I.11.1: Drive Electric Orlando volunteer partners
Maintain and Expand Public-Private Partnerships The Drive Electric Orlando team is working with its volunteer partners to increase the availability of Electric Vehicle Supply Equipment (EVSE) in the greater Orlando area, and to ensure that it is properly installed. The Drive Electric Orlando team also provides training that covers basic charging and vehicle range information to its partners. The training may include short videos, PowerPoint presentations, fact sheets, and sample maps that show the network of available charging infrastructure in Orlando. In addition, the Drive Electric Orlando team is conducting outreach to greater Orlando area businesses to develop interest in, and awareness of, workplace charging, to support a network of business travelers. Create Incentives for EV Rental To meet its objective, the Drive Electric Orlando team worked with Enterprise Rent-A-Car (Enterprise), its rental partner, to gain a commitment to offer EVs at a price comparable to that of similarly sized internal combustion engine vehicles. Enterprise also agreed to develop protocols that make it easy for customers to utilize EVSE and to access payment options. The Drive Electric Orlando team continues to work with theme park and hotel partners that offer incentives that contribute to a positive EV rental experience for their visitors, as well as promote EVs and the Drive Electric Orlando program to other theme park and hotel guests.
Elevate Program Awareness The Drive Electric Orlando team has developed a marketing strategy that works with Clean Cities coalitions from the largest national Orlando tourism feeder markets. These selected Clean Cities coalitions engage their partners, consumers, issue experts, and others to elevate awareness of the Drive Electric Orlando program, and to educate consumers on the latest EV technologies and the benefits of driving electric. The Drive Electric Orlando team is also working with national travel networks to create outreach programs that engage consumers as early in the vacation planning and decision making process as possible.

Technology Integration
58 Alternative Fuel Vehicle Initiatives
Measure Success Over the course of the next year, the Drive Electric Orlando team will evaluate and analyze the project impact on a subset of those who have rented an EV through the program, to understand renters’ changes in perception of EVs. The analysis will also identify which incentives and advertising messages motivated drivers to rent EVs, and determine how that might impact the likelihood of them purchasing EVs in the future.
Results Milestone: Electric Vehicle Rental Inventory Drive Electric Orlando’s initial deliverable goal was to have 15 rental cars available. Since the program began in 2015, voluntary partners Enterprise and General Motors (GM) have demonstrated their commitment by providing Chevy Volts for the program, as well as twice replacing older model year vehicles with the newest model year EVs available (see Figure I.11.2). First, in 2017, Enterprise acquired 17 Chevy Volts. Enterprise will be replacing them for 2018 with new Volts. The 2018 Chevy Volts were expected to be onsite and available for rental in late November 2017. This swap-out is an important inflection point for the program, as the newer model Chevy Volts offer an increased electric range, have a more aesthetically-pleasing exterior design and include a number of interior upgrades that make it easier for first-time EV drivers to understand the operations of the cars. To ensure that renters have a seamless and superior rental experience, the Drive Electric Orlando team has worked with Enterprise to map out a comprehensive employee training and accountability program. To date, 250 Enterprise employees based at the Orlando International Airport have been trained. The Drive Electric Orlando team continues to conduct outreach to other rental car companies in the greater Orlando area, to educate them about the Drive Electric Orlando program; to learn more about each company’s potential plans to add electric cars to their respective fleets; and to gauge each company’s interest in becoming a partner with Drive Electric Orlando.
Figure I.11.2: 2018 Chevrolet Volt
Milestone: Marketing Approach Developed In October 2016, the Drive Electric Orlando team successfully ran a pilot test of creative advertisement that targeted three major visitor feeder markets (New York, Boston, Chicago), and focused on travelers planning for winter/holiday trips. The Drive Electric Orlando team paused the pilot campaign after thirty days to analyze the results and address barriers, to create the most effective marketing campaign possible.

FY 2017 Annual Progress Report
Alternative Fuel Vehicle Initiatives 59
The Drive Electric Orlando team has developed a second phase of the marketing and advertising campaign. This phase will use Clean Cities coalitions in Orlando’s top visitor feeder markets (Washington D.C., New England, New York City, and Atlanta), to promote Drive Electric Orlando to their respective stakeholders. To assist in that promotion, the Drive Electric Orlando team, with input from participating coalitions in each market area, developed a Clean Cities coalition-specific electronic “toolkit” that includes all the messaging and assets that Clean Cities coalitions would need to conduct a marketing and advertising campaign. The Clean Cities coalitions are scheduled to begin their grassroots marketing efforts as soon as the 2018 Chevy Volts are delivered to the Enterprise rental plaza at Orlando International Airport, in late November 2017. See brochure in Figure I.11.3.
Figure I.11.3: Drive Electric Orlando brochure
Milestone: Rental Partner Incentives The Drive Electric Orlando team is continually reaching out to current project partners, as well as potential new project partners, to expand rental incentives. Enterprise made the commitment to tie the rental price of the Chevy Volts in the company’s fleet to the rental price of a standard midsize vehicle. Additionally, Drive Electric Orlando renters do not pay for any EVSE charging. Each vehicle has been equipped with a ChargePoint key fob that allows drivers to charge their vehicles at any ChargePoint station for free. While many hotels and other locations offer free charging to Drive Electric Orlando renters, in the instances where there is a “charge to charge,” Securing America’s Future Energy (SAFE) covers any fees incurred by drivers using the ChargePoint key fob.

Technology Integration
60 Alternative Fuel Vehicle Initiatives
The Drive Electric Orlando team has worked with local theme parks to develop the following “major” renter incentives: • Drive Electric Orlando renters receive a special VIP pass that provides front of the line access to the Test
Track ride presented by Chevrolet at Disney’s Epcot Center, and access to the ride’s VIP lounge. This perk is only available to electric car renters at Enterprise’s Orlando location.
• Up-front parking at Disney’s Magic Kingdom • Up-front parking at Disney’s Epcot Center • Up-front parking at Disney’s Animal Kingdom • Up-front parking and free charging at Universal Orlando Resort
The current perks that are offered from hotels for Drive Electric Orlando renters with charging stations are as follows: • 44 hotels have a charging station on the property • 30 hotels offer free parking to EV drivers • 27 hotels offer free charging to EV drivers • 19 hotels offer premier up-front parking to EV drivers • 1 hotel offers free valet to EV Drivers
Milestone: Tracking EV Utilization Rates The Drive Electric Orlando team continues to work with our rental car partner, Enterprise, to comprehensively track and report on the electric cars rented through the Drive Electric Orlando program at the Orlando International Airport. See Table I.11.1. The Drive Electric Orlando team believes that once the grassroots marketing efforts supported by the Clean Cities coalitions begin and the 2018 Volts enter the fleet, utilization rates will increase dramatically.
Table I.11.1: Cumulative EV Utilization Rates for Fiscal Year 2017
2017 Total No. of EV Reservations
Number of EV Rentals
Cumulative EV Reservations
(DAYS)
Total Miles Driven by EVs
Total 880 378 6,431 104,550
Conclusions The Drive Electric Orlando team continues to work towards its objective of providing scalable consumer education and electric vehicle demonstrations for travelers to Orlando, Florida, to encourage them to experience the benefits of EVs. This year, the Drive Electric Orlando team worked with Orlando’s major theme parks and hotels to refine, expand, and share information about the various incentives they have committed to providing to EV renters. The Drive Electric Orlando team also successfully launched a test marketing and adverting campaign. Next year, with the help of the Clean Cities coalitions, the Drive Electric Orlando team intends to implement the grassroots marketing campaign strategy and reach more potential EV renters, to fully explore the lessons learned from this project, and to document them for future use. The Drive Electric Orlando team believes this will result in more people experiencing the benefits of EVs, thereby increasing their acceptance and adoption rate.

FY 2017 Annual Progress Report
Alternative Fuel Vehicle Initiatives 61
I.12 Aggregated Alternative Technology Alliance (National Association of Regional Councils)
Leslie Wollack, Principal Investigator National Association of Regional Councils 660 North Capitol Street NW, Suite 440 Washington, DC 20001 Phone: (202) 618-5696 E-mail: [email protected]
Linda Bluestein, Technology Manager U.S. Department of Energy Phone: (202) 586-6116 E-mail: [email protected] Start Date: March 15, 2016 End Date: March 14, 2018 Total Project Cost: $2,224,651 DOE share: $1,758,599 Non-DOE share: $466,052
Project Introduction The Aggregated Alternative Technology Alliance, known as Fleets for the Future (F4F), is a national partnership of regional councils, Clean Cities coalitions, and industry experts tasked with coordinating regional and national procurement initiatives that consolidate bulk orders and streamline the purchasing process for alternative fuel vehicles (AFVs), hybrid electric vehicles and fueling infrastructure. AFVs include vehicles that operate on natural gas, propane, ethanol, biodiesel or electricity. The National Association of Regional Councils (NARC) is the lead organization on this project and represents regional councils and metropolitan planning organizations across the United States. Project partners recognized multiple barriers in both the public and private sectors relating to the procurement of AFVs, including high upfront costs and a reluctance to purchase these vehicles due to a lack of knowledge and technical experience with new fuels and vehicle technologies. Additionally, the project team wanted to address manufacturer concerns that there was insufficient demand for AFVs and advanced technologies from public and private fleets across the United States.
Objectives The project objectives are the following: • Aggregate regional and national demand for propane, electric, and natural gas-powered vehicles, hybrid
electric vehicles, and refueling or charging infrastructure • Reduce the cost of these vehicles for private and public fleets using bulk cooperative procurement to
obtain competitive pricing • Develop best practices guides and create templates to assist regional councils of government in
implementing cooperative procurement of these vehicles • Plan and implement five regional procurements and one national procurement • Develop a web-based toolkit to educate public fleets and procurement officers, and enable future
cooperative procurement initiatives These project objectives support the following DOE Vehicle Technologies Office goals: • Support pioneering technology integration of market-ready vehicles and alternative fuels in key early
markets

Technology Integration
62 Alternative Fuel Vehicle Initiatives
• Provide best practices, objective data, and informational materials to potential end-users and investors, to promote acceptance of advanced vehicles and alternative fuels
Approach NARC brought together the following organizations to form the F4F project team: • Regional Councils of Governments
o Mid-America Regional Council (Kansas City, Missouri) o Metropolitan Area Planning Council (Boston, Massachusetts) o North Central Texas Council of Governments (Dallas-Fort Worth, Texas) o Pima Association of Governments (Tucson, Arizona) o Metropolitan Washington Council of Governments (Washington, D.C.)
• Technical Partners o Meister Consultants Group o Electrification Coalition o Yborra & Associates o Propane Education & Research Council o ICM, Inc.
• Clean Cities Coalitions o Clean Communities of Central New York o Tucson Regional Clean Cities Coalition o Utah Clean Cities o Western Washington Clean Cities o Clean Fuels Ohio o Kansas City Regional Clean Cities
The F4F team created the following tasks to carry out the project objectives: Task 1: Create replicable procurement best practices and templates • Review current research and convene technical partners to compile best practices for AFV procurement • Develop and finalize templates for regional and national procurements
Task 2: Launch pilot procurement program in the Kansas City Metro Region • Develop and launch the regional procurement pilot program with the Mid-America Regional Council
and the Kansas City Regional Clean Cities coalition, based at the Metropolitan Energy Center in Kansas City, Missouri, early in Year 1
• Document program results and outreach successes Task 3: Design and deploy regional procurement initiatives • Design and implement a procurement initiative in each of the four other participating regions with their
respective regional councils of governments: Metropolitan Area Planning Council in Boston, Massachusetts; North Central Texas Council of Governments in Dallas-Fort Worth, Texas; Pima Association of Governments in Tucson, Arizona; and Metropolitan Washington Council of Governments in Washington, D.C.
• Provide training opportunities for regional councils and implement a marketing strategy in each region Task 4: Design a national procurement initiative with a business plan for implementation • Consult subject matter experts and convene an expert panel to develop a business plan and
implementation strategy for the national procurement initiative • Create relationships on both the public and private sides for launching the national procurement and
implementing a nationwide outreach plan that includes the use of webinars and social media

FY 2017 Annual Progress Report
Alternative Fuel Vehicle Initiatives 63
Task 5: Collect data and results of both the regional and national procurements to evaluate success • Report quantitative and qualitative data from regional campaigns, including number of vendors,
contracts, and sales projections as well as the results of outreach and education campaigns for the national initiative.
Results The following progress has been made on each task during the past year: Task 1: Create replicable procurement best practices and templates The project team has reviewed current research and procurement models to compile lessons learned from those who have purchased AFVs. Based on that investigation, the technical partners wrote a series of best practices guides that provide information for fleet managers and consumers interested in learning more about AFVs. The guides included best practices for procurement of gaseous fuel and electric vehicles, financing AFVs, and fleet transition planning for AFVs. All the project partners promoted these resources to their members and to those who expressed interest in F4F. These guides are available on the project website. [1] The F4F team also created a curriculum and training materials for a cooperative procurement boot camp. These resources highlight the benefits of participating in AFV-related procurements and outline the procurement process. The partners from regional councils and Clean Cities coalitions have been using these materials to host boot camps in their communities for their respective members and stakeholders. The project team has also created various internal project planning tools to help plan and implement F4F’s five regional and one national procurement. The team developed a seven-step strategic procurement process [2], a stakeholder survey template [3], a Gantt chart planning tool template [4], and a template for an RFI for potential bidders [5]. Task 2: Launch pilot procurement program in the Kansas City Metro Region F4F selected the area covered by the Mid-America Regional Council (MARC) as the pilot location for a regional procurement. MARC convened its stakeholders, assessed interest in purchasing AFVs, drafted AFV specifications, and added AFV options to the Kansas City Regional Cooperative Program vehicle bid. Thirty-five of the forty-four vehicle configurations on the bid included an AFV option. At least six dealerships provided bids for natural gas, plug-in hybrid electric, flexible-fuel, and biodiesel vehicles. Three dealerships provided bids for propane vehicles. MARC then awarded the contracts and promoted the AFV options to fleet managers. MARC also carried out a successful electric vehicle group purchasing initiative. With its regional partners – the Metropolitan Energy Center, Kansas City Clean Cities, City of Kansas City, Kansas City Power and Light, and five local Nissan dealerships – MARC aggregated purchases of the Nissan LEAF. MARC provided training for the five dealerships, based on its survey of local government needs, and two dealerships held ride and drive events. More than 100 LEAFs were purchased during the 45-day period between November 21, 2016 and January 3, 2017, resulting in an 87% increase in year-over-year LEAF sales during the quarter. MARC then created a model for collecting AFV specifications, compiled lessons learned from its pilot procurement, and shared them with the rest of the F4F team. MARC also offered guidance to the other regional councils on how to plan a successful regional procurement.
Technology Integration
64 Alternative Fuel Vehicle Initiatives
Task 3: Design and deploy regional procurement initiatives The other four regional council partners have all convened local stakeholders, surveyed potential participants, and conducted gap analyses in their areas regarding AFVs. They have also been finalizing their lists of vehicle platforms and identifying requirements and vehicle specifications. Metropolitan Area Planning Council (MAPC) MAPC collaborated with the Commonwealth of Massachusetts on a purchasing agreement with XL Hybrids, to aggregate state and municipal purchases of aftermarket hybrid electric conversion systems. This pricing agreement started July 28, 2017 and runs through January 31, 2018, and offers both bulk and accelerated time-frame discounts for purchase orders submitted through the state contract. It is available to public entities in Massachusetts and nationwide. The purchasing agreement includes pricing for hybrid electric conversions for Class 2 Ford and GM vans and Class 3-6 Ford, GM, and Isuzu chassis, as well as plug-in hybrid electric conversions for Ford F-150 pickup trucks. During the first 30 days of the agreement, four fleets purchased 26 hybrid electric retrofits for class 2 and class 3-6 vans. They received discounts of 11-19%, saving upwards of $1,000 per vehicle retrofit. MAPC also partnered with the Commonwealth of Massachusetts to select vendors for its statewide Advanced Vehicle Technology (VEH102) procurement contract. Ten vendors were selected among three categories: 1) electric vehicle supply equipment (EVSE); 2) idle reduction technology; and 3) aftermarket conversion technology. Public entities in Massachusetts and across the United States can procure these technologies through piggy-back language on the VEH102 contract. Metropolitan Washington Council of Governments (MWCOG): MWCOG has collected over 234 soft commitment vehicle requests from 28 jurisdictions, including 5 from outside of its region, for its planned procurement. MWCOG followed up with these jurisdictions to fill information gaps in their requests for vehicles, including brand name(s), engine size, and cab size, then grouped vehicles based on commonalities or by base body type. MWCOG is preparing to procure these vehicles through an Invitation to Bid (ITB), which will be open to dealers November 17 – January 11, 2018. Bids will be awarded in early 2018. North Central Texas Council of Governments (NCTCOG) NCTCOG collected 71 soft commitment vehicle requests from interested fleets. In August 2017, NCTCOG finalized an RFP that included the top four vehicle platforms requested: Plug-in Hybrid Electric Compact Sedan (20 requested); Battery-Electric Sub-Compact Sedan (12 requested); Propane ½-ton Pick-Up Truck (11 requested); and Plug-in Hybrid Electric Pick-Up Truck (5 requested). Pima Association of Governments (PAG) PAG worked with three school districts interested in propane buses and two school districts interested in compressed natural gas vehicles, and has been reaching out to other school districts in the region to build interest and participation in an aggregated procurement for these vehicles. PAG will also release a Request for Information (RFI) before the end of 2017 to determine local government interest in replacing current gas and diesel municipal fleet vehicles with electric vehicles. These efforts will help to increase adoption and lower up-front costs by aggregating demand for alternative fuel school buses and electric vehicles. PAG has also been promoting its contract with Copart, a company that links vehicle buyers and sellers through an on-line vehicle auction, as a part of its regional procurement. Fleet managers who are interested in replacing their current fleets with AFVs can easily sell their “retired” vehicles, and use the funds to purchase the new vehicles. Clean Cities coalitions across the country can take advantage of this opportunity. Task 4: Design national procurement initiative with business plan for implementation The F4F national procurement initiative is divided into two parts: public-sector and private sector.

FY 2017 Annual Progress Report
Alternative Fuel Vehicle Initiatives 65
National Public-Sector Procurement: The F4F team researched national cooperative entities and assessed the value of strategic partnerships, and decided to partner with National Joint Powers Alliance® (NJPA), a government entity that facilitates a competitive solicitation and awards process nationally. Membership is free to state and local government agencies, public and private education institutes, and other non-profit organization. Members can take advantage of hundreds of contracts at any time, including those from industry-leading vehicle and leasing vendors offering alternative fuel options. The project team worked with NJPA to identify gaps in its contracts and to offer more AFV and infrastructure options for interested public entities. F4F assisted with creating and awarding contracts for NJPA’s newest clean energy category: EVSE and related services. Working with NJPA, the F4F team identified two vendors that were interested in a limited-time procurement opportunity: Zenith Motors and National Auto Fleet Group. Throughout October 2017, Zenith Motors offered F4F participants their complete line of 100% electric vehicles with a bulk discount of up to 7% off NJPA’s members-only pricing, while National Auto Fleet Group held competitive pricing on six of their most popular AFVs. The F4F team worked with other NJPA vendors to offer similar deals and opportunities on other types of AFVs. National Private-Sector Procurement: The F4F team has researched national cooperative entities and assessed the value of strategic partnerships for the private sector, and released an RFI for vendors to participate in the national private-sector procurement. The project team has promoted the opportunity to associations and companies that may have an interest in such a partnership. Task 5: Collect data and results of both the regional and national procurements to evaluate success The project team continuously tracks metrics such as the number of participants on webinars, number of Twitter impressions, and number of blog post, email, and e-newsletter recipients. Cumulative metrics for F4F outreach so far include the following: 19,347 project website views; 150,940 individuals reached through e-newsletter articles; 19,162 individuals reached through in-person events; over 106,000 impressions through social media (Twitter/Facebook); over 1,741 webinar participants; and 88,949 individuals reached through online mail e-blasts. MARC has collected data on the impact of the F4F pilot procurement, and the other regional partners continue to track how many organizations they have contacted, how many soft commitment requests they collect, and which AFVs and infrastructure are generating the most interest.
Conclusions F4F’s procurement initiatives have created opportunities for fleet managers to purchase AFVs and infrastructure at a reduced cost. F4F’s regional pilot procurement added dozens of AFVs to the Kansas City Region Cooperative Initiative contract list, and participants purchased hundreds of electric vehicles. The F4F regional procurement leads have collectively engaged with more than 125 fleets, educating fleet managers on the benefits of AFVs and opportunities through F4F. The partnership with NJPA that F4F has established will enable cooperative purchasing of AFVs on a national scale long after this project concludes. By beginning to aggregate demand for AFVs on the regional and national levels, F4F has demonstrated to manufacturers that there is a growing demand for AFVs and related infrastructure in the U.S.

Technology Integration
66 Alternative Fuel Vehicle Initiatives
References [1] http://www.fleetsforthefuture.org/ [2] http://narc.org/wp-content/uploads/7-Step-Strategic-Procurement-Process.jpg [3] http://narc.org/wp-content/uploads/F4F-Survey_Final.pdf [4] http://narc.org/wp-content/uploads/F4F-Gantt-chart-for-RFP-timing-Template.xlsx [5] http://narc.org/wp-content/uploads/RFI-Template-Example-1.docx
Key Publications The following publications are available on the Fleets for the Future website, http://www.fleetsforthefuture.org/best-practices/: • Electric Vehicle Procurement Best Practices Guide • Fleet Transition Planning for Alternative Fuel Vehicles • Gaseous Fuel Vehicle Procurement Best Practices Guide • Guide to Financing Alternative Fuel Vehicle Procurement

FY 2017 Annual Progress Report
Alternative Fuel Vehicle Initiatives 67
I.13 AFV Aggregated Purchasing Initiative: Increasing Nationwide ZEV Adoption - Enhanced Joint Procurement Process for Public Fleets (CALSTART)
Jasna Tomic, Principal Investigator CALSTART 48 S Chester Avenue Pasadena, CA 91106 Phone: (626) 744-5695 E-mail: [email protected]
Mark Smith, Program Manager U.S. Department of Energy Phone: (202) 287-5151 E-mail: [email protected] Start Date: March 15, 2016 End Date: March 14, 2018 Total Project Cost: $1,545,081 DOE share: $1,199,076 Non-DOE share: $346,005
Project Introduction The adoption of zero-emission electric vehicles (ZEVs) has been on the rise, as more ZEVs become available and the vehicles become more cost-effective. Public fleets want to lead by example, by switching their fleets to clean ZEVs. However, higher up-front costs, lack of adequate charging infrastructure, and long and complex procurement processes all present barriers for public fleets. This project aims to remove these existing barriers, and develop a replicable procurement model that will better meet the diverse needs of public fleets. This aggregated purchasing project is known as EV Smart Fleets. Project partners are California Department of General Services, Northeast States for Coordinated Air Use Management (NESCAUM), Georgetown Climate Center, Atlas Public Policy, and Ross Strategic. The project partners also worked closely with the following nine Clean Cities coalitions: Columbia-Willamette (Oregon); Denver Metro; Granite State (New Hampshire); Long Beach (California); New Jersey; Greater New Haven (Connecticut); Ocean State (Rhode Island); Sacramento (California); and Western Washington. The project focuses on 16 states, but will be open to all interested states.
Objectives The main objective of EV Smart Fleets is to develop an innovative, replicable multi-state procurement model that will provide public fleets across the country access to a wider range of ZEV models, with a 15% purchase price reduction and improved access to charging. Using a single solicitation and contract will be more efficient, than if individual jurisdictions develop their own solicitations, and will result in a larger aggregate volume of ZEVs being purchased. The specific objectives include the following: • Conduct multi-stakeholder outreach and engagement • Understand critical procurement barriers and evaluate fleet purchases • Establish a mechanism for competitive aggregated ZEV purchasing • Develop a flexible and multi-state ZEV procurement process • Roll out a program solicitation

Technology Integration
68 Alternative Fuel Vehicle Initiatives
Approach EV Smart Fleets relies on several important features. First, the development of the solicitation is based on criteria established through extensive research and case studies of aggregated purchases of ZEVs in different regions and cities. Second, project partners are engaging with, and conducting outreach to, a network of state and municipal government fleet procurement officials, to ensure the involvement of the largest possible number of government partners and buyers in the process. Third, the project will engage with automobile dealers and automakers to inform the development of the cooperative procurement process. Finally, the project includes outreach and education on the benefits of ZEVs, and the business case for purchasing them, throughout the different phases of the project. The National Association of State Procurement Officers (NASPO) and its Value Point program will lead the procurement solicitation.
Results Early in the project, the project team conducted an on-line survey of fleet managers and procurement officials, to collect information on interest in ZEV procurement among state and municipal fleets. More than 100 fleets in 18 states responded to the survey, as shown in Figure I.13.1. The shade of the state corresponds to the number of survey respondents.
Figure I.13.1: Fleet survey respondents by state
Over 85 percent of the surveyed fleets reported that cost savings and sustainability goals were the drivers for interest in fleet electrification. Achieving sustainability goals was the most frequently cited reason for fleet interest in EVs, as shown in Figure I.13.2. Survey respondents could select more than one reason.
Figure I.13.2: Reasons for interest in EVs

FY 2017 Annual Progress Report
Alternative Fuel Vehicle Initiatives 69
The project team also developed a tool that can assist fleets in evaluating the benefits of ZEVs, compared to traditional vehicles. The Fleet Procurement Analysis Tool equips users with decision-relevant information on the financial viability and environmental impact of light-duty vehicle fleet procurements. The Microsoft Excel-based tool can evaluate a variety of procurement ownership structures, vehicle types, and procurement scenarios. The tool compares procurements side-by-side on a cost-per-mile basis and provides an analysis of cash flows and location-specific lifecycle emissions. The tool is highly flexible, supports customizable sensitivity variables, and produces user-friendly results summaries as shown below. The tool was built as part of the EV Smart Fleets initiative. The tool can be downloaded at http://evsmartfleets.com/materials/fleet-procurement-analysis-tool. The project team also conducted research to determine the procurement elements that should be included in the EV solicitations, to achieve the project’s goals. There are shown in Table I.13.1.
Table I.13.1: Elements of Potential Solicitation for a Multi-state EV Agreement
Procurement Element Initiative Goal Addressed
Encourage capture of the federal electric vehicle (EV) tax credit and all available state EV
incentives
Achieve cost savings for fleets
Provide flexibility to lease or own vehicles Achieve cost savings for fleets Be useful to a wide variety of public fleets
Increase a fleet’s access to a wider range of plug-in hybrid and battery electric vehicle models
Allow fleets to finance vehicles through a third party
Achieve cost savings for fleets Maximize the number of eligible EVs.
Require pricing from the dealer’s cost up and seek discounts
Achieve cost savings for fleets Be replicable in future years
One of the research findings is that the procurement solicitation should be targeting conglomerate dealerships that can operate in multiple states. Recently an RFI has gone out to collect feedback from automobile manufacturers and potential bidders (i.e. dealerships). Once we receive feedback, we will evaluate how to best proceed, to ensure that a multi-state contract will deliver benefits over existing state contracts. In April 2017, we published Capturing the Federal EV Tax Credit for Public Fleets, a case study of a multi-jurisdictional EV fleet procurement in Alameda County, CA. In June 2017, we published Public Sector Fleet EV Procurement Examples, case studies of public fleet EV procurements in New Bedford, Massachusetts; Seattle, Washington; and the US Navy.
Conclusions Interest in ZEVs among public fleets is high. Annual target purchases at the state level should be encouraged as well as multi-year commitments for ZEV procurements. Receiving positive feedback from the bidding community on the elements in the planned RFP will be important and will determine next steps. Engagement with individual states and their fleets that are committed to procuring ZEVs in the near term will be important and could allow for stronger regional collaborations.
Key Publications All the publications and tools developed have been shared on the website: www.evsmartfleets.com Fleet Procurement Analysis Tool. 2017. http://evsmartfleets.com/materials/fleet-procurement-analysis-tool/

Technology Integration
70 Alternative Fuel Vehicle Initiatives
Capturing the Federal EV Tax Credit for Public Fleets. April 2017. http://evsmartfleets.com/materials/capturing-the-federal-ev-tax-credit-for-public-fleets/ Public Sector Fleet EV Procurement Examples. June 2017. http://evsmartfleets.com/wp-content/uploads/2017/06/Public-Sector-Fleet-EV-Procurement-Examples.pdf

FY 2017 Annual Progress Report
Alternative Fuel Vehicle Initiatives 71
I.14 Midwest Electric Vehicle Opportunities: Learning eVents, Experience (MidwestEVOLVE) (American Lung Association in Minnesota)
Lisa Thurstin, Principal Investigator American Lung Association in Minnesota 490 Concordia Ave Saint Paul, MN 55103 Phone: (651) 223-9568 E-mail: [email protected]
Linda Bluestein, Technology Manager U.S. Department of Energy Phone: (202) 586-6116 E-mail: [email protected] Start Date: October 1, 2016 End Date: September 30, 2019 Total Project Cost: $1,960,157 DOE share: $949,977 Non-DOE share: $1,010,180
Project Introduction The Midwest Electric Vehicle Opportunities: Learning, eVents, Experience (MidwestEVOLVE) project is a three-year, seven-state effort to introduce electric vehicles (EVs) to the general public, workplaces, corporate fleets and auto dealership staff. MidwestEVOLVE projects are planned for the following states: Illinois, Indiana, Michigan, Minnesota, North Dakota, Ohio and Wisconsin. The project is coordinated by the American Lung Association in Minnesota, dba Twin Cities Clean Cities Coalition (TC4). The Midwest is often overlooked as a market for EVs. As a result, the number of available vehicles, charging stations and educational opportunities has been limited in the very place where the American automobile industry was born, and where it flourishes today. The goal of MidwestEVOLVE is to change this narrative, and to help the Midwest rediscover the automobile, this time with a plug. Project partners include the Twin Cities Clean Cities Coalition (Minnesota); Chicago Area Clean Cities; Clean Fuels Ohio (Columbus, Ohio): Earth Day Coalition (Northeast Ohio); Greater Lansing Area Clean Cities (Michigan); North Dakota Clean Cities, South Shore (Indiana) Clean Cities; Wisconsin Clean Cities; Argonne National Laboratory; Make Ideas Reality Communications; and PlugInConnect. Additional project partners include five utilities, vehicle Original Equipment Manufacturers (OEMs) and auto dealerships, electric vehicle supply equipment (EVSE) providers and local non-profits engaged in promoting the use of PEVs. Geographically, the MidwestEVOLVE Project is expansive, crossing the metropolitan areas of the seven-state region including but not limited to: Akron, OH; Chicago, IL; Cincinnati, OH; Cleveland, OH; Columbus, OH; Detroit, MI; Duluth, MN; Fargo, ND; Gary, IN; La Crosse, WI; Lansing, MI; Madison, WI; Milwaukee, WI; Minneapolis, MN; Rochester, MN; Saint Cloud, MN; Saint Paul, MN; and South Bend, IN.
Objectives The objective of the project is to promote and demonstrate plug-in electric vehicle (PEV) use, by establishing local showcases that provide potential buyers with a hands-on test drive experience. Incorporating a variety of locally available PEVs will make it easier for consumers to determine the best vehicle and charging options for their personal or fleet needs. Showcases will provide consumers with an in-depth education, in a variety of conveniently located, brand-neutral settings.

Technology Integration
72 Alternative Fuel Vehicle Initiatives
This project has scheduled test drives at special events in major Midwest cities, and combines a targeted vehicle ride and drive project with a driver/fleet education experience. The following targets have been set for the project: • 25 macro (larger) ride and drive showcase events • 53 micro (smaller) ride and drive showcase events • 16 EV dealership training events • 52 workplace charging showcase events • 34 extended test drives • 39 EV forum events • Pre- and post-test drive and follow-up surveys to be collected • Outreach to an estimated 111,750 people attending the various MidwestEVOLVE events
Approach The approach for the MidwestEVOLVE project utilizes the expertise and existing partnerships and networks of the eight participating Clean Cities coalitions to build strong multi-sector partnerships that advance EV awareness and use. The project activities are a direct outgrowth of the EV awareness work the coalitions have carried out to date. All of the Clean Cities coalitions involved in MidwestEVOLVE bring a knowledge of what is needed to move the EV market forward in the industrial Midwest region, and have experience in building markets and increasing consumer and fleet awareness and acceptance of alternatives to traditional petroleum fuel. The approach uniquely intertwines a variety of audiences including utilities, automobile dealerships, public and private fleets, businesses and the general public into one multi-faceted program. Activities will include the following: • At least 25 large-scale ride and drive events, coupled with a formal educational component. These are
part of larger events such as the Twin Cities Auto Show, Chicago Auto Show, Detroit Auto Show and National Drive Electric Week. In addition to these larger events, at least 53 smaller-scale ride and drive events are being held and planned.
• A minimum of 16 auto dealership staff training workshops are helping sales staff and management better understand the unique aspects of EVs, and how to make the sale. This program continues to build on the success of a program developed and implemented in Minnesota.
• Encouraging charging at the workplace is an important part of MidwestEVOLVE. The project includes at least 52 workplace charging challenge events for both large and small employers. Approximately 34 of these events will include extended test drive programs, so both employers and employees can truly experience what driving electric means.
• A minimum of 39 meetings and/or events are developing and taking place for EV owners to connect, learn, and share their experiences. These meetings are for anyone who owns a PEV, and for those who are interested in owning a PEV.
We estimate that more than 111,750 people will attend the various MidwestEVOLVE events.
Results As of September 30, 2017 the below numbers of events have been executed: • Macro ride and drive showcase events – 4 out of 25 completed to date • Micro ride and drive showcase events – 31 out of 53 completed to date • 8 out of 16 EV dealership training events completed to date • 12 out of 52 workplace charging showcase events completed to date

FY 2017 Annual Progress Report
Alternative Fuel Vehicle Initiatives 73
• 1 out of 34 extended test drive programs completed to date • 12 out of 39 EV forum events completed to date • 60+ wrap around events have taken place, in addition to the planned events • Over 36,000 attendees have had opportunities to participate in events so far.
Project partners have developed a targeted marketing campaign to promote each of the event categories. The campaign includes key messaging, advertising, and social media and the launch of a region-wide website, to attract potential EV owners to the variety of event opportunities. Pre- and post-education surveys are being collected at ride and drive events. Data is being compiled that will be analyzed for changes in attitudes, marketing and EV sales. MidwestEVOLVE hosted a news conference at the Chicago Auto Show’s press day event to announce the seven-state project to promote the environmental and performance benefits of EVs, highlighting the goal to dramatically increase EV adoption in the Midwest. Partners secured more than 35 stories in media outlets. Working with PlugInConnect, project partners have produced several concept papers and shared them with Clean Cities coalitions and partners throughout the United States. The first concept paper explains the Minnesota Plug-in Vehicle Owners’ Circle structure. This structure has proven successful, since it has grown over four years to become one of the largest and most active regional PEV-owner groups. It currently has 1,000 members, with 50-70 attendees at each of the meetings in Minnesota. A second concept paper covers working with dealerships. As part of this project, Argonne National Laboratory has developed the EVolution Consumer Choice Tool, which provides information about EVs and how they relate to individual driving needs. More specifically, this tool helps consumers understand the different powertrain technologies and benefits the technologies offer, in comparison to conventional vehicles. It also addresses daily travel needs and EV charging availability. The tool utilizes zip code level information to customize results. It also connects consumers to extensive information about EV adoption from the DOE-supported Alternative Fuels Data Center (AFDC) and Fuel Economy websites. It incorporates research on weather effects and PEV range, charging level accepted by each PEV model, and upstream greenhouse gas emissions by region. Currently, the tool utilizes information from the seven states funded by the grant. The MidwestEVOLVE website highlights macro and micro events and features information and links about the performance and health advantages of EVs. The site regularly features events, news and blogs about MidwestEVOLVE and its programs, and includes search engine optimization.
Conclusions Working with eight Clean Cities coalitions and other partners, the project has promoted PEVs to a larger audience of potential buyers, and is beginning to bring about significant and sustainable use of EVs. Government and private fleet managers and drivers, auto dealerships, and individual consumers are now starting to actively contact project partners to receive in-depth education and exposure. Growth in the Midwest region PEV market is becoming measurable, and survey results from pre- to post-surveys show an increase of 13% in the number of consumers who attended a MidwestEVOLVE event saying pure EVs are “as good as” or “better than” gasoline vehicles. Providing consumers with opportunities to experience EVs first hand, to learn about the benefits, and to share their experiences has furthered the adoption of, and demand for, these vehicles in this region.
Technology Integration
74 Alternative Fuel Vehicle Initiatives
Each state covered by the project continues to experience different challenges and various levels of adoption of EV options and EV infrastructure. With this project, we have built an exceptional support and educational system that is taking off.
Key Publications The MidwestEVOLVE Project website: http://www.midwestevolve.org/ Social media accounts on Twitter, Facebook & LinkedIn: @MidwestEvolve

FY 2017 Annual Progress Report
Alternative Fuel Vehicle Initiatives 75
I.15 Northwest Electric Showcase Project (Forth, formerly Drive Oregon)
Zach Henkin, Principal Investigator Forth 1732 NW Quimby St, Suite 240 Portland, OR 97209 Phone: (503) 724-8670 ext 103; E-mail: [email protected]
Linda Bluestein, DOE Technology Manager U.S. Department of Energy Phone: (202) 586-6116 E-mail: [email protected] Start Date: October 1, 2016 End Date: October 1, 2019 Total Project Cost: $2,290,240 DOE share: $993,450 Non-DOE share: $1,296,790
Project Introduction Forth is a non-profit with the mission of advancing electric, smart and shared transportation in the Pacific Northwest and beyond, through innovation, demonstration projects, advocacy and engagement. The Northwest Electric Showcase Project seeks to transform the market for plug-in electric vehicles (PEVs) in the Pacific Northwest from early adoption to early mainstream, putting Oregon and Washington on a sustainable path to increasing PEV sales more than tenfold, to at least 15% of all new cars sold by 2025. Forth (formerly Drive Oregon) will lead this effort through the creation of a physical vehicle showcase, mobile “pop up” showcases, and a “virtual” showcase online, as well as targeted multimedia outreach campaigns. The project will also build a sustainable long-term model, to continue beyond the project period. As a leader in per-capita PEV sales, the Pacific Northwest is in a unique position to make the leap from early adopter to early majority, pushing toward the “tipping point” for PEVs. Since the region is already starting with a high per capita level of PEV adoption, with effective engagement tactics, the project can achieve greater PEV penetration and provide a roadmap for other regions. The target market includes the cities of Portland, Oregon and Seattle, Washington. The market similarities of the two states mean they can benefit from some regional marketing and messaging tactics; however, automakers treat these two states differently, due to zero emission vehicle (ZEV) regulations. Oregon is a ZEV state, having opted to be a part of California’s Zero Emission Vehicle Program, and receives new models of electric vehicles before Washington does, as Washington is not a ZEV state. While the variety and availability of electric vehicles continue to grow in many cities, it remains to be seen how we can move past the “early adopter” market and grow mainstream consumer appeal. Automakers and dealerships have their own strategies for developing the plug-in car segment, but must also market their gas and diesel offerings. The Northwest Electric Showcase Project set out to promote PEVs to the masses by educating consumers, stimulating electric vehicle sales, and accelerating the buying process. The following partners have substantively contributed to the project success: The City of Portland, Oregon Auto Dealers Association, Brink Communications, Columbia-Willamette Clean Cities, Western-Washington Clean Cities, American Honda Motor Company, Clipper Creek, Telefonix, eMotorWerks, Collaborative Efficiency, Chinook Book, TechSoup, ReachNow, World Trade Center Properties, Metro Portland New Car Dealers Association, EV Box, Aerovironment, Delta-Q, Kuni BMW, The City of Seattle, and Point Defiance

Technology Integration
76 Alternative Fuel Vehicle Initiatives
Zoo & Aquarium. In addition, the following utility partners have been integral to the project’s success: Portland General Electric, Pacific Power, Eugene Water & Electric Board, Clark Public Utility District, Puget Sound Energy, and Tacoma Power. Objectives The key project objective is to double PEV adoption rates in the Pacific Northwest by 2019, which translates to annual sales of 9,000 PEVs per year in Washington and 5,500 per year in Oregon. This would equate to total PEV sales of 33,000 in the two states over the three-year grant performance period. Secondary objectives include securing at least 5 million consumer impressions through direct interaction and marketing campaigns; potential PEV purchasers completing at least 5,000 test drives; at least 5,000 consumers subscribing to project emails; at least 12 new Northwest fleets taking the West Coast Electric Fleets pledge; and Forth securing at least $750,000 in cash or in-kind contributions to the Showcase Project over the project period.
Approach The Showcase Project will deploy a number of innovative tactics to engage consumers and drive PEV adoption. These include development of an electric vehicle showroom; long-term test drives facilitated through car sharing; mobile “pop-up” showcases; and focused programs and targeted campaigns aimed at low and moderate-income drivers. Forth developed a multimedia campaign in conjunction with Brink Communications that will focus on well-defined market segments and use social media to generate traffic to the physical showcase. A key project component is the coordination and staging of numerous ride and drive events throughout Oregon and Washington. Forth is working directly with a variety of community stakeholders, leveraging their relationships and expertise, to engage local consumers in cities around the Pacific Northwest. The region’s electric utilities have been especially receptive to collaboration, and the project has emphasized working with them, to communicate the benefits of PEVs to their customers. Other partners in the ride and drives include regional Clean Cities coalitions, and electric vehicle owners groups. While some utilities have well-defined transportation electrification plans, many do not; our aim is to support any partner who is willing to participate, regardless of how new they are to these concepts.
Results Upon award of the U.S. Department of Energy (DOE) grant, Forth began the search for a suitable place to house the showcase. Portland General Electric (PGE), a large utility in the Portland, Oregon, metropolitan area, has been a supporter and member of Forth’s Board of Directors since its inception. PGE occupies most of the Portland World Trade Center group of buildings in downtown Portland, and had a rental space available that was an ideal location for the showcase. In Fiscal Year 2017 (FY17), Forth created an electric vehicle showroom, called the ‘Go Forth Electric Showcase,’ at the World Trade Center location. The showcase is open six days a week, and is staffed by educated volunteers and staff members who are on site to respond to consumers’ questions, and guide walk-ins and scheduled visitors through the different elements of electric vehicle ownership. A variety of PEVs are available for test drives, sample electric vehicle charging stations are on display, and a selection of brand-neutral PEV educational material is available to consumers. Forth leases all the vehicles used for the showcases and ride and drives from participating local auto dealerships One of the most common questions from showcase visitors is ‘How do I charge an electric vehicle?’ Charging methods, locations and options are still a mystery to many potential PEV owners. New PEVs, with improved driving ranges of 200 miles per charge, help to assuage consumers’ range anxiety, but charging a car is still a new and unfamiliar experience for most people. PEV charging also takes longer than filling up a gasoline car, so many people are wary at first. Most visitors are surprised, however, and reassured to learn that nearly 80%

FY 2017 Annual Progress Report
Alternative Fuel Vehicle Initiatives 77
of charging occurs at home. To educate consumers about PEV charging, Forth installed several different charging units, also known as electric vehicle supply equipment (EVSE), at the showcase, for visitors to view and handle. In seeking EVSE unit displays for the showcase, Forth leveraged existing relationships with PEV manufacturers. This led to the project receiving more than enough units, allowing us to rotate the EVSE in the charging display, to give exposure to different manufacturers and new EVSE models. The EVSE display also educates consumers about the benefits of ‘smart,’ network-enabled EVSE units. All of the EVSE being used have been donated to the project. As Forth engages with partners, an additional key component to this work has been our adaptive marketing strategy. We developed an EV101 flier and related educational materials that have been used by organizations that are either partnering on the project or are supportive of the effort to advance electrification (see Figure I.15.1).
Figure I.15.1: EV 101 flier (Produced by Forth/Brink)
Energy providers, auto dealer associations, and a number of local governments have each seen value to having brand neutral educational materials that speak to the benefits of driving a PEV, without endorsing particular models of PEVs or charging equipment. As the project progresses, we will continue to evaluate the need for these communication tools and adapt and modify them as needed, with a goal of reaching a variety of audiences that may consider purchasing or leasing a new or used electric car. In FY17, Forth also hosted five ride and drive events in Oregon and one event in Washington, as shown in Table I.15.1. We partnered with local organizations to host these ride and drives for their employees and customers. Whenever possible, we coordinated the ride and drives with existing local events where our utility partners had a presence, to attract foot traffic and maximize our combined resources. The ride and drive venues included public parks, farmer’s markets and brew fests.

Technology Integration
78 Alternative Fuel Vehicle Initiatives
Table I.15.1: FY 2017 Regional Ride and Drive Events Date Location Partner Total Test Drives Notes
April 22nd, 2017 Bend, Oregon Environmental Center
18 50 plug-in sales as part of group buy
June 16, 2017 Portland, Oregon Hacienda Community
Development Corporation (CDC)
5 Low-income community
September 9, 2017 Seattle, Washington Puget Sound Clean Air Agency, King
County
20 600 attendees
September 10, 2017
Eugene, Oregon Eugene Water Electric Board
10 100 attendees
September 16, 2017
Portland, Oregon Oregon Electric Vehicle Association
20 300 attendees
September 28, 2017
Portland, Oregon Pacific Power 27 200 attendees
The project team provided planning and onsite support staff for each event, as well as the fleet vehicles for test drives. There were some challenges in getting participation from local car dealerships to provide test drive vehicles, as not all dealerships are currently selling PEVs. The attendees primarily requested information regarding available car models, charging options and available state and federal incentives. Most attendees were in the process of buying, or were committed to buying, an electric vehicle as their next car. Overall, our partners saw great value in hosting ride and drive events and were eager to participate in planning future events.
Conclusions As the Forth team and our partners enter year two of this project, we have a number of considerations and objectives for 2018. The interest for ride and drives and demand for electric vehicles has increased, and we do not expect a challenge to meeting our goal of twelve Pacific Northwest regional ride and drives for the year. While we have been successful in driving traffic to our events and to the Portland Showcase, we acknowledge the need to strengthen our relationships with local and regional electric vehicle dealerships. These dealers are key to translating the interest that we are seeing at our events into vehicle sales with the consumer. With the addition of the Oregon Clean Vehicle Rebate and a variety of new vehicles on the market, such as the new Nissan Leaf and Tesla Model 3, we expect that 2018 will be strong year for consumer sales and engagement for electric vehicles. Plans for 2018 consumer engagement include using the feedback and lessons learned from our 7 months of physical showcase operation to improve foot traffic and visibility to business stakeholders and local Portland consumers. The Forth Northwest Electric Showcase team will also continue to seek opportunities to leverage existing events in which our partners are participating, to amplify regional ride and drive efforts. Our work with Northwest utilities, combined with available state and local incentives, should continue to provide an excellent platform for transforming the market for PEVs.
FY 2017 Annual Progress Report
Alternative Fuel Vehicle Initiatives 79
I.16 Accelerating PEV Adoption in New England (Plug In America)
Joel Levin, Principal Investigator Plug In America 6380 Wilshire Boulevard #1010 Los Angeles, CA 90048 Phone: (415) 323-3329 E-mail: [email protected]
Eric Cahill, Principal Investigator Plug In America 6380 Wilshire Boulevard #1010 Los Angeles, CA 90048 Phone: (415) 323-3329 E-mail: [email protected]
Linda Bluestein, Technology Manager U.S. Department of Energy Phone: (202) 586-6116 E-mail: [email protected] Start Date: October 1, 2016 End Date: September 30, 2019 Total Project Cost: $1,000,000 DOE share: $500,000 Non-DOE share: $500,000
Project Introduction A plug-in electric vehicle (PEV) purchase involves far more risk than a conventional vehicle purchase. Consumers need exposure to electric cars, but they also need to know whether a PEV works for their lifestyle, which PEVs will best meet their needs, and how much money they can save by going electric. They need to trust the information source, and they need competent advice, to navigate a more complex shopping and purchase experience that involves entirely new considerations, such as battery charging and government incentives. These risks stand between a potential PEV customer and an actual PEV sale. Introducing potential consumers to electric vehicles through dynamic test drive experiences has proven effective in boosting consumer awareness and spurring adoption by individuals. Well-designed and produced events overcome consumer confusion about PEVs, help educate them about the specific attributes of the cars, and provide a launch point into adoption. Ride and drive events are a critical element of this program, coalescing three important pieces of the puzzle: • Nothing is more effective in creating demand for PEVs than well-designed test drive experiences.
Customer demand creates dealer engagement, which then improves the customer experience in a virtuous circle;
• Ride and drive events allow salespeople to practice their PEV customer engagement skills in a controlled environment; and
• Ride and drive events create hot sales leads for dealers, which will increase their willingness to participate.
Dealerships’ lack of engagement in PEV sales remains an ongoing issue. Recent reports and studies from Consumer Reports [1], the Sierra Club [2], and Ipsos RDA [3], note widespread unfamiliarity with PEVs by

Technology Integration
80 Alternative Fuel Vehicle Initiatives
sales staff, longer sales cycles, and real or perceived impacts on dealer profitability. Customer satisfaction with the PEV purchase experience suffers, relative to conventional vehicles [4]. For many automakers, PEVs are at least a generation or two away from profitability. Consequently, many automakers calibrate their marketing and sales efforts for regulatory compliance and containment of corporate losses. Auto dealers, on the other hand, see PEV sales as involving a lot of extra work for potentially little reward. As volume-based businesses that are dependent on high-profit trucks and SUVs, many dealers simply cannot, or will not, divert the resources needed to develop or grow PEV sales. For dealers, finding quality and effective programs to prepare salespeople for PEV sales can be challenging. Automaker programs are often model-specific, may omit or skim over potentially influential government and utility incentive programs, and may overlook many of the systemic challenges that dealers face. Some PEV training programs have been developed by non-profits or other third parties that are very knowledgeable about PEVs, but have little retail automotive experience or familiarity with the automotive industry. All of these approaches fall short of the task. For this project, Plug In America (PIA) partnered with the Massachusetts, Greater New Haven (Connecticut), Vermont and Ocean State (Rhode Island) Clean Cities coalitions, as well as the Massachusetts State Auto Dealers Association (MSADA) and two utilities, National Grid and Eversource.
Objectives The project’s primary objective is to raise awareness and increase consumer adoption of PEVs in the partner New England states, by exposing consumers to PEVs. Year one goals included designing and implementing a total of 17 PEV “Showcase Events” featuring ride and drive experiences across Connecticut, Massachusetts, Rhode Island and Vermont. This was accomplished through experiential events targeted at a mix of fleet, workplace and community audiences. The year one plan called for approximately three (3) fleet manager, six (6) workplace and eight (8) public engagements. These events were designed to contribute to the overall project objective of delivering a total of approximately 2,000 individual test drive experiences over the project’s three-year performance period, while exposing approximately 10,000 people to PEVs in the region. A second objective is to experiment with methods for engaging more dealers and improving the consumer’s PEV purchase experience, through dealer training in the greater Boston, Massachusetts metropolitan area. Year one goals included developing training materials and recruiting approximately 10-20 dealers to participate in the program. PIA and its partners will endeavor to increase PEV sales by 25% at participating dealers over the life of the program. A final project objective is to create a sustainable PEV Showcase model that can be replicated in and beyond the New England region after project completion.
Approach PEV Showcase Events Project partners will conduct a mix of fleet, workplace and community PEV Showcase Events across the four New England states of Connecticut, Massachusetts, Rhode Island and Vermont. Clean Cities partners will conduct fleet and community showcase events during each of the first two years of the project. PIA will organize community showcase events during the first two years, as part of National Drive Electric Week (NDEW). PIA will also design a dealer PEV training program and recruit dealers to participate, with assistance from the Massachusetts project partners. REACH Strategies will conduct a total of 16 workplace events over the three-year project period.

FY 2017 Annual Progress Report
Alternative Fuel Vehicle Initiatives 81
The project partners agreed to develop a working document that catalogs current best practices for exposing consumers to PEVs through experiential events. This document will guide the project partners in the conduct of their own showcase events, while ensuring a standardized and replicable approach across regions. PIA furnished each of the funded partners with the ride and drive best practices guide. At the completion of each event, partners are responsible for preparing a report, including feedback and lessons learned, that can be incorporated into the best practice document, to guide future efforts. The project partners will provide feedback on the OMB-approved DOE ride and drive surveys, developed by the National Renewable Energy Lab (NREL), to improve the response rate and the quality of data collection at each of the showcase events. PIA also procured a set of tablet computers, pre-loaded them with the required survey links and shipped them to event organizers for use in conducting the required DOE surveys at each event funded under the award. Dealer Training PIA, in concert with its Massachusetts partners, developed a pilot training program for the greater Boston metropolitan area that integrates auto dealers into the PEV Showcase model. The partners chose Boston and the Route 128 Technology Corridor to support the launch of the “e-Star” program, a specialized program to train and support dealers selling PEVs. e-Star consists of three primary activities: (1) qualifying new car dealers to meet industry-wide standards for PEV sales and customer support; (2) equipping these dealers with additional training, tools and resources, to support more PEV sales and an improved purchase experience; and (3) connecting customers interested in PEVs to participating PEV dealers who are being supported by the coordinated promotional efforts of program partners. The goal of the e-Star pilot is to reduce the risk to both PEV customers and dealers, by connecting the customers with competent PEV advisors at specially trained and qualified dealerships. In return, participating dealers receive a suite of benefits, including PEV incentives and sales training for designated PEV advisors, online tools, and expert assistance with staying abreast of accurate and timely PEV incentive information and improving the customer’s purchase experience. Dealers also benefit from lead generation activities through online and ground-level customer engagement, and dealer recognition by project partners. All of these activities are targeted at leveling the risk-reward equation for those dealers willing to commit to higher standards of PEV sales and customer support. To maximize impact, the project partners agreed to launch the e-Star program just ahead of National Drive Electric Week (NDEW) in mid-September, 2017.
Results The partners drafted an initial best practices guide as a living document to be developed and expanded with lessons learned over the performance period. The guide encompasses additional activities deemed central to the success of PEV Showcase events. Examples include early engagement with Original Equipment Manufacturers (OEMs) and community stakeholders, dealer recruitment and training, and coordinated outreach and promotion. For the reporting period, the project partners designed and implemented 17 PEV Showcase events in the New England region. These comprised 10 community, six (6) workplace and one (1) fleet event. Table I.16.1 shows the distribution of the events conducted by the project partners, and indicates that the project is progressing according to plan.

Technology Integration
82 Alternative Fuel Vehicle Initiatives
Table I.16.1: Distribution of PEV Showcase Events by Project Partner (Plan versus Actual)
Plug In
America REACH
Strategies MA CT RI VT
Plan Actual Plan Actual Plan Actual Plan Actual Plan Actual Plan Actual
Fleet 0 0 0 0 1 1 0 0 0 0 0 0
Workplace 1 0 6 11 0 0 0 0 0 0 0 0
Community 3 6 0 0 1 1 1 1 1 1 1 1
Total 4 6 6 11 2 2 1 1 1 1 1 1
At the request of DOE, PIA and its partner, REACH Strategies, performed a comprehensive review of the required PEV Showcase survey questionnaire, and made recommendations on ways to reduce wait times, improve data quality and encourage increased response rates. NREL subsequently incorporated many of the recommendations put forth by PIA and REACH in a revised survey instrument. Though the partners collected survey data for the PEV Showcase events, analysis of the data by NREL is pending.
Workplace Events The vast majority of events produced in 2017 were workplace events. Project partners executed a total of 11 workplace events across Massachusetts, Vermont, and Rhode Island. The 11 events produced a total of 797 test drives and 273 passenger rides, for a total of 1,070 PEV experiences. The workplace events were held during working hours, generally on Tuesday, Wednesday, and Thursday. The events included no fewer than three (3) brands and five (5) test drive vehicles. Events also included a range of additional informational booths from local utilities, electric bicycle companies, solar providers and more. See Tables I.16.2 and I.16.3 for workplace test drive results and workplace survey results, respectively.
Table I.16.2: Workplace Test Drive Results Location Test Drives Passenger Rides State Biogen 166 41 MA
Boston Properties 68 22 MA RI State Departments 116 18 RI
Hanover Insurance 54 6 MA National Life 78 22 VT
UMass Medical 55 17 MA AstraZeneca 62 23 MA
Massport 107 99 MA Schneider Electric (Andover) 74 20 MA
Burton 11 5 VT Prudential Center 6 0 MA
Totals 797 273

FY 2017 Annual Progress Report
Alternative Fuel Vehicle Initiatives 83
Table I.16.3: Workplace Survey Results
Driver Responses Pre-Test Drive Survey
Post-Test Drive Survey
Plug-in electric vehicles are better or just as good as available vehicle options today
68% 73%
Pure electric vehicles are better or just as good as available vehicle options today
56% 70%
Participants who expect to consider a plug-in electric vehicle as next purchase/lease
67% 75%
Participants who expect to consider a pure electric vehicle as next purchase/lease
61% 75%
It can be difficult to obtain dealer support for public events, as they are generally held on weekends, the busiest time for car dealers. Workplace events, however, do not encounter this same difficulty, as the events are usually held mid-day, during weekdays, the slowest times for dealerships. Additionally, the Massachusetts dealerships are now in the third year of participating in the MASS DRIVE CLEAN program and are very familiar with the value of participating in such events. Workplace events offer the distinct advantage of providing a targeted channel to consumers with a high likelihood-to-purchase, in a setting that is most amenable to allowing those consumers to materially advance their PEV sales search process - a midday test drive experience during the workday. Beyond offering the ability to target certain demographics in a way that is difficult to achieve in other event settings, it is likely that consumers are voting with their feet in participating in a vehicle test drive while at work. Consumers closest to needing a new vehicle are likely among those with the greatest interest in allocating time during the workday to participate in a workplace test drive event. Community Events One of the aims of the project is to equip project partners with information and resources to implement their own PEV Showcase events, borrowing from best practices shared among the partners. The Electric Vehicle Showcase and Ride & Drive Event held in Barre, Vermont is one such example. The PEV Showcase was held in conjunction with the Barre Heritage Festival on July 29th. Vermont Clean Cities organized the event, partnering with the Vermont Vehicle and Automotive Distributors Association (VADA), Green Mountain Power, Drive Electric Vermont, Vermont Public Service Department and local groups to make the event a success. The event witnessed the largest congregation of dealer-represented EVs in the state, involving seven different dealerships, and featuring eight different PEV models from GM, Ford, Hyundai, Nissan, Toyota and VW. Many participants test-drove multiple plug-in vehicles. Additional models such as the Tesla Model S and BMW i3 were also on static display, accompanied by enthusiastic owners who shared their experiences with festival attendees. The event delivered 34 ride and drives in a two-hour window. An estimated 300-350 people engaged with the vehicles (spoke with dealers or owners or stopped by the tent). Coverage by the local TV station, WPTZ, Facebook feeds, and others led to an additional 1,300 exposures. Surrounded by PEVs, Vermont Governor Phil Scott spoke to the importance of PEVs to the transportation sector, with a live Facebook feed that garnered over 500 views. Engaging dealers to support events held on weekends is often challenging. The organizers attributed the success of the Barre event to early outreach with community partners, most notably the state auto dealer association, which encouraged dealers to support the event with vehicles and staff, despite it being held on a

Technology Integration
84 Alternative Fuel Vehicle Initiatives
Saturday. The PEVs were situated in the path of prime festival foot traffic, with a registration tent posting clear and visible signage, which facilitated engagement by festival visitors. This is consistent with feedback from partners hosting similar events. The Barre, Vermont event also yielded some lessons learned. To ensure all participants complete the pre-drive survey, organizers should require that participants be fitted with a colored wristband at the registration tent. Only customers with wristbands should be allowed behind the wheel. Locating the registration tent adjacent to or nearby the PEVs and their dealer representatives further prevents attendees from bypassing the registration process. Organizers should convene a meeting with the dealer representatives in advance of the showcase to review the ground rules and to emphasize the wristband requirement. To facilitate a speedy registration process, the registration desk should be adequately staffed and equipped with a sufficient number of cellular-enabled tablet computers preloaded with pre- and post-test drive survey links. Staff should be positioned at the end of the route to ensure that participants complete the post-test drive survey as they exit the course. Prior to the event start, organizers should test the tablets to ensure a robust signal is available at the event site. Having printed surveys on hand is a good back-up measure when all else fails. The timing of the showcase events also impacted the project. The partners strategically back-loaded the PEV Showcase events, conducting many in the mid to late summer period, to coincide with the 2017 NDEW campaign in mid-September. Although the goal was to increase the visibility of the events, the timing also made for logistical challenges, including a shortage of tablet computers for the surveys. Additionally, the surveys did not include a field for event name and location, so it was difficult to associate survey data with particular events. Timely accounting of event expenses was also negatively impacted. These represented areas of risk that organizers could work to mitigate when planning future events. Dealer Training PIA launched a website for dealer resources [5], and customized its online dealer enrollment process and web-based portal for Boston area dealers. Designed to be a one-stop shop, the PEV dealer portal is loaded with data specific to Massachusetts buyers, such as PEV incentive information, charging availability, local utility rates and programs, qualified electricians and other resources. PIA enlisted a veteran PEV dealer advisor to assist with the delivery of training and support under the program. PIA supplied a curriculum and presentation deck for instructors, as well as PEV sales training manuals for all students who attended the training. A half-day training session was held on September 6, 2017, and covered government incentives, charging, utility rates and programs and PEV sales best practices. Representatives from the Center for Sustainable Energy and Mass Energy Alliance delivered overviews of the MOR-EV state rebate and DriveGreen PEV group purchase programs, respectively. Attendees included representatives from additional project partners and the Metropolitan Area Planning Council. PIA recruited dealers through project partners, including Massachusetts Department of Energy Resources (Mass DOER), Massachusetts Clean Cities (MACC) and the Massachusetts State Auto Dealers Association (MSADA). The latter published an article written by PIA and promoting the e-Star program in the August installment of its monthly magazine [6]. The organizers attributed the robust attendance by dealerships at the September 6 training session to a couple of key factors. First, recruiting dealers requires a full court press to include outreach through trusted networks that include dealer associations, manufacturers and individual dealers. Outreach is likely to be ignored unless it is done through a trusted source or channel. MSADA’s early involvement ensured access to dealerships through a trusted source. Organizers also leveraged dealer connections through partner organizations with pre-established relationships with dealers. Additionally, organizers had some success engaging dealers through

FY 2017 Annual Progress Report
Alternative Fuel Vehicle Initiatives 85
manufacturer representatives, typically through the automaker’s marketing and sales groups. A featured mention in MSADA’s monthly magazine also lent legitimacy to the program. Second, the goal should be to build trusted relationships with dealerships that can then provide PEV and staff resources to support PEV Showcase events throughout the year. Key to this is respecting the dealer’s time. Dealer association and manufacturer representatives provided useful guidance for communicating effectively with individual dealerships. Chief among these is keeping correspondence clear, short and to the point while directly addressing the value of the engagement to the dealer (e.g. what do they get out of it?). The e-Star program emphasized, for example, how the training helps salespeople get up the PEV learning curve faster, improve the customer experience and speed sales turns (how long it takes to initiate and close a sale) – all at no or minimal cost to the dealer. Dealers and manufacturers further advised that interacting with dealers is most effective during the middle of the week and in the middle of the month, avoiding weekends and the last week of the month when at all possible, as these times conflict with store demands. Dealers were surveyed prior to and just after the training session. Data from the surveys revealed several findings. Salespeople confirmed that the training shored up key gaps in PEV knowledge related to government incentives, utility rates, qualified electricians and methods for engaging PEV customers. Attendees also found the training content, delivery method and duration of the training appropriate for the audience. All attendees indicated they would recommend the training to other dealers and more than half rated the training as favorably as, or more favorably than, factory training. Figure I.16.1 demonstrates that training attendees observed improvements in several dimensions of performance associated with PEV sales, shoring up knowledge gaps in government PEV incentives and utility rates and confidence referring customers to qualified electricians for assistance with home charging. Sales staff universally recommended the training to others, shared several positive observations and compared the program favorably, relative to the factory training offered by automakers. Constructive feedback for future sessions included providing additional opportunities for discourse and dialogue between instructors and students and among the students themselves.
Figure I.16.1: Dealer salesperson knowledge self-assessment findings (Plug In America 2017)

Technology Integration
86 Alternative Fuel Vehicle Initiatives
To leverage the PEV training provided to Boston area car dealers, PIA awarded $2,500 each to a handful of organizers running awareness events, as part of the 2017 National Drive Electric Week (NDEW), which ran from September 9-17, 2017, delivering 276 events nationwide. The funding awards encouraged event organizers to add a ride-and-drive component at planned events or to conduct entirely new ride and drive events in the pilot region. In all, the events exposed 1,906 people to PEVs with 326 ride and drives.
Conclusions In all, the partners captured 743 pre-drive and 430 post-drive survey responses. The initial data from the project suggests that the showcase events, by exposing consumers to PEVs, fostering conversations with PEV advocates, and getting consumers behind the wheel, improved public perception and increased consumers’ willingness to consider a PEV as their next car. While running PEV showcase events alongside larger community events can draw more traffic and expose more people, workplaces offer a more contained and controlled experience that can target customer segments that are more likely to consider a PEV in the first place. Initial findings also suggest that a third-party salesperson training program, similar to the kind the project delivered for the Boston region, deepens dealer knowledge of key considerations important to the customer purchase decision. The partners look forward to furthering these relationships and observing the impact on dealer participation in PEV showcase events, as well as obtaining feedback from dealer participants.
References [1] Evarts, E. (2014). Dealers not always plugged in about electric cars, Consumer Reports’ study reveals. Consumer Reports. April. Retrieved from https://www.consumerreports.org/cro/news/2014/04/dealers-not-always-plugged-in-about-electric-cars-secret-shopper-study-reveals/index.htm [2] REV UP Electric Vehicles: Multi-State Study of the Electric Vehicle Shopping Experience. (2016). Sierra Club. Retrieved from https://content.sierraclub.org/creative-archive/sites/content.sierraclub.org.creative-archive/files/pdfs/1371%20Rev%20Up [3] Finlay, S. (2017). Car Dealerships Fail EV-Selling Test, Mystery-Shopping Study Indicates. WardsAuto. Retrieved from http://wardsauto.com/dealer/car-dealerships-fail-ev-selling-test-mystery-shopping-study-indicates [4] Cahill, E. C. (2015). Distribution Strategy and Retail Performance in the U.S. Market for Plug-in Electric Vehicles: Implications for Product Innovation and Policy. (Ph.D. Doctoral Dissertation), University of California, Davis, Davis, CA. [5] https://pluginamerica.org/eStar/ [6] https://issuu.com/massstateautodealers/docs/massautodealeraugust2017/6
Key Publications PEV Showcase Guidance Document Presentation to DOE at the 2017 PEV Roadmap Conference Presentation at the 2017 Behavior, Energy and Climate Change Conference PEV Showcase Event Final Reports
FY 2017 Annual Progress Report
Alternative Fuel Vehicle Initiatives 87
I.17 Safety Training and Design, Permitting and Operational Guidance for Garage Facilities Maintaining and Parking Natural Gas, Propane and Hydrogen Vehicles (Marathon Technical Services USA, Inc.)
Rob Adams, Principal Investigator Marathon Technical Service USA, Inc. 6 Venus Crescent Heidelberg, Ontario, N0B 2M1 Phone: (519) 699-9250; E-mail: [email protected]
Dennis Smith, Technology Manager U.S. Department of Energy Phone: (202) 586-1791 E-mail: [email protected] Start Date: September 01, 2016 End Date: August 31, 2019 Total Project Cost: $940,912 DOE share: $750,000 Non-DOE share: $190,912
Project Introduction This project is focused on vehicle maintenance and storage facilities for gaseous fuel vehicles. The gaseous fuel types include Compressed Natural Gas (CNG), Liquefied Natural Gas (LNG), Liquefied Petroleum Gas (Propane or LPG) and compressed hydrogen (CH2). Design codes for stations that dispense gaseous fuels are mature and provide relatively clear, understandable, and constructible standards; however this is not the case with the codes that are commonly referenced for design and upgrade of vehicle maintenance and storage garages. There are gaps and discrepancies between codes, resulting in facilities that are either unsafe or over-designed and prohibitively expensive. This weakness in code guidance results in a heavy dependence on local engineering judgment and limited knowledge of best practices. Often, consultants hired by maintenance facility or garage owners have little or no experience with facilities designed for gaseous fuel vehicles, so implementation issues persist. Similarly, local code officials may have little firsthand experience with designing facilities for gaseous fuel vehicles, and may be uncomfortable reviewing and approving plans related to these projects. There is a current lack of easily understood and applied facility design resources. Lay people and even code officials need a reference document and training to assist them in understanding what is the best industry practice to provide safe upgrades to facilities, why these upgrades are done, and how upgrades may differ depending on regions and fleet types.
Objectives The objective of this project is to provide safety training and guidance related to garage facility upgrades and building modifications that will support the use of commercially available natural gas, propane, and hydrogen alternative fuel vehicles (AFVs), as defined by the Energy Policy Act of 1992 (EPAct). There have been several efforts to alleviate problems in interpreting codes that apply to gaseous fuel facilities, and to support the dissemination of best practices. These efforts have included a code review and summary by the Clean Vehicle Education Foundation (CVEF) and the publication of project case studies in trade magazines. Technical training that is focused on end users and code officials is also available, from Marathon

Technology Integration
88 Alternative Fuel Vehicle Initiatives
Technical Services USA, Inc. (Marathon), and others. While these efforts have been beneficial, there is a need for a more evolved and widely promoted program to organize and disseminate this information. There is limited benefit to simple regurgitation of current code requirements. Instead, this project provides a more interactive and hands on approach to interpreting codes, by way of case studies of various facilities, to guide fleets and safety officials through current and future gaseous fuel facility development. This project is focused on facility owners, consulting engineers, fire marshals and code officials, to increase their general knowledge of gaseous fuel risks, which differ from conventional fuel risks; raise stakeholder awareness of code requirements; and provide a wide variety of case studies for various gaseous fuels in differing climates and fleet types. This approach provides practical knowledge and industry experience for stakeholders with no first-hand experience with gaseous fuels. Overall, the goal of this project is to enhance the safety of gaseous fuel vehicle garages, while controlling the cost of facility upgrades. The project will address perceived and real problems of gaseous fuel safety and affordability.
Approach For this project, Marathon has teamed with Clean Fuels Ohio and seven other Clean Cities coalition partners: Kansas City Clean Cities, Long Beach Clean Cities, Sacramento Clean Cities, Tucson Clean Cities, Virginia Clean Cities, Clean Communities of Western New York (Buffalo), and Western Washington Clean Cities (Seattle). These partners provide the local connections, knowledge and support to identify and interact with fleets, and to support the local training sessions in year two. The project team has recently completed the first year of a three-year project term. In the past year, the team has finalized a total of nine regional training locations across the United States, reflecting all climate types and all four gaseous fuel types (CNG, LNG, LPG and H2.) The locations were selected based on a combination of factors, including a strong presence by gaseous fuel fleets that have already completed maintenance facility upgrades appropriate for their fuels. A second significant factor in the selection of location was the presence of an active local Clean Cities partner that has teamed with Marathon on this project. Once the locations were finalized, the Clean Cities partners collected data from the gaseous fuel fleets related to their garages, including fleet and building size, type of fleet, type of upgrade performed and cost information. Based on this initial data, Marathon planned and executed an initial tour of the best garages. The tours included further data collection and photo documentation of the facilities. Marathon conducted a further screening of the facilities and produced the final list of facilities to be used for case studies and site tours during the training sessions. In parallel with the above site tour effort, Marathon researched and is in the process of producing training documentation. The final product will consist of an easy-to-read manual that will provide users with the background theoretical and code knowledge to understand why the fleets highlighted in the case studies had their garages upgraded, and why certain new operating procedures were implemented. This resource will be peer-reviewed, and supplemented and enhanced by a series of in-person training sessions to take place in year two. These training sessions will include classroom time supported by tours of the selected local garages that showcase best practice upgrades and operating procedures. Columbus, Ohio has been selected as the location for the beta training. In year three of this project, training and best practice materials will be converted to an online format, and will be made available to a broader audience, after the site trainings have been completed. It should be noted that DOE awarded two projects under this FOA topic, one being managed by Marathon Technical Services and one managed by the Gas Technology Institute. Although the overall goals, objectives, and approaches are somewhat similar they have formed different teams of subject matter experts and will be focusing on different geographic regions for their training workshops and site tours. However, Marathon and

FY 2017 Annual Progress Report
Alternative Fuel Vehicle Initiatives 89
GTI are actively collaborating to share technical information and coordinate workshop scheduling and site tours in order to avoid overlap and duplication and to assure consistency with regard to technical content and recommended best practices for facility upgrades.
Results The team is currently progressing based on its original plan and is meeting its goals. Marathon has performed an extensive search for documentation produced by DOE, as well as by other government and industry sources. During this search, Marathon determined that there was no classroom-ready documentation available that provides the required scope and approach for this project. Marathon has reviewed the existing documentation, which will be used as reference for the compilation of the training materials. Marathon has also identified, procured, and reviewed the various codes that play a role in US gaseous fuel vehicle maintenance garage upgrade projects; summarized the applicable clauses for each fuel type; and annotated them with information on the typical approach taken by industry to address each clause. This document will assist users in applying the relevant code requirements. The Marathon team encountered some challenges in meeting its internal goals for identifying the exemplary fleets to be included in the project. Although the number of garages initially identified was lower than anticipated, the Marathon team was able to locate good exemplars in a wide variety of fleet and climatic situations, in part by making schedule and manpower adjustments, to allow more time and effort for fleet identification and recruitment. Marathon has completed the initial fleet identification and remote assessment. Clean Fuels Ohio coordinated with the other Clean Cities coalition partners in setting up meetings with the potential project fleets, and Marathon has subsequently toured the identified garages. Based on these initial tours and interviews with fleet managers and shop managers, the Marathon team has finalized a list of fleets to be used for the best practice case studies and as candidates for tours to be conducted during the on-site training sessions. Marathon has completed the case studies in draft form, and they will be incorporated into the training materials as they are finalized. The regional training sessions will focus on just the gaseous fuels that are common or likely in each region; for example, hydrogen and LNG will each be covered at only one of the nine regional trainings, whereas CNG will be covered at all nine sessions. Marathon has assembled a draft training session schedule that is currently being distributed to its Clean Cities partners, to continue with the planning for the classroom sessions that will take place in spring and summer 2018 (year two.)
Conclusions This project is still in process. Since this report only covers the first work period of a multi-year project, conclusions listed below represent those observed to date. In addition, challenges are noted that have been identified and addressed along the way.
1. The project remains on track to achieve its initial goals. Even with some minor schedule adjustments, the general approach and project schedule originally proposed are still being applied.
2. It is Marathon’s desire to provide a quick reference guide that is useful and instructive to a wide variety of users. Although there have been other technical papers and manuals produced, including some funded by DOE, the Marathon team was unable to locate an existing manual that meets the comprehensive needs of this project. Material that was reviewed tended to be too technical for some users, too regional in focus, or too detailed in certain aspects of the upgrades to provide an effective easy read for all users. For these reasons, Marathon is developing the training materials in-house.

Technology Integration
90 Alternative Fuel Vehicle Initiatives
3. As noted previously, there was some challenge initially in locating the desired numbers of fleets. The Marathon team observed that government-owned fleets tended to be very open and interested in participating in the project. On the other hand, some private fleets were reluctant to participate, due to concerns of liability and inadvertent release of trade secrets. Although the Marathon team has subsequently located sufficient sites for case studies and tours, the team would have preferred a more complete mix of public and private companies to see if the approach to upgrades would vary in the public versus private sector fleets.
4. At the outset of this project, the team expected that there would be an abundance of existing CNG garage upgrades, and this indeed proved to be the case. On the other hand, there has been a transition in the industry away from LNG in transit and garbage fleets, and even in the day-tractor Class 8 truck fleets, so there is a very limited number of LNG garages available for study. Hydrogen fleets are still few, so the team knew that it would be a challenge to locate a significant facility that has already been upgraded for hydrogen; however, the team has located one such facility and will promote this training session nationally, and not just regionally. LPG garages are plentiful; however, these garages had no LPG specific upgrades, although several garages had LPG specific operating procedures.
5. Marathon toured several garages that would not meet current code requirements, although they may have met the code in place at the time of introduction of gaseous fueled vehicles. These garages were not selected for use as exemplars, but Marathon made suggestions to these fleet owners for improvements they should consider.
6. During the facility tours, Marathon discussed operating practices with fleet managers. While a number of good practices were identified, some fleets asked not to be identified as the source of the recommended operating practice. Marathon will accommodate this request by consolidating the best operating practices in a single list, without references to specific fleets.
7. The Marathon team is confident that it has assembled the information needed to facilitate the compilation of training materials and to provide the training itself. Training will progress on schedule in 2018.
Key Publications The published documentation for this project will be available in the second quarter of the 2018 DOE fiscal year, timed to coincide with the beta training that will take place in March in Columbus Ohio.

FY 2017 Annual Progress Report
Alternative Fuel Vehicle Initiatives 91
I.18 Training For Cost-Effective, Code-Compliant, Maintenance Facilities for Gaseous Fuel Vehicles (Gas Technology Institute)
Ted Barnes, Principal Investigator Gas Technology Institute 1700 South Mount Prospect Road Des Plaines, IL 60018-1804 Phone: (847) 544-3405 E-mail: [email protected]
Dennis Smith, Technology Manager U.S. Department of Energy Phone: (202) 586-1791 E-mail: [email protected] Start Date: October 1, 2016 End Date: September 30, 2018 Total Project Cost: $834,782 DOE share: $749,965 Non-DOE share: $84,817
Project Introduction As the commercial introduction of alternative fuel vehicles continues to grow and businesses begin to consider investing in significant sized fleets of alternative fuel vehicles, the cost and complexity of maintenance facility modifications must be considered, as they can influence a company’s decision to adopt alternative fuel vehicles. The alternative fuel vehicle industry has largely focused its efforts on development of vehicles and fueling infrastructure, while leaving issues related to any needed upgrades to maintenance facilities and operational changes to fleet owners, who have used their internal staff and/or consultants to interpret the intent of the applicable codes. Any designs for facility upgrades will ultimately have to be approved by the local authority having jurisdiction (AHJ), which is sometimes a difficult process, as the codes are performance documents, with little design guidance. The codes also use language and phrasing that may require expert interpretation to properly evaluate and remedy any expected hazardous conditions and associated risks. Additionally, engineering and design firms inexperienced with alternative fuels may exacerbate the issue by providing plans that are overly conservative and that typically include high construction costs to modify or build a maintenance facility. Some AHJs may not allow upgrades at all because of a lack of knowledge about gaseous fuels.
Objectives The objective of this project is to present guidance and practical solutions to facility owners, AHJs, designers, fire officials, and other stakeholders that are interested in permitting maintenance or repair facilities, to allow for servicing of alternative fuel vehicles. This will be done by showing how codes are applied in real-world cases, as well as by openly discussing how the codes are interpreted today. The project team will develop guidance that provides a better understanding of the intent of the code committee allowing for those codes to be appropriately incorporated in the design of maintenance facilities.
Approach The project will accomplish these objectives through the use of multiple outreach and training tools: on-site training seminars, facility tours, reports, and online resources. This collection of tools will cover three fuels –

Technology Integration
92 Alternative Fuel Vehicle Initiatives
natural gas, hydrogen, and propane. In-depth reports will cover applicable codes and standards for maintenance facilities that service alternative fuel vehicles, and will address issues with these codes and best practices that a facility can implement to become code compliant. In addition, the project team will develop materials in support of six workshops that will be held in 2018 throughout the United States. The workshops will include a half day classroom review of applicable codes and compliance strategies, as well as a tour of an upgraded maintenance facility. The reports, workshop materials, and educational tools will be available to the public on a website for the project. GTI will work with project partners and subject matter experts Clean Energy (natural gas), Frontier Energy (hydrogen) and Superior Energy Systems (propane), as well as local Clean Cities coalitions. It should be noted that DOE awarded two projects under this Funding Opportunity Announcement (FOA) topic, one being managed by Marathon Technical Services and one managed by the Gas Technology Institute. Although the overall goals, objectives, and approaches are somewhat similar they have formed different teams of subject matter experts and will be focusing on different geographic regions for their training workshops and site tours. However, Marathon and GTI are actively collaborating to share technical information and coordinate workshop scheduling and site tours in order to avoid overlap and duplication and to assure consistency with regard to technical content and recommended best practices for facility upgrades.
Results Gas Technology Institute (GTI) has met with industry experts, garage owners, and safety officials to gather information on the key technical areas that present issues for fleet owners during garage upgrades. The team of subject matter experts has aided GTI during development of in-depth reports on code compliance for natural gas, hydrogen, and propane. These reports cover both current and recent versions of the following codes from the International Code Council (ICC) and the National Fire Protection Association (NFPA): • International Fire Code • NFPA 30A: Code for Motor Fuel Dispensing Facilities and Repair Garages • NFPA 2: Hydrogen Technologies Code • NFPA 58: Liquefied Petroleum Gas Code
Key topic areas discussed in these reports include gas detection, ventilation, electrical classification compliance, heating devices, alarm system configuration, and the behavior of lighter-than-air fuels. Through conversations and visits with industry experts, equipment suppliers, design firms, and garage owners, GTI has collected industry best practices, and has incorporated these into the reports and workshop training material. These best practices represent methods and strategies that can be implemented to meet the code requirements, while reducing the expense and complication of a facility upgrade. The best practices will be available as standalone resources to provide a quick introduction to individual topic areas. GTI’s education team has developed a workshop structure that will encourage presentation of material in different formats to encourage engagement. The education team has helped develop consistent presentation of the key issues for maintenance garage modification in simple, easy to understand language. Topics that are important to one audience segment may not necessarily be relevant to another. The education team’s contributions have led to the definition of learning tools and strategies that cater to a wide audience. These tools include structured roleplaying and quiz modules that will be implemented during the workshops. GTI’s education team has conducted early information-sharing with the Chicago Area Clean Cities coalition, and will work with other Clean Cities coalitions in the cities where workshops will be held. GTI has worked with web and graphic designers at Frontier Energy to allow public access to the developed educational materials and online resources via the project’s website, www.AltFuelGarage.org. All of the
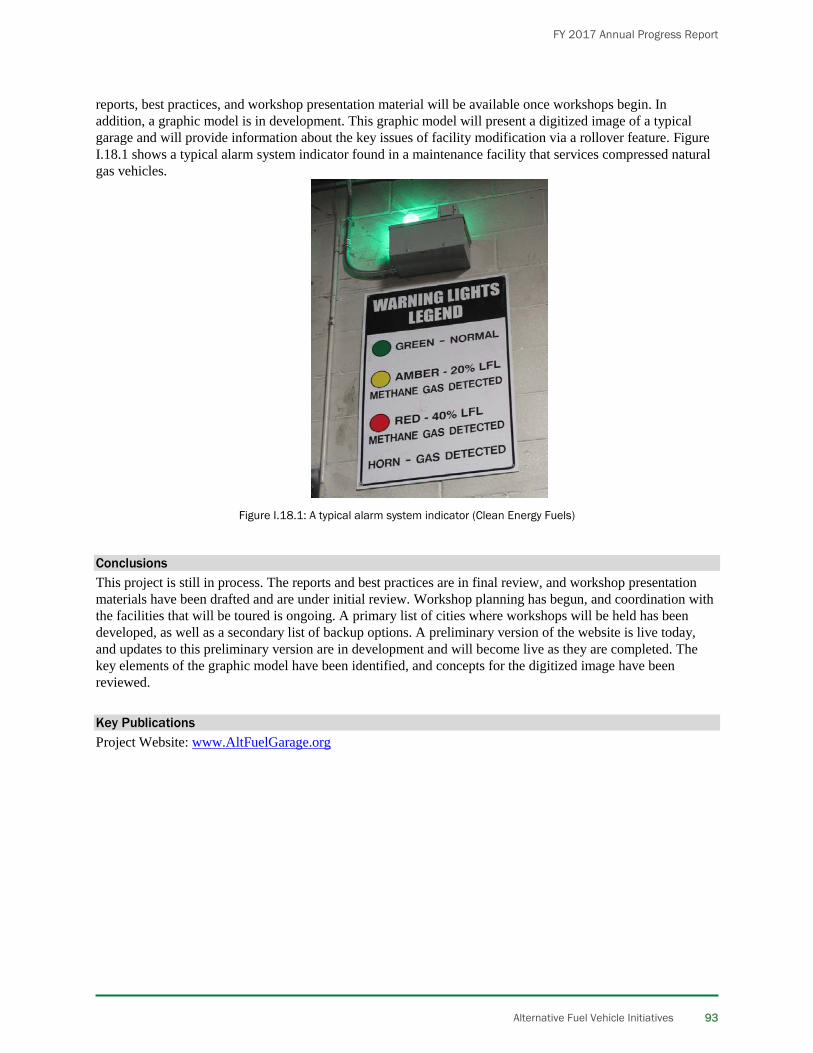
FY 2017 Annual Progress Report
Alternative Fuel Vehicle Initiatives 93
reports, best practices, and workshop presentation material will be available once workshops begin. In addition, a graphic model is in development. This graphic model will present a digitized image of a typical garage and will provide information about the key issues of facility modification via a rollover feature. Figure I.18.1 shows a typical alarm system indicator found in a maintenance facility that services compressed natural gas vehicles.
Figure I.18.1: A typical alarm system indicator (Clean Energy Fuels)
Conclusions This project is still in process. The reports and best practices are in final review, and workshop presentation materials have been drafted and are under initial review. Workshop planning has begun, and coordination with the facilities that will be toured is ongoing. A primary list of cities where workshops will be held has been developed, as well as a secondary list of backup options. A preliminary version of the website is live today, and updates to this preliminary version are in development and will become live as they are completed. The key elements of the graphic model have been identified, and concepts for the digitized image have been reviewed.
Key Publications Project Website: www.AltFuelGarage.org

Technology Integration
94 Alternative Fuel Vehicle Initiatives
I.19 U.S. Fuels Across America’s Highways - Michigan to Montana (M2M) (Gas Technology Institute)
Ted Barnes, P.E., Principal Investigator Gas Technology Institute 1700 South Mount Prospect Road Des Plaines, IL 60018 Phone: (847) 544-3405 E-mail: [email protected]
Dennis Smith, Technology Manager U.S. Department of Energy Phone: (202) 586-1791 E-mail: [email protected] Start Date: January 19, 2017 End Date: January 18, 2020 Total Project Cost: $ 10,479,623 DOE share: $ 4,999,983 Non-DOE share: $ 5,479,640
Project Introduction Interstate 94 (I-94) is the primary connection between the major metropolitan areas in the Upper Midwest. With a strategically placed network of DC fast chargers, compressed natural gas (CNG), and propane stations, travel between any of these cities could be accomplished seamlessly on any of these alternative fuels that are commercially available today. The main goal of the Michigan to Montana (M2M) Corridor project, however, is not to install infrastructure in every gap that will be identified; it is to create the necessary team to guide the creation of an alternative fuel corridor, commission select stations and vehicles, and provide education and training to establish a sustainable alternative fuel and advanced vehicle market. This will allow the M2M Corridor to continue growing well beyond the end of the project term. The project focuses on I-94 from the international border at Port Huron, Michigan, across America’s heartland to Billings, Montana. Significantly growing the availability and use of alternative fuels and advanced vehicles in key markets is critical for the long-term success of these technologies. A key factor for the project’s success is the ability of the team members and community partners to provide leadership, and to guide the organization and implementation of project elements, to ensure sustainability beyond the project term. Gas Technology Institute (GTI) is a not-for-profit with 75 years of research, development, and technology integration experience, including several large projects to increase adoption of alternative fuel vehicles and the installation of fueling stations. The other team members include several of the most motivated and active U.S. DOE Clean Cities coalitions, as well as key industry leaders with experience in alternative fuel vehicles (AFVs) and infrastructure development. These team members include: Greater Lansing Area Clean Cities, South Shore Clean Cities, Chicago Area Clean Cities, Wisconsin Clean Cities, Twin Cities Clean Cities, North Dakota Clean Cities, Yellowstone-Teton Clean Cities, Kwik Trip, Trillium CNG, ZEF Energy, Landmark Services Cooperative, and Contract Transportation Services (CTS).
Objectives The objectives of the project are to establish community-based partnerships; accelerate the adoption of alternative fuel vehicles (AFVs); and develop related fueling infrastructure needed to support those vehicles along I-94 from Port Huron, Michigan to Billings, Montana. The project focuses on alternative fuels and vehicles including electric drive, CNG, biofuels, and propane. Specifically the project will:
FY 2017 Annual Progress Report
Alternative Fuel Vehicle Initiatives 95
• Provide leadership through community-based partnerships to create a successful and sustainable alternative fuel corridor
• Commission approximately 15 fueling stations, i.e., 12 electric vehicle (EV) DC fast chargers; 2 CNG stations; 1 propane station; and approximately 60 CNG long-haul trucks
• Identify and fill gaps in alternative fuel station locations and identify partners with anchor fleets of AFVs that will create the consistent demand necessary for a sustainable industry
• Provide outreach, education, and training to critical stakeholders, i.e., fleets, communities, utilities, permitting officials, first responders, and fire marshals
• Create a model for establishing future alternative fuel corridors across the country by identifying key stakeholders and documenting successes and best practices
• Leverage and expand on existing Smart Mobility programs in this region and implement new “smart infrastructure” initiatives to increase connectivity across the corridor
Approach A key factor in the project’s success will be the degree to which AFVs have consistent access to fueling options. Ensuring this access will remove range anxiety and allow light-duty plug-in electric vehicle (PEV) owners to travel longer distances, while also expanding commercial fleets’ abilities to utilize PEVs and AFVs for regional and long-haul applications. The project will create a sustainable corridor as it leverages past projects to prepare for and to accelerate adoption of alternative fuel infrastructure and vehicles. The project team will work closely with several community-based stakeholders in all phases of this project. It is essential to the project’s success that each task include direct input from partners at State Energy Offices, state and municipal departments of transportation (DOTs), utilities, and the private sector. The project team will also focus on providing outreach, education, and training to our community-based partners, to support the long-term growth of alternative fuels along the corridor.
Results A wide range of activities has been accomplished by the project team, including the following specific items, listed by Statement of Project Objectives (SOPO) task: Task 1: Community Partnership and Corridor Planning Task 1.1 – Needs Analysis The M2M team members have begun the critical task of analyzing the current strengths and resources along the corridor, as well as the greatest needs. The M2M team has created a map of the existing infrastructure, and will be identifying particular focus areas as the project progresses (see Figure I.19.1). There are currently 40 public DC Fast Chargers (9 of which are maintained by M2M team members), 36 public CNG stations (14 owned by M2M team members), and 22 public propane stations along I-94. The M2M team is also assessing additional strengths and needs, including information on existing anchor fleets, station providers, and stakeholders that will be key to creating a sustainable corridor.

Technology Integration
96 Alternative Fuel Vehicle Initiatives
Figure I.19.1: Existing stations on M2M corridor (blue – DCFC, red – propane, green – CNG)
Task 1.2 – Sustainable Corridor Planning The M2M team members have worked on creating a model for developing a sustainable I-94 Alternative Fuel Corridor that can then be used by other communities as a guide for future corridor development. The Fixing America’s Surface Transportation (FAST) Act of 2015 required the Secretary of Transportation to identify the need for, and location of, EV charging infrastructure and natural gas, propane and hydrogen fueling infrastructure along designated interstate highway corridors, to improve the mobility of passenger and commercial vehicles that employ these technologies. The FAST Act established a process for nominating corridors for designation, which the Federal Highway Administration (FHWA) is implementing. FHWA designated several sections of I-94 following the initial round of nominations. There are plans to have additional sections designated as “signage ready” or “signage pending” for electric charging, propane, and CNG in the second round, which is ongoing. The type of designation depends on the distance between available refueling or recharging stations. M2M team members have been coordinating their efforts, and are working with state DOT representatives and other key stakeholders. Leveraging capabilities and experience of the existing network is a key focus, to promote continued sustainability. Outreach is another key aspect of developing a sustainable alternative fuels corridor. This period, members of the project team presented at the Dairyland Power Cooperative Member Services meeting, to representatives responsible for EV programs, and attended two member appreciation events. Task 1.3 – Initial Technology Integration Activities M2M team members have begun several technology integration activities that are highlighted below: • CTS has placed its first 20 of 40 CNG trucks (2018 Kenworth Model T680) into service. The CTS
trucks have traveled well over 750,000 cumulative miles on CNG this period. • ZEF Energy has focused on two locations for DC fast chargers, Eau Claire and Tomah, Wisconsin.
Discussions have progressed with Dairyland Power Cooperative and other site sponsors, and specific locations have been shortlisted.
• Trillium CNG has begun initial planning activities for its first CNG stations. Contract execution is planned for late 2017 with construction starting in spring 2018.

FY 2017 Annual Progress Report
Alternative Fuel Vehicle Initiatives 97
Conclusions The M2M Corridor Project has been very successful to date and is on track to accomplish all of its goals and objectives. The project focus on organization and planning involving team members and community partners has created a pathway to establishing a sustainable alternative fuel corridor along I-94.

Technology Integration
98 Alternative Fuel Vehicle Initiatives
I.20 WestSmart EV: Western Smart Plug-in Electric Vehicle Community Partnership (PacifiCorp)
Chad Teply, Principal Investigator PacifiCorp 825 NE Multnomah St. Suite 1900 Portland, OR 97232 Phone: (801) 220-4715 E-mail: [email protected]
Linda Bluestein, Technology Manager U.S. Department of Energy Phone: (202) 586-6116 E-mail: [email protected] Start Date: January 19, 2017 End Date: January 18, 2020 Total Project Cost: $11,548,617 DOE share: $3,532,333 Non-DOE share: $8,016,287
Project Introduction The WestSmart EV Project is designed to accelerate adoption of plug-in electric vehicles (PEVs) in communities located within PacifiCorp’s electric service territory across the Intermountain West. This will be accomplished by developing a large-scale, sustainable PEV charging infrastructure network, coupled with PEV adoption programs. The program is led by PacifiCorp, a locally managed, wholly-owned subsidiary of Berkshire Hathaway Energy Company. PacifiCorp is one of the leading electric utilities in the western United States, with service territory in six states: Utah, Wyoming, Idaho, California, Oregon, and Washington. PacifiCorp has built a first-class Project Team of strategic partners and leading experts to successfully execute the program. Team members include the Idaho National Laboratory (INL), Salt Lake City, Utah Clean Cities Coalition (UCCC), Breathe Utah, Park City, Utah State University (USU), and University of Utah (UU). Additional community partners include Yellowstone-Teton Clean Cities, Rogue Valley Clean Cities, Forth Mobility, and University of Nevada. The program also has committed partnerships with key private businesses including ABB, the world’s largest charging equipment manufacturer; Maverik gas stations, the largest independent fuel retailer in the Intermountain West; and NV Energy, the largest electric utility in Nevada.
Objectives The primary objective of WestSmart EV is to increase the adoption rate of PEVs across the intermountain multi-state region covering Utah, Idaho, and Wyoming. A secondary objective of WestSmart EV is to spur additional growth of PEVs among the broader western states, including Washington, Oregon, California, Nevada, and Colorado. The overall target is to double the growth rate for PEVs in communities in PacifiCorp’s electric service territory, from 20% to 40%, leading to more than 50,000 PEVs within 10 years. This three-year project will launch a multi-pronged approach to help meet these targets.
Approach To accomplish the primary project objective of increasing PEV adoption across the intermountain multi-state region, this project has implemented a three-year, strategically phased, directed, and coordinated implementation plan, as shown in Figure I.20.1.

FY 2017 Annual Progress Report
Alternative Fuel Vehicle Initiatives 99
Figure I.20.1: WestSmart EV three-year project implementation plan
The three annual phases for all project tasks include the following: • Project Year 1 (PY1): Pilot year for initial implementation and initiation of data collection • Project Year 2 (PY2): Expansion year for ramping up efforts and beginning strategic flow of data results
back into project components • Project Year 3 (PY3): Rollout year to reach full project capacity and incorporate lessons learned while
disseminating best practices The phased approach to building PEV growth through the WestSmart EV project includes 6 major tasks, as depicted in Figure I.20.2. They include (1) developing over 1,500 miles of electric highway corridors along I-15, I-80, I-70, and I-84 in Utah, Idaho, and Wyoming; (2) advancing Workplace Charging within the corridors; (3) targeting fleet operators and incentivizing conversion of fleet vehicles to PEVs within the corridors; (4) building community partnerships and incorporating Smart Mobility programs to align efforts with long-term transportation planning; (5) collecting, processing, and applying data from across all activities through the WestSmart EV Central task to inform project reporting, develop new tools for utility integration of charging infrastructure, and detail lessons learned and best practices, and (6) coordinating outreach, education and dissemination of best practices through a series of workshops across seven states, and one-on-one meetings with business leaders though community partners.

Technology Integration
100 Alternative Fuel Vehicle Initiatives
Figure I.20.2: WestSmart EV major task diagram
Task 1 - Electric Highways WestSmart EV will electrify over 1,500 miles of interstate highways in three states, with DC fast chargers every 50-100 miles along the corridors and AC level 2 (L2) chargers covering every major community across the region. The project will create two primary electric interstate highway corridors along I-15 and I-80. In addition, the project will include portions of I-70 running east from I-15 in southern Utah to the Colorado border, I-84 from Utah to western Idaho, along with off-corridor highways leading to the national parks. Task 2 - Workplace Charging With the strong support of local air quality managers, municipalities, state agencies, business groups, and public interest advocates, WestSmart EV will aggressively push workplace charging through a combination of public events, workshops, and awareness campaigns. The project will incentivize installation of over 600 AC L2 chargers at workplace locations. Task 3 – EV Fleet Deployment The program will strategically target fleet operators with incentives to convert fleets to PEVs. All vehicles will use data loggers that enable data sharing and development of lessons learned and best practices. In all, the program will incentivize the purchase of over 200 PEVs. Task 4 – Smart Mobility WestSmart EV will pilot, expand, and roll out innovative concepts for zero local emission smart mobility in urban living along the Wasatch Front (a 100-mile segment of the I-15 corridor running north and south of Salt Lake City) and at university campuses throughout the region. This task focuses on eliminating the need for personal vehicles and providing all-electric solutions in the first-mile and last-mile trips for commuters. The lead pilot program in Park City will include electric buses (ebuses), electric bikes (ebikes), micro transit programs, and an electric vehicle (EV) ride hailing program with 100 PEV mobility service drivers.

FY 2017 Annual Progress Report
Alternative Fuel Vehicle Initiatives 101
Task 5 – WestSmart EV Central This task involves centralized data collection, analysis, modeling, and tool development, to inform investment and policy decisions. INL will lead efforts on data collection for vehicles and chargers; USU will lead the collection of behavioral data; and UU will lead the collection of utility infrastructure data. Task 6 - Outreach and Education In this task, partners develop education and outreach materials, including a website, and conduct workshops throughout seven western states.
Results DOE conditionally awarded the project on January 19, 2017, and funding was awarded on May 3, 2017. Utah Public Service Commission, the state’s utility regulator, approved the cost share funding on June 28, 2017. PY1 runs from January 19, 2017 through January 18, 2018. Results reported below are for the three-month portion of PY1 that fell within federal Fiscal Year 1 (FY1) ending on September 30, 2017. PacifiCorp awarded the first two rounds of cost share applications, approximately $2.4 million, in FY1. Task 1 - Electric Highways Results • 3 DC Fast Chargers (DCFC) installed in FY1; a total of 16 DCFC proposed for PY1
o Installed a DC fast charger at the Rocky Mountain Power North Temple Office building and at two Maverik gas stations in Fillmore and Washington City, Utah. Data from these efforts is being collected.
• 22 L2 chargers installed in FY1; a total of 50 L2 chargers proposed for PY1 o All L2 chargers were installed by Salt Lake City (SLC). Data collection has started on installed
chargers • PacifiCorp received 11 custom project proposals by September 30, 2017. This exceeded the 5 proposals
anticipated in the Statement of Project Objectives (SOPO) o Awarded funding for 16 DC fast chargers, 170 L2 chargers, and one bus charger o It is anticipated that approximately 9 DC fast chargers, 100 L2 chargers, and the bus charger will
be installed during PY1 • Identified corridor locations along I-15 and the Wasatch Front. USU continues to improve optimization
algorithms and provide tools to encourage proposals from industry partners
Task 2 - Workplace Charging Results • 7 L2 chargers installed at team sites in FY1; a total of 10 chargers planned for PY1
o 7 L2 chargers installed at the Rocky Mountain Power NTO building. Additional L2 chargers will be installed at UU and USU
• 10 L2 chargers installed in FY1; a total of 85 L2 charger installations planned for PY1 o 10 L2 chargers installed by SLC o 50 L2 charger applications received, but not yet awarded
• Data collection started on installed chargers
Task 3 – PEV Fleet Deployment Results • 98 PEVs purchased in FY1; this exceeded the 30 PEVs planned for Budget Period 1, and was due to an
unanticipated Nissan incentive program that was very successful. o All vehicles sold to date are through the Rocky Mountain Power and Nissan incentive program.
• 2 out of 2 Altec JEM bucket trucks purchased in FY1

Technology Integration
102 Alternative Fuel Vehicle Initiatives
Task 4 – Smart Mobility Result: • 6 out of 6 ebuses purchased and placed in service by Park City during FY1 • 88 ebikes placed in use in Park City, exceeding the 6 planned ebikes for all of PY1 • USU has started data collection from Park City ebuses and ebikes • Initiated EV ride hailing program, led by Forth Mobility and supported by SLC and Park City • The EV ride hailing program replaces the OED EV on-demand rental program
Task 5 – WestSmart EV Central Results • Signed Non-Disclosure Agreement (NDA) with WestSmart EV partners • Coordinated data collection agreement with ChargePoint, signed NDA with ChargePoint, and performed
data quality assurance tests on ChargePoint data. Discussions are in progress for agreements to collect data from previously installed EVSE, or EVSE that may be installed in the future by Siemens, EVgo, and GreenLots
• Released partner agreements for all major partners • Successful site visit with DOE Technology Manager, September 27-28, 2017 • Utility Integration - started screening study to analyze and model transformer loading • Started EV Adoption Model formulation/data collection
Task 6 – Outreach and Education Results • Launched awareness and branding campaign, led by Doglatin Media
o Project website is online (https://www.liveelectric.org) o Established social media and public relation plans
• Identified and developed detailed outreach and education information • Conducted EV workplace challenge workshop pilot project in SLC region
o WSEV kick-off/press release/ride and drive at North Temple Office – April 25, 2017 o Utah Technical Council ride and drive – May 16, 2017 o Smart Mobility Workshop – July 17, 2017 o National Drive Electric Week kickoff – September 16, 2017
Conclusions Even with a late funding start, the project team has successfully implemented the key activities associated with all primary objectives of the WestSmart EV project pilot year, including equipment installation, PEV acquisition and outreach activities. Efforts to achieve milestones have, in some cases, exceeded year 1 goals; in other cases, they are on track for completion by the end of Budget Period 1 or shortly thereafter. The project team has initiated data collection for Tasks 1-4. During the upcoming year, the project team will incorporate the lessons learned and best practices compiled at the end of year 1. We will proceed with year 2 expansion efforts across primary objectives, and begin to insert lessons learned and best practices into the project tasks.

FY 2017 Annual Progress Report
National Laboratory Projects 103
II. National Laboratory Projects II.1 Alternative Fuels Data Center (National Renewable Energy Laboratory)
Trish Cozart, Principal Investigator National Renewable Energy Laboratory 15013 Denver West Parkway Golden, Colorado 80401 Phone: 303-275-3682 E-mail: [email protected]
Margo Melendez, Principal Investigator National Renewable Energy Laboratory 15013 Denver West Parkway Golden, Colorado 80401 Phone: 303-275-4479 E-mail: [email protected]
Wendy Dafoe, Principal Investigator National Renewable Energy Laboratory 15013 Denver West Parkway Golden, Colorado 80401 Phone: (303) 275-4470 E-mail: [email protected]
Dennis Smith, DOE Technology Manager U.S. Department of Energy Phone: (202) 586-1791 E-mail: [email protected] Start Date: October 1, 2016 End Date: September 30, 2017 Total Project Cost: $803,000 DOE share: $803,000 Non-DOE share: $0
Project Introduction The U.S. Department of Energy (DOE) launched the Alternative Fuels Data Center (AFDC) in 1991 as a repository for alternative fuel vehicle (AFV) performance data. Since that time, it has evolved to become an indispensable resource for a diverse set of users including fleets, fuel providers, policymakers, Clean Cities coalitions, and others working to find ways to reach their energy and economic goals with alternative and renewable fuels, advanced vehicles, and other energy/fuel-saving measures. The AFDC has achieved this level of engagement because of the many successful public and industry partnerships built in the past 26 years, that have contributed to the quality and quantity of information contained on the AFDC website. AFDC data, information, and tools enable transportation stakeholders to reduce fleet operating costs while improving transportation energy efficiency and air quality, by using alternative fuels and other advanced vehicle technologies. This results in substantial benefits to the country’s economy, energy security, and environment. As a trusted third-party data provider, the AFDC is used in multiple ways to support both public and private industry.
Technology Integration
104 National Laboratory Projects
The AFDC provides extensive information on alternative fuels, including biodiesel, electricity, ethanol, hydrogen, natural gas, and propane. Users can learn about fuel properties, production, distribution, and prices, as well as station locations, emissions benefits, and more. The website features information not only on the vehicles and engines that use these fuels, but also on the unique fueling infrastructure necessary to dispense them. Thanks to partnerships with other DOE national laboratories like Argonne National Laboratory and Oak Ridge National Laboratory (which maintains FuelEconomy.gov), the AFDC is able to offer content on fuel-saving strategies like idle reduction, fuel economy improvements, and efficient driving practices. The site’s diverse group of users can also examine long-term trends, conduct cost estimates, estimate emissions benefits, compare multiple strategies, and identify fuels and technologies that are appropriate for their operational needs and geographic locations, by using the site’s many tools. In sum, the AFDC’s vast collection of information, online tools, and robust data empowers fleets and individual drivers to identify the strategies and technologies that will best help them meet their environmental and energy goals in the most cost-efficient manner.
Objectives The AFDC’s primary objective is to be a leading, trusted site for information and data on alternative fuels and advanced vehicle technologies. The AFDC provides a wide range of accurate content that is updated and maintained on a continuous basis, through in-depth reviews by industry experts, the identification of changing market conditions, and timely responses to those changes. This enables the AFDC to maintain its position of credibility within the public and private sectors, while continuing to grow its use among key stakeholders.
Approach The AFDC has become an expert resource because of its approach to creating, updating, and sharing content that is supported by technical expertise in alternative fuels and advanced vehicles. While multiple in-house experts are tapped to review new and existing content, the site ensures accuracy and objectivity by often relying on its close industry partnerships to identify and fill any critical gaps. Behind its user-friendly interface, the AFDC also contains an extensive set of neutral, accurate, and vetted data. That data is rigorously maintained and presented in an accessible format to ensure target audiences get the information they are looking for in the most efficient manner possible. Multiple pathways (outlined below) safeguard the effective delivery of credible and objective information and data, which remains the foremost focus of the AFDC’s content and tools. Efficient Delivery There are many ways to deliver data and information, and each has its own advantages. A diversified delivery strategy ensures that information is easily accessible in a variety of formats, for a variety of devices. The AFDC approach is to provide information and data in the following ways: • AFDC Website: Data and information are accessed directly through the content and tools on the AFDC
website. The data is also accessed via referral links from other organizations. Linking to the site as the trusted third-party, objective resource helps organizations demonstrate that their information or product is developed from vetted, factual information. o Tools: A host of calculators, interactive maps, and data searches make up the site’s set of tools. o Content: The AFDC provides up-to-date content on commercially available alternative fuels and
fuel-saving methods. • Application Programming Interface (API): Several of the AFDC’s data sets are available via an API and
are used both internally (to support analysis and tools) and externally, by public and private enterprises. API data is delivered from computer to computer and updated automatically on a continuous basis. This

FY 2017 Annual Progress Report
National Laboratory Projects 105
kind of data delivery is primarily used by organizations wanting to build their own applications with the data.
• Data Downloads: AFDC data is also available for download. Data downloads are most often used by organizations wanting to build applications and upload the data into those applications, or by analysts doing research related to alternative fuels.
• Mobile Apps: The station locator tool is available as a native app for the iPhone and Android. The AFDC website is also built as a “responsive” website, which ensures that the site functions on various sizes of devices (such as tablets and smart phones).
• Application Widgets: Several of our tools are available as “widgets,” which are snippets of code that let users embed content from the AFDC on their websites, blogs, or social networking sites. This allows users to include the content in their own websites, without the expense of building their own tools.
Depending on the type of organization accessing the AFDC, its business strategy and use case, any combination of the data sourcing strategies above may be preferred. By providing multiple pathways for using and obtaining the information and data, the AFDC provides a valuable service to help organizations meet their own policy or business goals, and, because we measure how the data end points are used, NREL can quantify their value to the market and to our partners. Credible and Objective Data To ensure the integrity of the information and data, the AFDC undergoes an in-depth annual content review. During this process, subject-matter experts from multiple national laboratories review the content, using evidence-based research, their expertise in the industry, and information on identified changes in the market. NREL strives to maintain a cadre of experts who ensure an accurate and robust AFDC.
Results The AFDC continues to grow as a relevant and trusted resource. In fiscal year 2017 (FY17), the AFDC boasted a 6% increase over 2016 in visits and users, with more than 2 million visitor sessions and 1.6 million unique visitors. Those visitors accessed more than 6.1 million pages on the AFDC website. Visits to the site included an average of 25% returning visitors and 75% new visitors. The AFDC has long been a top-performing website within the Office of Energy Efficiency and Renewable Energy’s (EERE) informational portfolio. In fact, 27% of all EERE website pageviews are from AFDC pages. Additionally, 10 of the top 30 most-viewed pages in the EERE portfolio are AFDC pages. Referral Quality The AFDC strives to serve the fleet and transportation industry audience, and one way to measure its effectiveness is to look at the quality and quantity of referrals to the AFDC. (A referral is a website that directly links to AFDC content and tools.) One goal has been to gain referrals from sites where we know our audience spends time, such as utility or industry association websites. DOE and NREL have been consistently building partnerships with industry and attracting quality referrals. For example, an evaluation of the top 40 referrals in FY17 shows that the fleet and industry audiences continue to be the main referral base. In addition, a significant number of visits to the AFDC are direct traffic from fleet and industry audiences, i.e., people in this group who bookmark the AFDC, or go directly to known AFDC pages from their browsers, without using a search engine or a link from another website. Figure II.1.1 indicates a breakdown of sources of AFDC visits, and includes both referrals and direct traffic.

Technology Integration
106 National Laboratory Projects
Figure II.1.1: Sources of visits to the AFDC
As shown in Table II.1.1, some of the top referrers in FY17 included several vehicle Original Equipment Manufacturer (OEM) sites (shown in bold) linking to the laws and incentives information, with Chevrolet leading the referral count. In FY17, the laws and incentives data saw a 34% increase in use, particularly via referrals from numerous vehicle manufacturers. Currently, there are nearly 8,000 websites linking to the AFDC with a total of more than 230,000 links. Referrers include companies and organizations of every size and type, such as utilities, major corporations (including vehicle OEMs and equipment manufacturers), small startups, non-profits, cities and states, and search engines.
Table II.1.1: Top Referrers to the AFDC Website in 2017 chevrolet.com touch.toyota.com
fueleconomy.gov duckduckgo.com toyota.com repoweredngv.com
accounts.google.com smartusa.com google.android.googlequicksearchbox dmv.org
energy.gov vacleancities.org oringcng.com vw.com
chevyevlife.com en.wikipedia.org ez-ev.com pse.com
fuelfreedom.org m.facebook.com m.chevrolet.com ford.com
westcoastgreenhighway.com plugmyride.org
AFDC Content Interest The interest in AFDC data shifts among the tools and fuels, depending on policy developments and market economics. By continuously providing the best, most current data and information on all types of fuels and technologies, the AFDC is able to remain relevant, despite trending interests. The AFDC contains six main areas of content based on the alternative fuels defined by the Energy Policy Act of 1992 (EPAct). These content areas include biodiesel, electricity, ethanol, hydrogen, natural gas, and
0
500,000
1,000,000
1,500,000
2,000,000
2,500,000
3,000,000
Fleet/Industry Audience Consumer
Sess
ions
of T
op 4
0- R
efer
rers

FY 2017 Annual Progress Report
National Laboratory Projects 107
propane. Historical data shows that the most frequently accessed pages vary from year to year. In FY17, ethanol continued to be the most popular fuel in terms of pages viewed. Figure II.1.2 depicts the interest in types of content, by fuel, in FY17. Visits to hydrogen pages increased by 34% over FY16. The interest in all other fuels stayed about the same or decreased slightly compared to FY16. Although the number of visits to ethanol and electricity information is similar, visitors to electricity information accessed many more pages. When looking strictly at interest in alternative fuel station information, the popularity of fuel type shifts, as shown in Figure II.1.3. Although propane tallied the fewest visits for fuel information, it is the fourth most queried fuel where station location information is concerned. E85 (ethanol) continues to be a frequent request for station information.
Figure II.1.2: Interest in alternative fuel information by subject (page views) in FY17
Figure II.1.3: Interest in Alternative Fuel Station Locator information by subject (page views) in FY17
Tools The tools on the AFDC range from those that are broad and appeal to multiple audience segments, to specialty tools designed for more focused audiences. The tools directory page [1] received almost 10,000 views in FY17; however, a user's discovery of the tools more commonly comes from links on other AFDC pages, or referrals from other sites. Direct traffic—meaning visitors that bookmark the page, or come to the site without clicking on a link within the AFDC or another site—also provided a significant number of page views for the tools.

Technology Integration
108 National Laboratory Projects
Most tool page views did not fluctuate significantly, compared to FY16. The one exception is the Laws and Incentives search, which experienced a 78% increase in views. Table II.1.2 shows the tools by popularity and audience segment. Specialized tools for niche audiences do not garner as many views as broader-use tools, such as the popular Alternative Fueling Station Locator.
Table II.1.2: Primary AFDC Tools in FY17 - Usage and Audience Segment
Tool Use in FY16 Audience Segment
Tool Tool
Landing page
Total Searches/ Downloads/ Interactions
Fleet State or Local Govt.
Industry/ Analyst
Consumer or Media
Station Locator 471,426 1,752,413 Primary Secondary Secondary Secondary
Vehicle Cost Calculator 139,908 not measured Primary Secondary
Maps & Data Search 132,940 420,577 Primary Secondary Primary Secondary
Laws & Incentives Search 93,740 1,208,125 Primary Secondary Secondary Secondary
Fuel Properties Tool 16,018 not measured Primary Secondary
Case Studies Search 9,080 30,235 Primary Secondary Secondary Secondary
Vehicle Search 13,161 110,161 Primary Secondary Secondary
Publications Search 10,760 98,386
Downloads from AFDC
Primary Primary Primary Secondary
BioFuels Atlas 497 74,297 Primary
State Information Search 1,267 22,217 Secondary Primary Secondary
TransAtlas 284 27,887 Primary Secondary Secondary Mobile Apps In FY17, the AFDC launched the Android version of the station locator mobile application. There was an increase in mobile app usage after the launch in May (see Figure II.1.4). Currently, about 21% of station locator mobile app users are using the Android version.

FY 2017 Annual Progress Report
National Laboratory Projects 109
Figure II.1.4: Alternative Fuel Station Locator mobile app usage after Android launch in May 2017
Downloads, Widgets, APIs, and Data A significant growth area for the AFDC’s data sets has been sharing data and tools with a wider audience. Downloads of station data and requests via the web service, also known as an API, have resulted in the expanded use of AFDC data. The alternative fueling stations data API (a live data feed of station data) received more than 5.4 million requests (people searching or using the data set on other systems) in FY17—more than double the requests in FY16. The Alternative Fueling Station Locator widget had 310 embeds (instances of the widget being embedded in other websites) at the end of FY17, accounting for 9% of all the station locator traffic. The laws and incentives API received about 47,000 requests in FY17. If fact, many OEMs now link to the laws and incentives site. This is a growing opportunity for outside users to filter the laws and incentives using the API, adding increased customization and value to their own websites. Examples of API users: • Automotive/Engineering/Telematics Companies (e.g., Toyota, Fiat/Sprint, PlugShare, SiriusXM,
Yellowmap, ChargePoint, Fleetcarma, Xevo, Airbiquity) • Application Companies/Developers (e.g., Prodapt, Clean Power Research, Synerzip, iExit, Cartoware,
TekMindz, Oasis Technology, Shristi Innovative, Green Mountain Software, Zenithech, EnergySavvy, Smart Utility Systems, DevSimplify)
• Media Companies (e.g., Cox Enterprises – Kelley Blue Book/Autotrader, Dayton Daily News) • Students & Universities (e.g., Turing Coding Academy, Rutgers Coding Bootcamp) • Cities (e.g., City of Columbus, City of Chicago, City of Pasadena) • State Governments (e.g., Illinois, New York) • Federal Government (e.g., Idaho National Laboratory, Department of Labor, Department of
Transportation, Environmental Protection Agency) • Other Companies (e.g., Seaboard Foods, Grant Leading Technologies, Atlas Public Policy)
Figure II.1.5 shows the growth of station data API hits since 2011.
After Android Launch Before Android Launch

Technology Integration
110 National Laboratory Projects
Figure II.1.5: Growth of station data API hits
The AFDC will also continue to provide data from the Data Downloads page, which gives a snapshot of various data offerings at any point in time. As for downloads of other types of content, the fuels properties chart continues to be the most downloaded document on the AFDC (at approximately 97,000 downloads per year), followed by the Alternative Fuel Price Reports (at approximately 30,000 downloads per year).
Conclusions The AFDC continues to grow every year, gaining referrals from public and private industry. This underscores the need for credible, objective, third-party data and information in the growing market of alternative fuels and advanced vehicles. Through the involvement of its many partnerships, the AFDC helps ensure that relevant information reaches the appropriate end users—whether through the website itself or via AFDC partners’ communication materials. This valuable resource has staying power and continues to lead EERE websites, not only as a provider of excellent content but as a forward-thinking driver of data and tools to a market desiring the information to help it discern the right transportation solutions for businesses, cities, states, and country.
References [1] afdc.energy.gov/tools [2] afdc.energy.gov/data.download
Key Publications AFDC home page: www.afdc.energy.gov Fleet Application pages: www.afdc.energy.gov/vehicle-applications/ Alternative Fueling Station Locator tool: www.afdc.energy.gov/locator/stations/ Alternative Fuel and Advanced Vehicle Search database: www.afdc.energy.gov/vehicles/search/ Federal and State Laws & Incentives page: www.afdc.energy.gov/laws State Information pages: www.afdc.energy.gov/states/ Publications page: www.afdc.energy.gov/publications/ Vehicle Cost Calculator: www.afdc.energy.gov/calc/ Data Downloads page: www.afdc.energy.gov/data_download/ Embeddable Widgets: www.afdc.energy.gov/widgets/ Developer APIs: developer.nrel.gov/docs/transportation/alt-fuel-stations-v1/ Android App: play.google.com/store/apps/details?id=gov.energy.afdc.stationlocator iPhone App: itunes.apple.com/us/app/alternative-fueling-station/id718577947
0500,000
1,000,0001,500,0002,000,0002,500,0003,000,0003,500,0004,000,0004,500,000
2011 2012 2013 2014 2015 2016 2017
Station Data API Hits through 11/9/2017

FY 2017 Annual Progress Report
National Laboratory Projects 111
II.2 AFLEET Tool (Argonne National Laboratory)
Andrew Burnham, Principal Investigator Argonne National Laboratory 9700 S. Cass Ave. Argonne, IL 60439 Phone: (630) 252-6606 Email: [email protected] Linda Bluestein, Technology Manager U.S. Department of Energy Phone: (202) 586-6116 E-mail: [email protected] Start Date: October 1, 2016 End Date: September 30, 2017 Total Project Cost: $220,000 DOE share: $220,000 Non-DOE share: $0
Project Introduction This project updates and expands the existing Alternative Fuel Life-Cycle Environmental and Economic Transportation (AFLEET) Tool first released in 2013. Researchers at Argonne National Laboratory (Argonne) developed the AFLEET Tool for the U.S. Department of Energy (DOE) Vehicle Technologies Office’s (VTO’s) Technology Integration Program to estimate petroleum use, emissions, and cost of ownership of light-duty vehicles (LDV) and heavy-duty vehicles (HDV), using simple spreadsheet inputs. AFLEET examines both the environmental and economic costs and benefits of conventional, alternative fuel, and advanced technology vehicles for 18 different fuel and vehicle pathways, seven major vehicle types and 23 different vocations. The tool has both a Simple Payback calculator, to examine the payback of a new conventional vehicle versus an alternative fuel vehicle (AFV), and a Total Cost of Ownership (TCO) calculator that examines the costs during the entire life of the vehicle. Argonne first updated AFLEET in 2016 and included changes to match results to Argonne’s Greenhouse gases, Regulated Emissions, and Energy use in Transportation (GREET) 2015 model; incorporate private station pricing from the Clean Cities Alternative Fuel Price Report (AFPR); add refueling station and electric vehicle supply equipment (EVSE) construction costs; and match vehicle air pollutant emission factors to EPA’s MOtor Vehicle Emission Simulator (MOVES) 2014a. Since AFLEET’s inception, the number of users has grown to 7,000 individuals. The primary audiences for this tool are Clean Cities coordinators, industry, fleet managers, academia, and policymakers at all levels of government. The tool can be accessed directly from Argonne’s web site or from the Alternative Fuels Data Center website. The tool has been used to examine real-world fleet data for several VTO case studies, authored by Argonne.
Objectives In FY 2017, the AFLEET Tool had several factors that needed updating, and in discussions with Argonne, stakeholders requested additional features to help with analyses. Similar to the 2016 revision, AFLEET required an annual update to match new modeling results from GREET and MOVES; new fuel price data from the AFPR and the Energy Information Agency (EIA); and new vehicle price data. In addition, new research on diesel in-use and low-NOx emissions had been published, which directly impacted the calculations and results that AFLEET provides. Stakeholders indicated that they would like AFLEET to include not only air pollutant emissions attributable to vehicle operation, but also upstream emissions. Stakeholders also wanted to examine the impacts of vehicle and battery production on overall emissions. Inclusion of both upstream and vehicle production impacts would enable AFLEET to better examine the impacts of electric vehicles. As renewable diesel started to enter the market, stakeholders requested that it also be added to the tool. In addition, the

Technology Integration
112 National Laboratory Projects
ethanol, biodiesel, and renewable natural gas (RNG) feedstocks in the existing AFLEET Tool needed to be updated to better analyze real-world fuels. Furthermore, there was not a publicly available tool to analyze the energy use, emission, and cost impacts of idle reduction technologies. By building off existing work that had been done on idling, and using an AFLEET framework, Argonne was able to add this type of idle reduction analysis to the tool.
Approach Argonne used the GREET 2016 model as the basis of new features added to the tool, to update existing data in AFLEET, and to update default fuel economy and electricity consumption data for both LDVs and HDVs. In addition, Argonne updated charge depleting mode range for plug-in hybrid electric vehicles (PHEVs) and extended range electric vehicles (EREVs) using GREET data. To incorporate upstream air pollutant emissions and vehicle-cycle energy use and emissions into AFLEET, Argonne used the GREET fuel-cycle and vehicle-cycle models, to generate default results. This implementation required a new calculation methodology and structure in the Background Data sheet of the AFLEET Tool. Argonne redesigned each calculator in the spreadsheet to present the air pollutant emissions for well-to-pump (upstream), pump-to-wheel (vehicle operation), and vehicle production (vehicle-cycle) results. Energy use and GHG emission results are presented for both well-to-wheels (life-cycle) and vehicle production (vehicle-cycle). For vehicle-cycle results, the GREET model only has data for LDVs, so in this version of AFLEET, HDVs are not examined. With the introduction of upstream emission to the tool, Argonne added sulfur oxides (SOx) to AFLEET, as these pollutants come from electricity production. With the new AFLEET structure in place, Argonne used GREET 2016 to generate data for energy use and emissions for renewable diesel made from three feedstocks: soy, tallow, and palm. Argonne also added feedstocks for ethanol (sugarcane and grain sorghum), biodiesel (canola, corn, and tallow), and RNG (anaerobic digester gas from animal waste and municipal solid waste) to AFLEET. Argonne updated state and national emission factors for gasoline and diesel vehicles using calendar year 2017 results from the EPA MOVES 2014a version, and used MOVES national and county domain scales to generate emission factors and fuel consumption results for idling of LDVs and HDVs. Argonne also collected information on idle reduction equipment, maintenance costs, and typical annual idling hours by vehicle type from various literature sources, including case studies previously done by Argonne. Recent analyses have found that diesel in-use emissions are much higher than their laboratory certification results [1], [2]. Diesel NOx is driven by the type and performance of its aftertreatment systems, which can be highly duty-cycle dependent. For diesel LDVs, high speeds and accelerations may cause higher emissions [2], while for diesel HDVs, long idle times, low speeds, and low loads can cause higher NOx [1]. Data for in-use NOx of new diesels is limited; however, analyses have shown that the MOVES model is most likely underestimating diesel NOx [2], [3]. For AFLEET 2017, the option to use diesel in-use multipliers is now available, to provide sensitivity cases, as compared to the default MOVES results. In AFLEET 2017, the diesel in-use multiplier is 5.0 for diesel LDVs [2], 4.0 for diesel HDVs (transit, school, refuse, single unit short-haul) in low speed duty cycles, and 1.5 for diesel HDVs (combination and single unit long-haul, combination short-haul) in high speed duty cycles [1], [3], [4]. While MOVES’ focus is on emissions from gasoline and diesel vehicle operation, AFLEET uses research to estimate emissions from alternative fuel vehicles (AFVs). Because of severe air quality concerns in California, the California Air Resources Board (CARB) adopted optional low-NOx heavy duty standards. AFLEET 2017 also now includes a low-NOx engine option for HDVs that use compressed natural gas (CNG) and liquefied natural gas (LNG). For now, only natural gas vehicles have demonstrated this in-use performance. If more AFVs demonstrate lower emissions, this feature will be expanded.

FY 2017 Annual Progress Report
National Laboratory Projects 113
AFLEET uses fuel price data from the Vehicle Technologies Office’s AFPR for the Simple Payback and TCO calculators, and fuel price escalation factors from the EIA’s Annual Energy Outlook for the TCO calculator. These values change each year, so Argonne updated AFLEET 2017 to account for the latest data. The Clean Cities AFPR did not have data on renewable diesel, so Argonne used recent reports on the fuel price differential between diesel and renewable diesel in 20% and 100% blends, to generate default data for the three states that have introduced the fuel to date.
Results Argonne participated in a webinar presentation discussing the update on July 25, 2017, and published the AFLEET 2017 Tool on August 28, 2017. During FY 2017, the AFLEET Tool was downloaded more than 1,300 times, and the accompanying AFLEET Manual more than 2,400 times. To date, more than 7,000 individual users have downloaded the tool. The AFLEET 2017 Tool is sanctioned by the EPA for calculating the NOx reductions of various alternative fuels.
Conclusions This project addressed numerous stakeholder requests for new functionalities in AFLEET, and made necessary annual updates. Using GREET 2016 data, Argonne added upstream air pollutants, vehicle-cycle petroleum use and emissions for passenger cars, SUVs and pickup trucks to AFLEET 2017, and included SOx in all air pollutant calculations. In addition, AFLEET 2017 incorporated new feedstock emission factors for renewable diesel, ethanol, biodiesel and RNG fueled vehicles using GREET 2016 data. Argonne used the MOVES software to update existing vehicle operation emission factors, and to incorporate new emission and fuel consumption data for idling vehicles. With this data, Argonne added a new calculator to AFLEET 2017 to examine idle reduction technology cost, fuel savings, and emissions. Argonne also added vehicle operation in-use NOx emissions for both diesel and low-NOx natural gas vehicles to AFLEET 2017.
References [1] Cai, H., A. Burnham, R. Chen, M. Wang, 2017, “Wells to Wheels: Environmental Implications of Natural Gas As A Transportation Fuel,” Energy Policy 109: 565-578 [2] Anenberg, S., Miller, J., Minjares, R., Du, L., Henze, D., Lacey, F., Malley, C., Emberson, L., Franco, V., Klimont, Z., Heyes, C., 2017. Impacts and mitigation of excess diesel-related NOx emissions in 11 major vehicle markets. Nature 545, 467–471, doi: 10.1038/nature22086 [3] Sandhu, G.S., Sonntag, D., Sanchez, J., 2017. In-Use Emission Rates for MY 2010+ Heavy-Duty Diesel Vehicles, CRC On-Road Vehicle Emissions Workshop, Long Beach, CA [4] EPA, 2015, Motor Vehicle Emission Simulator (MOVES) – MOVES2014a version. http://www.epa.gov/otaq/models/moves
Key Publications Burnham, A., 2017. User Guide for AFLEET Tool 2017, Argonne National Laboratory. Burnham, A., 2017. Introduction to NOx Emissions and AFLEET Tool 2017 Update, Clean Cities Webinar Presentation, July 25, 2017. Cai, H., A. Burnham, R. Chen, M. Wang. 2017. Wells to wheels: Environmental Implications of Natural Gas as a Transportation Fuel. Energy Policy, 109, 565-578.

Technology Integration
114 National Laboratory Projects
II.3 EcoCAR 3 Advanced Vehicle Technology Competition (Argonne National Laboratory)
Kristen Wahl, Principal Investigator Argonne National Laboratory 9700 South Cass Avenue, Bldg. 362 Lemont, IL 60439 Phone: (512) 845-4319; E-mail: [email protected]
Connie Bezanson, Technology Manager U.S. Department of Energy Phone: (202) 586-2339 E-mail: [email protected] Start Date: September 1, 2014 End Date: June 30, 2018 Total Project Cost: $8,500,000 DOE share: $8,500,000 Non-DOE share: $0
Project Introduction The U.S. Department of Energy and General Motors have joined forces with more than 30 government and industry sponsors to establish EcoCAR 3, a DOE Advanced Vehicle Technology Competition (AVTC). This workforce development program will seed the industry with hundreds of engineering, communications and business graduates who have hands-on experience designing, building and promoting advanced technology vehicles and emerging Advanced Driver Assistance Systems (ADAS) technologies and innovations. Managed by Argonne National Laboratory (Argonne), EcoCAR 3 is a four-year competition that challenges 16 North American universities to re-engineer a 2016 Chevrolet Camaro, to increase fuel efficiency using hybrid drivetrain technologies, while maintaining the muscle and performance expected from this iconic American car. EcoCAR 3 teams are following GM’s Vehicle Development Process, which serves as a roadmap for designing, building and refining their advanced technology vehicles. This unique real-world engineering competition provides student engineers with hands-on research and development experience with leading-edge automotive propulsion, fuels, materials and emission-control technologies, as well as emerging technologies such as advanced driver assistance systems. The competition is now in its fourth and final year, which focuses on vehicle refinement. EcoCAR 3 will culminate with a competition finale in May 2018 at venues throughout Arizona and California, where teams will compete in more than two dozen events, for more than $100,000 in prize money provided by industry sponsors.
Objectives • Successfully plan, manage and execute the AVTC Program, including the current four-year EcoCAR 3
series, and ensure the competition is executed with technical integrity and fairness for all university competitors.
• Incorporate current industry codes and standards into the testing and evaluation of the competition vehicles.
• Develop safety system practices and procedures for university competitors to ensure a safe competition. • Develop real-world multi-year training and education programs on advanced vehicle technologies for
university competitors with subject matter experts from government and industry, to develop a highly skilled workforce.
• Promote and build awareness about the program and prepare the marketplace to adopt advanced technology vehicles.

FY 2017 Annual Progress Report
National Laboratory Projects 115
• Facilitate youth outreach to increase Science, Technology, Engineering and Math (STEM) awareness, including among underrepresented minorities.
Universities participating in EcoCAR 3, and the abbreviations used in this report, include: Arizona State University (ASU), California State University Los Angeles (CSULA), Colorado State University (CSU), Embry-Riddle Aeronautical University (ERAU), Georgia Tech (GT), McMaster University (MAC), Mississippi State University (MSU), Ohio State University (OSU), Pennsylvania State University (PSU), University of Alabama (UA), University of Tennessee, Knoxville (UT), University of Washington (UW), University of Waterloo (UWAFT) [2] , Virginia Tech (VT), Wayne State University (WSU) and West Virginia University (WVU).
Approach Fiscal Year 2017 (FY17) roughly aligns with the third year of EcoCAR 3. Over a four year period, each team in the competition designs, builds, and tests an advanced technology vehicle. Because the full development process covers multiple academic years, teams are given milestones for each year of the competition. These milestones serve as developmental goals for the teams and their vehicles. In Year 1, teams used math-based modeling tools to simulate and select vehicle powertrain configurations and design their advanced technology vehicles. In Year 2, teams sourced and secured new powertrain components and performed bench testing. Teams then re-engineered their 2016 Chevrolet Camaros, integrating their new hybrid components to achieve 50% component-level functionality. At the conclusion of Year 2, teams gathered at General Motors’ Desert Proving Grounds in Yuma, Arizona, for vehicle safety inspections and dynamic event testing. Teams were given the following milestones for the competition event at the end of Year 3: • Vehicle integration is complete • Vehicle passes static safety inspection • Vehicle passes dynamic safety evaluation • Vehicle drivable under its own power • Vehicle demonstrates that the powertrain can function as designed
The EcoCAR 3 competition at the end of Year 3 was held at General Motor’s Milford Proving Ground in Milford, Michigan. The testing events conducted at competition included the following vehicle evaluations: • 0-60 miles per hour (MPH) acceleration • 50-70 MPH acceleration • 60-0 MPH braking • Maximum Lateral Acceleration • Ride Quality • Drive Quality • Autocross • Emissions and Energy Consumption
As a whole, the testing events constitute a well-rounded evaluation of a consumer vehicle. Rather than focusing on a singular objective, EcoCAR 3 teams must design a well-rounded vehicle that balances performance, emissions, energy consumption, and consumer appeal. In this way, EcoCAR 3 teams face many of the same design decisions and challenges as automakers. Additionally, each event is designed to provide a quantifiable and repeatable, “apples-to-apples” method for comparing all EcoCAR 3 vehicles against each other. The tests are also designed to follow industry-standard testing practices. As an example, the Emissions and Energy Consumption (E&EC) event incorporates elements

Technology Integration
116 National Laboratory Projects
of the EPA’s 5-cycle test method and the SAE J-1711 Utility Factor standard. As part of the E&EC event, vehicles are driven over a 103 mile drive schedule that replicates the driving characteristics of the EPA’s 5-cycle test method. A portable emissions measurement system is used to collect data on modal emissions, modal fuel consumption, and electric energy consumption. With this data, the J-1711 standard is used to calculate the average energy a consumer could expect to consume, if the vehicle were mass-produced. Year 3 of EcoCAR 3 also featured the first full year of ADAS activities. The ADAS initiative is intended to integrate computer vision and other fundamental Connected and Automated Vehicle (CAV) concepts into AVTCs. The primary goals of the Year 3 ADAS activities were to increase the participating students’ familiarity and competency with CAV concepts, by deploying advanced traffic sensing algorithms in real-life testing environments, while simultaneously laying the groundwork for future research involving various levels of vehicle automation. To accomplish this goal, all EcoCAR 3 universities received extensive training from industry experts, including advanced computer vision concepts, software prototyping using state-of-the-art MathWorks software toolboxes, and algorithm deployment to pre-production sensor fusion hardware. Additionally, Argonne, General Motors, NXP, MathWorks, and other industry leaders collaborated to design software development pathways and on-road test scenarios that would drive EcoCAR 3 University research progress in the areas of computer vision algorithm development and automated vehicle sensing technology. Another focus area for the EcoCAR 3 competition is the Innovation Initiative. Supported by a partnership with the National Science Foundation, this initiative is designed to encourage teams to explore advanced research topics that are related to the automotive industry. The goal is to create an open environment for research, and to challenge EcoCAR 3 universities to think outside the box and explore bold new ideas. Each year, teams are expected to present the outcomes of their research and are judged by a panel of industry experts. EcoCAR 3 also includes a strong emphasis on Communications, diversity and STEM Outreach. Teams focus heavily on promoting EcoCAR to the community, to help promote the benefits of advanced vehicle technologies, and prepare the marketplace for their adoption. Teams are also engaged with recruiting and STEM outreach, including outreach to underrepresented minority groups. By including communications deliverables in EcoCAR 3, the competition provides learning in areas of public relations and social media, in addition to engineering principles. EcoCAR 3 brings awareness to the general public, stakeholders, sponsors and participants through public relations, social media and marketing efforts. Public relations and media outreach efforts include issued press releases, earned placements and BrandPoint placements. In Year 4, teams will work to achieve a 99%, showroom quality vehicle. Emphasis will be on quality and performance, as well as fit and finish, drive quality, and powertrain performance. The Year 4 competition will take place at GM’s Desert Proving Grounds and the Auto Club Speedway in Fontana, California, and will test vehicles in more than a dozen dynamic events. Vehicles are expected to achieve the technical specifications the team set in Year 1. The competition will conclude with a Road Rally through Los Angeles to demonstrate the vehicles’ efficiency.
Results The field of EcoCAR 3 vehicles largely met the stated milestones for the Year 3 competition, as illustrated in Table II.3.1. During a year in which teams were expected to deliver baseline-functional prototype vehicles, a majority of team vehicles met the goal of demonstrating a powertrain that is functional in all intended modes. Additionally, almost every team delivered a vehicle that had a functional powertrain and complete integration, and that passed all safety criteria.

FY 2017 Annual Progress Report
National Laboratory Projects 117
Table II.3.1: EcoCAR 3 Year 3 Vehicle Milestone Results Teams Achieving Goal
Vehicle integration is complete 14/16
Vehicle passes static safety inspection 15/16
Vehicle passes dynamic safety evaluation 13/16
Vehicle drivable under its own power 15/16
Vehicle demonstrates the powertrain can function as designed 10/16
Of the 16 vehicles participating in the Year 3 competition, 75% passed the safety tech inspection and were eligible to compete in the competition test events. See Table II.3.2.
Table II.3.2: Number of Teams Attempting and Completing Competition Testing Events Event Attempted Completed Best Result
Handling (Skidpad) 12 11 0.979 (G)
Ride Quality 10 7 7.04/10
Drive Quality 8 8 8/10
0-60 MPH Acceleration 10 9 5.73 (sec)
50-70 MPH Acceleration 10 8 2.83 (sec)
60-0 MPH Braking 10 9 121 (ft)
Autocross 8 7 65.81 (sec)
Utility Factor (UF)-Weighted Energy Consumption 10 4 319 (Wh/mi)
UF-Weighted Well to Wheels (WTW) Petroleum Energy Use 10 4 130 (Wh PE/mi)
UF-Weighted WTW GHG Emissions 10 4 971 (g GHG/mi)
UF-Weighted WTW Criteria Emissions 10 4 9.3
Ten teams attempted the challenging E&EC event, but only four teams were able to complete the 103 mile drive cycle. The results are illustrated in Figure II.3.1. Although the team vehicles are only at an initial prototype stage in which the powertrain is not expected to be optimized, most of the teams were on-par with the stock vehicle, and the Ohio State team improved both the fuel economy and GHG emissions of the stock Camaro.

Technology Integration
118 National Laboratory Projects
Figure II.3.1: Emissions and energy consumption event testing results from EcoCAR 3 Year 3 competition
In addition to the powertrain development activities in Year 3, all 16 universities deployed a prototype version of their ADAS sensing system to an active-safety-equipped GM test vehicle. The performance capabilities of each team’s ADAS system were evaluated over a series of controlled test maneuvers designed by Argonne and General Motors. Not only did these tests provide an initial benchmark of each system, they also established a pathway for universities to deploy advanced CAV sensing capability to their team Camaros in FY2018. In Year 3 of the EcoCAR 3 Innovation Initiative, seven teams focused heavily on the implementation of sensor and Global Positioning System (GPS) data, to suggest driver modifications to improve fuel economy. West Virginia University presented its research on real-time road surface defect detection, which would allow an adaptive suspension system to mitigate the impact of road defects, such as potholes. Other teams pursued research on powertrain components. McMaster University, for example, designed and implemented a Hybrid Energy Storage System (HESS) for its Camaro. The McMaster HESS combines a lithium-ion battery pack with an ultra-capacitor pack, to provide the best combination of battery pack performance and efficiency. Still other universities have pursued research on advanced combustion. The University of Alabama, for example, is developing a dual mode standard injection, homogeneous charge compression ignition system. Aside from the engineering results, the Year 3 competition was also successful in achieving its core objective: training the next generation of automotive engineers, communicators, and business leaders. During FY17, 316 students graduated from EcoCAR 3 teams, including 240 undergraduate students and 36 graduate students in engineering disciplines. Table II.3.3 shows a breakdown of EcoCAR 3 graduates during FY17, by discipline.
Table II.3.3: Students Graduating from EcoCAR 3 Universities, FY17, by Discipline Discipline Undergraduate Graduate
Mechanical Engineering 167 17
Electrical / Computer Engineering 50 17
Computer Science / Software Engineering 9 0
Automotive Engineering 7 0
Other Engineering or Physics 7 2
Communications / Public Relations / Journalism 18 2
Marketing / Advertising 7 0
Accounting / Finance / Business / Economics 7 1
Other 5 0
Total 277 39
385337 319
491
339
050
100150200250300350400450500
UF-W
eigh
ted
GHG
Em
issi
ons
(g G
HG/m
i)
Energy Consumption Testing Results
Embr
y-Ri
ddle
Geo
rgia
Tech
Ohio
Sta
te
Tenn
esse
e
Stoc
k (V
6)
14101297
971
1691
1290
0200400600800
10001200140016001800
UF-W
eigh
ted
Tota
l Ene
rgy
Cons
umpt
ion
(Wh/
mi)
GHG Emissions Testing Results
Embr
y-Ri
ddle
Geo
rgia
Tech
Ohio
Sta
te
Tenn
esse
e
Stoc
k (V
6)

FY 2017 Annual Progress Report
National Laboratory Projects 119
In year three of EcoCAR 3, teams conducted 75 total youth outreach events, reaching nearly 10,000 youth ranging from grades 6-12. Teams also executed 57 general public awareness events in 16 states across the country. In addition, the teams spread awareness about their advanced technology vehicles and EcoCAR 3 by actively engaging with influencers and stakeholders including, but not limited to U.S. Senators and Representatives, Governors, and other state and local officials. In all, more than 35 interactions with influencers occurred in Year 3. Total media impressions for Year 3 reached 251 million. Total number of social engagements for Year 3 reached 15,621. The top Facebook post featured a visit by Mary Barra, Chairman and CEO of General Motors, with EcoCAR 3 students at the Year 3 final competition in May, and generated a 20% engagement. Likewise, the top tweets saw 6% engagement for the Mary Barra visit and the awards ceremony. See Table II.3.4.
Table II.3.4: EcoCAR 3 Social Media Results
Total Tweets/Posts Total Engagements Impressions/Reach Overall
Engament Rate
Twitter 90 tweets 1,725 268,155 1.2%
Facebook 89 posts 13,896 91,444 15.2%
Conclusions The EcoCAR 3 competition has forged a unique public-private partnership of more than 32 government and industry organizations that have joined forces to explore advanced propulsion systems, emission-control technologies and emerging technologies such as advanced driver assistance systems. This highly successful workforce development program is seeding the industry with hundreds of engineers, communications and business graduates who have hands-on experience in advanced technology vehicles and other innovative and emerging vehicle technologies. This will help transform the industry to meet the growing challenges in the transportation and energy sector. The program also continues to have a major impact on today’s youth, inspiring future generations (including underrepresented minorities) to follow STEM careers. Finally, the program is helping to educate and build awareness within the community about advanced technology vehicles.
References [1] UWAFT is the abbreviation for the University of Waterloo Alternative Fuels Team.
Key Publications The program funds student assistant positions on each EcoCAR 3 team. This includes engineering graduate research assistants (from any discipline), an Electrical Engineering graduate research assistant, a Project Manager and a Communications Manager. As a result of this funding, the following publications were published by participating teams:
Table II.3.5: EcoCAR 3 Team Publications in FY2017 Team Author Title Publisher
ASU Mohammad Alzorgan
Forward-Looking Traffic-Aware Cooperative Adaptive Speed and Battery Control System (CASBC)
IEEE
CSU Jamison Bair Introduction and Application of Lean Manufacturing Techniques in Mechanical Engineering Senior Design
Practicum
ASEE
CSU Vipin Kumar Kukkala
Uncertainty Analysis and Propagation for an Auxiliary Power Module
IEEE

Technology Integration
120 National Laboratory Projects
Team Author Title Publisher
CSU Zachary Asher Prediction Error Applied to Hybrid Electric Vehicle Optimal Fuel Economy
IEEE
CSU David Baker Investigation of Vehicle Speed Prediction from Neural Network Fit of Real World Driving Data for Improved Engine
On/Off Control of the EcoCAR3 Hybrid Camaro
SAE
CSU Zachary Asher The Importance of HEV Fuel Economy and Two Research Gaps Preventing Real World Implementation of Optimal
Energy Management
SAE
ERAU Andre Napier Electrification of a plug-in hybrid Chevrolet Camaro, a System Engineering Approach
ERAU
ERAU Thomas Gorgia Supervisory Controller to Reduce Utility Factor Weighted Criteria Emissions for A PHEV
SAE
GT Greg Chipman Adapting Vertically Integrated Projects to University Team Competitions
ASME
GT Lee Sargent Commissioning of a Motor-Generator Unit IEEE
MAC Mackenzie Wootton
Optimal performance of a full scale li-ion battery and li-ion capacitor hybrid energy storage system for a plug-in hybrid
vehicle
IEEE
MAC Ephrem Chemali
On the concept of a novel Reconfigurable Multi-Source Inverter
IEEE
MSU Myles Black Decision-Analysis Technique Applied in an Advanced Vehicle Technology Competition
Nagoya Institute of Technology
MSU Alex Gibson Vision Processing Methods for Advanced Driver Assistance Systems
SAE
MSU John Corn Torque Blending Control Strategy for Series-Parallel Plug-in Hybrid Electric Vehicle Architecture
SAE
OSU Simon Trask System Diagnosis and Dault Mitigation Strategy Development for an Automated Manual Transmission Using
Structural Analysis
ASME
OSU Guido Guercioni
Gearshift Control for Hybrid Powertrains with AMTs IEEE
OSU Dennis Kibalama
Testing and Validation of a Belted Alternator System for a Post-Transmission Parallel PHEV for the EcoCAR 3
Competition
SAE
PSU Hugo McMenamin
Energy Consumption Strategy of a Parallel Pre-Transmission Plug-in Hybrid Electric Passenger Performance Vehicle
ASME
PSU Dule Shu A Sum-of-Squares Polynomial Approach for Road Anomaly Detection Using Vehicle Sensor Measurements
ASME
UT Liu Liu End-to-End Binary Representation Learning Via Direct Binary Embedding
UT
UT Eli Allen Control System Operation of the UTK EcoCAR 3 HEV ASME
UW Aman Kalia Development of Optimal Control Strategy for a Plug-in Series Hybrid Electric Vehicle with an On-Board Engine-
Generator System for Overall Fuel Economy Improvement and Reduction in Tailpipe Emissions
ASME

FY 2017 Annual Progress Report
National Laboratory Projects 121
Team Author Title Publisher
UW James Goin Predictive Generator Control of a Series Plug-in Hybrid Vehicle
ASME
UW Graham Arnold Simulation of Advanced Regenerative Braking Strategies in a Series Plug-in Hybrid Electric Vehicle
SAE
UWAFT Radhika Kartha
Comparative Study of the Organizational Structure of Engineering Student Teams and Team Effectiveness
Canadian Engineering Education Association
UWAFT John Catton Comparative Safety Risk and the Use of Repurposed EV Batteries for Stationary Energy Storage
IEEE
UWAFT John Catton Extended Range Electric Vehicle Powertrain Simulation, and Comparison with Consideration of Fuel Cell and Metal-Air
Battery
SAE
VT Hrusheekesh Warpe
EcoRouting Strategy using Variable Acceleration Rate Synthesis Methodology
SAE
VT Eduardo Marquez
Simulation and Bench Testing of a GM 5.3L V8 Engine SAE
VT Andres Coello Implementation of Hands-On Supplement Projects in the On-Boarding Process of a Senior Design Team
SAE
VT Samuel Reinsel
Drive Quality Assessment of Stock vehicles for EcoCAR Benchmarking
SAE
WSU Miriam Di Russo
Development of the Hybrid Supervisory Controller for a Pre-Transmission Hybrid Electric Vehicle for Year 3 of the
EcoCAR3 Competition
SAE
WVU Hadi Kazemi Predictive AECMS by Utilization of Intelligent Transportation Systems for Hybrid Electric Vehicle Powertrain Control
IEEE

Technology Integration
122 National Laboratory Projects
II.4 Fuel Economy Information Project (Oak Ridge National Laboratory)
Brian West, Principal Investigator Oak Ridge National Laboratory – National Transportation Research Center 2360 Cherahala Blvd. Knoxville, TN 37932 Phone: (865) 946-1231 E-mail: [email protected]
Dr. Janet Hopson, Principal Investigator University of Tennessee – Center for Transportation Research, National Transportation Research Center 2360 Cherahala Blvd. Knoxville, TN 37932 Phone: (865) 946-1460 E-mail: [email protected]
Dennis Smith, Technology Manager U.S. Department of Energy Phone: (202) 586-1791 E-mail: [email protected] Start Date: October 1, 2017 End Date: September 30, 2017 Total Project Cost:$2,900,000 DOE share: $2,900,000 Non-DOE share: $0
Project Introduction Oak Ridge National Laboratory (ORNL) manages the Fuel Economy Information (FEI) Program for the Department of Energy (DOE), in close collaboration with the Environmental Protection Agency (EPA). Under this program, ORNL produces and distributes the annual Fuel Economy Guide and manages the FuelEconomy.gov [1] website to support the DOE’s statutory responsibility to provide light-duty vehicle fuel economy information to the public (under the Energy Policy and Conservation Act of 1975 – 49 USC 32908). The FEI Program supports a continually updated electronic version of the Fuel Economy Guide on FuelEconomy.gov, where consumers also have access to a wide array of additional information and tools. The site provides side-by-side comparison tools, fuel saving calculators, driving and vehicle maintenance tips, information about advanced technology and tax incentives, safety ratings, vehicle specifications, and more. The FEI Program also conducts fuel economy research to support its efforts to provide timely, reliable driving tips to consumers. The project ensures that consumers have easy access to fuel economy information that is accurate, up-to-date, and useful.
Objectives The FEI Program has several objectives: • Help DOE fulfill its statutory responsibility to publish and distribute an annual fuel economy booklet
providing information on fuel economy and estimated annual fuel costs of operating automobiles manufactured in each model year
• Provide consumers with reliable, unbiased fuel economy information • Help improve U.S. energy security and reduce reliance on imported oil by promoting fuel economy to
consumers through education and outreach • Help consumers make informed decisions when purchasing and operating vehicles by

FY 2017 Annual Progress Report
National Laboratory Projects 123
o Providing information about light-duty vehicle fuel economy and fuel costs o Educating consumers on the benefits of improved fuel economy o Providing tools that help consumers estimate fuel use and fuel costs
• Help DOE’s Vehicle Technologies Office promote energy efficiency & fuel economy, alternative fuels, alternative fuel vehicles, and advanced vehicle and fuel technologies
Approach The FEI Program helps DOE fulfill its statutory responsibility to compile and distribute an annual fuel economy booklet by publishing the Fuel Economy Guide (Guide) for each new vehicle model year. Using data collected from manufacturers by the Environmental Protection Agency (EPA), the Program publishes the Guide in both hardcopy and electronic formats. Through model year 2017, the FEI Program has distributed the print version of the Guide to new-car dealerships, libraries, and credit unions. In addition, it provides an electronic version of the current Guide (and previous model year editions) on the FuelEconomy.gov website. Electronic versions of the Guide for the current and recent model years are updated weekly with new vehicle models and/or gas prices. The Guide contains information on more than 1,200 light-duty vehicles, including conventional gasoline and diesel vehicles, plug-in electric vehicles, flex-fuel vehicles, fuel cell vehicles, and vehicles operating on compressed natural gas (CNG), propane, and other fuels. The Guide provides (1) EPA city, highway, and combined fuel economy estimates, (2) annual fuel cost estimates, (3) EPA greenhouse gas (GHG) ratings, and (4) interior volumes for each vehicle. The Guide highlights fuel economy leaders for each vehicle class and provides fuel-saving driving and maintenance tips to help consumers save money. In addition to the annual Fuel Economy Guide publication, the FEI Program developed and launched the FuelEconomy.gov website in 1999. The website was developed to leverage the power of computers and the internet to reach more consumers and provide more functionality than was within the limitations of a paper booklet. One of the goals of the FEI Program’s FuelEconomy.gov website is to be the official government source of, and leading authority on, fuel economy. FuelEconomy.gov has become the FEI Program’s most effective tool for reaching consumers and providing them with fuel economy information. In fact, it has become so popular that the Fuel Economy and Environment sticker displayed on new cars now has a QR Code that consumers can scan with a mobile device. The code will take them directly to the FuelEconomy.gov website. Unlike the print versions of the Guide, which contain vehicles for a single model year, the website contains information for vehicles going back to model year 1984—more than 39,000 vehicles in all. In addition to fuel economy, annual fuel costs, and GHG ratings, the website provides driving range, cost to fill the tank, EPA Smog Rating, annual petroleum consumption, National Highway Traffic Safety Administration (NHTSA) crash test results, and fuel economy estimates from other drivers (via the website’s “My MPG” feature). Vehicle and fuel cost data are updated weekly, making the website much more up-to-date and complete than is possible with a printed booklet. Furthermore, FuelEconomy.gov allows consumers to personalize fuel economy estimates, annual fuel costs, and other estimates based on their driving environment and fuel prices. Users can also compare fuel economy and other estimates on up to four vehicles side-by-side. FuelEconomy.gov provides users with several search tools to help them find specific vehicles or vehicles that meet their desired search criteria. Users can search by make and model, vehicle class, fuel type, engine and transmission, and other characteristics. They can also search for EPA-certified SmartWay vehicles, and vehicles with the best and worst fuel economy in each vehicle class. FuelEconomy.gov provides users with fuel-saving tips and allows consumers to personalize these tips to see how much money they can expect to save by following them. The fuel economy tips are based on published

Technology Integration
124 National Laboratory Projects
research, much of which was supported through the FEI Program (these research efforts are described later in this report). FuelEconomy.gov provides many other kinds of information useful to consumers: • Federal tax credit information for advanced technology vehicles (e.g., all-electric vehicles and plug-in
hybrids) • Lists of best and worst fuel economy vehicles • Answers to frequently asked questions about fuel economy • Links to national and local fuel prices and answers to frequently asked questions about fuel prices • Detailed descriptions of EPA Fuel Economy and Environment Labels • Discussions about the benefits of improved fuel economy, such as saving money, increasing U.S. energy
security, reduced GHG emissions, and improved sustainability • Simple explanations of how fuel economy estimates are determined, selecting the right octane for your
vehicle, and how advanced vehicle technologies save fuel Due to the significant increase in the popularity of smart phones and other mobile devices, the Fueleconony.gov website was recently re-designed in a mobile-friendly platform that displays content on any screen size from a smart phone to a desktop computer. This allows consumers to have fuel economy information at their fingertips at almost any location and at any point in the car-buying process. FuelEconomy.gov’s My MPG tool helps drivers calculate and track fuel economy for their vehicles. Drivers can also elect to share their real-world MPG estimates with other consumers. These shared estimates are useful to other consumers shopping for a vehicle, as well. The My MPG tool employs methods to help ensure that the fuel economy estimates are as reliable as possible. This includes data checking to help drivers enter data correctly and a log-in process to help discourage users that may try to enter large amounts of erroneous data. My MPG was initially designed for use on a desktop computer; however, as mobile devices became more popular, a scaled-down version of the tool was developed for these devices. In fiscal year (FY) 2017, the FEI Program redesigned the tool to provide full functionality on both desktop and mobile devices. Other enhanced features include an improved user interface, more graphs and tables for user analysis, and the ability to enter data for all-electric vehicles. This new version of the tool is currently being tested and will be deployed in FY 2018. FuelEconomy.gov provides a number of tools and calculators to help consumers make informed decisions when buying or operating a vehicle: • Trip Calculator. This calculator allows consumers to calculate the fuel costs for driving a vehicle on a
specified trip. The user can enter their origin, destination, and any waypoints and select up to three vehicles they are considering taking on the trip. The tool will map out the best route, provide directions, and estimate the fuel use and fuel cost for each selected vehicle. This is one of the most popular tools on FuelEconomy.gov.
• Fuel Savings Calculator. The fuel savings calculator began as a simple tool to help users compare the fuel costs of two vehicles with different fuel economies. In FY 2017, the FEI Program enhanced the tool, keeping its ease of use but also allowing users to compare specific vehicles as well as adding vehicle purchase and financing/lease costs into the equation—this is helpful for vehicles that may have a higher initial cost but may save more money over time. The FEI Program also added charts to help illustrate the results
• “Can a Hybrid Save Me Money?” When hybrid vehicles were first introduced, there were questions about whether their fuel savings were sufficient to outweigh their higher initial cost. Many news articles were written comparing the costs of hybrids to their conventional counterparts over time, but most of these articles had a significant flaw: they compared a hybrid model, which was typically equipped with

FY 2017 Annual Progress Report
National Laboratory Projects 125
many upgraded features, to the base model, which had very few amenities. Therefore, the results of these analyses were skewed against hybrids, without pointing out that the user was actually getting more features, and not just better gas mileage, with the hybrids. Therefore, the FEI Program added a tool to FuelEconomy.gov that compared each hybrid to a comparably equipped conventional vehicle from the same manufacturer. This allows consumers to weigh the benefits of improved fuel economy while taking unrelated features out of the equation.
• My Plug-in Hybrid Calculator. The fuel economy of a plug-in hybrid is highly variable and depends greatly on how it is driven and how often it is charged. This tool allows consumers to estimate the gasoline and electricity costs of a plug-in hybrid based on their driving habits, charging schedule, and gasoline and electricity prices. The tool even provides users with the choice of a simple model or a more complex model for personalizing their driving and charging patterns.
• Used Car Label Tool. This tool generates printable fuel economy labels that sellers can affix to their vehicles or electronic images they can include in on-line ads. A vehicle’s fuel economy changes very little over time if it is properly maintained. The used car label tool helps make official EPA fuel economy ratings part of the buying/selling process of used cars, just as it is for new ones.
FuelEconomy.gov makes much of its fuel economy information available to other websites, researchers, and other organizations via web services and data download. Edmunds, CHROMEDATA (used by more than 70% of U.S. vehicle manufacturers), the California Air Resources Board (CARB), Uber, and the Florida Department of Transportation are just a few of the organizations that rely on FuelEconomy.gov for fuel economy data. In addition, EERE has two website tools that use FuelEconomy.gov’s data, as does EPA’s Green Vehicle Guide. The FEI Program has also developed Find-a-Car and driving tips widgets that website developers can incorporate into their sites. Providing reliable, defensible fuel economy tips to consumers is a primary objective of the FEI Program. Studies show that driving more efficiently can improve most drivers’ fuel economy by about 10%; however, to get buy-in from consumers, these tips must be accurate and up-to-date. FuelEconomy.gov’s fuel-saving tips were initially compiled based on a literature review of available published reports by U.S. government agencies, auto experts, and other credible sources. As vehicle technologies evolved over time, many of these tips became dated, and newer studies on vehicle fuel economy have not been readily available. Therefore, the FEI Program began supporting research projects aimed at quantifying factors that can increase or decrease fuel economy. FEI research has included literature reviews, analysis of available data sets, as well as a number of vehicle experiments. Research has focused primarily on aspects of fuel economy that can be improved by driver behavior. Past research topics include (1) the effect of a dirty air filter on fuel economy and performance, (2) the effect of driving speed on fuel economy, (3) fuel economy effects of roof racks, cargo carriers, trailers, and tire pressure (4) the effect of cold weather on fuel economy, (5) the effect of driving with the windows down vs. using the air conditioner, (6) the amount of fuel consumed by idling, (7) fuel economy tips for hot and cold weather, and (8) fuel economy tips for hybrids and plug-in vehicles. Most of the fuel-saving tips on FuelEconomy.gov are now based on research performed by the FEI Program, and these tips are often cited by news outlets, car companies, consumer sites, and other entities. Publications developed as part of this program are listed at the end of this report. In FY 2017, FEI researchers completed a study on the fuel economy impacts of aggressive driving. The study found that aggressive driving can lower fuel economy by about 10% to 40% in stop-and-go traffic and roughly 15% to 30% on the highway. These findings replaced older, out-of-date estimates on the impacts of aggressive driving on FuelEconomy.gov. The results were published in an article in the SAE International Journal of Fuels and Lubricants and featured in more than twenty articles by news outlets such as USA Today, Reader’s Digest, and Yahoo! News. The FEI Program developed a Find-a-Car app for Apple and Android devices for those consumers that prefer to use mobile apps rather than the Find-a-Car tool on the FuelEconomy.gov website. Find-a-Car is the primary

Technology Integration
126 National Laboratory Projects
search tool on FuelEconomy.gov. It is used to look up fuel economy and other information for light-duty passenger vehicles. The Find-a-Car app has similar functionality to the website feature, but it can be downloaded to a personal device and accessed with the touch of a button, and allows users to save vehicle searches. The apps are available for free download from Google Play and the Apple App Store. As part of its objective to help DOE’s Vehicle Technologies Office with its fuel economy public outreach and education efforts, the FEI Program has worked in cooperation with Maryland Public Television to develop a number of MotorWeek and MotorNews segments. These segments cover topics related to fuel economy, alternative fuels and vehicles, and advanced vehicle technologies. MotorWeek is television’s longest running automotive show and airs on 92% of PBS stations nationwide. It can also be seen on cable's Velocity and V-me Spanish-language network. After airing, these segments are posted on the Clean Cities TV You Tube channel [2], the Fuel Economy YouTube channel [3] and FuelEconomy.gov. MotorWeek developed and broadcast three segments related to fuel economy in FY 2017: (1) Clean Fleets Drives—the Midwest Goes Green, (2) EV Charging Update, and (3) Repurposing EV Batteries. The FEI Program developed a Fuel Economy Toolkit for Clean Cities coordinators and others to promote fuel economy and FuelEconomy.gov to the public. The toolkit includes fact sheets, fact cards, web cards, and presentations. The toolkit is available on FuelEconomy.gov. The FEI Program promotes FuelEconomy.gov by informing media of new website content and features. It also provides EERE with information for its social media posts. Ensuring that consumer access to the FuelEconomy.gov website is dependable and uninterrupted is critically important. The FuelEconomy.gov servers are located at the ORNL main campus, for improved security and backup, and they are maintained by the FEI Program with help from ORNL’s computer network staff. The production servers are getting old and must be replaced in order to remain in the secure area at ORNL. New servers were acquired in FY2017, and the FEI Program is developing a migration plan for FY 2018. FuelEconomy.gov is a consumer-oriented website, and the FEI Program prides itself on being responsive to consumer comments, suggestions, and questions. Consumers and media contacting FuelEconomy.gov can expect a response within a couple of business days (usually sooner), and follow-up emails or even phone calls are not uncommon if they are needed to understand a problem or resolve an issue.
Results In model year 2017, the FEI program continued to help DOE meet its statutory requirement to print and distribute an annual fuel economy booklet for light-duty vehicles. The FEI Program printed 197,638 copies of the Model Year 2017 Fuel Economy Guide and distributed them to nearly 31,000 new car dealers, more than 27,000 public libraries, and 20,700 credit unions. About 100,000 of the copies were sent to the U.S. Government Publishing Office (GPO) for distribution to individuals, businesses, and organizations upon request. The electronic version of the 2017 Guide, which the FEI Program updates weekly, is available on-line at FuelEconomy.gov. The FEI Program began compiling data for the 2018 Guide in the last quarter of FY 2017. The 2018 Guide will be finalized and distributed in the first quarter of FY 2018. FuelEconomy.gov is one of the U.S. government’s most visited websites, ranking in the top 1% of federal websites (18th out of 2,100) in 2016. Since its launch in 1999, the website has hosted more than 400 million user sessions. Traffic on the website has increased significantly since 1999, peaking at more than 58 million visitors per year in 2013, when fuel prices increased significantly (see Figure II.4.1). In FY 2017, FuelEconomy.gov hosted over 26 million user sessions, more than 376.1 million page views, and more than 72.9 million daily visits on average.

FY 2017 Annual Progress Report
National Laboratory Projects 127
Figure II.4.1: Traffic on FuelEconomy.gov has grown steadily after its launch in 1999, peaking in 2013 when fuel prices were high.
FuelEconomy.gov’s My MPG tool continues to be popular with consumers. More than 32,000 drivers have shared fuel economy estimates for more than 45,000 vehicles. This fuel economy data has become a valuable resource for both the car-buying public and researchers looking to understand the relationship between on-road fuel economy and EPA estimates. In fact, My MPG data has been used to evaluate EPA test methods and identify potential problems with fuel economy estimates provided to EPA by manufacturers. The Find-a-Car mobile app has been successful, though not as popular as the FuelEconomy.gov website. At the end of FY 2017, 28,219 users had installed the app (15,728 on Apple devices and 12,491 Android). The app has a combined user rating of over 4.0 out of 5.0. Research by the FEI Program into driving and maintenance factors that affect fuel economy provides useful, actionable information for drivers wishing to improve their vehicle fuel economy. The fuel-saving tips pages are a popular destination on FuelEconomy.gov, and the tips are frequently featured by the news media. In FY 2017, research into the effects of aggressive driving on fuel economy led to a change in the aggressive driving tip on FuelEconomy.gov. The results of this study were featured on over twenty news outlets such as USA Today, Reader’s Digest, Yahoo! News, and other local news outlets, including several outlets in Great Britain and India. In addition to its popularity with consumers, FuelEconomy.gov is a trusted resource for television, print, and online media. Information on FuelEconomy.gov has been featured in articles by national news outlets like CBS News, USA Today, CNN, the Washington Post, and Time Magazine; financial news outlets like MarketWatch, Bloomberg.com, Forbes.com, and Fortune.com; automotive publications and websites such as Car and Driver, Automotive News, Cars.com, and autoblog.com; local newspapers and television news; and college newspapers. It is also cited by Ford Motor Company Newsroom, Toyota USA, and Volkswagen of America. So, in addition to reaching consumers directly, it also reaches them through print and online materials from other sources. ORNL estimates that the FEI Program, through the Fuel Economy Guide, FuelEconomy.gov, and other education and outreach efforts, helped reduce U.S. petroleum consumption by an estimated 59 million gallons in 2016 alone.

Technology Integration
128 National Laboratory Projects
Conclusions In FY 2017, the FEI Program continued to meet its objectives to: • Help DOE fulfill its statutory responsibility to publish and distribute an annual fuel economy booklet
providing information on fuel economy and estimated annual fuel costs of operating automobiles manufactured in each model year
• Provide consumers with reliable, unbiased fuel economy information • Help improve U.S. energy security and reduce reliance on imported oil by promoting fuel economy to
consumers • Help consumers make informed decisions when purchasing and operating vehicles by
o Providing information about the fuel economy and fuel costs of vehicles o Educating consumers on the benefits of improved fuel economy o Providing tools that help consumers estimate fuel use and fuel costs
• Help DOE’s Vehicle Technologies Office promote energy efficiency & fuel economy, alternative fuels, alternative fuel vehicles, and advanced vehicle and fuel technologies
FuelEconomy.gov is an effective information resource for consumers and an effective outreach tool for promoting fuel economy and alternative fuels. Its popularity with consumers and reputation with media make it a powerful platform for educating the public about fuel economy. FEI Program research on factors affecting vehicle fuel economy have played an important role in assuring that FuelEconomy.gov’s fuel-saving tips are accurate and up-to-date. The fuel-saving tips produced from this research are one of the reasons FuelEconomy.gov is trusted by both consumers and news media as the authoritative source of fuel economy information. The large number of media outlets that feature information from FuelEconomy.gov indicates that the website has become a primary source, and perhaps the authoritative source, for fuel economy information in the United States. Website content has also been used in research publications, which further speaks to the website’s reputation for providing reliable information. This allows FuelEconomy.gov’s reach to far exceed just those consumers that visit the website. The FEI Program plays an important role in educating the public about fuel economy and providing information to consumers. Through the Fuel Economy Guide, FuelEconomy.gov, and its education and outreach efforts, the FEI Program continues to help increase U.S. energy security by reducing reliance on imported oil.
References [1] http://www.fueleconomy.gov/ [2] https://www.youtube.com/user/CleanCitiesTV [3] https://www.youtube.com/channel/UCdioIZ3pC5sSbRXIw2dgUFw
Key Publications U.S. Department of Energy and U.S. Environmental Protection Agency. 2016. Model Year 2017 Fuel Economy Guide. http://www.fueleconomy.gov/feg/pdfs/guides/FEG2017.pdf. Oak Ridge National Laboratory. 2017. Sensible driving saves more gas than drivers think. https://www.ornl.gov/news/sensible-driving-saves-more-gas-drivers-think.

FY 2017 Annual Progress Report
National Laboratory Projects 129
Thomas, John., Sean Huff, Brian West, and Paul Chambon. 2017. “Fuel Consumption Sensitivity of Conventional and Hybrid Electric Light-Duty Gasoline Vehicles to Driving Style.” SAE Int. J. Fuels Lubr., 10(3):2017. https://saemobilus.sae.org/content/2017-01-9379. Greene, D.L., A. J. Khattak, J. Liu, X. Wang, J.L. Hopson, R. Goeltz, “How does on-road fuel economy vary with vehicle cumulative mileage and daily use?,” Transp. Res. Part D Transp. Environ. 55, 142–161 (2017). https://www.sciencedirect.com/science/article/pii/S1361920916301742. Thomas, John. 2016. "Vehicle Efficiency and Tractive Work: Rate of Change for the Past Decade and Accelerated Progress Required for U.S. Fuel Economy and CO2 Regulations." SAE Int. J. Fuels Lubr., 9(1):290-305. https://doi.org/10.4271/2016-01-0909. Thomas, John. 2014. "Drive Cycle Powertrain Efficiencies and Trends Derived from EPA Vehicle Dynamometer Results." SAE Int. J. Passeng. Cars - Mech. Syst., 7(4):1374-1384. https://doi.org/10.4271/2014-01-2562. Thomas, John, Sean Huff, and Brian West. 2014. "Fuel Economy and Emissions Effects of Low Tire Pressure, Open Windows, Roof Top and Hitch-Mounted Cargo, and Trailer." SAE Int. J. Passeng. Cars - Mech. Syst., 7(2):862-872. https://doi.org/10.4271/2014-01-1614. Thomas, John, Ho-Ling Hwang, Brian West, and Sean Huff. 2013. "Predicting Light-Duty Vehicle Fuel Economy as a Function of Highway Speed." SAE Int. J. Passeng. Cars - Mech. Syst., 6(2):859-875. https://doi.org/10.4271/2013-01-1113. Thomas, John, Brian West, and Sean Huff. 2013. "Effect of Air Filter Condition on Diesel Vehicle Fuel Economy." SAE Technical Paper 2013-01-0311. https://doi.org/10.4271/2013-01-0311. Huff, S., West, B., and Thomas, J., "Effects of Air Conditioner Use on Real-World Fuel Economy," SAE Technical Paper 2013-01-0551, 2013, https://doi.org/10.4271/2013-01-0551. Thomas, John, Brian West, Sean Huff, and Kevin Norman. 2012. "Effect of Intake Air Filter Condition on Light-Duty Gasoline Vehicles." SAE Technical Paper 2012-01-1717. https://doi.org/10.4271/2012-01-1717.

Technology Integration
130 National Laboratory Projects
II.5 EPAct Regulatory Programs (National Renewable Energy Laboratory)
Ted Sears, Principal Investigator National Renewable Energy Laboratory 901 D St. SW Suite 930 Washington, DC 20024 Phone: (202) 488-2221 E-mail: [email protected]
Dana O’Hara, Technology Manager U.S. Department of Energy Phone: (202) 586-8063 E-mail: [email protected] Start Date: October 1, 2016 End Date: September 30, 2017 Total Project Cost: $802,386 DOE share: $802,386 Non-DOE share: $0
Project Introduction The National Renewable Energy Laboratory’s (NREL’s) Market Transformation group provides technical and analytical support to the Vehicle Technologies Office’s (VTO’s) Alternative Fuels Regulatory activity, which is mandated by federal legislation. Specifically, NREL supports DOE's implementation of Sections 507(o), 501, and 508 of the Energy Policy Act of 1992 (EPAct) through the provision and management of information products and other technical, program, policy, and regulatory analyses. EPAct Section 507(o) and 501 mandate that covered state and fuel provider fleets (respectively) acquire specific percentages of their new light duty vehicles as alternative fuel vehicles (AFVs). EPAct Section 508 requires DOE to establish a vehicle credit trading program to provide compliance flexibility to covered fleets. In Fiscal Year 2017, NREL’s task focused on two areas: State & Alternative Fuel Provider activity, and rulemaking and regulatory activities. In addition to project management and operational functions, NREL’s role is to analyze, make recommendations, and implement means to streamline this congressionally-mandated program. NREL also integrates work across several related alternative fuel programs to leverage resources and ensure that analytical work reflects developments and knowledge within related DOE research and development programs.
Objectives The key overarching objective is to ensure full implementation of the statutorily-mandated program and oversee compliance by covered entities. Within this objective there are two tasks, as follows: Task 1: Focus on the legislative requirements for State and Fuel Provider (SFP) fleets. The core activities in this task involve tracking and ensuring fleet compliance, analyzing and implementing any new legislative requirements and policies that may impact the program, and working directly with fleets, as needed, to ensure compliance, while managing the compliance database. Task 2: Support DOE’s rulemaking activities, which, in the past, have included analysis and development of a revised national replacement fuel goal; development and promulgation of DOE’s final private and local fleet rule determination; and development of rules to implement statutory requirements set forth in EPAct, as amended by EPAct 2005 and the Energy Independence and Security Act (EISA) of 2007. At times it also requires evaluating proposed legislation that may impact SFP fleets, and developing technical comments and suggested revisions, for communication to Congress through DOE’s legislative affairs offices. This may include reviewing provisions that affect the availability and cost of vehicles, technology, and fuels; potential
FY 2017 Annual Progress Report
National Laboratory Projects 131
fuel savings; and programmatic requirements. NREL also addresses, as necessary, fuel petition review and analysis.
Approach NREL’s Market Transformation group works to increase the use of renewable energy technologies. The NREL team provides technical and analytical support to VTO’s Alternative Fuels Regulatory activity, which implements elements of federal legislation related to the acquisition of alternative fuels and advanced fleet vehicles. This involves providing VTO with strategic planning, project management, and data management, as well as technical, regulatory, and analytical support of the program.
Results Covered fleets report at the end of a calendar year for the preceding Model Year (MY), e.g., the reports submitted by December 31, 2016 covered MY 2016 vehicle acquisitions. In reports submitted at the end of 2016, the compliance rate for the State and Fuel Provider program for the more than 300 reporting entities, representing nearly 2,000 covered fleets, was 100%. The program provides tremendous flexibility in terms of how fleets may achieve compliance, whether they select Standard Compliance or Alternative Compliance. Fleets complying via Standard Compliance may earn credits toward compliance if they acquire light-duty AFVs, purchase and use biodiesel, acquire hybrid vehicles, neighborhood electric vehicles, and medium and heavy-duty AFVs, and/or invest in alternative fuel infrastructure, non-road equipment, and emerging technologies related to electric drive vehicles. Nearly 300 fleets used Standard Compliance and exceeded their aggregate MY 2016 acquisition requirements by more than 5%. Fleets complying via Alternative Compliance do so by reducing petroleum consumption in any number of ways, including through the use of alternative fuels, buying more efficient vehicles, implementing a telecommuting program, reducing trips made, or implementing other efficiency measures. The seven covered fleets that used Alternative Compliance exceeded their aggregate MY 2016 petroleum use reduction requirements by more than 30%. Covered fleets may earn credits for acquiring more AFVs than are required for compliance; those credits can be banked for future use in complying with EPAct requirements. For MY 2016, DOE saw a slight increase in the number of credits earned by fleets using biodiesel fuel, as well as an increase in the number of reported light duty (LD) AFVs acquired, when compared to MY 2015. MY 2016 marked the fourth year that fleets complying via Standard Compliance could earn credits for acquiring an expanded range of vehicles, including hybrid-electric vehicles and neighborhood electric vehicles, and for investing in alternative fuel non-road equipment, alternative fuel infrastructure and emerging technologies. Covered fleets earned 215 credits for these investments in MY 2016.
Conclusions The data for MY 2016 demonstrated 100% compliance by all entities within the program and the extent of overcompliance suggests an ongoing interest on the part of EPAct-covered state and alternative fuel provider fleets in supporting the AFV and advanced technology vehicle markets.

Technology Integration
132 National Laboratory Projects
II.6 Technical Assistance/Technical Response Service (National Renewable Energy Laboratory)
Margo Melendez, Principal Investigator National Renewable Energy Laboratory 15013 Denver West Parkway Golden, CO 80401 Phone: (303) 275-4479 E-mail: [email protected]
Wendy Dafoe, Principal Investigator National Renewable Energy Laboratory 15013 Denver West Parkway Golden, CO 80401 Phone: (303) 275-4470 E-mail: [email protected]
Dennis A. Smith, Technology Manager U.S. Department of Energy Phone: (202) 586-1791 E-mail: [email protected] Start Date: October 1, 2016 End Date: September 30, 2017 Total Project Cost: $1,015,000 DOE share: $1,015,000 Non-DOE share: $0
Project Introduction The National Renewable Energy Laboratory (NREL) leads a group of in-house and contracted experts to provide technical assistance and information that helps improve transportation efficiency and advance the use of domestic fuels and technologies. The Technical Assistance project and Technical Response Service connect transportation stakeholders with objective information that can smooth integration, reduce risks, and ensure their alternative fuel and advanced technology projects are conducted efficiently and cost effectively. These efforts can also identify technology shortfalls and gaps, and help inform ongoing research to improve fuels and advanced vehicle technologies, with industry and consumer needs in mind. Fleets across the nation have made great progress integrating alternative fuels, advanced vehicles, and fuel-saving measures into their operations. These efforts have reduced transportation energy costs, improved resiliency, and earned fleet managers recognition as sustainability leaders. Yet as fleet managers evaluate their options to use alternative fuels and advanced vehicles, they frequently need additional information or expert guidance to make informed decisions or overcome barriers and technical issues they encounter. Similarly, policymakers, analysts and other transportation decision makers need objective information from expert sources to inform research investment, incentive programs, and projects. To address these challenges, the U.S. Department of Energy’s (DOE’s) Vehicle Technologies Office (VTO) offers technical assistance that connects stakeholders with experts who can provide objective information and answer questions about, and assist with, alternative fuels, fuel economy improvements, and other emerging transportation technologies. The type of technical assistance provided (or requested) runs the gamut from fielding one-time questions that can be answered with a list of resources, to in-person assistance from a subject matter expert on how a particular technology functions. Through these trusted, time-tested methods, DOE has helped fleets and other stakeholders deploy hundreds of thousands of alternative fuel vehicles (AFVs) and fueling stations that serve a

FY 2017 Annual Progress Report
National Laboratory Projects 133
growing market. The project is continually evolving to tackle the biggest integration barriers, contribute new expertise, and inform emerging technology research needs.
Objectives The objective of the technical assistance project is twofold. First, it directly assists end-users by providing a conduit to make informed decisions and solve problems. Second, it provides critical feedback to support next generation research and transportation technologies. This is accomplished by employing a few key methods: • Providing unbiased information, resources and assistance to a broad base of transportation stakeholders,
by sharing and applying practical real world experience, lessons learned, and best practices • Securing in-house (across national laboratories) and subcontracted experts that provide a range of
expertise across fuels, vehicle types and technologies, and identifying additional technical experts as new technologies emerge in the marketplace
• Maintaining robust knowledge of the alternative fuels industry and monitoring inquiry topics, to identify knowledge and integration barriers that should be addressed
• Using results to inform future R&D efforts.
Approach The Technical Assistance project makes varying levels of technical assistance available to transportation stakeholders, ranging from email exchanges that connect stakeholders to existing online tools and documents, to in-person consultations that address specific in-depth challenges. NREL assigns inquiries to appropriate experts, based upon the type of assistance requested and the required depth of response. Additionally, Technical Assistance can be either reactive, to respond to an urgent challenge in real-time, or proactive, to collect knowledge and develop resources that address a common issue. A base level of Technical Assistance is offered through the VTO Technical Response Service (TRS). NREL subcontracts the TRS activity through a competitive process. TRS is a phone- and email-based service staffed by seasoned experts who help stakeholders find answers to technical questions about alternative fuels and fueling infrastructure, fuel economy improvements, idle-reduction measures, advanced vehicles, and other related resources. TRS representatives are experienced with a broad range of resources including online tools and calculators, state and federal laws and incentives, peer-reviewed research, academic publications, program-accumulated case studies, and lessons learned. While much information is available on a variety of VTO and other websites, there is still significant demand for assistance that addresses individual questions or that rapidly connects people with critical information when safety incidents or other urgent needs arise. TRS helps clients focus in on resources that address their situations. Upon receiving an inquiry, TRS experts provide a tailored response by curating a list of current, relevant resources and pinpointing the applicable material within those resources, on a case-by-case basis. Each inquiry is documented in a database, and through analytics, DOE can identify trends and information needs. TRS is an important resource that answers inquiries, but it also enables VTO to identify information gaps, technology shortfalls in the field, and other technical topics that need to be addressed. For inquiries that require specific expertise to successfully execute a project or address a problem, DOE provides technical assistance through Tiger Teams, a group of highly skilled experts from national laboratories and industry. Industry experts are identified through a competitive process and subcontracted by NREL. These experts have deep knowledge, either in a specific area, or across the range of alternative fuels, including natural gas, hydrogen, propane, and biofuels, such as ethanol and biodiesel. They also have expertise in plug-in electric vehicles (PEVs), and emerging topics and technologies, such as electric vehicle supply equipment (EVSE) infrastructure assessment and planning, and using data to better execute energy efficient transportation projects. With many years of hands-on experience, these experts work with fleet operations staff, fuel providers and fueling equipment suppliers, vehicle conversion companies, and equipment and vehicle

Technology Integration
134 National Laboratory Projects
manufacturers, to assist with all phases of a project. From concept to implementation, operation, and mainte-nance, Tiger Teams can help industry and fleets tackle difficult technical and market challenges that might otherwise cause projects to stall. Building on extensive learning opportunities from previous consultation experiences, Tiger Teams are constantly evolving, to streamline projects and help stakeholders achieve better results, more quickly and cost-effectively. Designed to not compete with private industry, Tiger Team experts come alongside existing project teams in situations that challenge local resources, or in instances where local expertise does not exist. Acting as a neutral third-party, Tiger Teams provide technical expertise, help address problems, resolve differences, and get stalled projects moving again. After a Tiger Team is utilized, the findings are shared with other stakeholders, either formally, through a report or a website, or more informally, through webinars and presentations.
Results A sampling of recent TRS and Technical Assistance projects includes the following: Technical Response Service Inquiries Adrian Jaynes, Tulsa Clean Cities, requested projections of how many PEV models will be available in the United States in 2020. TRS compiled a spreadsheet of PEV models that may be available at that time, including projected model years of production and vehicle categories, based on information from Fueleconomy.gov, original equipment manufacturer (OEM) resources, and industry websites. Ann Vail, Louisiana Clean Fuels, requested an emissions comparison of gasoline and propane cutaway vans. Based on the vehicle data provided, TRS estimated emissions for propane and gasoline cutaway vans using Argonne National Laboratory’s Alternative Fuel Life-Cycle Environmental and Economic Transportation (AFLEET) Tool. Wendy Lucht, Ocean State Clean Cities, requested information for legislative testimony on Rhode Island’s PEV rebate program, including information on other states’ PEV rebate programs, gallons of petroleum saved nationwide through PEV use, and case studies. TRS compiled a list of PEV rebate programs from the Alternative Fuels Data Center (AFDC) Laws and Incentives database, and provided PEV case studies and publications, sourced from the AFDC and Clean Cities pages. Bill Sheaffer, Valley of the Sun Clean Cities, inquired about the specific properties of biodiesel, compared to those of renewable diesel. TRS collaborated with Kristi Moriarty and Bob McCormick of NREL to provide a response. They noted that many studies have shown the benefits of renewable diesel, including reductions in life-cycle greenhouse gas emissions and criteria pollutants, as well as the fuel’s high cetane number. They also addressed concerns regarding lubricity and the refining process. A local government inquired whether there are any cities or states that require airports to deploy AFVs. TRS consulted with Stephanie Meyn, Port of Seattle (and Sea-Tac airport) and searched the AFDC Laws and Incentives database. While TRS was not able to locate any state or municipal policies that require airports to deploy AFVs, airports have been driven by federal or state laws, regulations and incentives to develop their own economic and environmental sustainability goals, and implement AFV fleets. TRS provided an overview of the federal regulations that govern airport emissions, information on relevant laws and incentives, and specific case studies. A state Department of Environmental Quality requested information about EVSE units, installation costs, the time required to install large-scale EVSE, vendors that provide installation and maintenance services, and the emissions benefits of installing EVSE. TRS referred to ANL and Clean Cities publications, and industry resources. TRS also outlined the range of costs for Level 2 and direct current (DC) fast charger units and
FY 2017 Annual Progress Report
National Laboratory Projects 135
installation, summarized installation factors, steps, and timelines, and provided a list of vendors that offer turnkey solutions to EVSE deployment. To perform the emissions calculation, TRS provided average EVSE use information from published industry reports, and directed the client to ANL’s AFLEET Tool, to calculate the benefits of average-use and high-use charging scenarios.
National Aeronautics and Space Administration (NASA) requested guidance on whether E85 fuel must be tested if it has not been used for four months. TRS consulted with Kristi Moriarty and Teresa Alleman from NREL, who provided specific guidance on testing E85 fuel to assure fuel quality, TRS also referred NASA to the DOE’s Handbook for Handling, Storing, and Dispensing E85 and Other Ethanol-Gasoline Blends.
U.S. Department of Treasury inquired whether honey could be used as a feedstock for ethanol, and whether there are any plants in the United States that may be able use honey. TRS conferred with Kristi Moriarty at NREL and referred the client to a list of facilities that accept food waste as a feedstock to produce ethanol. Additionally, TRS recommended the Renewable Fuels Association list of biorefineries, and provided information regarding ethanol feedstocks and sugar-based ethanol production, taken from the AFDC and a U.S. Department of Agriculture (USDA) study.
U.S. Congresswoman Barbara Comstock (TX) requested information on the deployment of a national network of DC fast charging stations and corridors, supported by loan program funding, and involving various federal agencies. TRS provided information on federal government R&D efforts and programs; laws and incentives related to PEVs and EVSE; and charging analytics.
A consumer inquired about how a dual-fuel diesel engine controls fuel intake of diesel and natural gas, and which fuel is used to start and idle the vehicle. TRS consulted with John Gonzales at NREL, and explained that the fuel usage depends on the design of the system, although the engine typically uses diesel to start up and idle. TRS also noted that the flow of natural gas depends upon various conditions, but is controlled by the electronic control module.
A fleet manager requested a cost comparison of compressed natural gas (CNG), electric, and conventional diesel Class 8 trucks. TRS recommended using ANL’s AFLEET Tool to conduct the cost comparison. TRS also provided detailed tables of the total cost of ownership for each of the three vehicle types, based on calculations from the AFLEET tool. TRS referred the fleet manager to AFDC resources, as well as DOE’s publications, Building a Business Case for CNG in Fleet Applications, and PEV Handbook for Fleet Managers.
A non-profit requested information on the life-cycle costs of all-electric transit buses. TRS referred the client to NREL, ANL, and California Air Resources Board resources for all-electric transit bus life-cycle cost estimates and provided contacts, where available. For examples of fleets with all-electric transit buses, TRS referred the requester to the AFDC Case Studies database and the U.S. Department of Transportation Federal Transit Administration Low or No Emission Vehicle Deployment Program Project Selections webpage.
A Real Simple magazine reporter, as part of research for an article, requested tips on how to conserve fuel and increase fuel economy on road trips. TRS referred the reporter to FuelEconomy.gov’s Gas Mileage Tips website, which includes information on a range of fuel-efficiency measures, including the gasoline savings and fuel economy benefit the driver receives from each measure. TRS explained that fuel economy can differ based on climate, and recommended FuelEconomy.gov’s Fuel Economy in Cold Weather and Fuel Economy in Hot Weather websites. TRS also referred the reporter to AFDC resources.
Technical Assistance Activities Compressed Natural Gas Vehicle Maintenance Facility Modifications Handbook: In response to a growing number of questions about the facility modifications required to make indoor maintenance facilities safe for performing maintenance on compressed natural gas (CNG) vehicles, and confusion regarding which industry codes were applicable, Tiger Teams engaged with industry experts to develop guidance for fleet

Technology Integration
136 National Laboratory Projects
managers. The resulting CNG Vehicle Maintenance Facility Modifications Handbook explains the basic properties of a gaseous fuel such as CNG and traditional liquid fuels like gasoline and diesel, and why facilities need to be designed differently to account for those differences. It outlines the applicable building codes and identifies the various building systems that should be evaluated, for compliance with the codes. In addition, the document provides helpful advice for engaging with local code officials and executing a facility modifications project. The handbook was reviewed by many industry experts to ensure comprehensive and accurate coverage of the topic. State of Oklahoma Public Electric Vehicle (EV) Charging Assistance: The Indian Nations Council of Governments (INCOG), the COG/MPO in Tulsa, Oklahoma is planning to use federal Congestion Mitigation and Air Quality (CMAQ) funds to install publicly available EVSE throughout its airshed. INCOG wanted to locate stations optimally, to facilitate convenient charging and alleviate range anxiety. Tulsa Area Clean Cities coalition engaged Technical Assistance to help them identify relevant data, to enable them to map station locations and prioritize development. NREL analysis experts recommended combining six geographic information system (GIS) datasets. These datasets included: 1) existing EVSE locations; 2) annual average traffic flows; 3) weighted vehicle density of EV, plug-in hybrid electric vehicle (PHEV), and hybrid electric vehicle (HEV) registrations; 4) age, income, and education demographics; 5) city property zoning; and 6) electric grid infrastructure. NREL advised the coalitions about where to obtain the datasets, helped them prioritize and weight the data, and provided a list of supporting literature. For example, NREL weighted EVs most heavily, followed by PHEVs, due to their likely usage of EVSE. HEVs had the lowest weighting, because they do not reflect current EVSE demand, but rather prospective demand, as HEV owners are likely to upgrade to PEVs in the future. To stay within budget, INCOG is using its own GIS experts to map the data and develop an EVSE plan. In 2018, Tulsa Area Clean Cities and INCOG are hoping to leverage the Tulsa plan into a statewide plan using similar data points, by working with Central Oklahoma Clean Cities, the State Energy Office, Oklahoma Electric Vehicle Coalition, and electric utilities across the state. State of Colorado Alternative Fuel Infrastructure Development Assistance: Colorado’s Regional Air Quality Council (RAQC) manages the ALT Fuels Colorado program, which has $30 million available over five years, to fund AFVs and infrastructure projects. The RAQC engaged with Technical Assistance to leverage best practices as it developed the program. A national laboratory alternative fuel expert participated in the state’s working group and provided significant expert advice as RAQC developed its Request for Proposals (RFP). Developing a robust RFP resulted in quality proposals being submitted to the state. In addition, Technical Assistance participated in proposal reviews, which helped the RAQC select the strongest projects. Multi-State Alternative Fuel Corridor Infrastructure Development Assistance: The Kansas City Clean Cities coalition requested expertise from Technical Assistance as it sought to use CMAQ funding to construct a CNG fueling station at a strategic location in Topeka, Kansas. The goal was to fill a critical infrastructure gap on the corridor between the eastern border of Kansas and the Colorado state line. The station construction was the first step in strengthening corridor fueling ties between Colorado and Kansas. Technical Assistance provided direct expertise, and helped connect state officials in Kansas, who had limited experience in writing and administering RFPs for alternative fuel stations, to officials in Colorado, who already had an active and highly successful AFV infrastructure effort in place. Alternative Fuel Incident Investigations: National laboratory experts frequently participate in incident and safety investigations involving AFVs, to assess root causes and recommend corrective actions. For example, when a CNG fuel tank on a Class 8 CNG truck experienced a critical failure (rupture) during fueling, Technical Assistance was asked to participate on the incident investigation team. After reviewing incident data, interviewing those involved and inspecting the vehicle, the team was able to reconstruct the events leading up to the incident and make recommendations on how similar incidents could be prevented. In this case, it was discovered that the vehicle struck some road debris near the end of its driving route. Although the driver did a cursory visual inspection of the vehicle prior to re-fueling, he did not see the extent of the damage

FY 2017 Annual Progress Report
National Laboratory Projects 137
to the saddle-mounted CNG fuel tank. Upon refueling, as the CNG fuel tank re-pressurized, it experienced a critical failure that destroyed the vehicle and caused significant damage to the fueling station. The incident investigation team advised the fleet to implement a new policy of calling for a tow truck any time a vehicle strikes road debris, so that trained CNG fuel system inspectors can evaluate the integrity of the CNG system. The fleet was advised to train their drivers to never attempt to re-fuel a vehicle after striking road debris, unless it has first been evaluated by a certified inspector. This best practice, which will also ensure driver safety, is also being disseminated to other CNG users and fleets through Tiger Teams and its extensive network of industry relationships. AFV Conversion, Retrofit, and Repower Guide: Over the years, Technical Assistance has been asked to help many fleets that were experiencing challenges related to vehicle conversion projects. Fleets were often experiencing safety, performance, and reliability issues, and/or contending with products from suppliers and vendors that were no longer in business. Tiger Teams personnel have expertly come alongside each fleet to help them identify root causes for their issues and recommend corrective actions. This has included working with the fleet, supplier, or other local resources to develop standard operating procedures, address warranty issues, and identify technical solutions. In cases where fleets no longer had viable suppliers, Tiger Teams were often able to work with manufacturers and other industry contacts to address problems and keep converted vehicles on the road. There is the potential for many vehicles to be converted to alternative fuels in the coming years, due, in part, to funding that will soon become available from the Volkswagen settlement, so Tiger Teams developed the AFV Conversion, Retrofit, and Repower Guide. This guide presents common definitions and comprehensive guidance on technology options and considerations for fleets pursuing a conversion, retrofit, or repower to an alternative fuel, along with advice on selecting and working with reputable vendors. CNG Fuel Tank Safety Assurance: Fleets with aging CNG vehicles have approached NREL with questions about the disposition of CNG fuel tanks at the end of their documented useful lives. For many years, Tiger Teams worked with these fleets and with tank manufacturers to help document tank inspection processes for fleets to reference. A second project addressed the natural gas industry’s increasing concerns about CNG fuel tanks in use past the end of their documented useful lives. To better understand the risk these tanks pose, and support the industry in responding to these risks, NREL worked with industry experts to perform testing of compressed gas cylinders. These tests included burst testing, impact testing and notch testing, as well as modal acoustic evaluation on a variety of cylinders at the end of their useful lives. Researchers conducted several of these tests and recommended further testing to define a test procedure that better characterizes the integrity of CNG tanks. Tiger Teams also collaborated with industry on updating codes and standards, and clarifying industry procedures to address these concerns. The project culminated in the development of an educational video addressing CNG fuel tank defueling, decommissioning, and disposal. This video was widely disseminated throughout the industry in 2016, to assist fleet technicians with safely and properly disposing of CNG fuel tanks at the end of life.
Conclusions Understanding the complexities of integrating new transportation technologies is made easier by the ready availability of industry experts, through the TRS and the Technical Assistance project. These experts can offer transportation stakeholders valuable insights into the various technology options, along with advice for making informed decisions, and anticipating, mitigating, or altogether avoiding common problems, which increases the chances of project success. Additionally, the interactions with end-users and real-world technologies provide a foundation for future research and priorities at DOE.

Technology Integration
138 National Laboratory Projects
Key Publications Kelly, K., and John Gonzales. 2017. What Fleets Need to Know About Alternative Fuel Vehicle Conversions, Retrofits and Repowers. Golden, CO: National Renewable Energy Laboratory (NREL), a national laboratory of the U.S. Department of Energy, Office of Energy Efficiency and Renewable Energy. Retrieved from: https://www.nrel.gov/docs/fy18osti/69030.pdf
Kelly, K., and Margo Melendez. 2017. Compressed Natural Gas Vehicle Maintenance Facility Modificaiton Handbook. Golden, CO: National Renewable Energy Laboratory (NREL), a national laboratory of the U.S. Department of Energy, Office of Energy Efficiency and Renewable Energy. Retrieved from: https://www.nrel.gov/docs/fy17osti/67371.pdf
Compressed Natural Gas Fuel Tank Defueling, Decommissioning, and Disposal. Golden, CO: National Renewable Energy Laboratory (NREL), a national laboratory of the U.S. Department of Energy, Office of Energy Efficiency and Renewable Energy. Retrieved from: https://www.youtube.com/watch?v=vTxQPfsm8n0&feature=youtu.be

FY 2017 Annual Progress Report
National Laboratory Projects 139
II.7 Technologist-in-Cities (National Renewable Energy Laboratory)
Stanley Young, Principal Investigator National Renewable Energy Laboratory 15013 Denver West Parkway, MS 1625 Golden, CO 80401-3305 Phone: (303) 275-3283 E-mail: [email protected] Sarah Olexsak, Program Manager U.S. Department of Energy Phone: (202) 286-2149 E-mail: [email protected] Start Date: October 1, 2016 End Date: September 30, 2017 Total Project Cost: $300,000 DOE share: $300,000 Non-DOE share: $0
Project Introduction As cities around the country launch efforts to use data and mobility technology in more innovative and effective ways than ever before, smart cities are serving as proving grounds for increasing the energy efficiency of urban mobility systems. The U.S. Department of Energy (DOE) Energy Efficient Mobility Systems (EEMS) Program envisions an affordable, efficient, safe, and accessible transportation future, in which mobility is decoupled from energy consumption. Technologies that may help achieve this vision may include advanced vehicles and systems that are automated, connected, efficient, and/or shared. EEMS supports research and development that investigates these technologies and other opportunities to increase mobility energy productivity in communities. The EEMS Program uses the term mobility energy productivity to describe the value derived from the transportation system per unit of energy consumed. Increases in mobility energy productivity result from improvements in the quality or output of the transportation system, and/or reductions in the energy used for transportation. As a part of an interagency Memorandum of Understanding (MOU) in support of the EEMS Program, DOE and the U.S. Department of Transportation (DOT) are working to accelerate innovative smart transportation systems research. Through this coordination, DOE paired a Technologist in Cities (TIC) with Columbus, Ohio, after the Smart Columbus project won the DOT Smart City Challenge in 2016.
Objectives The TIC supports the City of Columbus in its endeavors, and serves as a liaison on energy and mobility issues. The TIC advises the city's innovation and technology team on transportation energy efficiency and connects the city to experts throughout the DOE national laboratory system. The TIC facilitates feedback between DOE's EEMS research team and the city, to inform modeling and data analysis conducted at the national laboratories. This is done by gaining access to data on transportation energy use and infrastructure in the City of Columbus, and to data streams from Smart Columbus connected and automated vehicle demonstration projects, once they are implemented.
Approach The City of Columbus was successful in securing two grants supporting the Smart Columbus project, and they have been critical to the work of the TIC. A $40 million DOT award supports mobility and safety improvements for a variety of advanced technologies, such as connected vehicles, automated vehicles, and

Technology Integration
140 National Laboratory Projects
enhanced communications. The DOT grant funds multiple projects, including smart mobility hubs, automated electric shuttles, and truck platooning. Complementing the DOT grant is a $10 million grant from the Paul G. Allen Family Foundation, to accelerate adoption of plug-in electric vehicles (PEVs), enhance charging infrastructure to support PEV adoption, and provide a cleaner and more efficient electric grid. The TIC’s responsibilities span: (a) being a liaison between the city, DOE and its laboratories, the DOT, and the multiple partners within the Smart Columbus initiative, (b) connecting the city with various existing DOE resources that could assist in its efforts (such as DOE Clean Cities resources, technical assistance at DOE laboratories, and researchers within the EEMS research program), and (c) assisting with data resources, by connecting Smart Columbus to DOE data, as well as connecting DOE researchers with city and regional data assets, to further research efforts. The TIC’s experience reinforced the idea that in-person presence and direct interaction were critical to building effective relationships with the city and its partners. Visits by DOE experts and laboratory personnel established personal relationships and trust, leading to several follow-on collaborative activities. Beginning in September 2016, with the kickoff of the Smart Columbus initiative, the TIC maintained a consistent presence in Columbus, spending two to three days per week with the Smart Columbus office, attending working group meetings, and meeting various Smart Columbus partners. In December 2016, the City of Columbus hosted a research workshop with Ohio State University (OSU), to connect to the Systems and Modeling for Accelerated Research in Transportation (SMART) Mobility Consortium. The Consortium is an effort led by five DOE national laboratories that aims to deliver new EEMS data, analysis, and modeling tools, and create new knowledge to support smarter mobility systems. As the project matured and relationships were established, the frequency of the TIC presence in Columbus was reduced. It continues into 2018, as the city moves from planning to execution of the Smart Columbus program. Although the term “smart city” encompasses various objectives to improve the quality of life for citizens, a significant portion of any smart city program hinges on having an effective and sustainable transportation system. The results section below identifies the TIC experiences, interactions, and lessons learned that can inform communities that are working to achieve an energy efficient mobility system as a part of their smart city initiatives.
Results One of the primary support activities undertaken by the TIC was the creation of a Performance Metrics Plan (PMP), for the Electrification Program funded by the Paul G. Allen Family Foundation. The portfolio of projects in the Electrification Program was divided into four areas: (1) projects that involved the city’s Electric Supply De-carbonization, encompassing grid-level energy efficiency and renewable energy projects, such as adding wind and solar renewables, rehabilitating an out-of-service hydro-electric generator, and deploying experimental micro-grids; (2) Fleet Adoption of PEVs by government and private fleets; (3) Consumer Electric Vehicle Adoption aimed at increasing the consumer PEV adoption rate in Columbus and the surrounding seven county region to 1.8% of all registered vehicles within the timeframe of the grant; and (4) providing the Charging Infrastructure needed to support all of Columbus’ electrification goals. Each of the four areas was supported by working groups that broke the objectives down into distinct projects, planned and executed tasks within each project, and reported on the results. The TIC supported the process by collecting the key performance metrics from projects and tasks in the four areas, assembling the metrics into a traceable form, and updating them quarterly during the first year, as the portfolio of projects evolved and developed. This interaction provided many opportunities to connect Smart Columbus working groups with Consortium experts, and to identify key data sets, both internal and external to the city, needed for the PMP. This data will eventually be integrated into the Smart Columbus Operating System (SCOS), a critical element of the DOT grant.

FY 2017 Annual Progress Report
National Laboratory Projects 141
The SCOS will provide a central data hub, based on replicable, open-source software, so that any critical data can be efficiently collected, processed, shared, and leveraged for the benefit of Smart Columbus. The SCOS data management framework allows third-party developers access to the data, enabling them to efficiently leverage smart city investments for externally-developed applications. DOE expects to continue to serve as a liaison between the Consortium and the city of Columbus, to help identify key data sets, and to utilize those data sets for electrification and mobility analysis in Columbus. The PMP developed for the Electrification Program serves as a management tool for identifying critical data needed to support energy efficiency and emission reduction goals. Numerous existing data sources have contributed to the Smart Columbus initiative, including city traffic signal timing and sensor data, Ohio DOT traffic data and volume counts for freeway operations, metropolitan planning organization travel survey data, and geographic information system (GIS) data sets. Many of these sources provide data beyond the spatial limits of the city, and some will likely not be incorporated into the SCOS, as they are already housed within other data systems in the region. The TIC found that access, coordination, and agreement among these regional players remain critical to the overall success of Columbus’s data-sharing environment. The TIC also assisted in introducing emerging data sets to the Columbus effort. In one example, DOE provided analysis using the Electric Vehicle Infrastructure Projection (EVI-Pro) tool, to estimate the number, type and location of charging stations needed to support various levels of PEV adoption within the Columbus region. The TIC’s traffic data industry knowledge led to the introduction of a state-of-the-art commercial traffic data source that reflected the origin and destination, as well as intervening waypoints, of approximately one to two percent of all trips made in in the Columbus region in 2016, to the analysis. Figure II.7.1 shows a visual representation of the data. The city was able to utilize this data-driven spatial analysis to begin to allocate funding to location-specific EVSE projects. The Ohio DOT later procured similar data for the entire state, and shared it with all jurisdictions in Ohio, free-of-charge.
Figure II.7.1: A heat map of existing trip destinations from industry probe data, nicknamed "Columbus Fire"

Technology Integration
142 National Laboratory Projects
The City of Columbus is also working with the Ohio Bureau of Motor Vehicles (BMV), the repository of vehicle registration data, to access data on the composition of vehicles on the road, specifically the percentage of new vehicles that are battery electric vehicles (BEVs) and plug-in hybrid electric vehicles (PHEVs). This data is key to assessing progress toward the Smart Columbus Electrification Goals for consumer adoption of PEVs. It is also critical to a number of related activities, including placement of public charging infrastructure, and market research into likely adopters of PEVs. The data can also provide information on the amount of battery storage capacity in the fleet, as well as advanced vehicle features, such as automated and connected vehicle capabilities. A limited amount of this data is currently obtained through a commercial source, but licensing restrictions prevent extended use. The Consortium is collaborating with Smart Columbus and the Ohio BMV to access and process the vehicle registration data for such purposes, while protecting personal privacy, with the goal of making it available to the City of Columbus, as well as to other cities in Ohio pursuing similar goals. The TIC also advised the City of Columbus of available DOE tools and expertise that could be leveraged to meet its Smart Columbus objectives. These resources were particularly helpful in addressing the city’s vehicle electrification goals. Key resources shared by the TIC include data from DOE's Alternative Fuels Data Center station locator tool on existing and planned PEV charging stations; and the Greenhouse gases, Regulated Emissions, and Energy use in Transportation (GREET) analysis tool. The GREET tool helps Columbus assess how the mix of vehicles on the road, specifically the percentage of new vehicles that are BEVs and PHEVs, impacts the energy and petroleum used by private vehicles in Columbus. The tool was ultimately integrated into the city’s performance management plan. The City of Columbus beta tested an early version of the Argonne National Laboratory (ANL) Consumer Vehicle Purchase Guidance tool, Evolution, that helps consumers understand how various electric drive powertrains compare to conventional vehicles in meeting their daily travel needs, including providing an estimate of monetary savings, energy consumption, and emissions. The experience gave the City of Columbus an opportunity to leverage an emerging resource for the region, and helped ANL refine the tool to make it more valuable for future users. For year two, the responsibility for the PMP will be transferred to support personnel contracted by the Smart Columbus program. The TIC will remain active, however, in contributing towards the program’s development and evolution, documenting the progress, and ultimately reporting on the energy and greenhouse gas (GHG) savings, for the Paul G. Allen Family Foundation grant.
Conclusions While city governance is complex and each city’s experience with implementing smart city projects will be unique, relationships and data are unifying elements of any smart city project that seeks to enhance mobility, while minimizing energy use. The TIC effort in the City of Columbus embedded an experienced transportation researcher as an adviser to the city and a liaison to DOE. The TIC has been involved from the early days of the project, and has become a trusted and valued member of the Columbus Smart City team. The boots-on-the-ground investment in this first-of-its-kind project helped Columbus gain numerous technical insights into transportation energy use, and available data and resources. DOE gained a greater understanding of the dynamics at play in smart city initiatives, and insight into the challenges that other cities will face as they pursue similar projects. This experience positions DOE well to develop additional technical resources that will enable future projects involving energy, data, and mobility.

FY 2017 Annual Progress Report
143
(This page intentionally left blank)

DOE/EE-1712 Month 2018
For more information, visit: energy.gov/eere/vehicles