Embed Size (px)
Citation preview
February 13, 2015
Corrections of Corrections of Corrections of Corrections of ““““Results for the Results for the Results for the Results for the Six Months Ended September 2014Six Months Ended September 2014Six Months Ended September 2014Six Months Ended September 2014 [IFRS][IFRS][IFRS][IFRS]”””” and and and and ““““Results Results Results Results
for the for the for the for the Nine Months Ended December 2014Nine Months Ended December 2014Nine Months Ended December 2014Nine Months Ended December 2014 [IFRS][IFRS][IFRS][IFRS]””””
Mitsubishi Corporation announced today the corrections of its presentation material
titled “Results for the Six Months Ended September 2014 [IFRS]” originally announced
on November 7, 2014, and “Results for the Nine Months Ended December 2014 [IFRS]”
originally announced on February 4, 2015.
1. Corrected items
a) “Results for the Six Months Ended September 2014 [IFRS]”
- Cash Flows (page 4)
b) “Results for the Nine Months Ended December 2014 [IFRS]”
- Cash Flows (page 5)
- Equity and Interest-Bearing Liabilities (page 7)
2. Corrected items are shown underlined in the presentation materials as per attached.
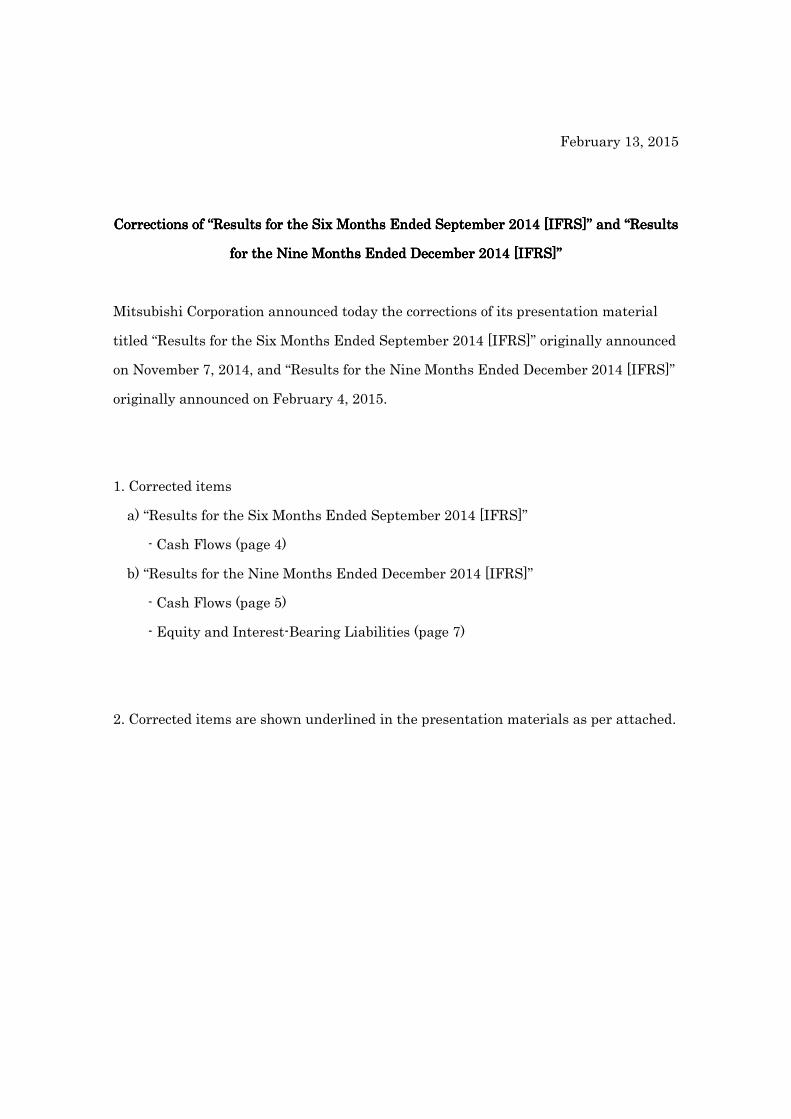
a) “a) “a) “a) “Results for the Six Months Ended September 2014Results for the Six Months Ended September 2014Results for the Six Months Ended September 2014Results for the Six Months Ended September 2014 [IFRS][IFRS][IFRS][IFRS]””””
---- Cash Flows (page Cash Flows (page Cash Flows (page Cash Flows (page 4444))))
(Before correction)
(After correction)
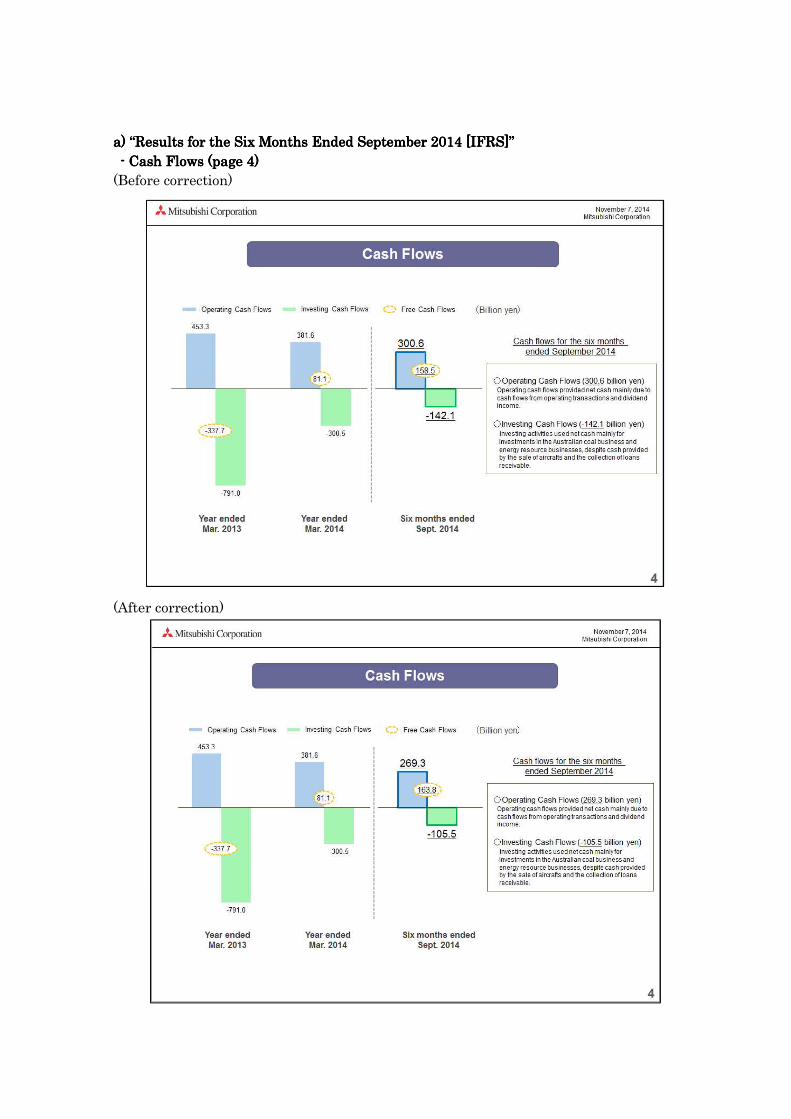
b) “b) “b) “b) “Results for the Nine Months Ended December 2014Results for the Nine Months Ended December 2014Results for the Nine Months Ended December 2014Results for the Nine Months Ended December 2014 [IFRS][IFRS][IFRS][IFRS]””””
---- Cash Flows (page 5)Cash Flows (page 5)Cash Flows (page 5)Cash Flows (page 5)
(Before correction)
(After correction)
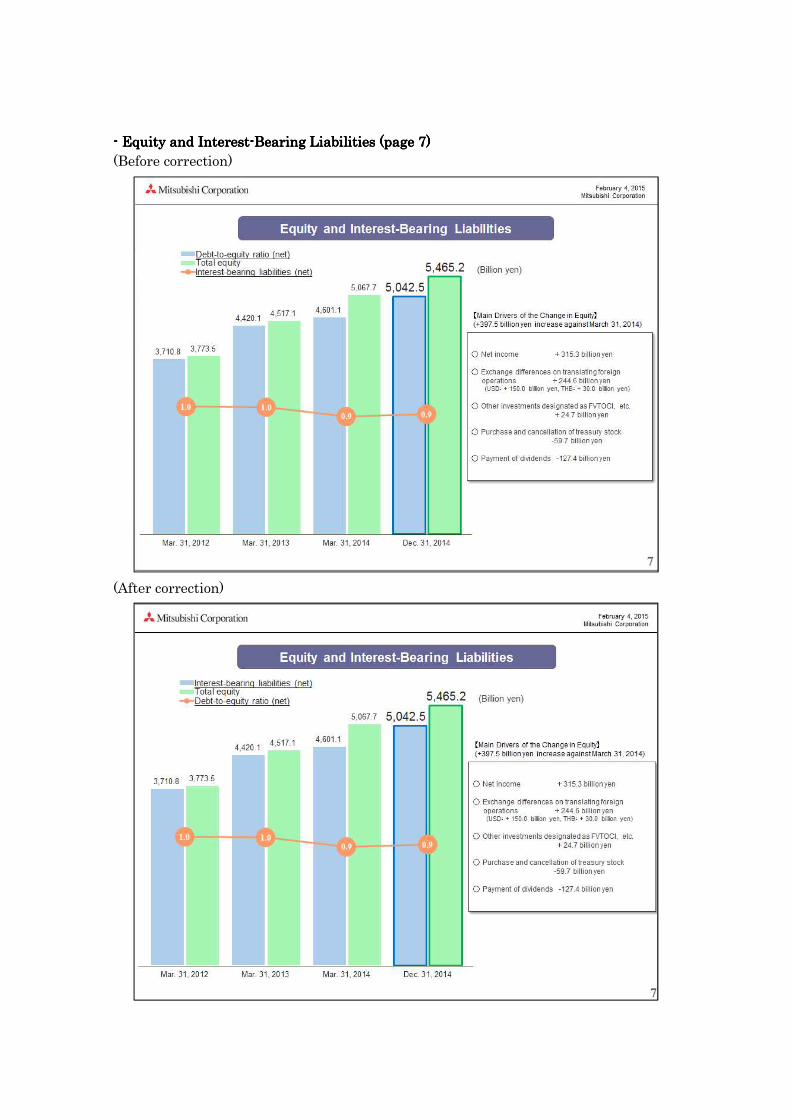
---- Equity and InterestEquity and InterestEquity and InterestEquity and Interest----Bearing Liabilities (page 7)Bearing Liabilities (page 7)Bearing Liabilities (page 7)Bearing Liabilities (page 7)
(Before correction)
(After correction)
November 7, 2014Mitsubishi Corporation
Results for theSixSixSixSix Months Ended September 2014 [IFRS]
November 7, 2014
Mitsubishi Corporation

November 7, 2014Mitsubishi Corporation
1
(Forward-Looking Statements)• This release contains forward-looking statements about Mitsubishi Corporation’s future plans, strategies,beliefs and performance that are not historical facts. Such statements are based on the company’sassumptions and beliefs in light of competitive, financial and economic data currently available and aresubject to a number of risks, uncertainties and assumptions that, without limitation, relate to worldeconomic conditions, exchange rates and commodity prices.
• Accordingly, Mitsubishi Corporation wishes to caution readers that actual results may differ materially fromthose projected in this release and that Mitsubishi Corporation bears no responsibility for any negativeimpact caused by the use of this release.
(Notes Regarding this Presentation Material)• Consolidated net income in this presentation shows the amount of net income attributable to owners ofthe Parent, excluding noncontrolling interests. Equity shows the amount of equity attributable to owners ofthe Parent, excluding noncontrolling interests.
November 7, 2014Mitsubishi Corporation
8.3 1.7
125.0 135.3
88.6118.1
Resource
Non-resource
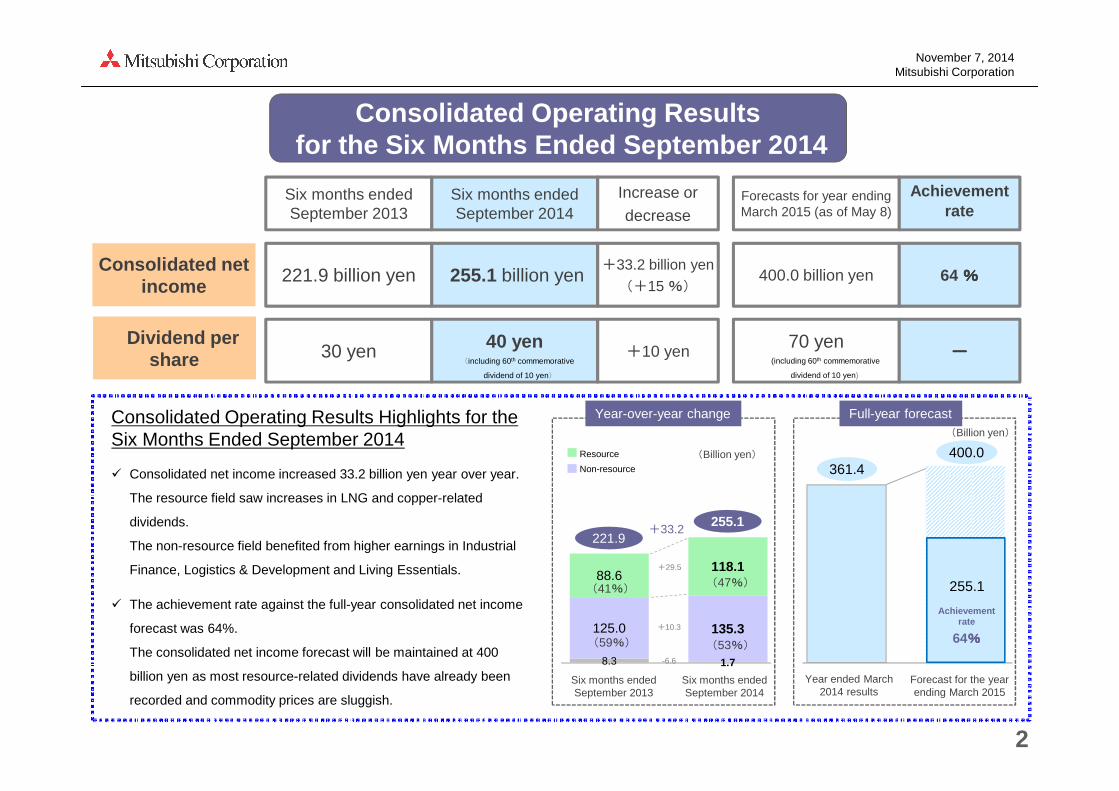
Consolidated Operating Results for the Six Months Ended September 2014
2
Six months ended September 2013
Six months ended September 2014
Increase or
decreaseForecasts for year ending March 2015 (as of May 8)
Achievementrate
221.9 billion yen 255.1 billion yen+33.2 billion yen
(+15 %)
Consolidated netincome
400.0 billion yen 64 %%%%
Six months ended September 2013
Consolidated Operating Results Highlights for the Six Months Ended September 2014
� Consolidated net income increased 33.2 billion yen year over year.
The resource field saw increases in LNG and copper-related
dividends.
The non-resource field benefited from higher earnings in Industrial
Finance, Logistics & Development and Living Essentials.
� The achievement rate against the full-year consolidated net income
forecast was 64%.
The consolidated net income forecast will be maintained at 400
billion yen as most resource-related dividends have already been
recorded and commodity prices are sluggish.
(Billion yen)
Six months ended September 2014
Year ended March 2014 results
Forecast for the year ending March 2015
Year-over-year change Full-year forecast
361.4400.0
(Billion yen)
221.9255.1
+33.2
Achievement rate
64%%%%
255.1
+10.3
-6.6
+29.5
30 yen 40 yen+10 yen
Dividend per share
70 yen----
(including 60th commemorative
dividend of 10 yen)
(47%)
(53%)
(41%)
(59%)
(including 60th commemorative
dividend of 10 yen)
November 7, 2014Mitsubishi Corporation
5.6 4.524.7 33.816.1 14.3
58.3 44.3
12.8 27.37.5
11.1
2013年度
第2四半期(累計)
2014年度
第2四半期(累計)
Six months ended September 2013
Six months ended September 2014
7.8 7.6
80.8 110.5
2013年度
第2四半期(累計)
2014年度
第2四半期(累計)
Six months ended September 2013
3
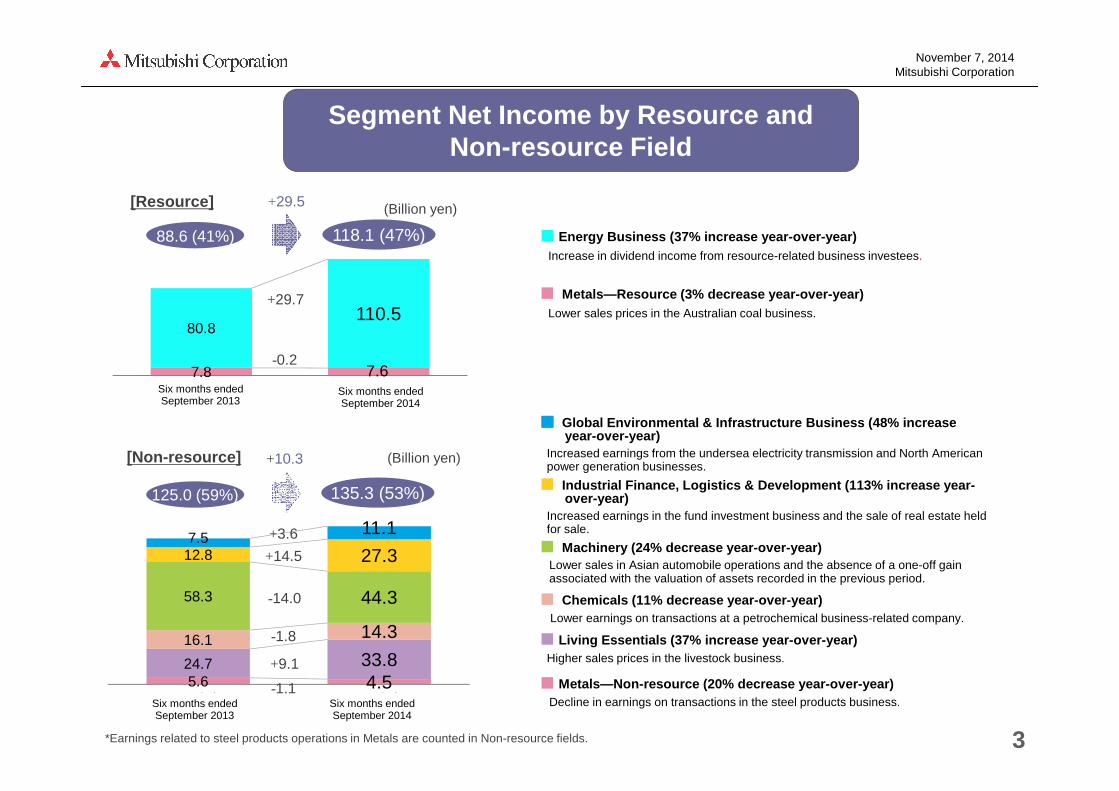
Segment Net Income by Resource and Non-resource Field
[Resource]
[Non-resource]
■ Energy Business (37% increase year-over-year)Increase in dividend income from resource-related business investees.
■ Metals—Resource (3% decrease year-over-year) Lower sales prices in the Australian coal business.
■■■■ Global Environmental & Infrastructure Business (48% increase year-over-year)
Increased earnings from the undersea electricity transmission and North American power generation businesses.
■ Industrial Finance, Logistics & Development (113% i ncrease year-over-year)
Increased earnings in the fund investment business and the sale of real estate held for sale.
■ Machinery (24% decrease year-over-year)Lower sales in Asian automobile operations and the absence of a one-off gain associated with the valuation of assets recorded in the previous period.
■ Chemicals (11% decrease year-over-year)Lower earnings on transactions at a petrochemical business-related company.
■ Living Essentials (37% increase year-over-year)Higher sales prices in the livestock business.
■ Metals—Non-resource (20% decrease year-over-year)Decline in earnings on transactions in the steel products business.
+29.7
-0.2
+3.6
-14.0
-1.8
+9.1
(Billion yen)
(Billion yen)
+14.5
*Earnings related to steel products operations in Metals are counted in Non-resource fields.
+10.3
+29.5
-1.1
88.6 (41%) 118.1 (47%)
125.0 (59%) 135.3 (53%)
Six months ended September 2014
November 7, 2014Mitsubishi Corporation
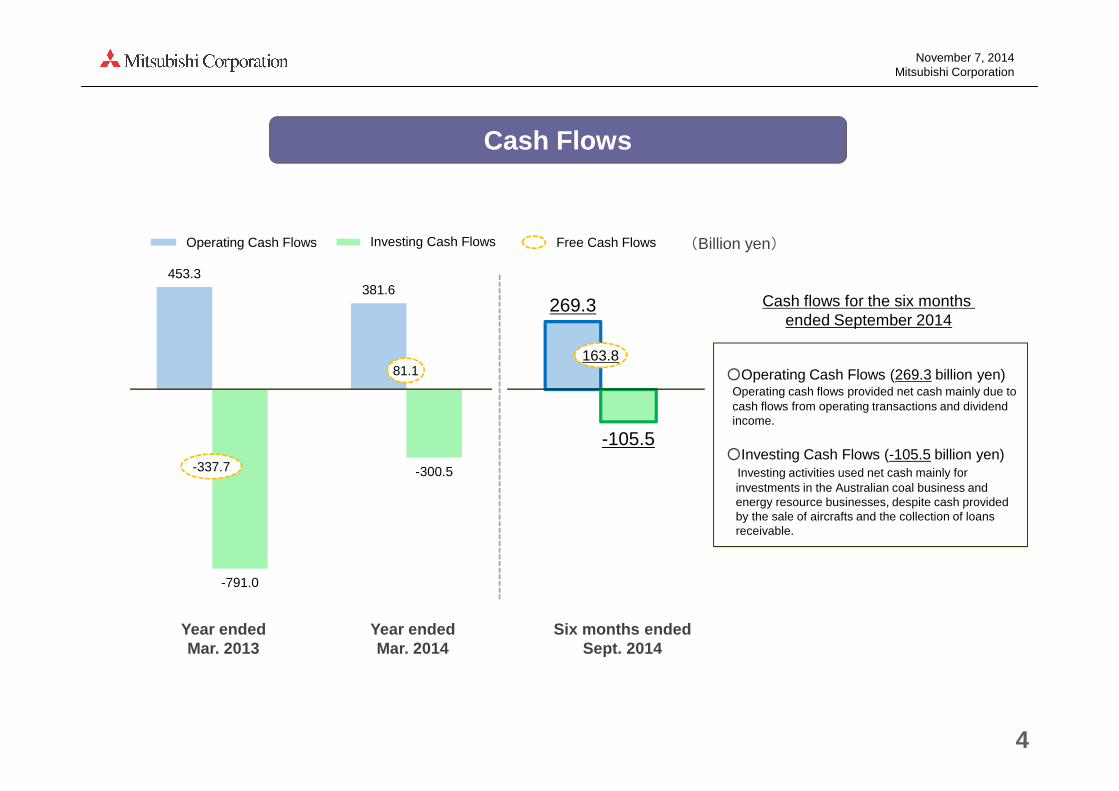
453.3381.6
269.3
-791.0
-300.5
-105.5
営業キャッシュ・フロー 投資キャッシュ・フロー フリーキャッシュ・フローInvesting Cash Flows
Cash Flows
4
(Billion yen)
○Operating Cash Flows (269.3 billion yen)Operating cash flows provided net cash mainly due to cash flows from operating transactions and dividend income.
○Investing Cash Flows (-105.5 billion yen)Investing activities used net cash mainly for investments in the Australian coal business and energy resource businesses, despite cash provided by the sale of aircrafts and the collection of loansreceivable.
Cash flows for the six months ended September 2014
Year ended Mar. 2013
Year ended Mar. 2014
Six months endedSept. 2014
163.881.1
-337.7
Operating Cash Flows Free Cash Flows
November 7, 2014Mitsubishi Corporation
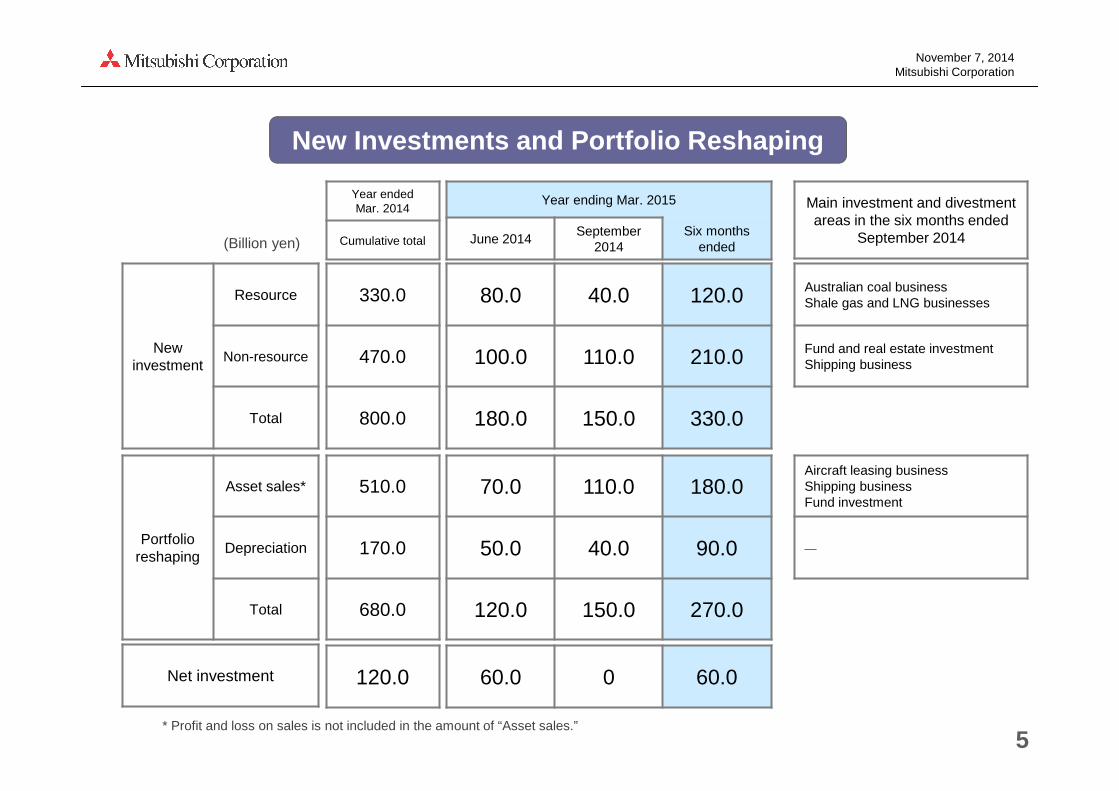
New Investments and Portfolio Reshaping
(Billion yen)
5* Profit and loss on sales is not included in the amount of “Asset sales.”
New investment
Resource
Non-resource
Total
Portfolio reshaping
Asset sales*
Depreciation
Total
Net investment
80.0 40.0 120.0
100.0 110.0 210.0
180.0 150.0 330.0
70.0 110.0 180.0
50.0 40.0 90.0
120.0 150.0 270.0
60.0 0 60.0
Australian coal businessShale gas and LNG businesses
Fund and real estate investmentShipping business
Aircraft leasing businessShipping businessFund investment
―
Year ending Mar. 2015
June 2014September
2014Six months
ended
Main investment and divestment areas in the six months ended
September 2014
330.0
470.0
800.0
510.0
170.0
680.0
120.0
Year ended Mar. 2014
Cumulative total
November 7, 2014Mitsubishi Corporation
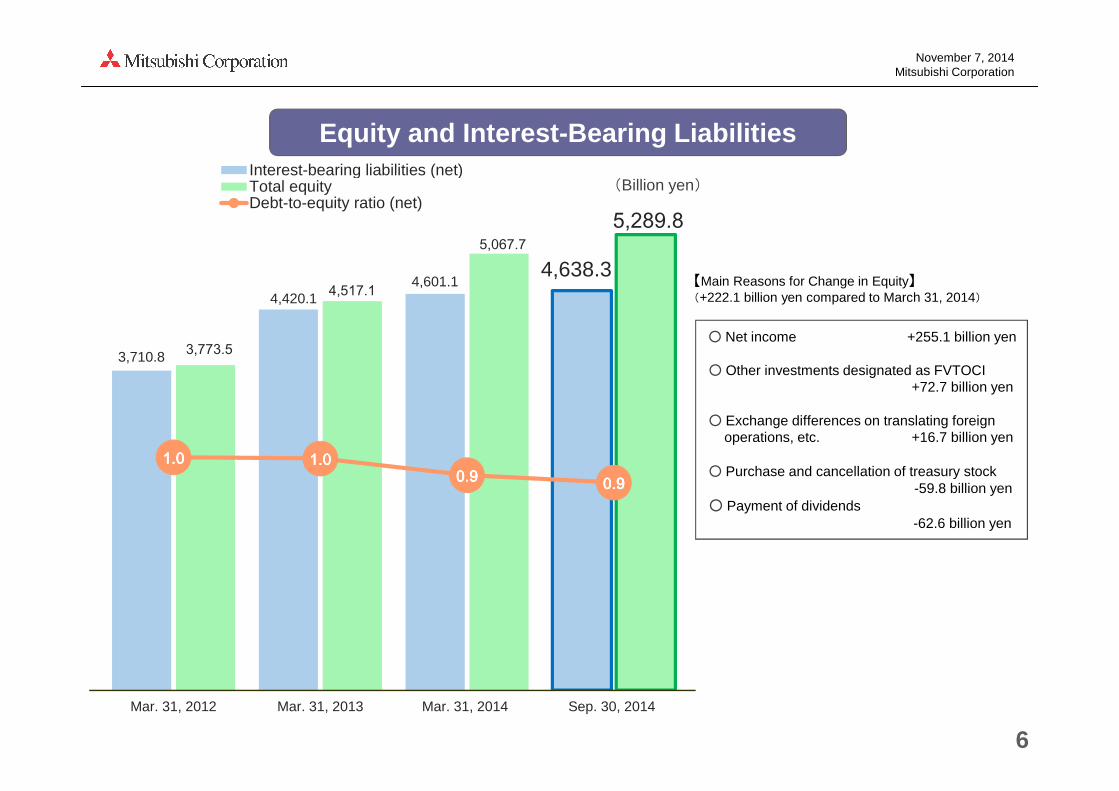
Equity and Interest-Bearing Liabilities
6
3,710.8
4,420.14,601.1
4,638.3
3,773.5
4,517.1
5,067.75,289.8
1.01.01.01.0 1.01.01.01.00.90.90.90.9 0.90.90.90.9
0.0
1.0
2.0
0
10,000
20,000
30,000
40,000
50,000
Mar. 31, 2012 Mar. 31, 2013 Mar. 31, 2014 Sep. 30, 2014
Interest-bearing liabilities (net)Total equityDebt-to-equity ratio (net)
(Billion yen)
○ Net income +255.1 billion yen
○ Other investments designated as FVTOCI +72.7 billion yen
○ Exchange differences on translating foreign operations, etc. +16.7 billion yen
○ Purchase and cancellation of treasury stock-59.8 billion yen
○ Payment of dividends-62.6 billion yen
【Main Reasons for Change in Equity】(+222.1 billion yen compared to March 31, 2014)

November 7, 2014Mitsubishi Corporation
7
[[[[Foreign Exchange, Interest Rate and Commodity Price s Sensitivities ]]]]
(Reference) Market Conditions
Six monthsended Sept.
2014(a)
Forecasts for year ending March 2015
(as of May 8)(b)
Increase ordecrease
(a)- (b) Consolidated Net Income Sensitivities
Foreign Exchange(yen/US$)
103.0 100 3.0 Depreciation (appreciation) of 1 yen per US$1 has a 2.5 billion yen positive (negative) impact on a full-year basis.
Yen Interest (%)
TIBOR0.21 0.25 -0.04
The effect of rising interest rates is mostly offset by an increase in operating and investments profits. However, a rapid rise in interest rates can cause a temporary effect.US$ Interest
(%)LIBOR
0.23 0.40 -0.17
Crude Oil Prices
(US$/BBL) (Dubai)
103.8 100 3.8
A US$1 rise (decline) per barrel increases (decreases) full-year earnings by 1.0 billion yen.Besides crude oil price fluctuations, other variables such as the different fiscal years of consolidated companies, the timing of the reflection of the crude oil price in sales prices, the dividend policy and sales volume affect crude oil-related earnings as well. Therefore, the impact on earnings cannot be determined by the crude oil price alone.
Copper (US$/MT) 6,890 7,496 -606
A US$100 rise (decline) per MT increases (decreases) full-year earnings by 1.3 billion yen. Besides copper price fluctuations, other variables such as the grade of mined ore, the status of production operations, and reinvestment plans (capital expenditure) affect earnings from copper mines as well. Therefore, the impact on earnings cannot be determined by the copper price alone.[¢/lb ] [ 313 ] [ 340 ] [ -27 ]
November 7, 2014Mitsubishi Corporation
8
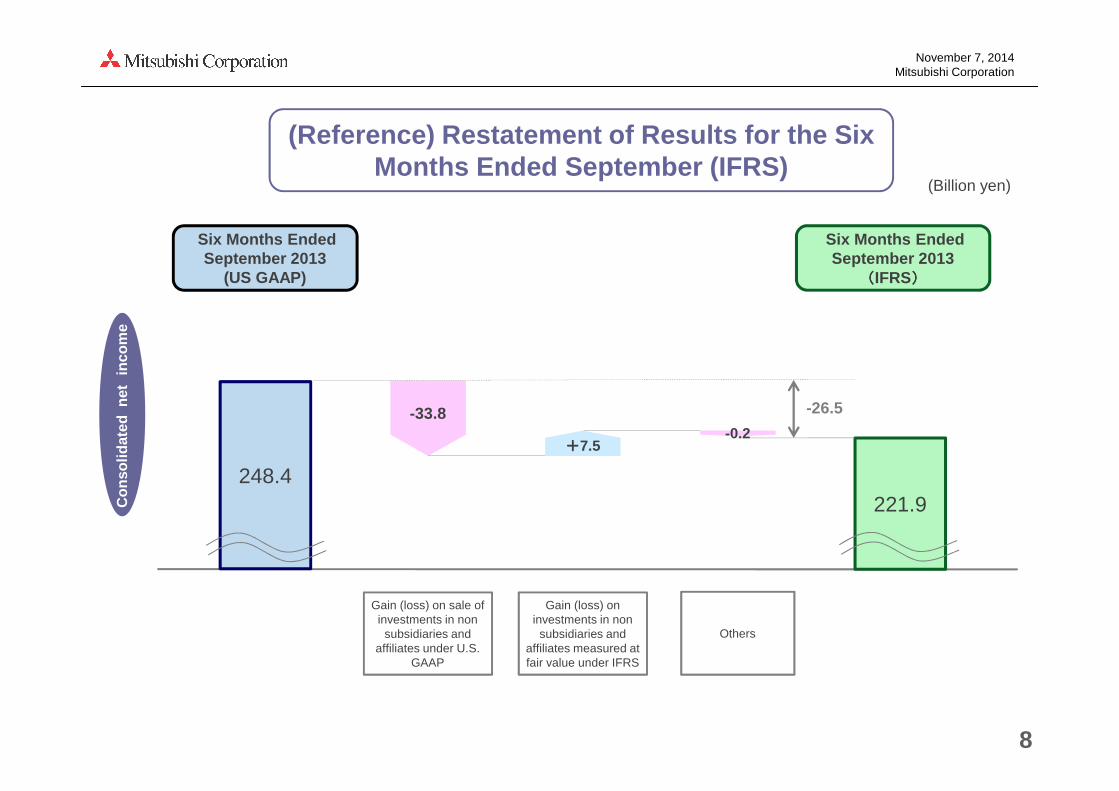
248.4
-33.8
Others
Six Months Ended September 2013
(US GAAP)
Six Months Ended September 2013
((((IFRS))))
(Billion yen)
(Reference) Restatement of Results for the Six Months Ended September (IFRS)
221.9
++++7.5
Gain (loss) on sale of investments in non
subsidiaries and affiliates under U.S.
GAAP
Gain (loss) on investments in non
subsidiaries and affiliates measured at fair value under IFRS
-26.5
-0.2
Con
solid
ated
net
inco
me
February 4, 2015Mitsubishi Corporation
Results for the Nine MonthsEnded December 2014 [IFRS]
February 4, 2015
Mitsubishi Corporation
February 4, 2015Mitsubishi Corporation
1
(Forward-Looking Statements)• This release contains forward-looking statements about Mitsubishi Corporation’s future plans, strategies,beliefs and performance that are not historical facts. Such statements are based on the company’sassumptions and beliefs in light of competitive, financial and economic data currently available and aresubject to a number of risks, uncertainties and assumptions that, without limitation, relate to worldeconomic conditions, exchange rates and commodity prices.• Accordingly, Mitsubishi Corporation wishes to caution readers that actual results may differ materiallyfrom those projected in this release and that Mitsubishi Corporation bears no responsibility for any negativeimpact caused by the use of this release.
(Notes Regarding this Presentation Material)• Consolidated net income in this presentation shows the amount of net income attributable to owners of
the Parent, excluding noncontrolling interests. Equity shows the amount of equity attributable to owners ofthe Parent, excluding noncontrolling interests, which is a component of total equity.
February 4, 2015Mitsubishi Corporation
12.5 3.8 9.0 4.0
196.4 217.1 224.0
324.0
125.6 94.4
167.0
72.0
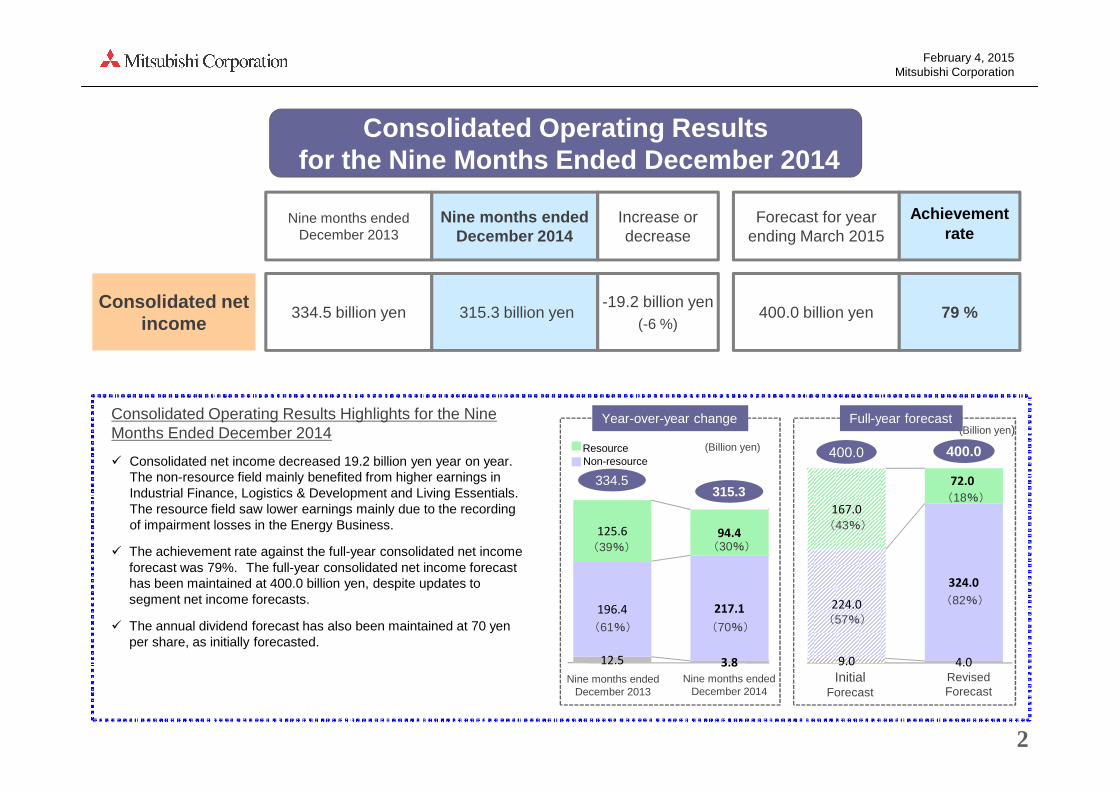
Consolidated Operating Results for the Nine Months Ended December 2014
2
Nine months ended December 2013
Nine months ended December 2014
Increase or decrease
Forecast for year ending March 2015
Achievementrate
334.5 billion yen 315.3 billion yen-19.2 billion yen
(-6 %)Consolidated net
income400.0 billion yen 79 %
Nine months ended December 2013
Consolidated Operating Results Highlights for the Nine Months Ended December 2014
� Consolidated net income decreased 19.2 billion yen year on year.The non-resource field mainly benefited from higher earnings in Industrial Finance, Logistics & Development and Living Essentials. The resource field saw lower earnings mainly due to the recording of impairment losses in the Energy Business.
� The achievement rate against the full-year consolidated net income forecast was 79%. The full-year consolidated net income forecast has been maintained at 400.0 billion yen, despite updates to segment net income forecasts.
� The annual dividend forecast has also been maintained at 70 yen per share, as initially forecasted.
(Billion yen)
Nine months ended December 2014
Initial Forecast
Revised Forecast
400.0 400.0
(Billion yen)
334.5315.3
(30%)
(70%)
(39%)
(61%)
ResourceNon-resource
Year-over-year change Full-year forecast
(18%)
(82%)
(57%)
(43%)
February 4, 2015Mitsubishi Corporation
7.9 11.6 44.3 56.023.0
21.4
78.0 68.5
24.9 36.518.323.1
2013年度
第3四半期(累計)
2014年度
第3四半期(累計)
3
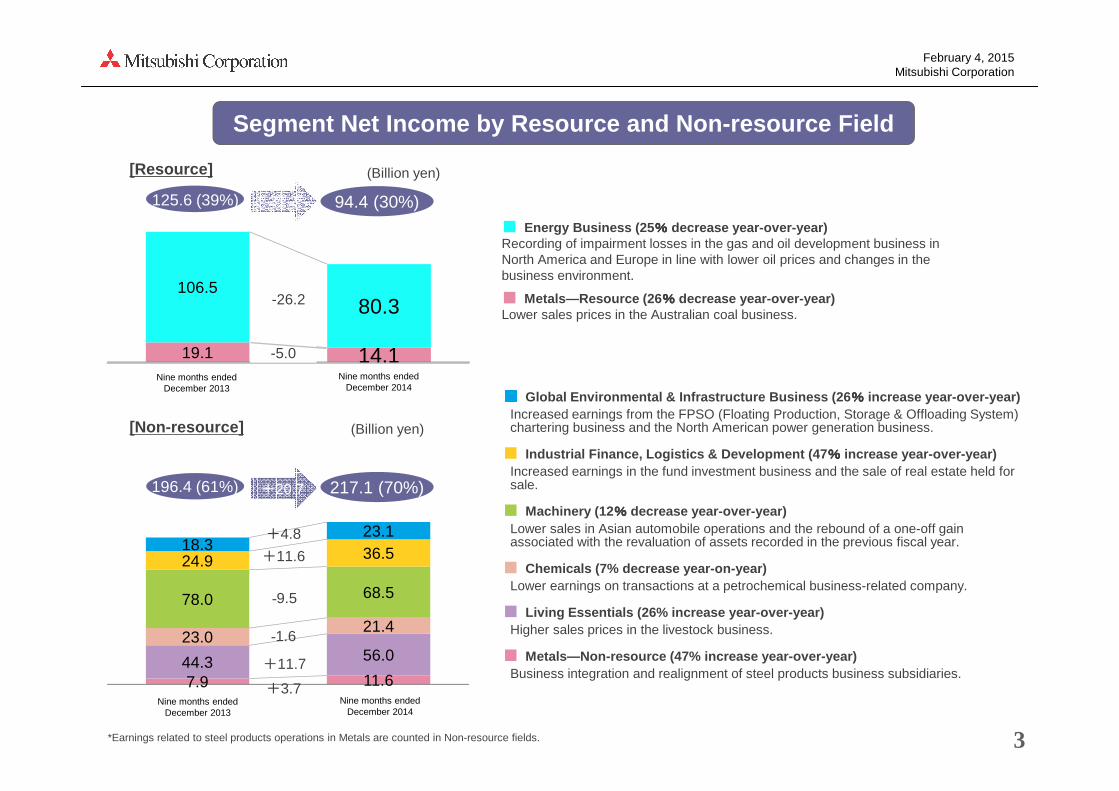
Segment Net Income by Resource and Non-resource Fie ld
[Resource]
[Non-resource]
■ Energy Business (25 %%%% decrease year-over-year)Recording of impairment losses in the gas and oil development business in North America and Europe in line with lower oil prices and changes in the business environment.
■ Metals—Resource (26 %%%% decrease year-over-year)Lower sales prices in the Australian coal business.
■■■■ Global Environmental & Infrastructure Business (26 %%%% increase year-over-year)Increased earnings from the FPSO (Floating Production, Storage & Offloading System) chartering business and the North American power generation business.
■ Industrial Finance, Logistics & Development (47 %%%% increase year-over-year)Increased earnings in the fund investment business and the sale of real estate held for sale.
■ Machinery (12 %%%% decrease year-over-year)Lower sales in Asian automobile operations and the rebound of a one-off gain associated with the revaluation of assets recorded in the previous fiscal year.
■ Chemicals (7% decrease year-on-year)Lower earnings on transactions at a petrochemical business-related company.
■ Living Essentials (26% increase year-over-year)Higher sales prices in the livestock business.
■ Metals—Non-resource (47% increase year-over-year)Business integration and realignment of steel products business subsidiaries.
▲262
▲50
+4.8
-9.5
-1.6
+11.7
(Billion yen)
+11.6
*Earnings related to steel products operations in Metals are counted in Non-resource fields.
+20.7
+3.7
125.6 (39%) 94.4 (30%)
196.4 (61%) 217.1 (70%)
-31.2
19.1 14.1
106.5 80.3
2013年度第3四半期(累計)
2014年度第3四半期(累計)
-26.2
-5.0
(Billion yen)
Nine months ended December 2013
Nine months ended December 2014
Nine months ended December 2013
Nine months ended December 2014
February 4, 2015Mitsubishi Corporation
9.0 4.0
57.0125.0
31.0
31.081.0
88.027.0
38.0
18.0
32.0
57.0
2.0
120.0 80.0
4
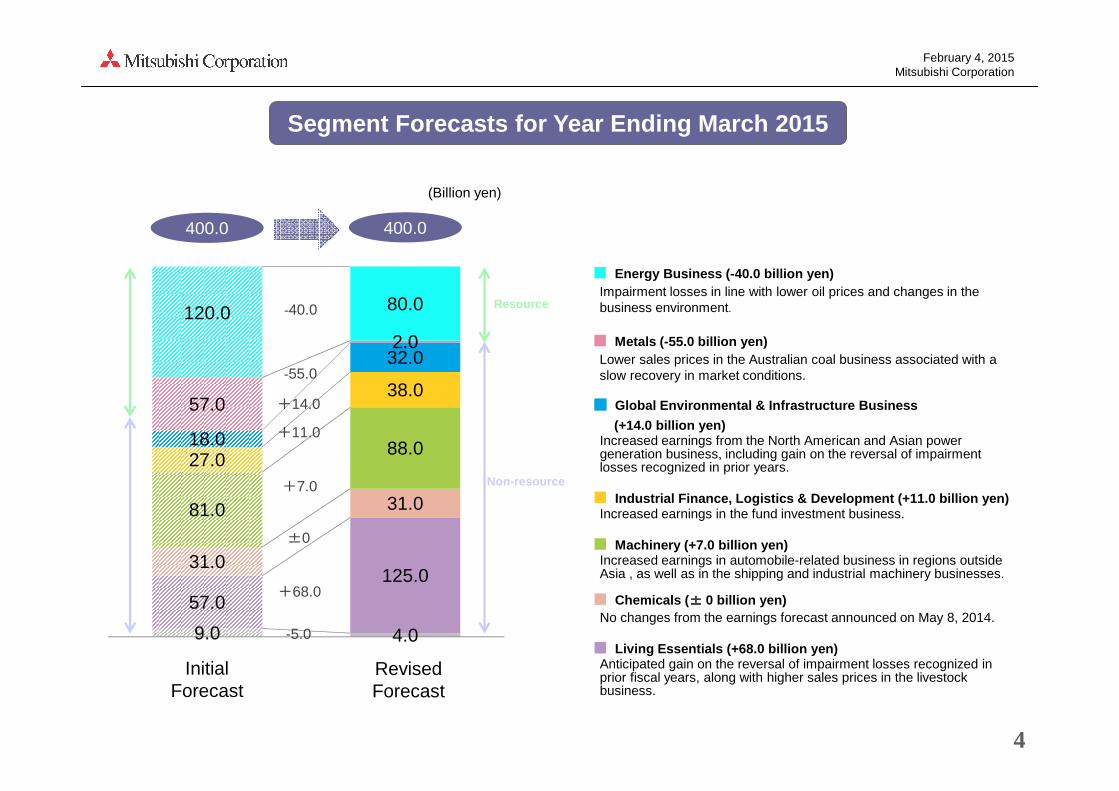
Segment Forecasts for Year Ending March 2015
■ Energy Business (-40.0 billion yen)Impairment losses in line with lower oil prices and changes in the business environment.
■ Metals (-55.0 billion yen)Lower sales prices in the Australian coal business associated with a slow recovery in market conditions.
■■■■ Global Environmental & Infrastructure Business
(+14.0 billion yen)Increased earnings from the North American and Asian power generation business, including gain on the reversal of impairment losses recognized in prior years.
■ Industrial Finance, Logistics & Development (+11.0 billion yen)Increased earnings in the fund investment business.
■ Machinery (+7.0 billion yen)Increased earnings in automobile-related business in regions outside Asia , as well as in the shipping and industrial machinery businesses.
■ Chemicals ( ±±±± 0 billion yen)No changes from the earnings forecast announced on May 8, 2014.
■ Living Essentials (+68.0 billion yen)Anticipated gain on the reversal of impairment losses recognized in prior fiscal years, along with higher sales prices in the livestock business.
-40.0
-55.0
+14.0
+7.0
±0
+68.0
(Billion yen)
+11.0
-5.0
400.0400.0
2014年度業績見通し
(5月8日公表)
2014年度業績見通し
(修正後)
Resource
Non-resource
Initial Forecast
Revised Forecast
February 4, 2015Mitsubishi Corporation
5
(Billion yen)
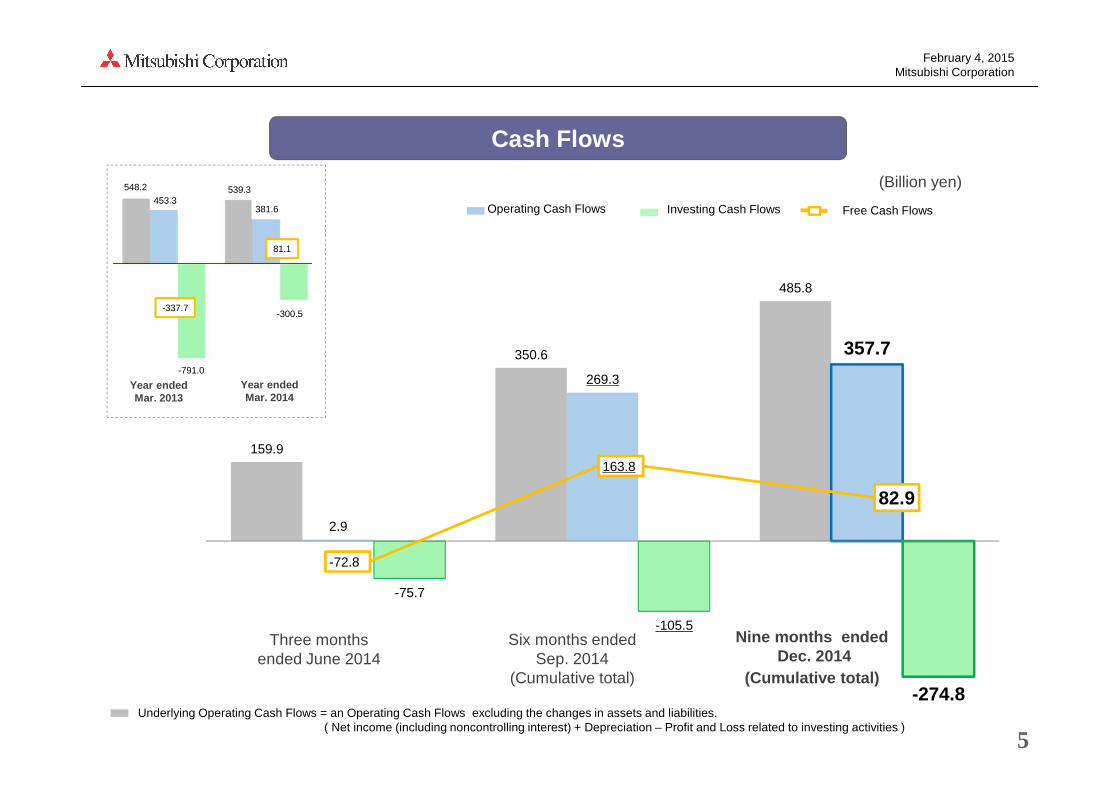
Three months ended June 2014 (Cumulative total)
Six months ended Sep. 2014
(Cumulative total)
Nine months endedDec. 2014
(Cumulative total)
Operating Cash Flows Investing Cash Flows Free Cash Flows
Year ended Mar. 2013
Year ended Mar. 2014
159.9
350.6
485.8
2.9
269.3
357.7
-75.7
-105.5
-274.8Underlying Operating Cash Flows = an Operating Cash Flows excluding the changes in assets and liabilities.
( Net income (including noncontrolling interest) + Depreciation – Profit and Loss related to investing activities )
548.2
453.3539.3
381.6
-791.0
-300.5
Cash Flows
-72.8
163.8
82.9
-337.7
81.1
February 4, 2015Mitsubishi Corporation
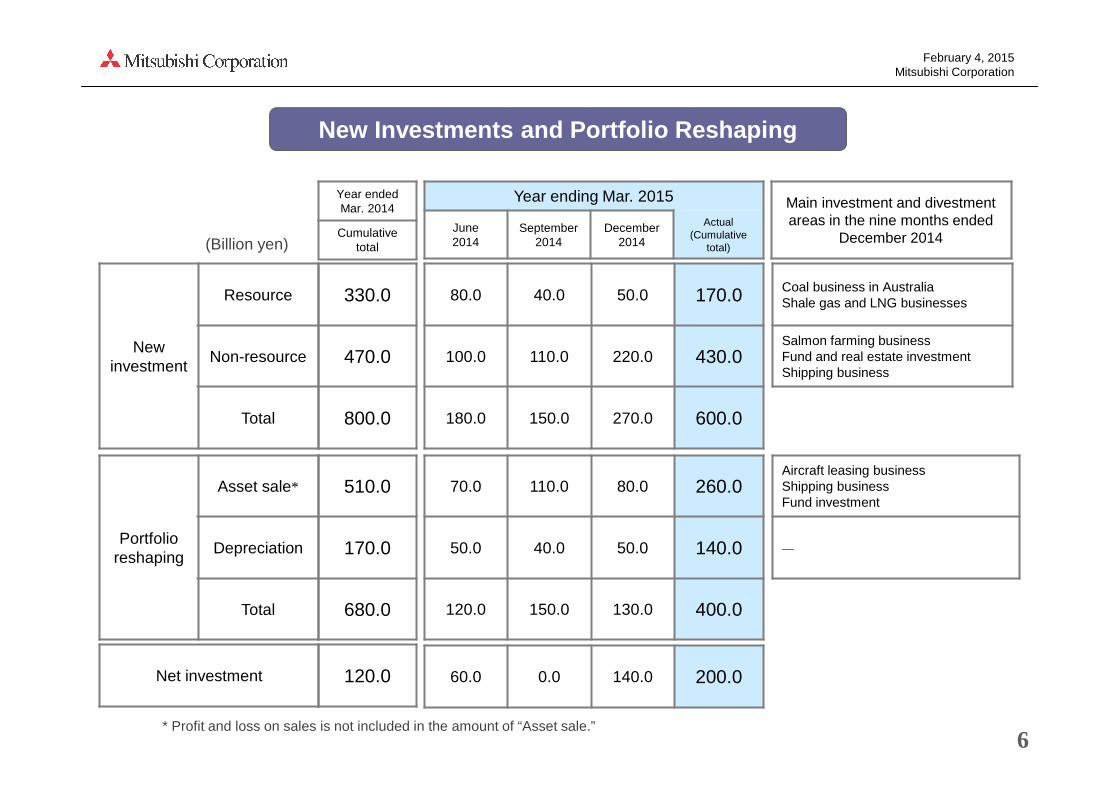
New Investments and Portfolio Reshaping
(Billion yen)
6* Profit and loss on sales is not included in the amount of “Asset sale.”
New investment
Resource
Non-resource
Total
Portfolio reshaping
Asset sale*
Depreciation
Total
Net investment
80.0 40.0 50.0 170.0
100.0 110.0 220.0 430.0
180.0 150.0 270.0 600.0
70.0 110.0 80.0 260.0
50.0 40.0 50.0 140.0
120.0 150.0 130.0 400.0
60.0 0.0 140.0 200.0
Coal business in AustraliaShale gas and LNG businesses
Salmon farming businessFund and real estate investmentShipping business
Aircraft leasing businessShipping businessFund investment
―
Year ending Mar. 2015
June2014
September2014
December2014
Actual (Cumulative
total)
Main investment and divestment areas in the nine months ended
December 2014
330.0
470.0
800.0
510.0
170.0
680.0
120.0
Year ended Mar. 2014
Cumulative total
February 4, 2015Mitsubishi Corporation
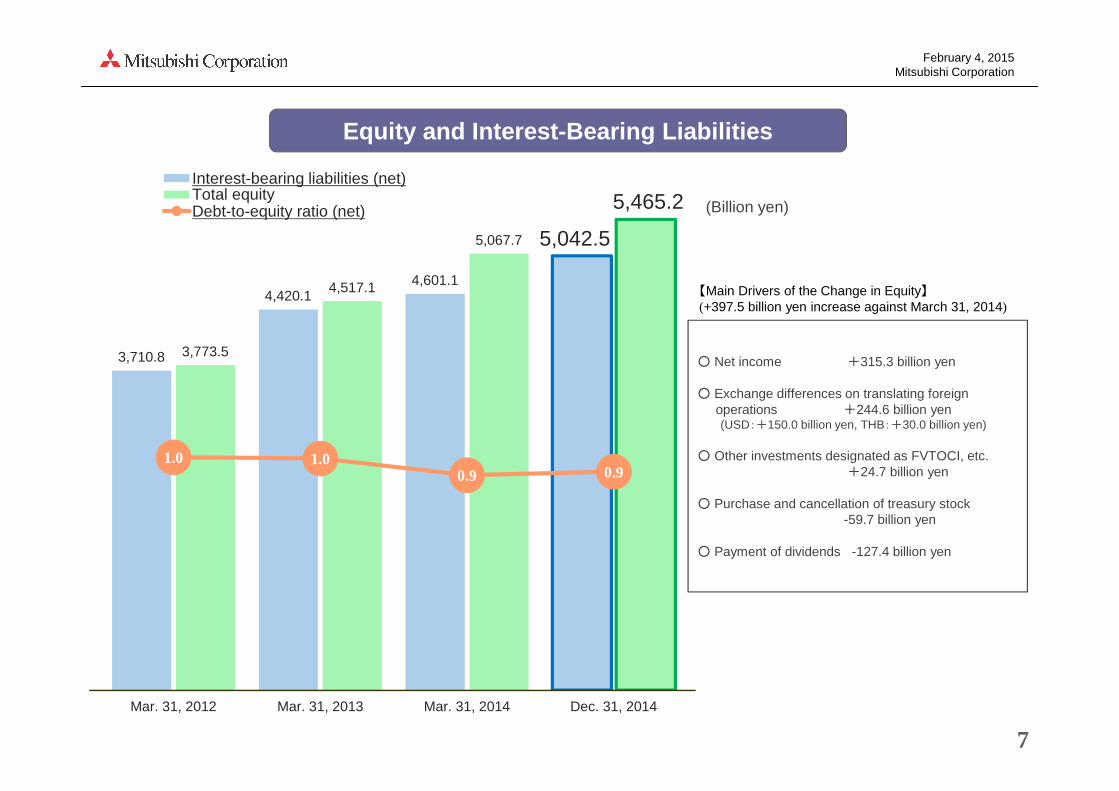
Equity and Interest-Bearing Liabilities
7
3,710.8
4,420.14,601.1
5,042.5
3,773.5
4,517.1
5,067.7
5,465.2
1.0 1.00.9 0.9
0.0
1.0
2.0
0
10,000
20,000
30,000
40,000
50,000
Mar. 31, 2012 Mar. 31, 2013 Mar. 31, 2014 Dec. 31, 2014
Interest-bearing liabilities (net)Total equityDebt-to-equity ratio (net) (Billion yen)
○ Net income +315.3 billion yen
○ Exchange differences on translating foreign operations +244.6 billion yen(USD:+150.0 billion yen, THB:+30.0 billion yen)
○ Other investments designated as FVTOCI, etc.+24.7 billion yen
○ Purchase and cancellation of treasury stock-59.7 billion yen
○ Payment of dividends -127.4 billion yen
【Main Drivers of the Change in Equity】(+397.5 billion yen increase against March 31, 2014)
February 4, 2015Mitsubishi Corporation
8
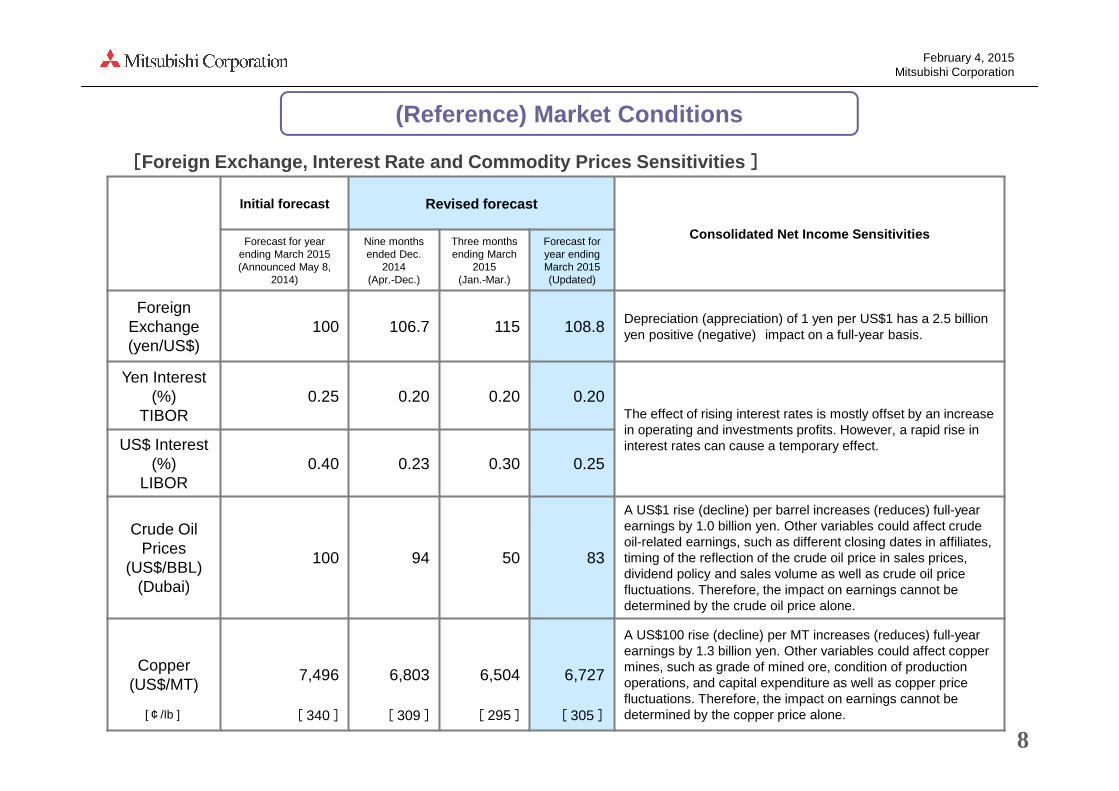
[[[[Foreign Exchange, Interest Rate and Commodity Price s Sensitivities ]]]]
(Reference) Market Conditions
Initial forecast Revised forecast
Consolidated Net Income SensitivitiesForecast for year
ending March 2015 (Announced May 8,
2014)
Nine months ended Dec.
2014 (Apr.-Dec.)
Three months ending March
2015(Jan.-Mar.)
Forecast for year ending March 2015 (Updated)
Foreign Exchange(yen/US$)
100 106.7 115 108.8 Depreciation (appreciation) of 1 yen per US$1 has a 2.5 billion yen positive (negative) impact on a full-year basis.
Yen Interest (%)
TIBOR0.25 0.20 0.20 0.20
The effect of rising interest rates is mostly offset by an increase in operating and investments profits. However, a rapid rise in interest rates can cause a temporary effect.US$ Interest
(%)LIBOR
0.40 0.23 0.30 0.25
Crude Oil Prices
(US$/BBL) (Dubai)
100 94 50 83
A US$1 rise (decline) per barrel increases (reduces) full-year earnings by 1.0 billion yen. Other variables could affect crude oil-related earnings, such as different closing dates in affiliates, timing of the reflection of the crude oil price in sales prices, dividend policy and sales volume as well as crude oil price fluctuations. Therefore, the impact on earnings cannot be determined by the crude oil price alone.
Copper (US$/MT)
7,496 6,803 6,504 6,727
A US$100 rise (decline) per MT increases (reduces) full-year earnings by 1.3 billion yen. Other variables could affect copper mines, such as grade of mined ore, condition of production operations, and capital expenditure as well as copper price fluctuations. Therefore, the impact on earnings cannot be determined by the copper price alone.[¢/lb ] [ 309 ][ 340 ] [ 305 ][ 295 ]
February 4, 2015Mitsubishi Corporation
9
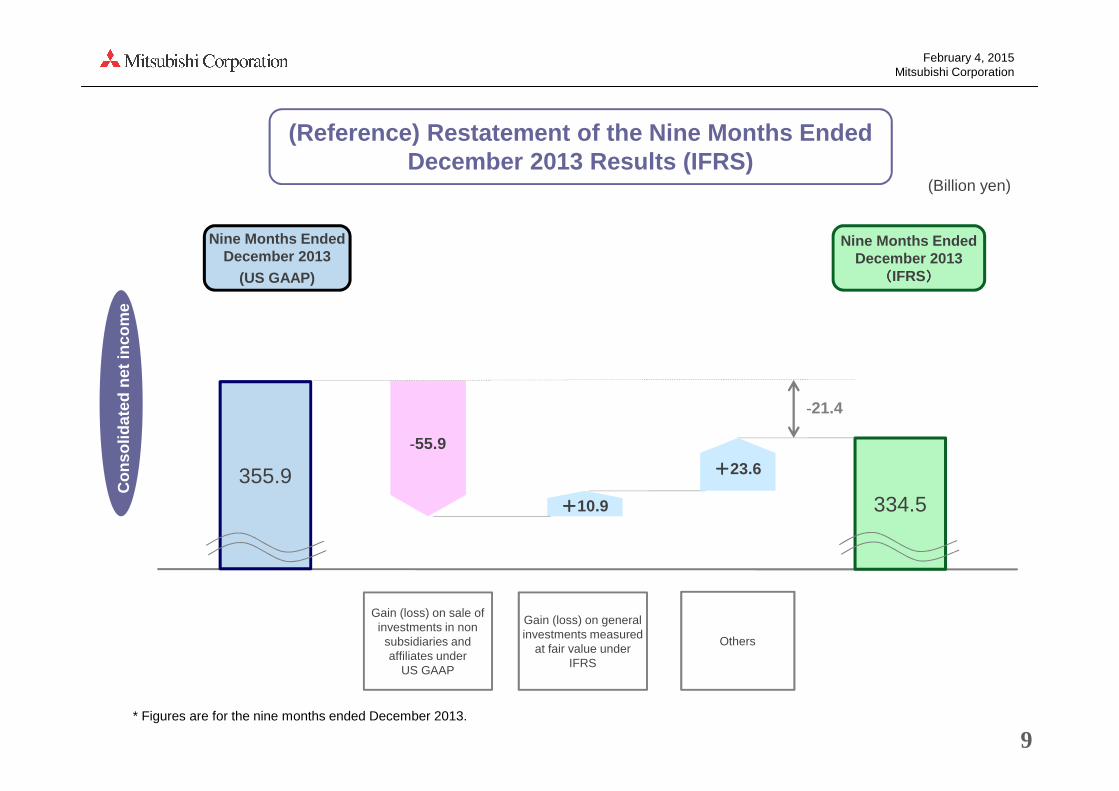
355.9
-55.9
Others
(Billion yen)
(Reference) Restatement of the Nine Months Ended December 2013 Results (IFRS)
334.5++++10.9
Gain (loss) on sale of investments in non
subsidiaries and affiliates under
US GAAP
Gain (loss) on general investments measured
at fair value under IFRS
-21.4
* Figures are for the nine months ended December 2013.
++++23.6
Con
solid
ated
net
inco
me
Nine Months Ended December 2013
(US GAAP)
Nine Months Ended December 2013
((((IFRS))))