Embed Size (px)
Citation preview
E{Z}-KrigingExploring the World of Ordinary Kriging
Dennis J. J. Walvoort
Wageningen University & Research CenterWageningen, The Netherlands
July 2004 (version 0.2)
IntroductionGraphical User Interface
Interesting features to exploreConcluding Remarks
What is it about?Potential Users
What is E{Z}-Kriging?
a computer program for exploring ordinary kriging;
interactive, self-explanatory, and easy to use.Hence, ‘easy kriging’
and last but not least: it’s freeware!
Dennis J. J. Walvoort E{Z}-Kriging
IntroductionGraphical User Interface
Interesting features to exploreConcluding Remarks
What is it about?Potential Users
Who may benefit from it?
1 Students, who need to understand those ‘mysterious’ krigingequations;
2 Lecturers, who want to explain kriging in an intuitive way;
3 Others, who just want to know what they are doing whenusing geostatistical software.
Dennis J. J. Walvoort E{Z}-Kriging
IntroductionGraphical User Interface
Interesting features to exploreConcluding Remarks
Data Configuration PanelSemivariogram PanelKriging Panel
Graphical User Interface (GUI)
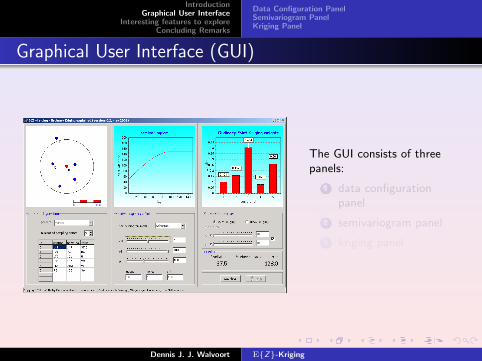
The GUI consists of threepanels:
1 data configurationpanel
2 semivariogram panel
3 kriging panel
Dennis J. J. Walvoort E{Z}-Kriging
IntroductionGraphical User Interface
Interesting features to exploreConcluding Remarks
Data Configuration PanelSemivariogram PanelKriging Panel
Graphical User Interface (GUI)
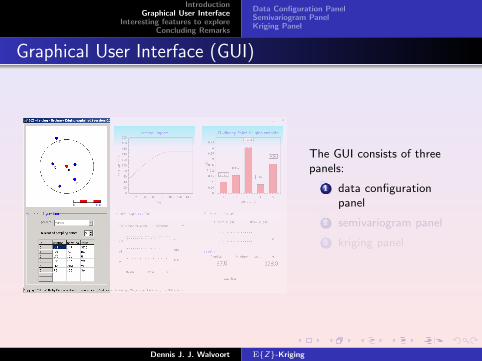
The GUI consists of threepanels:
1 data configurationpanel
2 semivariogram panel
3 kriging panel
Dennis J. J. Walvoort E{Z}-Kriging
IntroductionGraphical User Interface
Interesting features to exploreConcluding Remarks
Data Configuration PanelSemivariogram PanelKriging Panel
Graphical User Interface (GUI)
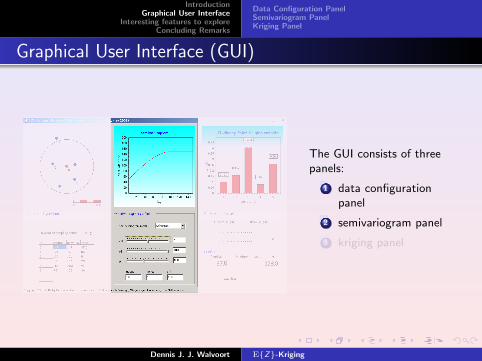
The GUI consists of threepanels:
1 data configurationpanel
2 semivariogram panel
3 kriging panel
Dennis J. J. Walvoort E{Z}-Kriging
IntroductionGraphical User Interface
Interesting features to exploreConcluding Remarks
Data Configuration PanelSemivariogram PanelKriging Panel
Graphical User Interface (GUI)
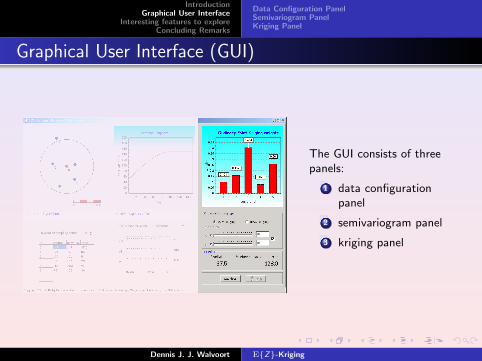
The GUI consists of threepanels:
1 data configurationpanel
2 semivariogram panel
3 kriging panel
Dennis J. J. Walvoort E{Z}-Kriging
IntroductionGraphical User Interface
Interesting features to exploreConcluding Remarks
Data Configuration PanelSemivariogram PanelKriging Panel
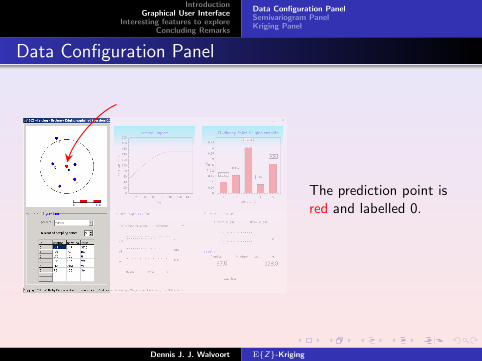
Data Configuration Panel
The prediction point isred and labelled 0.
Dennis J. J. Walvoort E{Z}-Kriging
IntroductionGraphical User Interface
Interesting features to exploreConcluding Remarks
Data Configuration PanelSemivariogram PanelKriging Panel
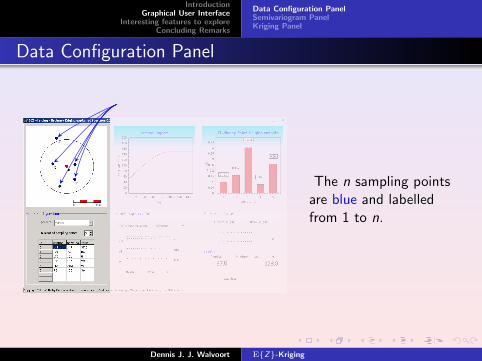
Data Configuration Panel
The n sampling pointsare blue and labelledfrom 1 to n.
Dennis J. J. Walvoort E{Z}-Kriging

IntroductionGraphical User Interface
Interesting features to exploreConcluding Remarks
Data Configuration PanelSemivariogram PanelKriging Panel
Data Configuration Panel
The configuration ofpoints can be changedby means of the mouse(drag ’n’ drop).
Dennis J. J. Walvoort E{Z}-Kriging
IntroductionGraphical User Interface
Interesting features to exploreConcluding Remarks
Data Configuration PanelSemivariogram PanelKriging Panel
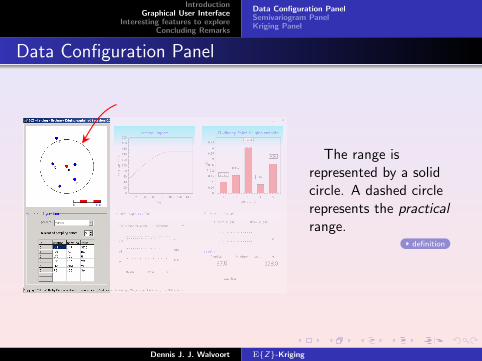
Data Configuration Panel
The range isrepresented by a solidcircle. A dashed circlerepresents the practicalrange.
definition
Dennis J. J. Walvoort E{Z}-Kriging
IntroductionGraphical User Interface
Interesting features to exploreConcluding Remarks
Data Configuration PanelSemivariogram PanelKriging Panel
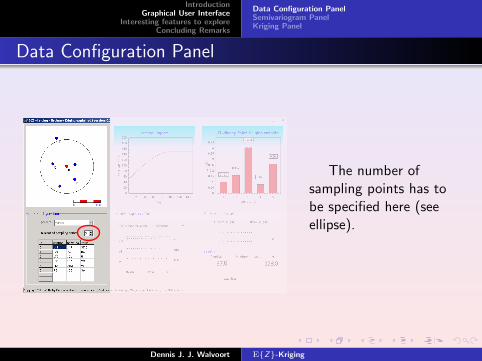
Data Configuration Panel
The number ofsampling points has tobe specified here (seeellipse).
Dennis J. J. Walvoort E{Z}-Kriging
IntroductionGraphical User Interface
Interesting features to exploreConcluding Remarks
Data Configuration PanelSemivariogram PanelKriging Panel
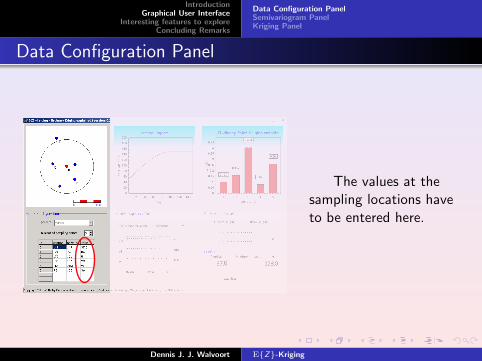
Data Configuration Panel
The values at thesampling locations haveto be entered here.
Dennis J. J. Walvoort E{Z}-Kriging
IntroductionGraphical User Interface
Interesting features to exploreConcluding Remarks
Data Configuration PanelSemivariogram PanelKriging Panel
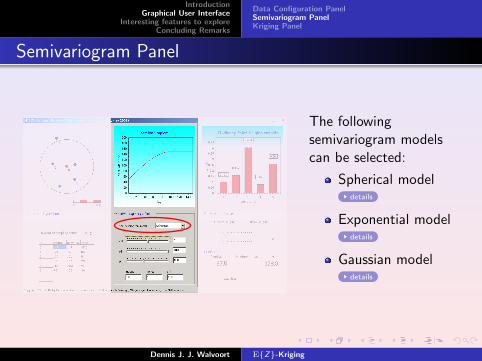
Semivariogram Panel
The followingsemivariogram modelscan be selected:
Spherical modeldetails
Exponential modeldetails
Gaussian modeldetails
Dennis J. J. Walvoort E{Z}-Kriging
IntroductionGraphical User Interface
Interesting features to exploreConcluding Remarks
Data Configuration PanelSemivariogram PanelKriging Panel
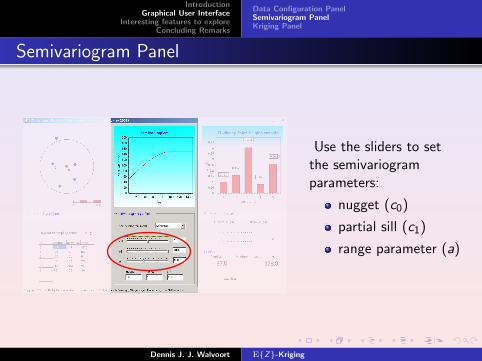
Semivariogram Panel
Use the sliders to setthe semivariogramparameters:
nugget (c0)
partial sill (c1)
range parameter (a)
Dennis J. J. Walvoort E{Z}-Kriging
IntroductionGraphical User Interface
Interesting features to exploreConcluding Remarks
Data Configuration PanelSemivariogram PanelKriging Panel
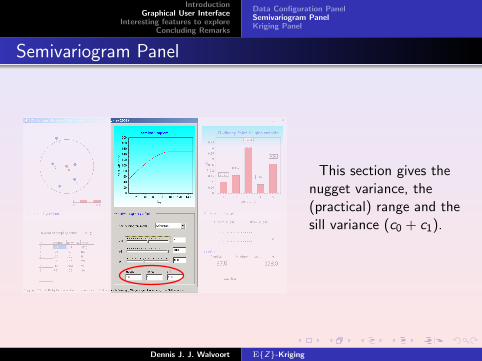
Semivariogram Panel
This section gives thenugget variance, the(practical) range and thesill variance (c0 + c1).
Dennis J. J. Walvoort E{Z}-Kriging
IntroductionGraphical User Interface
Interesting features to exploreConcluding Remarks
Data Configuration PanelSemivariogram PanelKriging Panel
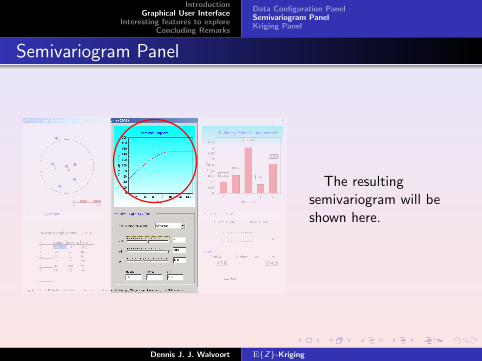
Semivariogram Panel
The resultingsemivariogram will beshown here.
Dennis J. J. Walvoort E{Z}-Kriging

IntroductionGraphical User Interface
Interesting features to exploreConcluding Remarks
Data Configuration PanelSemivariogram PanelKriging Panel
Kriging Panel
The ordinary krigingweights are shown asbars. Click on the barsfor numerical values.
Dennis J. J. Walvoort E{Z}-Kriging
IntroductionGraphical User Interface
Interesting features to exploreConcluding Remarks
Data Configuration PanelSemivariogram PanelKriging Panel
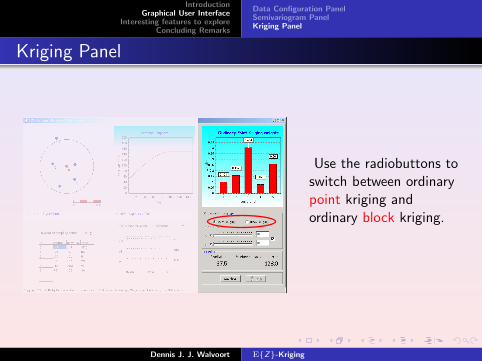
Kriging Panel
Use the radiobuttons toswitch between ordinarypoint kriging andordinary block kriging.
Dennis J. J. Walvoort E{Z}-Kriging
IntroductionGraphical User Interface
Interesting features to exploreConcluding Remarks
Data Configuration PanelSemivariogram PanelKriging Panel
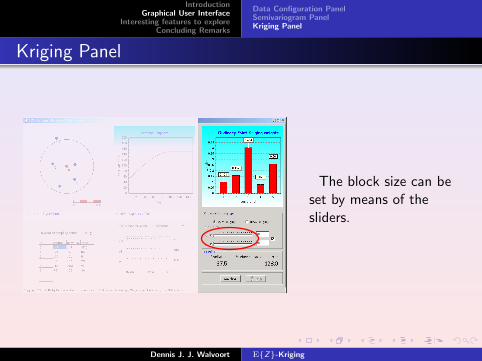
Kriging Panel
The block size can beset by means of thesliders.
Dennis J. J. Walvoort E{Z}-Kriging
IntroductionGraphical User Interface
Interesting features to exploreConcluding Remarks
Data Configuration PanelSemivariogram PanelKriging Panel
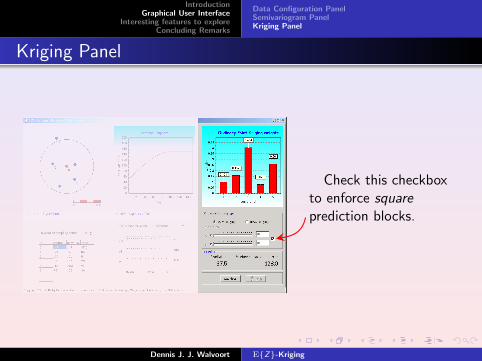
Kriging Panel
Check this checkboxto enforce squareprediction blocks.
Dennis J. J. Walvoort E{Z}-Kriging
IntroductionGraphical User Interface
Interesting features to exploreConcluding Remarks
Data Configuration PanelSemivariogram PanelKriging Panel
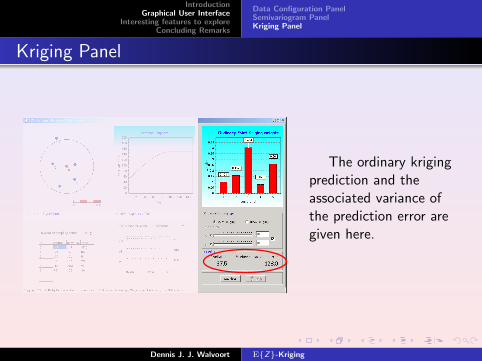
Kriging Panel
The ordinary krigingprediction and theassociated variance ofthe prediction error aregiven here.
Dennis J. J. Walvoort E{Z}-Kriging
IntroductionGraphical User Interface
Interesting features to exploreConcluding Remarks
Data Configuration PanelSemivariogram PanelKriging Panel
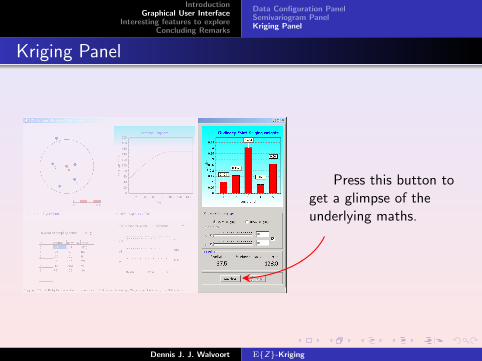
Kriging Panel
Press this button toget a glimpse of theunderlying maths.
Dennis J. J. Walvoort E{Z}-Kriging
IntroductionGraphical User Interface
Interesting features to exploreConcluding Remarks
Effects of sampling point configurationEffect of semivariogramEffect of aggregation
Interesting features to explore
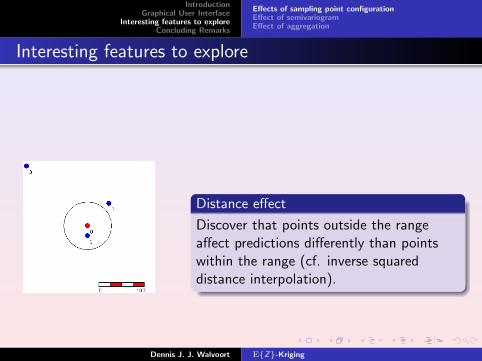
Distance effect
Discover that points outside the rangeaffect predictions differently than pointswithin the range (cf. inverse squareddistance interpolation).
Dennis J. J. Walvoort E{Z}-Kriging
IntroductionGraphical User Interface
Interesting features to exploreConcluding Remarks
Effects of sampling point configurationEffect of semivariogramEffect of aggregation
Interesting features to explore
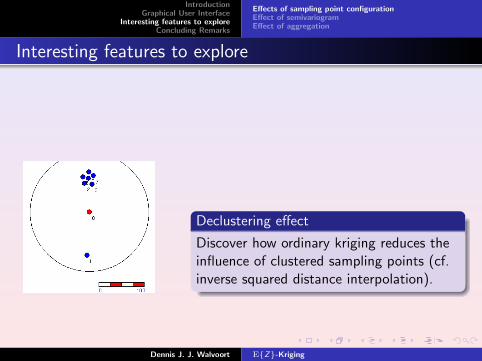
Declustering effect
Discover how ordinary kriging reduces theinfluence of clustered sampling points (cf.inverse squared distance interpolation).
Dennis J. J. Walvoort E{Z}-Kriging
IntroductionGraphical User Interface
Interesting features to exploreConcluding Remarks
Effects of sampling point configurationEffect of semivariogramEffect of aggregation
Interesting features to explore
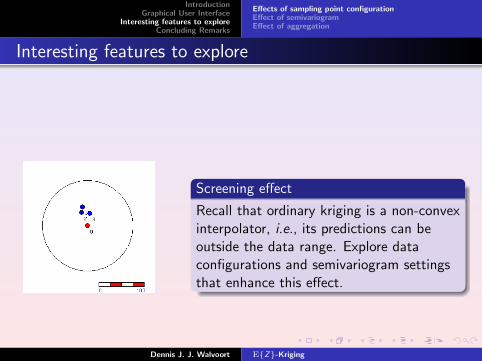
Screening effect
Recall that ordinary kriging is a non-convexinterpolator, i.e., its predictions can beoutside the data range. Explore dataconfigurations and semivariogram settingsthat enhance this effect.
Dennis J. J. Walvoort E{Z}-Kriging
IntroductionGraphical User Interface
Interesting features to exploreConcluding Remarks
Effects of sampling point configurationEffect of semivariogramEffect of aggregation
Interesting features to explore
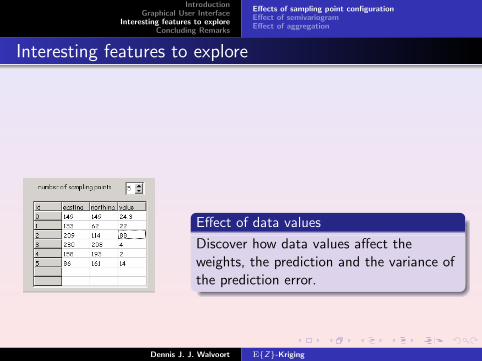
Effect of data values
Discover how data values affect theweights, the prediction and the variance ofthe prediction error.
Dennis J. J. Walvoort E{Z}-Kriging

IntroductionGraphical User Interface
Interesting features to exploreConcluding Remarks
Effects of sampling point configurationEffect of semivariogramEffect of aggregation
Interesting features to explore
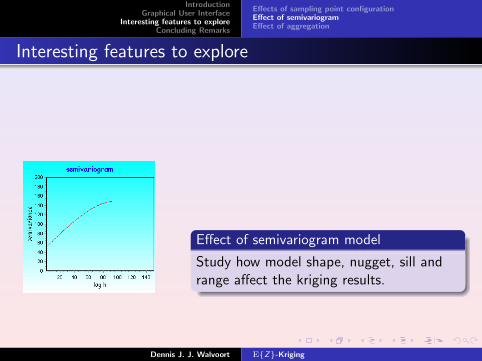
Effect of semivariogram model
Study how model shape, nugget, sill andrange affect the kriging results.
Dennis J. J. Walvoort E{Z}-Kriging

IntroductionGraphical User Interface
Interesting features to exploreConcluding Remarks
Effects of sampling point configurationEffect of semivariogramEffect of aggregation
Interesting features to explore
Effect of semivariogram model
Study how model shape, nugget, sill andrange affect the kriging results.
Dennis J. J. Walvoort E{Z}-Kriging

IntroductionGraphical User Interface
Interesting features to exploreConcluding Remarks
Effects of sampling point configurationEffect of semivariogramEffect of aggregation
Interesting features to explore
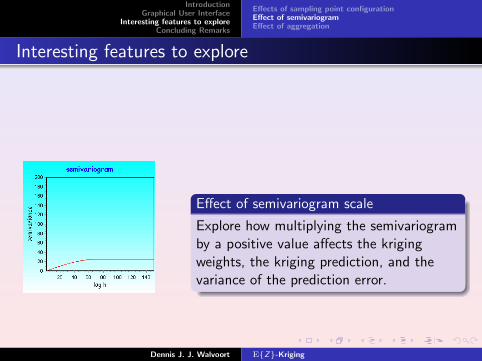
Effect of semivariogram scale
Explore how multiplying the semivariogramby a positive value affects the krigingweights, the kriging prediction, and thevariance of the prediction error.
Dennis J. J. Walvoort E{Z}-Kriging

IntroductionGraphical User Interface
Interesting features to exploreConcluding Remarks
Effects of sampling point configurationEffect of semivariogramEffect of aggregation
Interesting features to explore
Effect of semivariogram scale
Explore how multiplying the semivariogramby a positive value affects the krigingweights, the kriging prediction, and thevariance of the prediction error.
Dennis J. J. Walvoort E{Z}-Kriging
IntroductionGraphical User Interface
Interesting features to exploreConcluding Remarks
Effects of sampling point configurationEffect of semivariogramEffect of aggregation
Interesting features to explore
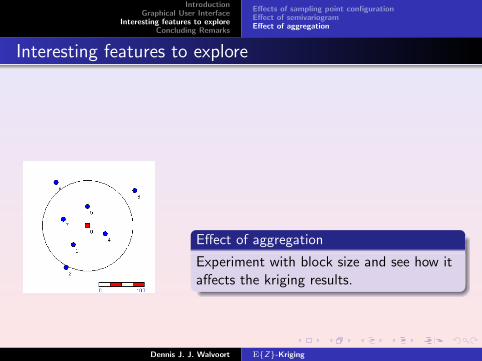
Effect of aggregation
Experiment with block size and see how itaffects the kriging results.
Dennis J. J. Walvoort E{Z}-Kriging
IntroductionGraphical User Interface
Interesting features to exploreConcluding Remarks
Effects of sampling point configurationEffect of semivariogramEffect of aggregation
Interesting features to explore
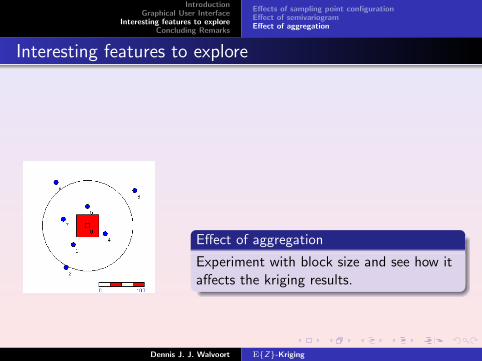
Effect of aggregation
Experiment with block size and see how itaffects the kriging results.
Dennis J. J. Walvoort E{Z}-Kriging
IntroductionGraphical User Interface
Interesting features to exploreConcluding Remarks
Effects of sampling point configurationEffect of semivariogramEffect of aggregation
Interesting features to explore
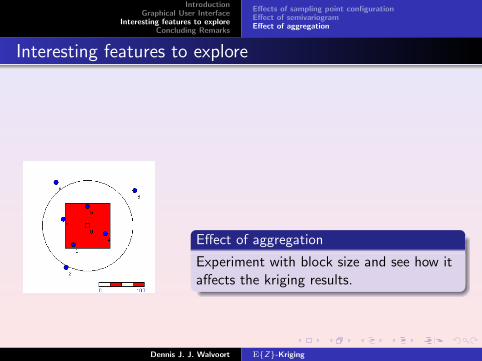
Effect of aggregation
Experiment with block size and see how itaffects the kriging results.
Dennis J. J. Walvoort E{Z}-Kriging
IntroductionGraphical User Interface
Interesting features to exploreConcluding Remarks
Effects of sampling point configurationEffect of semivariogramEffect of aggregation
Interesting features to explore
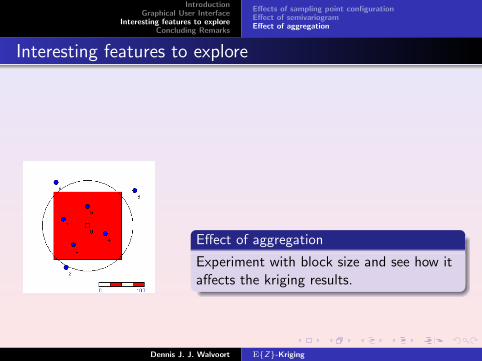
Effect of aggregation
Experiment with block size and see how itaffects the kriging results.
Dennis J. J. Walvoort E{Z}-Kriging

IntroductionGraphical User Interface
Interesting features to exploreConcluding Remarks
Effects of sampling point configurationEffect of semivariogramEffect of aggregation
Interesting features to explore
Effect of aggregation
Experiment with block size and see how itaffects the kriging results.
Dennis J. J. Walvoort E{Z}-Kriging
IntroductionGraphical User Interface
Interesting features to exploreConcluding Remarks
Further readingGeostatistical softwareLicense
Suggestions for further reading
E.H. Isaaks and R.M. Srivastava.An Introduction to Applied Geostatistics.Oxford University Press, New York, 1989.
P. Goovaerts.Geostatistics for Natural Resources Evaluation.Oxford University Press, New York, 1997.
Dennis J. J. Walvoort E{Z}-Kriging
IntroductionGraphical User Interface
Interesting features to exploreConcluding Remarks
Further readingGeostatistical softwareLicense
Geostatistical software
Vesper (www.usyd.edu.au/su/agric/acpa/vesper/vesper.html)
GStat (www.gstat.org),GStat is also available as R-package (www.r-project.org)
Dennis J. J. Walvoort E{Z}-Kriging
IntroductionGraphical User Interface
Interesting features to exploreConcluding Remarks
Further readingGeostatistical softwareLicense
License
E{Z}-Kriging is freeware and provided as is without warranty ofany kind, either express or implied.
Dennis J. J. Walvoort E{Z}-Kriging
IntroductionGraphical User Interface
Interesting features to exploreConcluding Remarks
Further readingGeostatistical softwareLicense
Enjoy E{Z}-Kriging!
Dennis J. J. Walvoort E{Z}-Kriging
Definitions
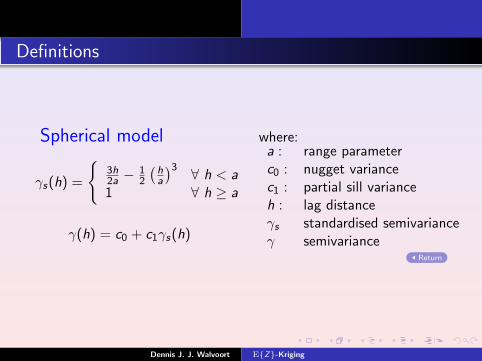
Spherical model
γs(h) =
{3h2a −
12
(ha
)3 ∀ h < a1 ∀ h ≥ a
γ(h) = c0 + c1γs(h)
where:a : range parameterc0 : nugget variancec1 : partial sill varianceh : lag distanceγs standardised semivarianceγ semivariance
Return
Dennis J. J. Walvoort E{Z}-Kriging
Definitions
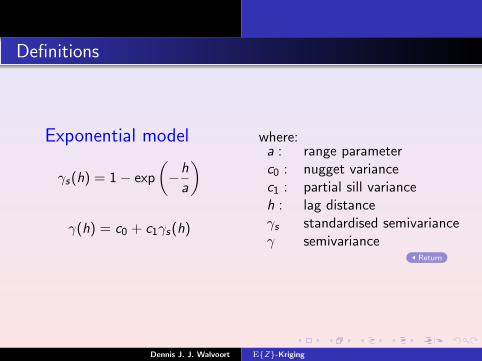
Exponential model
γs(h) = 1− exp
(−h
a
)
γ(h) = c0 + c1γs(h)
where:a : range parameterc0 : nugget variancec1 : partial sill varianceh : lag distanceγs standardised semivarianceγ semivariance
Return
Dennis J. J. Walvoort E{Z}-Kriging
Definitions
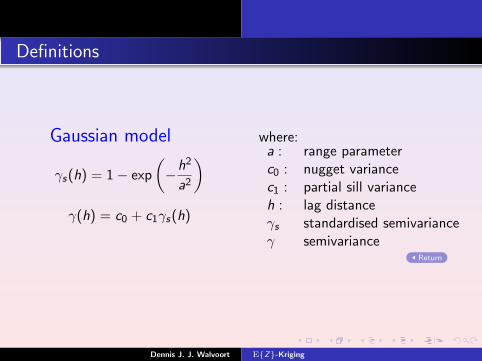
Gaussian model
γs(h) = 1− exp
(−h2
a2
)γ(h) = c0 + c1γs(h)
where:a : range parameterc0 : nugget variancec1 : partial sill varianceh : lag distanceγs standardised semivarianceγ semivariance
Return
Dennis J. J. Walvoort E{Z}-Kriging
Definitions
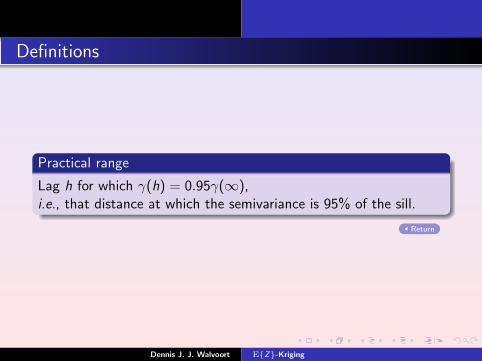
Practical range
Lag h for which γ(h) = 0.95γ(∞),i.e., that distance at which the semivariance is 95% of the sill.
Return
Dennis J. J. Walvoort E{Z}-Kriging