Embed Size (px)
Citation preview
Iran. J. Chem. Chem. Eng. Vol. 36, No. 1, 2017
45
Evaluation of Spent Catalyst Structure Changes during
Ethylbenzene Dehydrogenation in Different Technologies
Haghlesan, Amir Naser; Alizadeh, Reza*+; Fatehifar, Esmail
Faculty of Chemical Engineering, Sahand University of Technology, PO Box 51335/1996, Tabriz, I.R. IRAN
ABSTRACT: Ethylbenzene (EB) dehydrogenation to styrene (SM) on an industrial scale
is generally performed using classic and SMART (Styrene Monomer Advanced Reheat Technology)
technologies. In the current study, spent catalysts structural changes through classic and SMART
technologies were investigated and compared with the fresh catalyst. For this purpose, XRF, XRD,
SEM-EDX, FT-IR, BET and crushing strength analysis were employed. It was found that styrene
production via SMART technology with 40% potassium loss is led to more catalyst deactivation
than the classic ones (26%). Due to pore mouth blocking by coke formation, the average pore
radius in both classic and SMART spent catalysts is reduced about 33% and 53% compared
to the fresh ones, respectively. SEM analysis showed that potassium migration mechanism is related to
the temperature gradient in the classic spent catalysts and chemical vapour transportation
in the SMART spent catalysts. Comparative evaluation of the catalysts performance indicated that
the SMART spent catalyst with about 72% activity loss is more deactivated than the classic ones (61%).
The large drop of styrene yield (72-74%) of SMART spent catalyst revealed that the activity is more
depending on the pore mouth size, rather than the specific surface area. However, in situ steam
injection redistributed migrated potassium and increased the selectivity of the classic spent catalyst,
but it was led to more potassium migration and catalyst deactivation in the SMART spent ones.
According to this study, styrene production and industrial unit design based on SMART technology
not recommended strongly.
KEYWORDS: Catalyst deactivation; Ethylbenzene dehydrogenation; SMART technology; Styrene.
INTRODUCTION
Styrene is one of the most important unsaturated aromatic
monomers used in industry to produce polymers, copolymers,
tripolymers, etc [1, 2]. The industrial production of styrene
was estimated about 25 million tons in 2002, with
a significant increase in production expected in the future [3].
About 90% of global styrene industrial production units
are using ethylbenzene dehydrogenation technologies.
This reaction is endothermic, catalyst relevant and
can be completed adiabatically in the gas phase [4].
Ethylbenzene vapors convert to styrene as a result of
dehydrogenation along with benzene (BZ) and toluene (TOL),
as by-products, in line with the following equations [5].
* To whom correspondence should be addressed.
+ E-mail: [email protected]
Other address of authors: Environmental Engineering Research Center (EERC), Sahand University of Technology,
P.O. Box 51335-1996 Tabriz, I.R. IRAN
1021-9986/2017/1/45 13/$/6.30
Iran. J. Chem. Chem. Eng. Haghlesan A.N. et. al. Vol. 36, No. 1, 2017
46
Cat.6 5 2 5 6 5 2 3 2
EB SM
C H C H C H C H H (1)
H 124.9kJ / mol
6 5 2 5 6 6 2 4EB BZ
C H C H C H C H (2)
H 106.5kJ / mol
6 5 2 5 2 6 5 3 4EB TOL
C H C H H C H CH CH (3)
H 57.1kJ / mol
Ethylbenzene and steam are mixed in the reactors
inlet and ethylbenzene dehydrogenation takes place
at a temperature range of 580 to 640 °C with a steam to oil
(Ethylbenzene) ratio of 1.3 (wt./wt.). In literature,
different roles have been presented for steam such as:
supply heat of reaction, increase ethylbenzene conversion,
removal of coke from catalyst surface and inhibitor of
catalyst deactivation due to Fe2O3 reduction [5].
In the conventional dehydrogenation process which
is known as classic technology, a heat exchanger has been
used between reactors for increasing first reactor outlets
temperature for performing dehydrogenation reaction
in the second reactor. While, in SMART technology
temperature enhancement is carried out by combustion of
hydrogen, which produced in the first reactor, by oxygen
instead of the heat exchanger.
Industrial ethylbenzene dehydrogenation catalysts
are composed of iron oxide (Fe2O3) with potassium promoter
(10wt.%) and along with molybdenum, cerium, vanadium
or tungsten to enhance the selectivity and lifetime of
the catalysts [6]. Also, many attempts at using new processes
or replacing the different catalysts in the dehydrogenation
of ethylbenzene have been successful [7- 9]. According
to studies, potassium has a remarkable effect on the
enhancement of iron oxide catalyst activity. Besides,
alkali doping increases the catalyst efficiency due to
gasification of coke and carbonaceous deposits [10].
According to Mross's findings [11], potassium addition
(>3wt.%) to iron oxide prevents catalyst shrinkage and
density reduction and increases the porosity of the catalyst [11].
Deactivation of ethylbenzene dehydrogenation
catalyst in the classic technology, has been attributed
to potassium migration to the canter of the catalyst pellet
duo to the temperature gradient resulting from the
endothermic nature of reaction [12]. Furthermore,
catalyst deactivation due to potassium migration
was studied by Matsui et al. [13] in a differential reactor
at constant temperatures. Moreover, the effect of CO2
on the activity decay of dehydrogenation catalyst
has been considered by Matsui et al. [14]. They indicated
that CO2 presence in the feed (0.1-0.5 mol%) results
in a minor loss in styrene production despite reduction
in catalyst deactivation rate
Serafin et al. [15] proposed that 0.25-5wt.% Cr
addition to catalyst could induce stability of potassium
ferrite (K2Fe22O34) active phase along with enhancement
in activation energies of potassium desorption. According to
Bieniasz et al. [16], catalyst deactivation delay in the
presence of Cr is as a result of work function increase and
limitations of potassium diffusion from the bulk towards
the surface.
Deactivation of ethylbenzene dehydrogenation
catalyst over time can occur due to the formation of coke
and carbonaceous deposits, potassium migration, Fe3+
reduction (Fe2O3 reduction to Fe3O4) and physical
degradation [17, 18]. This process leads to the
replacement of the catalyst after nearly two years which
is a critical problem from both operational and economic
aspects. Despite having interaction between factors that
affect deactivation, in ethylbenzene dehydrogenation
modeling studies, either the factors have been surveyed
independently or their influence has generally been
ignored [19-21]. Deactivation of ethylbenzene
dehydrogenation catalyst in classic technology has been
studied by Baghalha & Ebrahimpour [22] and Shiji et al. [23].
They compared structure and performance changes
in fresh and classic spent catalyst via XRD, SEM, XRF,
etc., methods. But there is no comparison between
the different styrene production technologies.
The objective of this work was to compare
deactivation of ethylbenzene dehydrogenation industrial
catalyst via classic and SMART technology for the first
time. We expect that the results reported here will lead to
choosing the best technology of styrene production and
industrial unit designers.
EXPERIMENTAL SECTION
Materials
For conducting catalysts activity tests in pilot scale,
commercial ethylbenzene from benzene alkylation unit
and demineralized water was used for styrene and production,
Iran. J. Chem. Chem. Eng. Evaluation of Spent Catalyst Structure Changes ... Vol. 36, No. 1, 2017
47
Table 1: Oxygen injection rate in the SMART reactor.
Deviation (%) Design (kg/h) Actual (kg/h) EB Feed(m3/h)
6.86 684.26 731.20 18
7.39 722.28 775.65 19
7.57 760.29 817.84 20
8.22 798.31 863.93 21
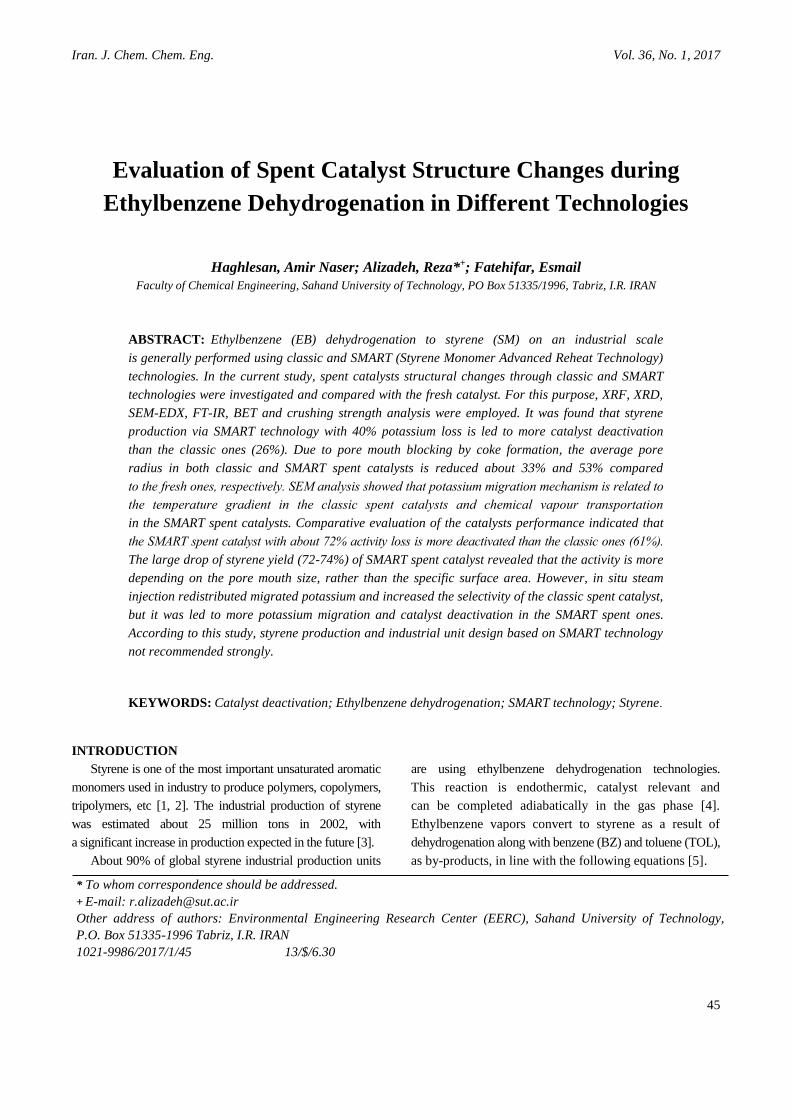
Fig. 1: Schematic of styrene monomer reactors.
respectively. Both of classic and SMART spent catalysts
were downloaded from the industrial reactors which
had been used for about 36 months under the temperature
range of 580 to 640°C, LHSV= 1 hr-1 and steam to oil
ratio = 1.3 (wt./wt.) condition. The fresh and spent
catalysts with a diameter about 3 mm and length of 4-6
mm, are BASF (S6-32) type and mainly contained
of Fe2O3 and Fe3O4, respectively. A schematic
representation of the ethylbenzene dehydrogenation
reactors is depicted in Fig. 1.
As can be seen in Fig. 1, the SMART reactor catalysts
have been run in the presence of oxygen in spite of the
classic reactor catalysts. But the designed rate of oxygen
injection is not sufficient for increasing the temperature
of the first reactor for dehydrogenation reaction to occur.
Subsequently, a high rate of oxygen injection is necessary
to control the SMART reactor temperature (Table 1).
It seems that the extra oxygen injection affects the
SMART spent catalyst structure changes and deactivation
mechanism.The feed to this unit is azeotrope mixture of
steam, fresh ethylbenzene and recycled unreacted
ethylbenzene from third reactor, which is introduced
to the first reactor. Afterward, the outlet of the first
reactor is mixed with superheated steam, into which the
oxygen is injected from oxygen package, and is directed
to the second reactor.
Analysis and catalyst characterization
The crystalline phase of catalysts was characterized
by x-ray diffractometer (XRD-Siemens D5000) with
a Cu. Kα (λ=0.154056 nm) monochromatic radiation at
a voltage of 40 kV and a current of 30 mA. Diffraction
patterns were obtained in the 2θ range of 20-80°
at a scanning rate of 1.2°/min. The average crystalline
size was determined by the Scherrer equation as follows:
0.9D
BCos
(4)
Where D is the mean crystallite size, B is the half width
at the maximum height (FWHM) of Fe2O3, Fe3O4,
K2Fe22O34 and CeO2 phases, λ is the wavelength (nm),
and θ is the diffraction angle in correspondence to the
main diffraction peak. Determination of elements
contents was obtained by the X-Ray Florescence (XRF)
Iran. J. Chem. Chem. Eng. Haghlesan A.N. et. al. Vol. 36, No. 1, 2017
48
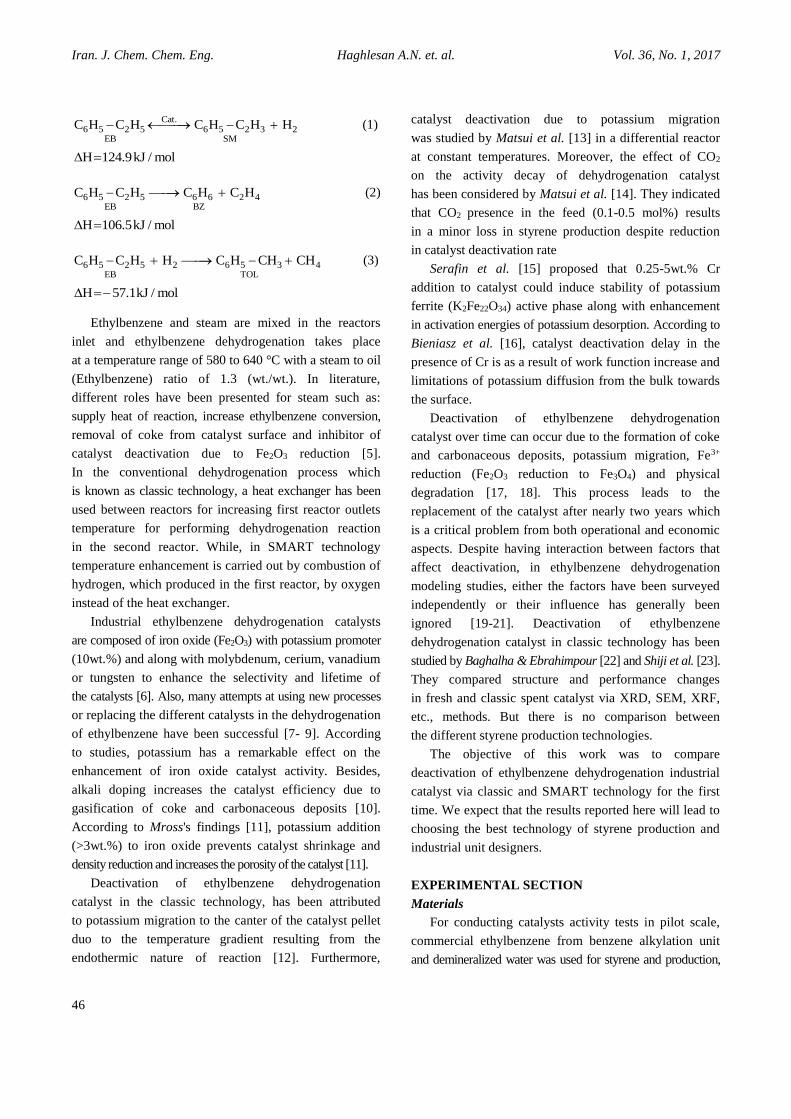
Fig. 2: Experimental setup used for catalyst activity tests.
spectroscopy (Philips MagiX PRO model PW 2540).
However, the wet chemical analysis was also used
through spectrophotography (Shimadzu UV-3100 S) to
verify Fe and potassium contents which were obtained by
XRF analysis. Identification of chemical structure and
particle size was performed by FT-IR (Unican 4000) and
scanning electron microscope (SEM-Tescan Mira3FE SEM),
respectively. Potassium line scans were analysed with the
CAM SCAN MV 2300 Energy Dispersive X-ray (EDX)
spectroscope for all of the catalysts. Moreover,
measurement of the surface area and pore size
distribution was done by BET methods (Quantachrome
NOVA 2000). Besides, grain crushing strength tests was
performed by the ASTM 4179 methods
. Catalyst performance analysis
A laboratory scale fixed-bed reactor (stainless steel -
10 cm length and 1.5 cm I.D.) which was placed inside
an electrical furnace was used for determining catalyst
activity. The temperature of the pre-heater and furnace
was kept constant through a Proportional Integral
Derivative (PID) controller. Also water and ethylbenzene
injection were carried out by a programmable two
channel syringe pump. The reactor effluent was further
cooled in the products condenser and separated to the
liquid phase and non -condensable gases (off gases)
according to Fig. 2. The catalytic activity was evaluated
in the temperature ranges of 580 to 640°C under
atmospheric pressure. The ratio of reactant to inert flow rates
were adjusted to obtain (EB + H2O)/(EB + H2O + N2) = 0.5
(vol./vol. in the gas phase), LHSV = 1 hr-1 and steam to
oil = 1.3 (wt./wt.).
The reactor feed and liquid products were analysed
with a Chrompack CP 9001 gas chromatograph equipped
with fused silica capillary column (CP-Wax 52 CB 25m,
0.32 mm, 1.2m) and the FID detector. The gaseous
effluents (N2, O2, CH4, C2H4, C2H6, CO, CO2) were
determined with the CP-Molsieve 5A 25m, 0.53mm,
50µm column and the TCD detector, however, the CP-
PoraPLOT Q 50m, 0.53mm, 20µm column and the FID
detector were used for ethylbenzene, styrene, benzene,
and toluene identification.
In this work, conversion of ethylbenzene, selectivity
of the main liquid products and yields of styrene
were calculated according to the following formulas:
EB(in) EB(out)
EBEB(in)
F FX (%) 100
F
(5)
EB Ethylbenzene
Iran. J. Chem. Chem. Eng. Evaluation of Spent Catalyst Structure Changes ... Vol. 36, No. 1, 2017
49
Table 2: Chemical composition of catalyst by XRF spectroscopy.
Component Fresh Spent classic Spent SMART
Fe2O3*/ Fe3O4* 80.04 ± 0.05 73.97 ± 0.05 74.13 ± 0.05
FeO* 0.00 ± 0.05 8.21 ± 0.05 9.32 ± 0.05
CaO 1.59 ± 0.01 1.37 ± 0.01 1.04 ± 0.01
MgO 0.94 ± 0.01 1.04 ± 0.01 1.14 ± 0.01
K2O* 8.91 ± 0.05 6.58 ± 0.05 5.27 ± 0.05
MnO 0.43 ± 0.01 0.55 ± 0.01 0.56 ± 0.01
MoO3 2.07 ± 0.01 1.92 ± 0.01 1.89 ± 0.01
CeO2 6.02 ± 0.05 6.36 ± 0.05 6.65 ± 0.05
* Also calculated with wet chemical analysis
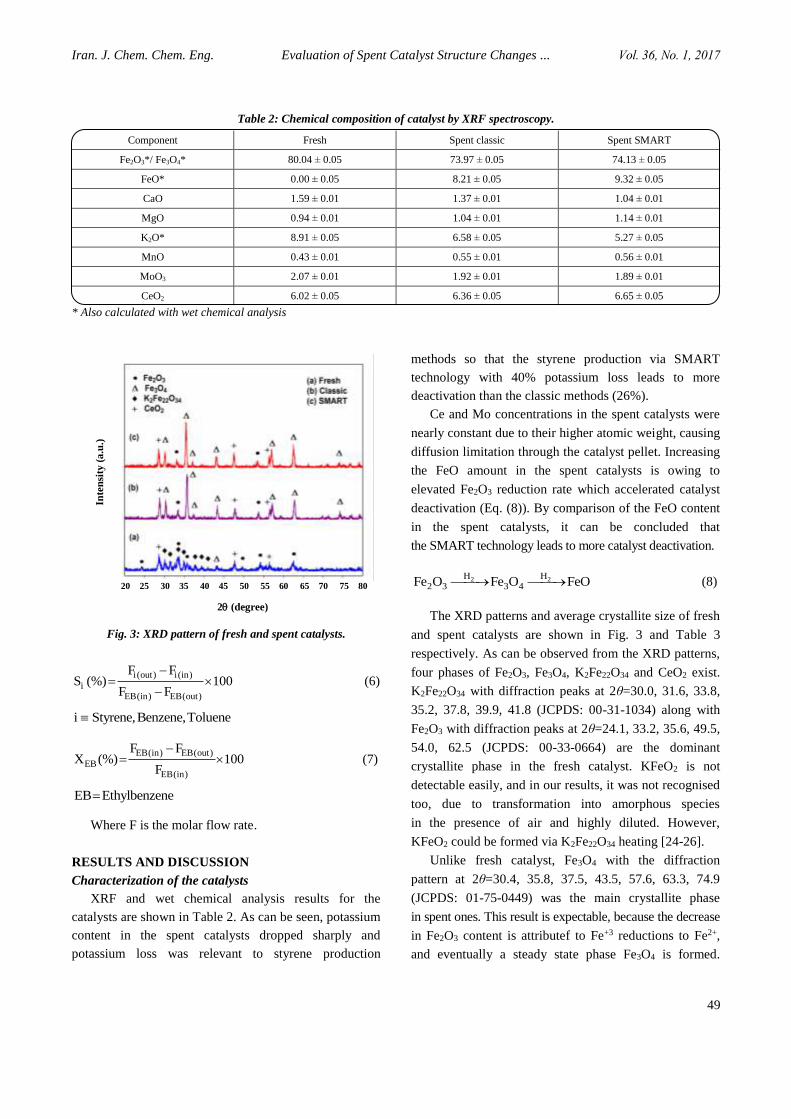
Fig. 3: XRD pattern of fresh and spent catalysts.
i (out) i(in)
iEB(in) EB(out)
F FS (%) 100
F F
(6)
i Styrene,Benzene,Toluene
EB(in) EB(out)
EBEB(in)
F FX (%) 100
F
(7)
EB Ethylbenzene
Where F is the molar flow rate.
RESULTS AND DISCUSSION
Characterization of the catalysts
XRF and wet chemical analysis results for the
catalysts are shown in Table 2. As can be seen, potassium
content in the spent catalysts dropped sharply and
potassium loss was relevant to styrene production
methods so that the styrene production via SMART
technology with 40% potassium loss leads to more
deactivation than the classic methods (26%).
Ce and Mo concentrations in the spent catalysts were
nearly constant due to their higher atomic weight, causing
diffusion limitation through the catalyst pellet. Increasing
the FeO amount in the spent catalysts is owing to
elevated Fe2O3 reduction rate which accelerated catalyst
deactivation (Eq. (8)). By comparison of the FeO content
in the spent catalysts, it can be concluded that
the SMART technology leads to more catalyst deactivation.
2 2H H2 3 3 4Fe O Fe O FeO (8)
The XRD patterns and average crystallite size of fresh
and spent catalysts are shown in Fig. 3 and Table 3
respectively. As can be observed from the XRD patterns,
four phases of Fe2O3, Fe3O4, K2Fe22O34 and CeO2 exist.
K2Fe22O34 with diffraction peaks at 2θ=30.0, 31.6, 33.8,
35.2, 37.8, 39.9, 41.8 (JCPDS: 00-31-1034) along with
Fe2O3 with diffraction peaks at 2θ=24.1, 33.2, 35.6, 49.5,
54.0, 62.5 (JCPDS: 00-33-0664) are the dominant
crystallite phase in the fresh catalyst. KFeO2 is not
detectable easily, and in our results, it was not recognised
too, due to transformation into amorphous species
in the presence of air and highly diluted. However,
KFeO2 could be formed via K2Fe22O34 heating [24-26].
Unlike fresh catalyst, Fe3O4 with the diffraction
pattern at 2θ=30.4, 35.8, 37.5, 43.5, 57.6, 63.3, 74.9
(JCPDS: 01-75-0449) was the main crystallite phase
in spent ones. This result is expectable, because the decrease
in Fe2O3 content is attributef to Fe+3 reductions to Fe2+,
and eventually a steady state phase Fe3O4 is formed.
20 25 30 35 40 45 50 55 60 65 70 75 80
2 (degree)
Inte
nsi
ty (
a.u
.)
Iran. J. Chem. Chem. Eng. Haghlesan A.N. et. al. Vol. 36, No. 1, 2017
50
Table 3: Structural properties of fresh and spent catalysts.
Crystallite phase Crystallite size (nm) Catalyst
CeO2e K2Fe22O34
d Fe3O4c Fe2O3
b CeO2 K2Fe22O34 Fe3O4 Fe2O3
Cubic Hexagonal Cubic Cubic 17.4 26.2 26.5 21.1 Fresh
Cubic - Cubic Cubic 29.8 - 42.4 30.1 Spent classic
Cubic - Cubic Cubic 41.6 - 53.0 42.1 Spent SMART
a) Crystallite size was estimated by Scherre's equation. b) Reference code (JCPDS): 00-33-0664.
c) Reference code (JCPDS): 01-75-0449. d) Reference code (JCPDS): 00-31-1034.
e) Reference code (JCPDS): 01-075-0076.
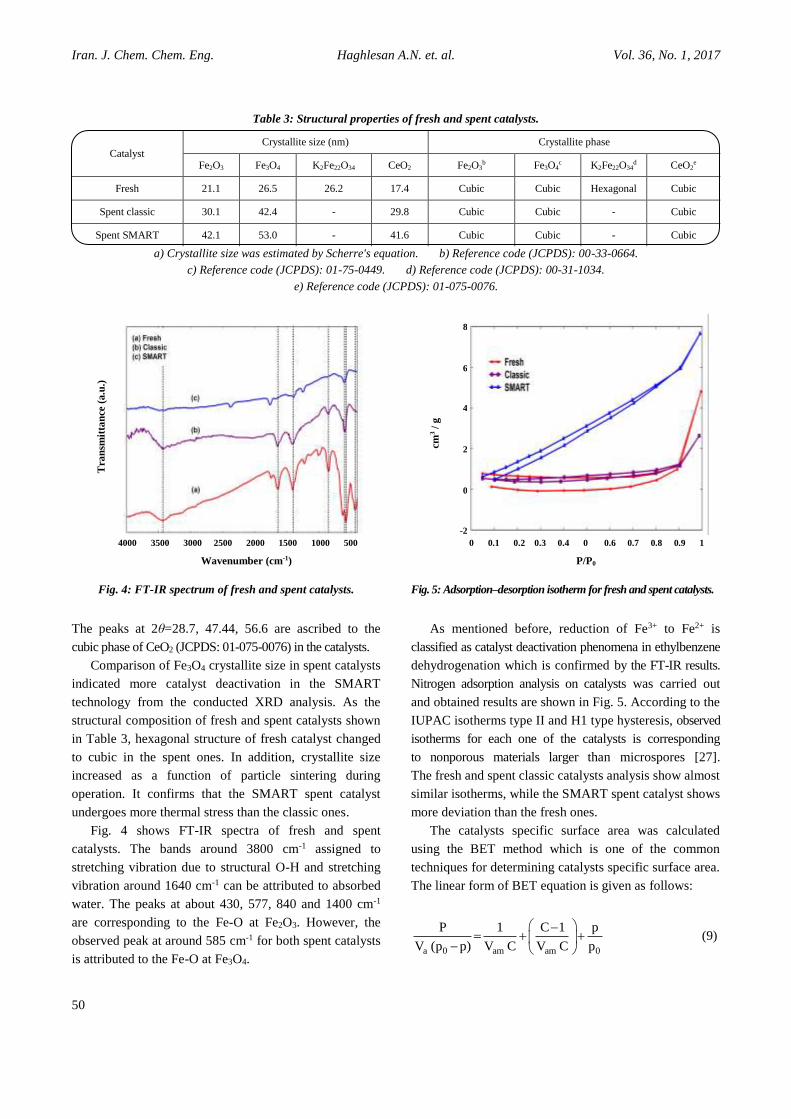
Fig. 4: FT-IR spectrum of fresh and spent catalysts.
The peaks at 2θ=28.7, 47.44, 56.6 are ascribed to the
cubic phase of CeO2 (JCPDS: 01-075-0076) in the catalysts.
Comparison of Fe3O4 crystallite size in spent catalysts
indicated more catalyst deactivation in the SMART
technology from the conducted XRD analysis. As the
structural composition of fresh and spent catalysts shown
in Table 3, hexagonal structure of fresh catalyst changed
to cubic in the spent ones. In addition, crystallite size
increased as a function of particle sintering during
operation. It confirms that the SMART spent catalyst
undergoes more thermal stress than the classic ones.
Fig. 4 shows FT-IR spectra of fresh and spent
catalysts. The bands around 3800 cm-1 assigned to
stretching vibration due to structural O-H and stretching
vibration around 1640 cm-1 can be attributed to absorbed
water. The peaks at about 430, 577, 840 and 1400 cm-1
are corresponding to the Fe-O at Fe2O3. However, the
observed peak at around 585 cm-1 for both spent catalysts
is attributed to the Fe-O at Fe3O4.
Fig. 5: Adsorption–desorption isotherm for fresh and spent catalysts.
As mentioned before, reduction of Fe3+ to Fe2+ is
classified as catalyst deactivation phenomena in ethylbenzene
dehydrogenation which is confirmed by the FT-IR results.
Nitrogen adsorption analysis on catalysts was carried out
and obtained results are shown in Fig. 5. According to the
IUPAC isotherms type II and H1 type hysteresis, observed
isotherms for each one of the catalysts is corresponding
to nonporous materials larger than microspores [27].
The fresh and spent classic catalysts analysis show almost
similar isotherms, while the SMART spent catalyst shows
more deviation than the fresh ones.
The catalysts specific surface area was calculated
using the BET method which is one of the common
techniques for determining catalysts specific surface area.
The linear form of BET equation is given as follows:
a 0 am am 0
P 1 C 1 p
V (p p) V C V C p
(9)
4000 3500 3000 2500 2000 1500 1000 500
Wavenumber (cm-1)
Tra
nsm
itta
nce
(a.u
.)
0 0.1 0.2 0.3 0.4 0 0.6 0.7 0.8 0.9 1
P/P0
8
6
4
2
0
-2
cm
3 /
g
Iran. J. Chem. Chem. Eng. Evaluation of Spent Catalyst Structure Changes ... Vol. 36, No. 1, 2017
51
Table 4: Evaluation of surface area and pore structure of catalysts.
Mean Pore Radius (A˚) Total Pore Volume (cm3/g) BET Surface Area (m2/g) Catalyst
76.84 07.43 × 10⁻³ 2.04 Fresh
51.58 04.07 × 10⁻³ 1.65 Spent classic
35.82 11.83 × 10⁻³ 5.28 Spent SMART
Where Va is the amount of adsorbed gas at a relative
pressure P/P0, Vam is monolayer adsorption capacity and
C is the BET equation constant. The BET points show
good linearity for fresh, classic and SMART spent
catalysts with correction factors of 0.99, 0.98 and 0.99,
respectively. Nitrogen adsorption isotherms results
are shown in Table 4.
As can be seen from Table 4, specific surface area and
pore volume of the SMART spent catalyst increase to
5.27m2/g and 11.83 × 10⁻³cm3/g, respectively which are
in contact with the classic spent catalyst behavior.
This can be attributed to further potassium migration,
followed by the physical changes and pores interconnecting,
which is known as transient pores. The average pore radius
in both SMART and classic spent catalysts, compared
to the fresh one, shows about 53% and 33% reduction,
respectively, which could be due to blocked pores mouth
resulting from coke and carbonaceous deposits formation.
It is believed that styrene is the precursor of coke and
carbonaceous deposits formation which resulted in the
catalyst activity loss [28, 29].
With respect to pores radius reduction followed
by diffusion limitation, the residence time of the reactants
at the acid sites and also by-products formation will increase.
It is to be expected that the SMART spent catalyst would
produce more benzene and toluene compared to the
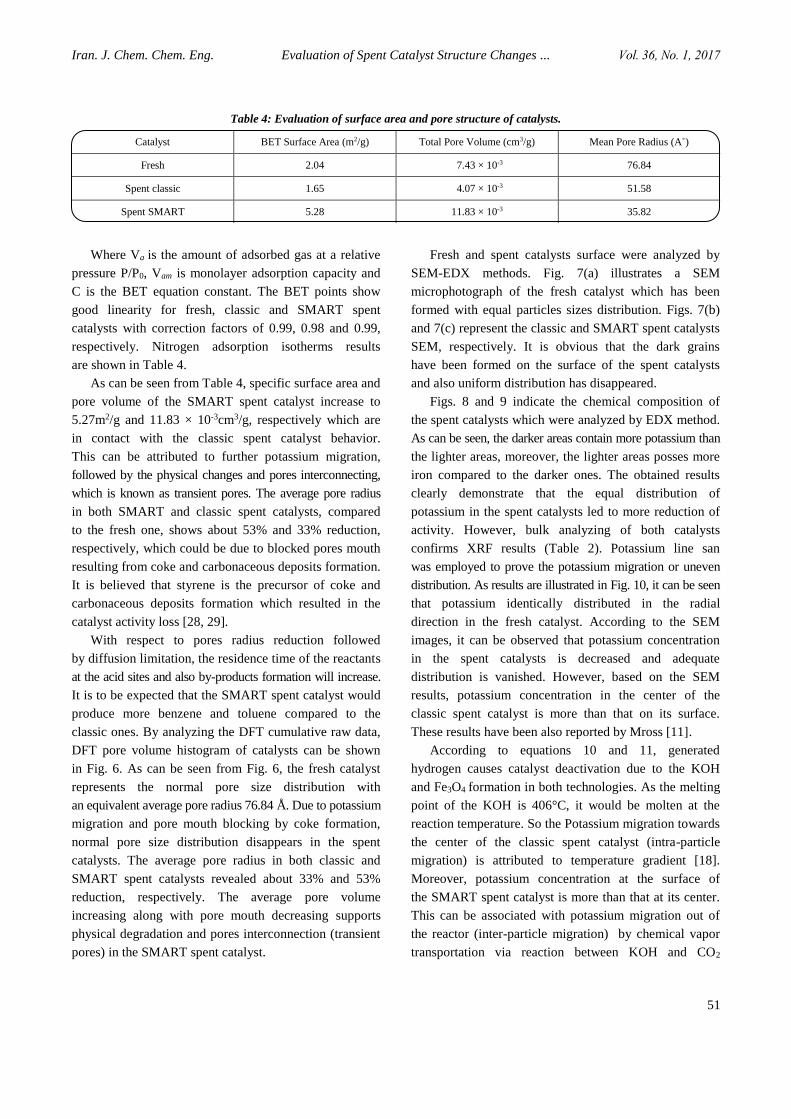
classic ones. By analyzing the DFT cumulative raw data,
DFT pore volume histogram of catalysts can be shown
in Fig. 6. As can be seen from Fig. 6, the fresh catalyst
represents the normal pore size distribution with
an equivalent average pore radius 76.84 Å. Due to potassium
migration and pore mouth blocking by coke formation,
normal pore size distribution disappears in the spent
catalysts. The average pore radius in both classic and
SMART spent catalysts revealed about 33% and 53%
reduction, respectively. The average pore volume
increasing along with pore mouth decreasing supports
physical degradation and pores interconnection (transient
pores) in the SMART spent catalyst.
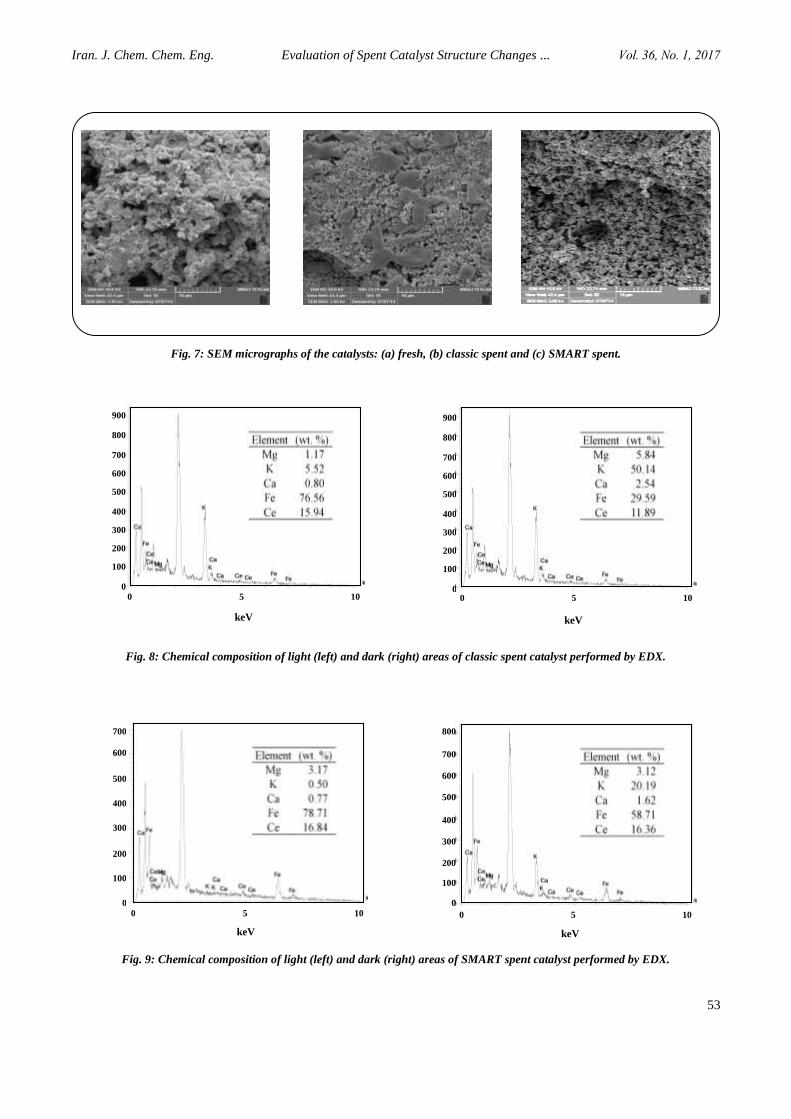
Fresh and spent catalysts surface were analyzed by
SEM-EDX methods. Fig. 7(a) illustrates a SEM
microphotograph of the fresh catalyst which has been
formed with equal particles sizes distribution. Figs. 7(b)
and 7(c) represent the classic and SMART spent catalysts
SEM, respectively. It is obvious that the dark grains
have been formed on the surface of the spent catalysts
and also uniform distribution has disappeared.
Figs. 8 and 9 indicate the chemical composition of
the spent catalysts which were analyzed by EDX method.
As can be seen, the darker areas contain more potassium than
the lighter areas, moreover, the lighter areas posses more
iron compared to the darker ones. The obtained results
clearly demonstrate that the equal distribution of
potassium in the spent catalysts led to more reduction of
activity. However, bulk analyzing of both catalysts
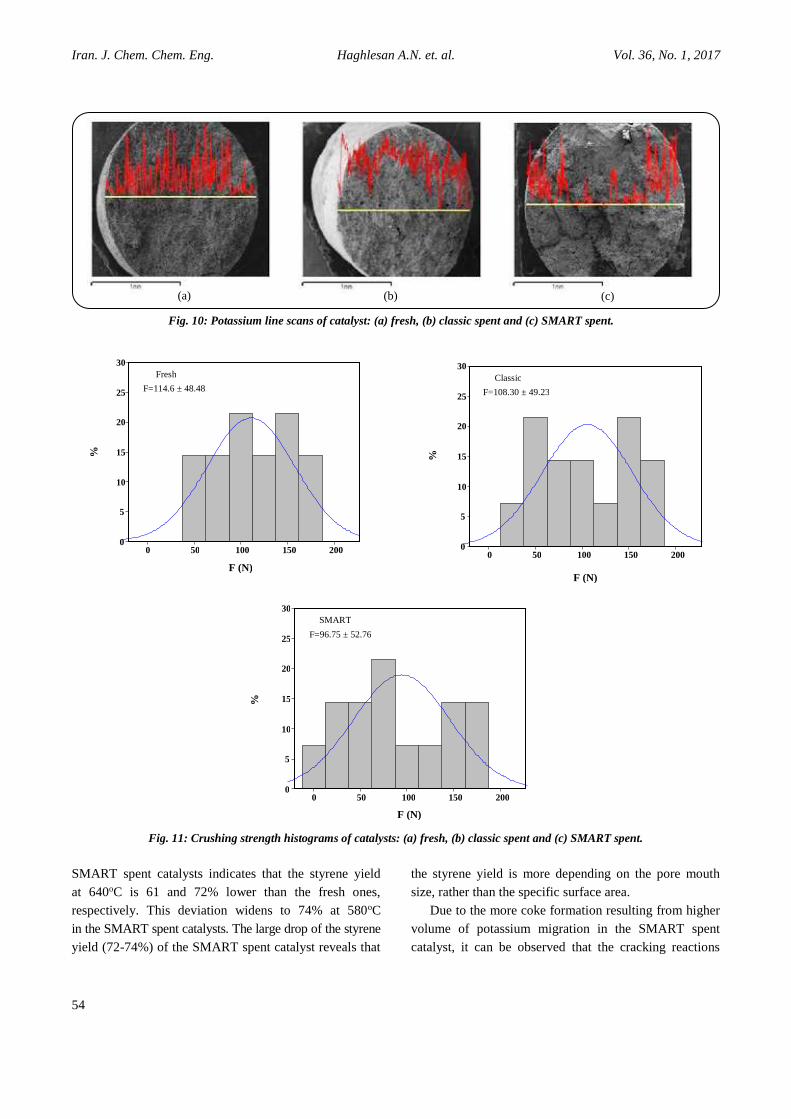
confirms XRF results (Table 2). Potassium line san
was employed to prove the potassium migration or uneven
distribution. As results are illustrated in Fig. 10, it can be seen
that potassium identically distributed in the radial
direction in the fresh catalyst. According to the SEM
images, it can be observed that potassium concentration
in the spent catalysts is decreased and adequate
distribution is vanished. However, based on the SEM
results, potassium concentration in the center of the
classic spent catalyst is more than that on its surface.
These results have been also reported by Mross [11].
According to equations 10 and 11, generated
hydrogen causes catalyst deactivation due to the KOH
and Fe3O4 formation in both technologies. As the melting
point of the KOH is 406°C, it would be molten at the
reaction temperature. So the Potassium migration towards
the center of the classic spent catalyst (intra-particle
migration) is attributed to temperature gradient [18].
Moreover, potassium concentration at the surface of
the SMART spent catalyst is more than that at its center.
This can be associated with potassium migration out of
the reactor (inter-particle migration) by chemical vapor
transportation via reaction between KOH and CO2
Iran. J. Chem. Chem. Eng. Haghlesan A.N. et. al. Vol. 36, No. 1, 2017
52
Fig. 6: DFT pore volume histograms of catalysts: (a) fresh, (b)
classic spent and (c) SMART spent.
The excess oxygen amount reacts with hydrocarbons and
CO2 is generated in the SMART reactor. According to
Eq. 12, generated CO2 reacts with KOH and K2CO3
is formed. It caused downstream pipes clogging due to
potassium carbonate sediment build-up which was
verified by gradual increasing of pressure drop during
operation. However, the high temperature of hydrocarbon
oxidation leads to the more thermal stress of catalyst and
further KOH melt. So, the center of the SMART spent
catalyst is potassium depleted and its concentration on the
catalyst surface is very low compared to the fresh ones.
Subsequently, the catalyst conversion dropped slowly and
a higher level of by-products is formed.
2 22 34 2 3 4 23K Fe O 11H 6KOH 22Fe O 8H O (10)
2 2 2 3 43KFeO H O (1/ 2)H 3KOH Fe O (11)
2 2 3 22KOH CO K CO H O (12)
Ethylbenzene dehydrogenation is an endothermic reaction
and takes place at temperatures of above 580oC. As well as
thermal stress that the dehydrogenation catalyst encounters,
the mechanical strength of the catalyst decreases. The gradual
reduction of Fe3+ to Fe2+ leads to the several interrelated
deactivation phenomena and mechanical strength drop.
Catalyst crystalline phase transformation from hexagonal
in K2Fe22O34 to cubic in Fe3O4, confirms a significant change
in the mechanical strength. By considering the obtained data
from crush strength analysis, it can be seen that fresh catalyst,
with approximately 114.6 ± 48.48 N in comparison to
the spent catalysts possess high mechanical strength. The
mechanical strength of the SMART and classic spent catalysts
is 5.5% and 15.5% lower than the fresh ones, respectively.
This phenomenon is most obvious during spent catalysts
discharge from both classic and SMART reactors.
In addition to the crystalline phase change effects on
the mechanical strength, potassium migration leads to
change in catalyst density. The mechanical strength
reduction and physical degradation cause an increase in
pressure drop across the catalyst bed. Subsequently,
conversion and selectivity decrease gradually with time in
both spent catalysts. The crushing strength distribution
histograms of catalyst are shown in Fig. 11.
Activity Tests
The results of the catalytic activity tests of the fresh
and spent catalysts are reported in Table 5. The
ethylbenzene dehydrogenation over the classic and
5.0-6.3 7.9-10.0 12.6-15.9 20.0-25.1 31.6-39.8
Pore diameter (°A)
50
40
30
20
10
0
Freq
uen
cy (
%)
5.0-6.3 7.9-10.0 12.6-15.9 20.0-25.1 31.6-39.8
Pore diameter (°A)
50
40
30
20
10
0
Freq
uen
cy (
%)
5.0-6.3 7.9-10.0 12.6-15.9 20.0-25.1 31.6-39.8
Pore diameter (°A)
50
40
30
20
10
0
Freq
uen
cy (
%)
Iran. J. Chem. Chem. Eng. Evaluation of Spent Catalyst Structure Changes ... Vol. 36, No. 1, 2017
53
Fig. 7: SEM micrographs of the catalysts: (a) fresh, (b) classic spent and (c) SMART spent.
Fig. 8: Chemical composition of light (left) and dark (right) areas of classic spent catalyst performed by EDX.
Fig. 9: Chemical composition of light (left) and dark (right) areas of SMART spent catalyst performed by EDX.
0 5 10
keV
900
800
700
600
500
400
300
200
100
0
900
800
700
600
500
400
300
200
100
0
700
600
500
400
300
200
100
0
800
700
600
500
400
300
200
100
0
0 5 10
keV
0 5 10
keV
0 5 10
keV
Iran. J. Chem. Chem. Eng. Haghlesan A.N. et. al. Vol. 36, No. 1, 2017
54
Fig. 10: Potassium line scans of catalyst: (a) fresh, (b) classic spent and (c) SMART spent.
Fig. 11: Crushing strength histograms of catalysts: (a) fresh, (b) classic spent and (c) SMART spent.
SMART spent catalysts indicates that the styrene yield
at 640oC is 61 and 72% lower than the fresh ones,
respectively. This deviation widens to 74% at 580oC
in the SMART spent catalysts. The large drop of the styrene
yield (72-74%) of the SMART spent catalyst reveals that
the styrene yield is more depending on the pore mouth
size, rather than the specific surface area.
Due to the more coke formation resulting from higher
volume of potassium migration in the SMART spent
catalyst, it can be observed that the cracking reactions
(a) (b) (c)
200 150 100 50 0
30
25
20
15
10
5
0
F (N)
Classic
F=108.30 ± 49.23
%
200 150 100 50 0
30
25
20
15
10
5
0
F (N)
Fresh
F=114.6 ± 48.48
%
200 150 100 50 0
30
25
20
15
10
5
0
F (N)
SMART
F=96.75 ± 52.76
%
Iran. J. Chem. Chem. Eng. Evaluation of Spent Catalyst Structure Changes ... Vol. 36, No. 1, 2017
55
Table 5: Catalytic activity of fresh and spent catalysts at various temperature (S/O=1.3, LHSV=1.0 h-1).
Temperature (°C) Catalyst Ethylbenzene
Conversion
Styrene
Selectivity
Benzene
Selectivity
Toluene
Selectivity Styrene Yield
580
Fresh 37.73 79.05 13.20 8.96 29.82
Spent classic 18.37 63.86 18.26 11.15 11.73
Spent SMART 15.41 51.28 18.50 12.05 7.90
640
Fresh 54.38 76.04 15.31 9.83 41.35
Spent classic 29.13 55.29 18.91 13.62 16.10
Spent SMART 26.57 44.02 19.28 14.19 11.70
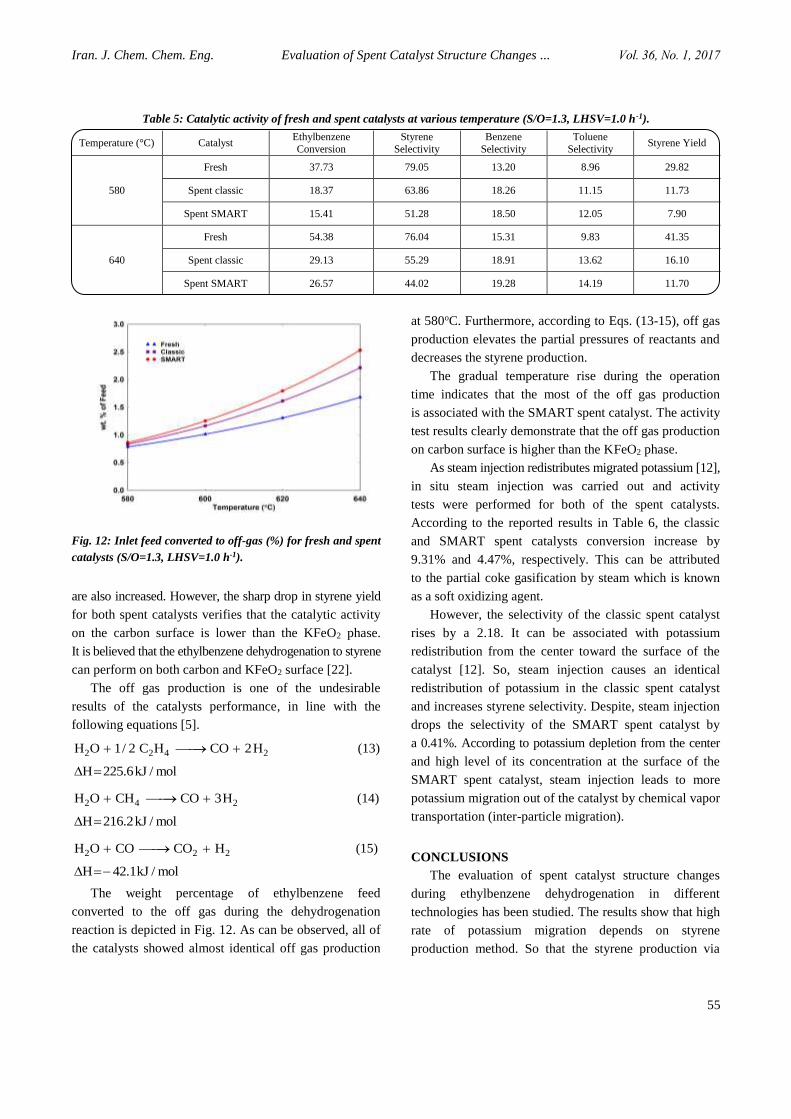
Fig. 12: Inlet feed converted to off-gas (%) for fresh and spent
catalysts (S/O=1.3, LHSV=1.0 h-1).
are also increased. However, the sharp drop in styrene yield
for both spent catalysts verifies that the catalytic activity
on the carbon surface is lower than the KFeO2 phase.
It is believed that the ethylbenzene dehydrogenation to styrene
can perform on both carbon and KFeO2 surface [22].
The off gas production is one of the undesirable
results of the catalysts performance, in line with the
following equations [5].
2 2 4 2H O 1/ 2 C H CO 2H (13)
H 225.6kJ / mol
2 4 2H O CH CO 3H (14)
H 216.2kJ / mol
2 2 2H O CO CO H (15)
H 42.1kJ / mol
The weight percentage of ethylbenzene feed
converted to the off gas during the dehydrogenation
reaction is depicted in Fig. 12. As can be observed, all of
the catalysts showed almost identical off gas production
at 580oC. Furthermore, according to Eqs. (13-15), off gas
production elevates the partial pressures of reactants and
decreases the styrene production.
The gradual temperature rise during the operation
time indicates that the most of the off gas production
is associated with the SMART spent catalyst. The activity
test results clearly demonstrate that the off gas production
on carbon surface is higher than the KFeO2 phase.
As steam injection redistributes migrated potassium [12],
in situ steam injection was carried out and activity
tests were performed for both of the spent catalysts.
According to the reported results in Table 6, the classic
and SMART spent catalysts conversion increase by
9.31% and 4.47%, respectively. This can be attributed
to the partial coke gasification by steam which is known
as a soft oxidizing agent.
However, the selectivity of the classic spent catalyst
rises by a 2.18. It can be associated with potassium
redistribution from the center toward the surface of the
catalyst [12]. So, steam injection causes an identical
redistribution of potassium in the classic spent catalyst
and increases styrene selectivity. Despite, steam injection
drops the selectivity of the SMART spent catalyst by
a 0.41%. According to potassium depletion from the center
and high level of its concentration at the surface of the
SMART spent catalyst, steam injection leads to more
potassium migration out of the catalyst by chemical vapor
transportation (inter-particle migration).
CONCLUSIONS
The evaluation of spent catalyst structure changes
during ethylbenzene dehydrogenation in different
technologies has been studied. The results show that high
rate of potassium migration depends on styrene
production method. So that the styrene production via
Iran. J. Chem. Chem. Eng. Haghlesan A.N. et. al. Vol. 36, No. 1, 2017
56
Table 6: Changes in spent catalysts activity after 30 min steam injection. (T=580 °C, S/O=1.3, LHSV=1.0 hr-1).
Spent catalyst Original (as received) After steam treatment % Change
Conversion Selectivity Conversion Selectivity Conversion Selectivity
Classic 18.37 63.86 20.08 65.25 9.31 2.18
SMART 15.41 51.28 16.10 51.07 4.47 -0.41
classic and SMART technologies by 26 and 40%
potassium loss, leads to more catalyst deactivation than
the fresh ones, respectively. In addition, the pore structure
analysis revealed that the mean pore size reduction along
with diffusion limitation in the SMART technology
causes an increase in residence time of reactants and
by-products formation.
Moreover, potassium migration in the classic spent
catalyst is attributed to the temperature gradient and
it is directed towards the center of the catalyst (intra-particle
potassium migration). Unlike, the chemical reaction
results in a change in the potassium migration pattern
towards the out of the catalyst in the SMART spent
catalyst (inter-particle chemical vapor transportation).
Furthermore, in situ steam injection redistributes
migrated potassium in the classic spent catalyst and the
selectivity of the catalysts increases. But it leads to more
potassium migration and higher selectivity drop in the
SMART spent ones.
Generally, it can be said that excess oxygen injection
changes catalysts deactivation mechanism and accelerates
potassium migration and catalyst deactivation in the
SMART technology. Generally, it can be concluded that
the styrene production through SMART technology has
more disadvantages and industrial unit designing based
on it not recommended strongly.
Acknowledgment
The authors would like to thank Sahand University of
Technology (SUT) and Environmental Engineering
Research Center (EERC) for their support for this
research work.
Received: Jul. 25, 2015 ; Accepted: Jun. 1, 2016
REFERENCES
[1] James D.H., Castor W.M., "Ullmann’s Encyclopedia
of Industrial Chemistry", Wiley-VCH Verlag GmbH
& Co., Weinheim (2011).
[2] Scheirs J., Priddy D., "Modern Styrenic Polymers",
John Wiley & Sons, Weinheim (2003).
[3] Tamsilian Y., Ebrahimi A.N., Ramazani A.,
Abdollahzadeh H., Modeling and Sensitivity
Analysis of Styrene Monomer Production Process
and Investigation of Catalyst Behavior, Comput.
Chem. Eng., 40(1):1-11 (2012).
[4] Jafarzadeh Y., Shafiei S., Ebadi A., Abdoli M., Batch
Separation of Styrene/Ethylbenzene/Water Dispersions,
Iran. J. Chem. Eng.(IJChE), 7(4):22-28 (2010).
[5] Cavani F., Trifiro F., Alternative Processes for the
Production of Styrene, Appl. Catal. A.: General,
133(2):219-239 (1995).
[6] Arpe H.J., "Industrial Organic Chemistry", Wiley-
VCH Verlag GmbH & Co., Weinheim (2010).
[7] Khatamian M., Khandar A.A., Haghighi M., Ghadiri M.,
Nano ZSM-5 Type Ferrisilicates as Novel Catalysts
for Ethylbenzene Dehydrogenation in the Presence
of N2O, Appl. Surf. Sci., 258(2):865-872 (2011).
[8] Castro A.J.R., Soares J.M., Filho J.M., Oliveira A.C.,
Campos A., Milet E.R.C., Oxidative
Dehydrogenation of Ethylbenzene with CO2 for
Styrene Production over Porous Iron-based
Catalysts, Fuel, 108(1):740-748 (2013).
[9] Humin Y., Hong L., Jilong W., Tao W., Wenjun Y.,
Xiaoli H., Jiejun B., Guoping X., Development
Status of Ethylbenzene Dehydrogenation Catalysts,
Ind. Catal., 20(1):13-18 (2012).
[10] Tahriri-Zangeneh F., Taeb A., Gholivand K.,
Sahebdelfar S., The Effect of Alkali Metal
Promoters on the Stability and Coke Formation of
Platinum-Based Propane Dehydrogenation
Catalysts: A Kinetic Study, Iran. J. Chem. Chem.
Eng.(IJCCE), 32(4):25-32 (2013).
[11] Mross W.D., Alkali Doping in Heterogeneous
Catalysis, Cataly. Rev., 25(4):591-637 (1983).
[12] Herzogt, B.D., Rase, H.F., In Situ Catalyst
Reactivation: Spent Ethylbenzene Catalyst with
Agglomerated Potassium Promoter, Ind. Eng. Chem.
Dev., 23(2):187-196 (1984).
Iran. J. Chem. Chem. Eng. Evaluation of Spent Catalyst Structure Changes ... Vol. 36, No. 1, 2017
57
[13] Matsui J., Sodesawa T., Nozaki F., Activity Decay
of Potassium-Promoted Iron Oxide Catalyst for
Dehydrogenation of Ethylbenzene, Appl. Catal. A.:
General, 51(1):203-211 (1989).
[14] Matsui J., Sodesawa T., Nozaki, F., Influence of
Carbon Dioxide Addition upon Decay of Activity of
a Potassium-Promoted Iron Oxide Catalyst for
Dehydrogenation of Ethylbenzene. Appl. Catal. A.:
General, 67(1):179-188 (1990).
[15] Serafin I., Kotarba A., Grzywa M., Sojka Z.,
Binczycka H. Kustrowski P., Quenching of
Potassium Loss from Styrene Catalyst: Effect of Cr
Doping on Stabilization of the K2Fe22O34 Active
Phase, J. Catal., 239(1):137-144 (2006).
[16] Bieniasz W., Trebala M., Sojka Z., Kotarba A.,
Irreversible Deactivation of Styrene Catalyst due to
Potassium Loss—Development of Antidote via
Mechanism Pinning, Catal. Today, 154(3-4):224-
228 (2010).
[17] Rossetti I., Bencini E., Trentini L., Forni, L., Study
of the Deactivation of a Commercial Catalyst for
Ethylbenzene Dehydrogenation to Styrene, Appl.
Catal. A.: General, 292(1):118-123 (2005).
[18] Meima G.R., Menon P.G., Catalyst Deactivation
Phenomena in Styrene Production, Appl. Catal. A.:
General, 212(1-2):239-245 (2001).
[19] Mousavi S., Panahi P., Niaei A., Modeling and
Simulation of Styrene Monomer Reactor:
Mathematical and Artificial Neural Network Model,
Int. J. Sci. Eng. Res.(IJSER), 3(3):1-7 (2012).
[20] Aghayarzadeh M., Alizadeh R., Shafiei S.,
Simulation and Optimization of Styrene Monomer
Production using Neural Network, Iran. J. Chem.
Eng.(IJChE), 11(1):30-41 (2014).
[21] Lee W.J., Froment G.F., Ethylbenzene
Dehydrogenation into Styrene: Kinetic Modeling
and Reactor Simulation, Ind. Eng. Chem. Res.,
47(23):9183-9194 (2008).
[22] Baghalha M., Ebrahimpour O., Structural Changes
and Surface Activities of Ethylbenzene
Dehydrogenation Catalysts during Deactivation,
Appl. Catal. A: General, 326(2):143-151 (2007).
[23] Shijie L., Tong C., Changxi M., Weimin Y., Zaiku X.,
Qingling C., Deactivation of the Industrial Catalyst
for Ethylbenzene Dehydrogenation to Styrene,
Chinese J. Catal., 29(2):179-184 (2008).
[24] Muhler M., Schutze J., Wesemann M., Rayment T.,
Dent A., Schlogl R. Ertl G., The Nature of the Iron
Oxide-based Catalyst for Dehydrogenation of
Ethylbenzene to Styrene: I. Solid-state Chemistry
and Bulk Characterization, J. Catal., 126(2):339-360
(1990).
[25] Ndlela S.C., Shanks B.H., Reducibility of
Potassium-Promoted Iron Oxide under Hydrogen
Conditions, Ind. Eng. Chem. Res., 42(10):2112-2121
(2003).
[26] Subrt J., Vins J., Shapygin I.S., Zakharov A.A.,
Reactivity of Finely Dispersed Iron Oxides in Solid
State Reactions, Thermochim. Acta., 93(1):489-492
(1985).
[27] Gregg S.J., Sing K.S.W., "Adsorption, Surface Area,
and Porosity", Academic Press, London (1995).
[28] Kopinke F.D., Zimmermann G., Reyniers G.,
Froment G.F., Relative Rates of Coke Formation
from Hydrocarbons in Steam Cracking of Naphtha. 3.
Aromatic Hydrocarbons, Ind. Eng. Chem. Res.,
32(11):2620-2625 (1993).
[29] Guisnet M., Magnoux P., Organic Chemistry of
Coke Formation, Appl. Catal. A: General, 212(1-2):
83-96 (2001).