Embed Size (px)
Citation preview
Waba & al./ Appl. J. Envir. Eng. Sci. 6 N°1(2020) 22-34
22
Reactivation of Spent FCC Catalyst via Oxidation and Acid
Treatment
Ijai Ezekiel Waba1, Abdulkareem Abubakar
1*, Suleiman Yunusa
1, Nasiru Audu
2
1Department of Chemical Engineering, Ahmadu Bello University, Zaria, Nigeria.
2Department of Chemical Engineering, Federal Polytechnics, Nasarawa, Nigeria
Corresponding author. E-mail : [email protected]
Received 13 Mar 2019, Revised 19Mar 2020, Accepted 25 Mar 2020
Abstract
Reactivation of spent FCC catalyst for its application in the adsorption of heavy metals from
wastewater was investigated in this research. The most effective reactivation route of spent FCC
catalyst was oxidation of spent FCC catalyst using H2O2 at oxidant-to-catalyst ratio of 16 ml/g, contact
time of 60 minutes and a temperature of 90oC, followed by treatment with CH3COOH solution at
acid-to-catalyst ratio of 20 ml/g, 75 minutes contact time and at a temperature of 50oC. The
reactivation process was monitored using the Scanning Electron Microscope Energy Dispersive X-ray
(SEM-EDX), X-ray fluorescence (XRF) and X-ray diffraction (XRD). The result showed significant
decreases in impurities of coke and metal, and the crystallinity of the treated spent FCC catalyst was
much greater than that of the spent FCC catalyst.
Keywords: Spent FCC catalyst, reactivation, catalyst-to-oxidant ratio, wastewater, heavy metals
Introduction
There has been a consistently enormous increase in the use of FCC catalysts in the downstream sector
of petroleum industries for the past 50 years [1]. Although some of these FCC catalysts, once
exhausted due to deactivation can be recovered by thermal treatments, they will need to be replaced
after a specific number of recoveries as their catalytic activities become extremely low. The FCC
catalyst poisoned by heavy metals are usually replaced with fresh catalyst periodically because they
are difficult to be regenerated [2, 3]. Oxides of rare earth metals in the FCC catalysts’ structures
usually provide improvement and hydrothermal stability of the FCC catalyst that enhance yields [4].
Therefore, the increase in the use of FCC catalysts over the years also translates into proportional
increase in these types of oxides. While the major countries that extract and refine these oxides from
their ores are China and other few countries [5, 6], the manufacturing companies of the FCC catalysts
reside mainly in the USA, UK, Germany and China according to [7]. Meanwhile, the annual
Waba & al./ Appl. J. Envir. Eng. Sci. 6 N°1(2020) 22-34
23
production of the FCC catalysts and then the annual disposal of spent FCC catalyst (otherwise known
as E-cat) are usually not made public and therefore, the exact figure is unknown. Nonetheless, annual
production of about 840,000 ton has been reported from an investigation carried out lately [8, 9].
Several groups concentrated their researches on direct reuse of spent E-cat [10]. For example,
it has been used as an additive for partial replacement of sand in cement or mortar powder mixtures
[11]; and refractory materials, production of mineral wool and ladle covering powder in steelmaking
industry [12]. It has also been used as catalysts for plastic and biomass pyrolysis/gasification or for
the production of synthetic fuels but only at lab- or pilot-scale [13]. Regarding its use in cement or
mortar industries, the quantity of FCC catalyst powder that can be utilized does not exceed 20 wt. %
so as not to negatively affect the chemical and mechanical properties of cements and mortars. Even at
that, the utilization of the spent FCC catalyst for concrete blend are still the main choices for handling
of spent FCC catalysts despite the presence of highly valuable rare earths metals. Again, no updated
global official data currently exists concerning the recycling rate of the spent FCC catalyst as cement
and mortar additive. In summary, direct reuse of spent FCC catalyst for industrial processes is still at
limited scale. Thus, the amount of spent FCC catalyst reused at present is still low compared to the
huge amount disposed of annually [14].
Because of the stringent environmental criteria, this huge amount of the E-cats being disposed
of annually is not acceptance. There is therefore the urgent need to find dependable methods of
reactivating and regenerating the E-cat. There are very limited studies already on the use of acid
treatment of the E-cats. Some of them include bioleaching of heavy metals [15]; and chemical
leaching with acids like sulphuric and nitric acids [16] and citric, oxalic and gluconic acids [17, 18].
The aim of this research was to explore a proper route to reactivate the spent FCC catalyst
into useful catalyst for the purpose of heavy metal adsorption from wastewater that could provide a
new way for disposal and recycle of the spent FCC catalyst.
Materials and Methods
Materials
The materials used in this study were spent catalyst, Y-zeolite obtained from Kaduna Refining and
Petrochemical Company (KRPC), Kaduna, Nigeria; 30 w/v % (equivalent to 8.82M) hydrogen
peroxide (H2O2) manufactured by Guangzhou Jinhuada (JHD) Chemical Reagent Co., Ltd, China; 98
w/v % glacial acetic acid (CH3COOH) manufactured by LOBA Chimie, Mumbai, India; deionized
water with about pH of 7; and 45-micron Whitman filter paper.
The equipment used was Scanning Electron Microscope Energy Dispersive X-ray (SEM-
EDX, ProX by phenom-world), X-ray Fluorescence (skyray explorer XRF), X-ray Diffraction (XRD,
EMPYREAN), a magnetic stirrer (78HW-1) and a drying oven.
Waba & al./ Appl. J. Envir. Eng. Sci. 6 N°1(2020) 22-34
24
Methods
The fresh and spent FCC catalysts were first characterized with SEM-EDX and XRF before treatment
to determine the carbon and metal contents respectively.
Oxidation (Coke removal)
For the oxidation of the coke on the spent FCC catalyst surface, 8.82M H2O2 was contacted
with the spent FCC catalyst at oxidant-to-catalyst ratios of 4, 8, 12 and 16 ml/g at a constant
temperature of 25oC and a contact time of 30 minutes. At the end of each run, the sample was filtered
with a 45-micron Whitman filter paper and dried in an oven at 105oC for 1 hour. Thereafter, it was
characterized using the SEM-EDX to monitor the decrease in carbon content of the catalyst. The
oxidant-to-catalyst ratio in the first batch of runs that gave the highest coke removal was used for
second batch of runs, which were carried at contact times of 15, 30, 45 and 60 minutes, and at
constant temperature of 25oC. The same procedures used earlier for the filtration and drying were used
in this second batch of runs. Similarly, the oxidant-to-catalyst ratio in the first batch of runs and the
contact time in the second batch of runs that gave the highest coke removal were used for third batch
runs, which were carried out at temperatures of 50, 75, 90 and 100oC. Again, the same procedures
used earlier for the filtration and drying were used in this third batch of runs.
Acid treatment
The acid treatment stage of the spent FCC catalyst was performed after the oxidation of the
coke from the catalyst surface in order to remove any adsorbed heavy metal from the catalyst surface.
First, the stock 98 w/v % CH3COOH was diluted to reduce the concentration to 5.386M in order to
increase the pH to 2 to avoid rapid dealumination of the catalyst framework. Now, the oxidized spent
FCC catalyst was treated with diluted CH3COOH at acid-to-catalyst ratios of 5, 10, 15 and 20 ml/g at
constant time of 30 minutes and temperature of 25oC. At the end of each run, the sample was filtered
using a 45-micron Whitman filter paper, washed with deionized water, and thereafter dried in an oven
for 60 minutes at 105oC. The dried catalyst was then characterized using the XRF to quantify the
residual heavy metals on the catalyst surface. The acid-to-catalyst ratio in the first batch of runs that
gave the highest removal of the heavy metals was used for second batch of runs, which were carried at
contact times of 30, 45, 60 and 75 minutes and at constant temperature of 25oC. The same procedures
used earlier for the filtration, washing, drying and characterization were used in this second batch of
runs. Similarly, the oxidant-to-catalyst ratio in the first batch of runs and the contact time in the
second batch of runs that gave the highest removal of the heavy metals were used for third batch runs,
which were carried out at temperatures of 50, 75, and 100oC. Again, the same procedures used earlier
for the filtration, washing, drying and characterization were used in this third batch of runs.
Waba & al./ Appl. J. Envir. Eng. Sci. 6 N°1(2020) 22-34
25
Results and Discussion
Oxidation
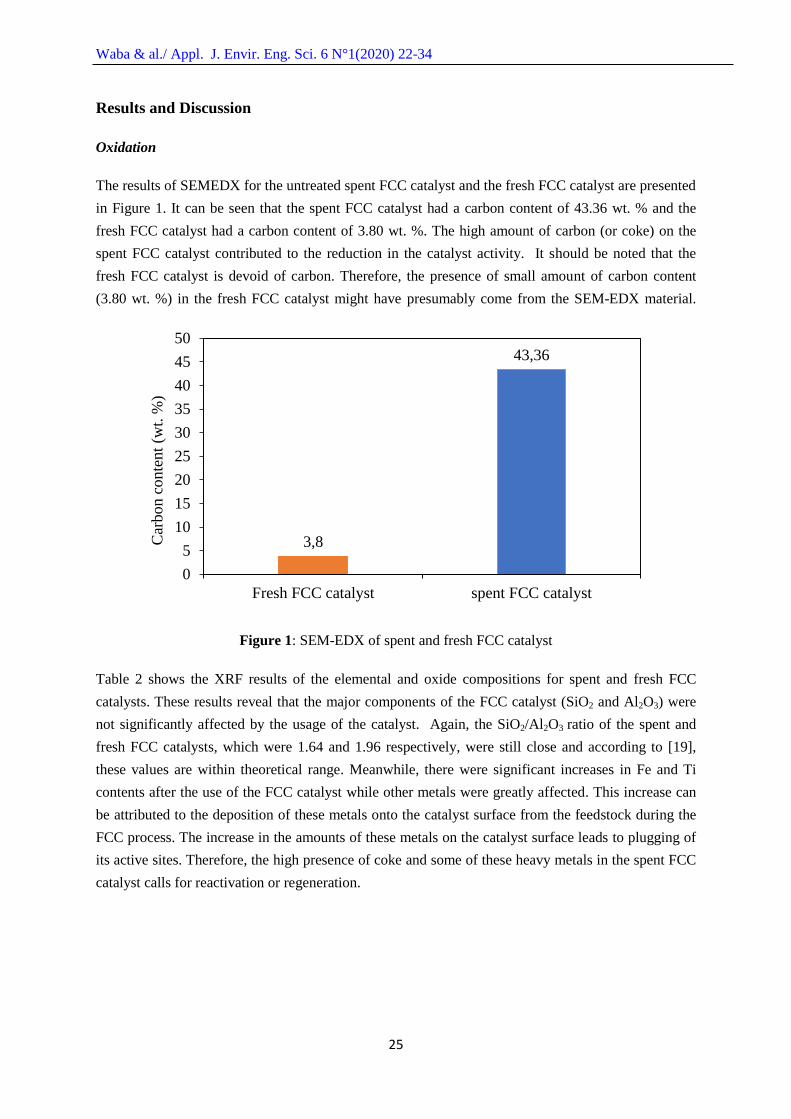
The results of SEMEDX for the untreated spent FCC catalyst and the fresh FCC catalyst are presented
in Figure 1. It can be seen that the spent FCC catalyst had a carbon content of 43.36 wt. % and the
fresh FCC catalyst had a carbon content of 3.80 wt. %. The high amount of carbon (or coke) on the
spent FCC catalyst contributed to the reduction in the catalyst activity. It should be noted that the
fresh FCC catalyst is devoid of carbon. Therefore, the presence of small amount of carbon content
(3.80 wt. %) in the fresh FCC catalyst might have presumably come from the SEM-EDX material.
Figure 1: SEM-EDX of spent and fresh FCC catalyst
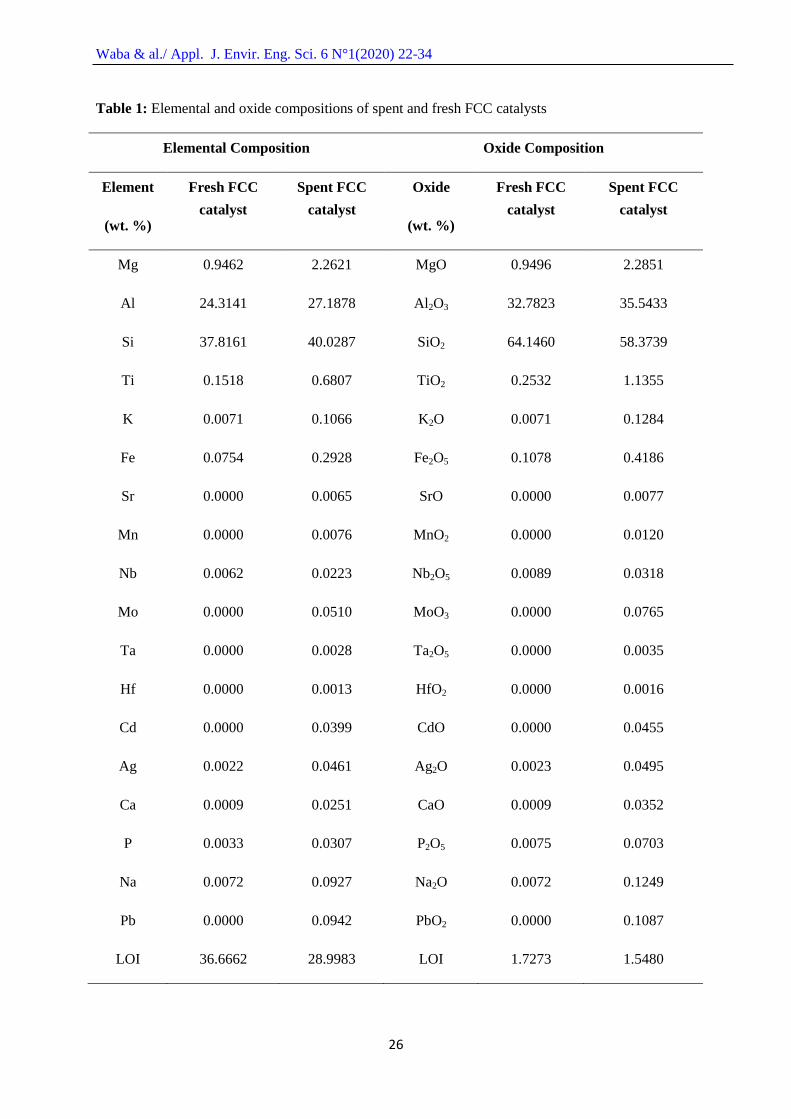
Table 2 shows the XRF results of the elemental and oxide compositions for spent and fresh FCC
catalysts. These results reveal that the major components of the FCC catalyst (SiO2 and Al2O3) were
not significantly affected by the usage of the catalyst. Again, the SiO2/Al2O3 ratio of the spent and
fresh FCC catalysts, which were 1.64 and 1.96 respectively, were still close and according to [19],
these values are within theoretical range. Meanwhile, there were significant increases in Fe and Ti
contents after the use of the FCC catalyst while other metals were greatly affected. This increase can
be attributed to the deposition of these metals onto the catalyst surface from the feedstock during the
FCC process. The increase in the amounts of these metals on the catalyst surface leads to plugging of
its active sites. Therefore, the high presence of coke and some of these heavy metals in the spent FCC
catalyst calls for reactivation or regeneration.
3,8
43,36
0
5
10
15
20
25
30
35
40
45
50
Fresh FCC catalyst spent FCC catalyst
Car
bon c
onte
nt
(wt.
%)
Waba & al./ Appl. J. Envir. Eng. Sci. 6 N°1(2020) 22-34
26
Table 1: Elemental and oxide compositions of spent and fresh FCC catalysts
Elemental Composition Oxide Composition
Element
(wt. %)
Fresh FCC
catalyst
Spent FCC
catalyst
Oxide
(wt. %)
Fresh FCC
catalyst
Spent FCC
catalyst
Mg 0.9462 2.2621 MgO 0.9496 2.2851
Al 24.3141 27.1878 Al2O3 32.7823 35.5433
Si 37.8161 40.0287 SiO2 64.1460 58.3739
Ti 0.1518 0.6807 TiO2 0.2532 1.1355
K 0.0071 0.1066 K2O 0.0071 0.1284
Fe 0.0754 0.2928 Fe2O5 0.1078 0.4186
Sr 0.0000 0.0065 SrO 0.0000 0.0077
Mn 0.0000 0.0076 MnO2 0.0000 0.0120
Nb 0.0062 0.0223 Nb2O5 0.0089 0.0318
Mo 0.0000 0.0510 MoO3 0.0000 0.0765
Ta 0.0000 0.0028 Ta2O5 0.0000 0.0035
Hf 0.0000 0.0013 HfO2 0.0000 0.0016
Cd 0.0000 0.0399 CdO 0.0000 0.0455
Ag 0.0022 0.0461 Ag2O 0.0023 0.0495
Ca 0.0009 0.0251 CaO 0.0009 0.0352
P 0.0033 0.0307 P2O5 0.0075 0.0703
Na 0.0072 0.0927 Na2O 0.0072 0.1249
Pb 0.0000 0.0942 PbO2 0.0000 0.1087
LOI 36.6662 28.9983 LOI 1.7273 1.5480
Waba & al./ Appl. J. Envir. Eng. Sci. 6 N°1(2020) 22-34
27
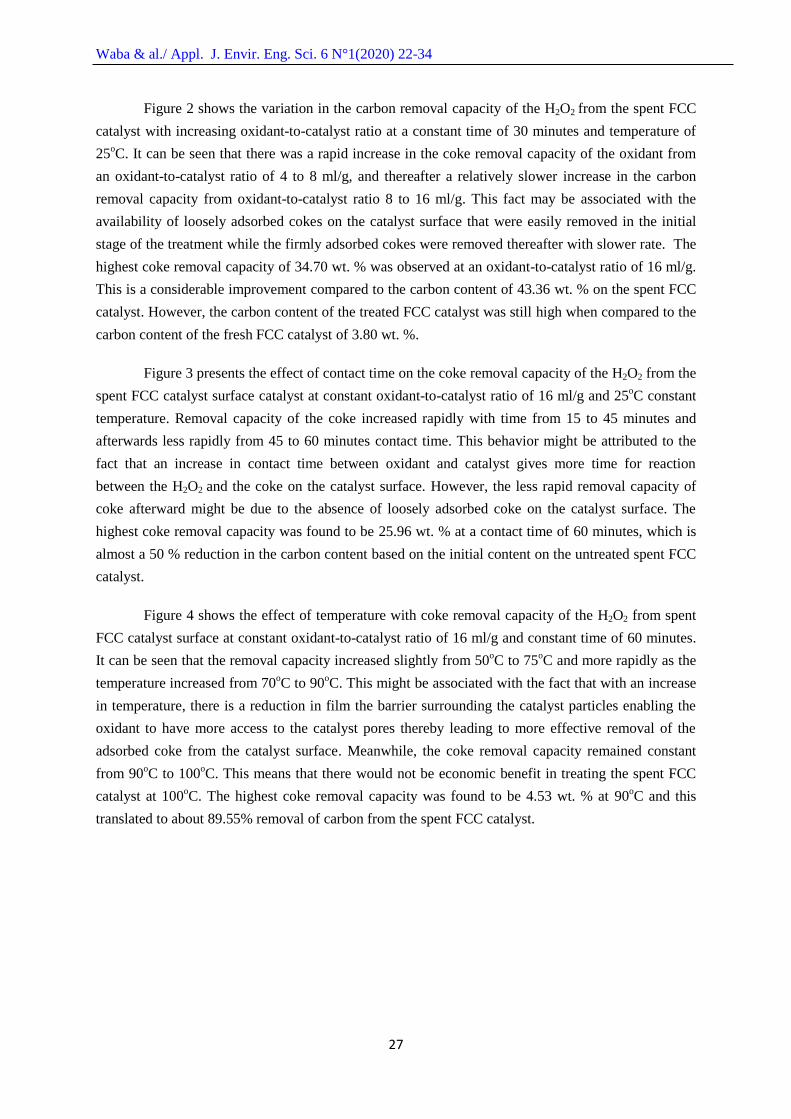
Figure 2 shows the variation in the carbon removal capacity of the H2O2 from the spent FCC
catalyst with increasing oxidant-to-catalyst ratio at a constant time of 30 minutes and temperature of
25oC. It can be seen that there was a rapid increase in the coke removal capacity of the oxidant from
an oxidant-to-catalyst ratio of 4 to 8 ml/g, and thereafter a relatively slower increase in the carbon
removal capacity from oxidant-to-catalyst ratio 8 to 16 ml/g. This fact may be associated with the
availability of loosely adsorbed cokes on the catalyst surface that were easily removed in the initial
stage of the treatment while the firmly adsorbed cokes were removed thereafter with slower rate. The
highest coke removal capacity of 34.70 wt. % was observed at an oxidant-to-catalyst ratio of 16 ml/g.
This is a considerable improvement compared to the carbon content of 43.36 wt. % on the spent FCC
catalyst. However, the carbon content of the treated FCC catalyst was still high when compared to the
carbon content of the fresh FCC catalyst of 3.80 wt. %.
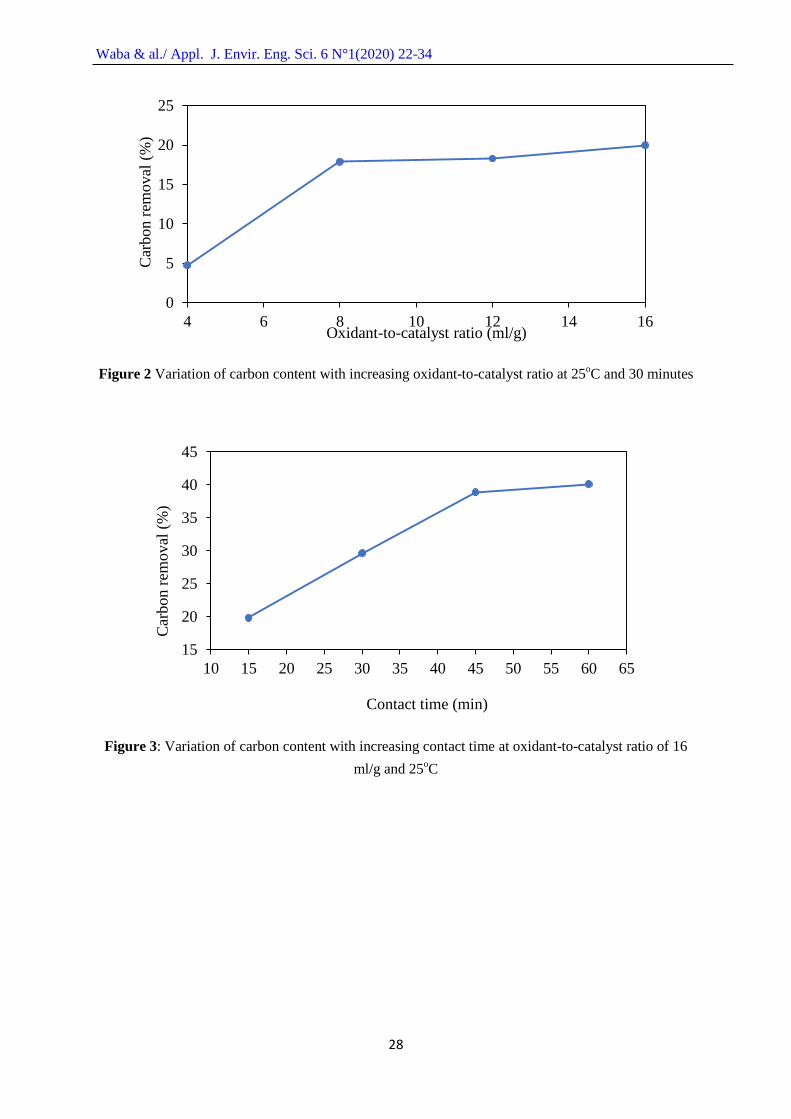
Figure 3 presents the effect of contact time on the coke removal capacity of the H2O2 from the
spent FCC catalyst surface catalyst at constant oxidant-to-catalyst ratio of 16 ml/g and 25oC constant
temperature. Removal capacity of the coke increased rapidly with time from 15 to 45 minutes and
afterwards less rapidly from 45 to 60 minutes contact time. This behavior might be attributed to the
fact that an increase in contact time between oxidant and catalyst gives more time for reaction
between the H2O2 and the coke on the catalyst surface. However, the less rapid removal capacity of
coke afterward might be due to the absence of loosely adsorbed coke on the catalyst surface. The
highest coke removal capacity was found to be 25.96 wt. % at a contact time of 60 minutes, which is
almost a 50 % reduction in the carbon content based on the initial content on the untreated spent FCC
catalyst.
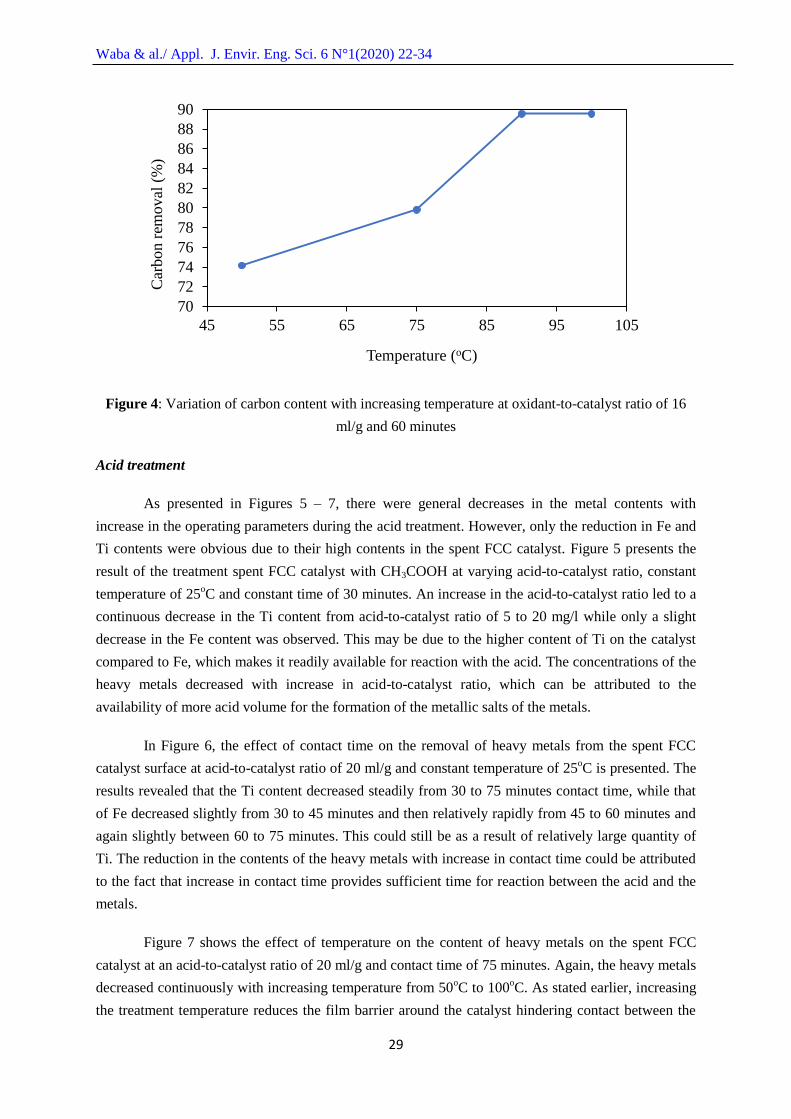
Figure 4 shows the effect of temperature with coke removal capacity of the H2O2 from spent
FCC catalyst surface at constant oxidant-to-catalyst ratio of 16 ml/g and constant time of 60 minutes.
It can be seen that the removal capacity increased slightly from 50oC to 75
oC and more rapidly as the
temperature increased from 70oC to 90
oC. This might be associated with the fact that with an increase
in temperature, there is a reduction in film the barrier surrounding the catalyst particles enabling the
oxidant to have more access to the catalyst pores thereby leading to more effective removal of the
adsorbed coke from the catalyst surface. Meanwhile, the coke removal capacity remained constant
from 90oC to 100
oC. This means that there would not be economic benefit in treating the spent FCC
catalyst at 100oC. The highest coke removal capacity was found to be 4.53 wt. % at 90
oC and this
translated to about 89.55% removal of carbon from the spent FCC catalyst.
Waba & al./ Appl. J. Envir. Eng. Sci. 6 N°1(2020) 22-34
28
Figure 2 Variation of carbon content with increasing oxidant-to-catalyst ratio at 25oC and 30 minutes
Figure 3: Variation of carbon content with increasing contact time at oxidant-to-catalyst ratio of 16
ml/g and 25oC
0
5
10
15
20
25
4 6 8 10 12 14 16
Car
bon r
emoval
(%
)
Oxidant-to-catalyst ratio (ml/g)
15
20
25
30
35
40
45
10 15 20 25 30 35 40 45 50 55 60 65
Car
bon r
emoval
(%
)
Contact time (min)
Waba & al./ Appl. J. Envir. Eng. Sci. 6 N°1(2020) 22-34
29
Figure 4: Variation of carbon content with increasing temperature at oxidant-to-catalyst ratio of 16
ml/g and 60 minutes
Acid treatment
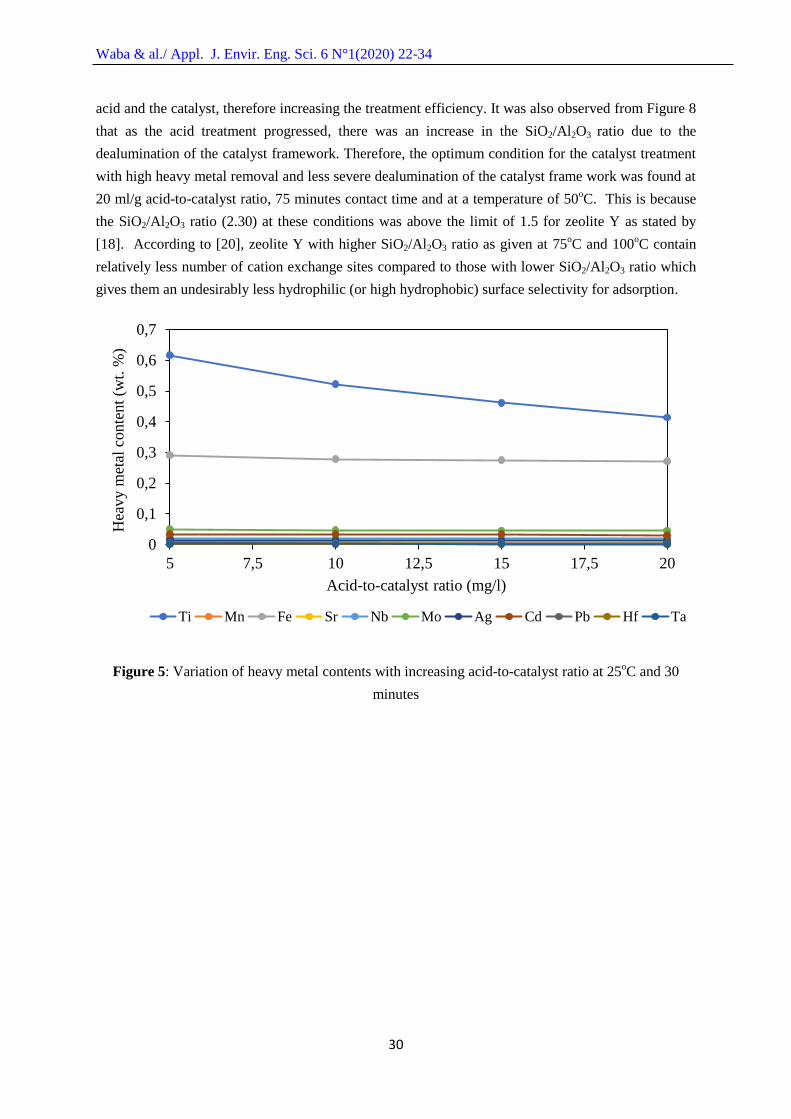
As presented in Figures 5 – 7, there were general decreases in the metal contents with
increase in the operating parameters during the acid treatment. However, only the reduction in Fe and
Ti contents were obvious due to their high contents in the spent FCC catalyst. Figure 5 presents the
result of the treatment spent FCC catalyst with CH3COOH at varying acid-to-catalyst ratio, constant
temperature of 25oC and constant time of 30 minutes. An increase in the acid-to-catalyst ratio led to a
continuous decrease in the Ti content from acid-to-catalyst ratio of 5 to 20 mg/l while only a slight
decrease in the Fe content was observed. This may be due to the higher content of Ti on the catalyst
compared to Fe, which makes it readily available for reaction with the acid. The concentrations of the
heavy metals decreased with increase in acid-to-catalyst ratio, which can be attributed to the
availability of more acid volume for the formation of the metallic salts of the metals.
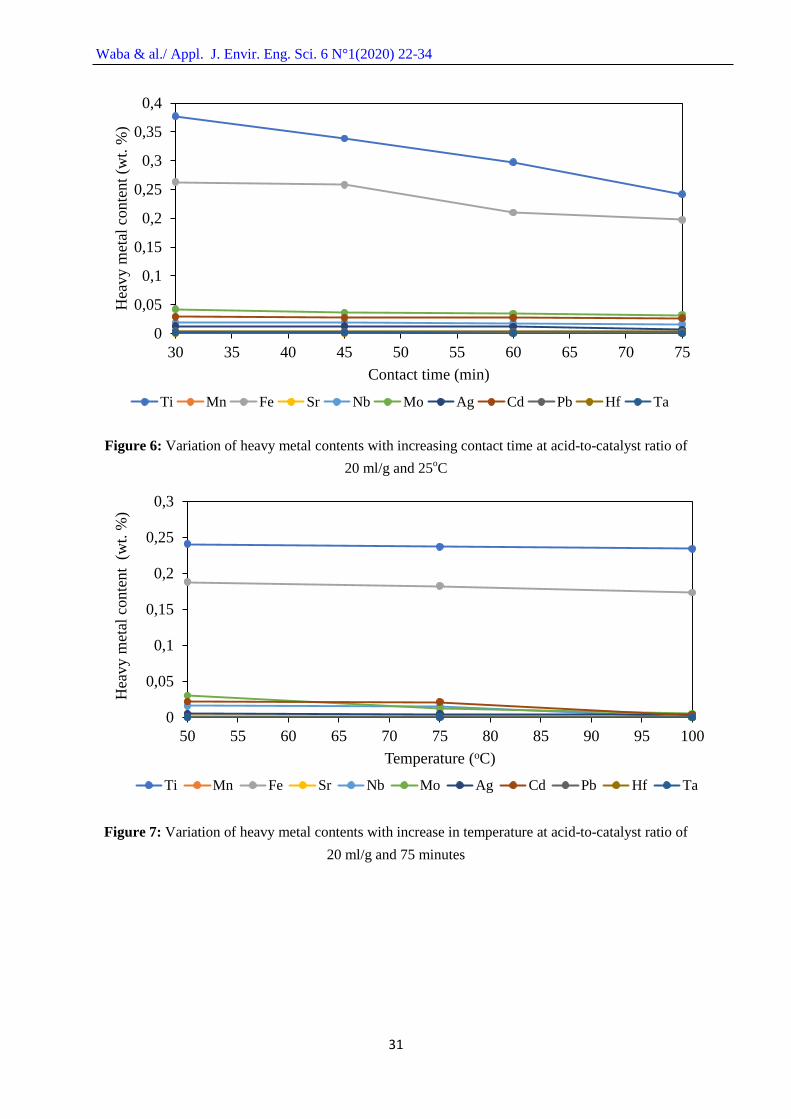
In Figure 6, the effect of contact time on the removal of heavy metals from the spent FCC
catalyst surface at acid-to-catalyst ratio of 20 ml/g and constant temperature of 25oC is presented. The
results revealed that the Ti content decreased steadily from 30 to 75 minutes contact time, while that
of Fe decreased slightly from 30 to 45 minutes and then relatively rapidly from 45 to 60 minutes and
again slightly between 60 to 75 minutes. This could still be as a result of relatively large quantity of
Ti. The reduction in the contents of the heavy metals with increase in contact time could be attributed
to the fact that increase in contact time provides sufficient time for reaction between the acid and the
metals.
Figure 7 shows the effect of temperature on the content of heavy metals on the spent FCC
catalyst at an acid-to-catalyst ratio of 20 ml/g and contact time of 75 minutes. Again, the heavy metals
decreased continuously with increasing temperature from 50oC to 100
oC. As stated earlier, increasing
the treatment temperature reduces the film barrier around the catalyst hindering contact between the
70
72
74
76
78
80
82
84
86
88
90
45 55 65 75 85 95 105
Car
bon r
emoval
(%
)
Temperature (oC)
Waba & al./ Appl. J. Envir. Eng. Sci. 6 N°1(2020) 22-34
30
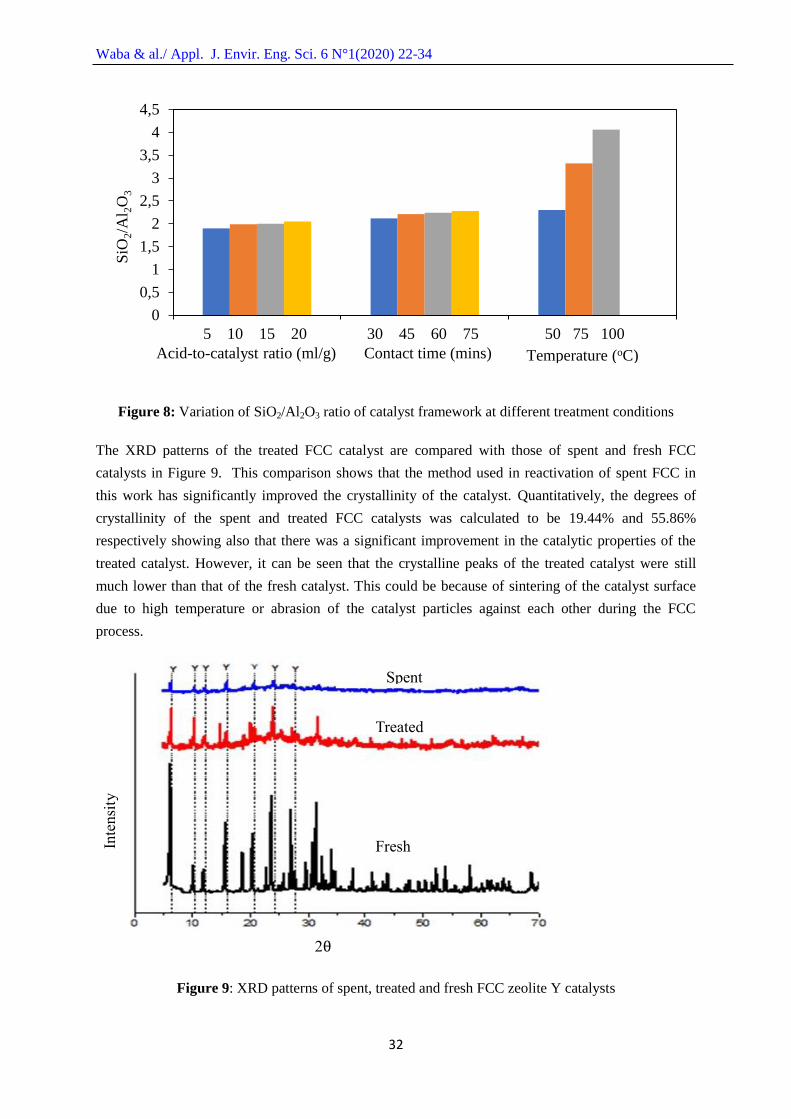
acid and the catalyst, therefore increasing the treatment efficiency. It was also observed from Figure 8
that as the acid treatment progressed, there was an increase in the SiO2/Al2O3 ratio due to the
dealumination of the catalyst framework. Therefore, the optimum condition for the catalyst treatment
with high heavy metal removal and less severe dealumination of the catalyst frame work was found at
20 ml/g acid-to-catalyst ratio, 75 minutes contact time and at a temperature of 50oC. This is because
the SiO2/Al2O3 ratio (2.30) at these conditions was above the limit of 1.5 for zeolite Y as stated by
[18]. According to [20], zeolite Y with higher SiO2/Al2O3 ratio as given at 75oC and 100
oC contain
relatively less number of cation exchange sites compared to those with lower SiO2/Al2O3 ratio which
gives them an undesirably less hydrophilic (or high hydrophobic) surface selectivity for adsorption.
Figure 5: Variation of heavy metal contents with increasing acid-to-catalyst ratio at 25oC and 30
minutes
0
0,1
0,2
0,3
0,4
0,5
0,6
0,7
5 7,5 10 12,5 15 17,5 20
Hea
vy m
etal
conte
nt
(wt.
%)
Acid-to-catalyst ratio (mg/l)
Ti Mn Fe Sr Nb Mo Ag Cd Pb Hf Ta
Waba & al./ Appl. J. Envir. Eng. Sci. 6 N°1(2020) 22-34
31
Figure 6: Variation of heavy metal contents with increasing contact time at acid-to-catalyst ratio of
20 ml/g and 25oC
Figure 7: Variation of heavy metal contents with increase in temperature at acid-to-catalyst ratio of
20 ml/g and 75 minutes
0
0,05
0,1
0,15
0,2
0,25
0,3
0,35
0,4
30 35 40 45 50 55 60 65 70 75
Hea
vy m
etal
conte
nt
(wt.
%)
Contact time (min)
Ti Mn Fe Sr Nb Mo Ag Cd Pb Hf Ta
0
0,05
0,1
0,15
0,2
0,25
0,3
50 55 60 65 70 75 80 85 90 95 100
Hea
vy m
etal
conte
nt
(w
t. %
)
Temperature (oC)
Ti Mn Fe Sr Nb Mo Ag Cd Pb Hf Ta
Waba & al./ Appl. J. Envir. Eng. Sci. 6 N°1(2020) 22-34
32
Figure 8: Variation of SiO2/Al2O3 ratio of catalyst framework at different treatment conditions
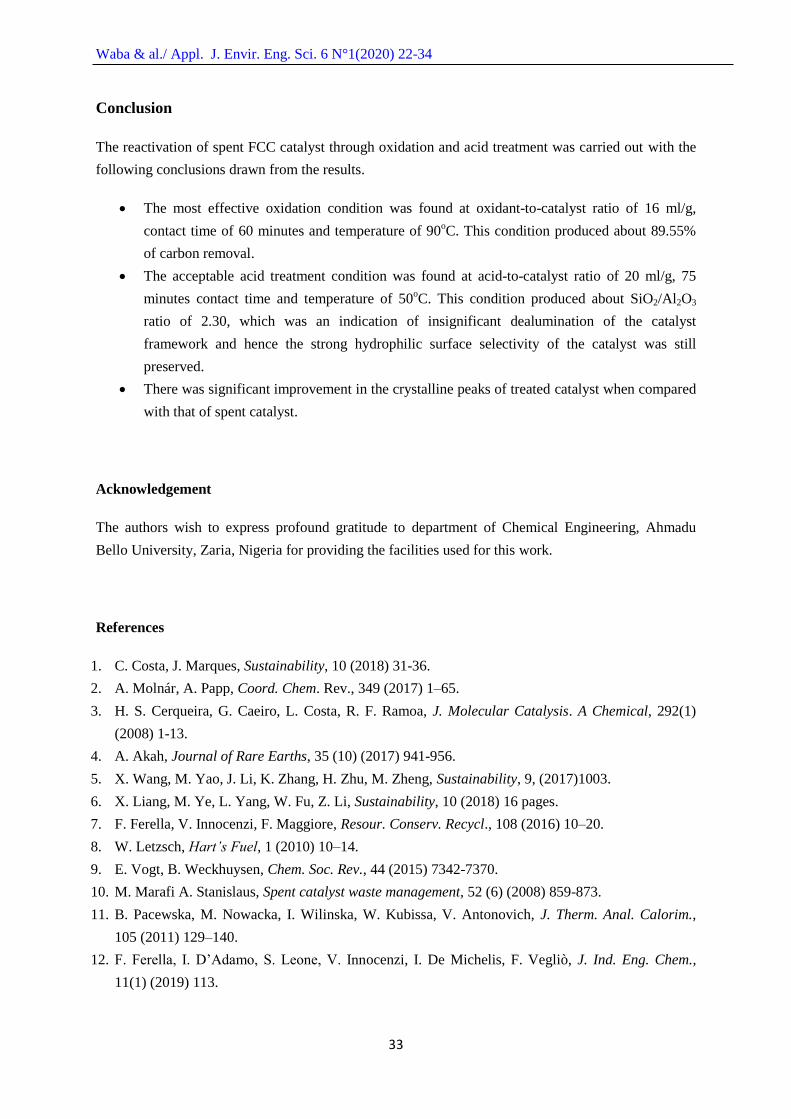
The XRD patterns of the treated FCC catalyst are compared with those of spent and fresh FCC
catalysts in Figure 9. This comparison shows that the method used in reactivation of spent FCC in
this work has significantly improved the crystallinity of the catalyst. Quantitatively, the degrees of
crystallinity of the spent and treated FCC catalysts was calculated to be 19.44% and 55.86%
respectively showing also that there was a significant improvement in the catalytic properties of the
treated catalyst. However, it can be seen that the crystalline peaks of the treated catalyst were still
much lower than that of the fresh catalyst. This could be because of sintering of the catalyst surface
due to high temperature or abrasion of the catalyst particles against each other during the FCC
process.
Figure 9: XRD patterns of spent, treated and fresh FCC zeolite Y catalysts
0
0,5
1
1,5
2
2,5
3
3,5
4
4,5
5 10 15 20 30 45 60 75 50 75 100
SiO
2/A
l 2O
3
Acid-to-catalyst ratio (ml/g) Contact time (mins) Temperature (oC)
Spent
Treated
Fresh Inte
nsi
ty
(a.u
)
2θ
Waba & al./ Appl. J. Envir. Eng. Sci. 6 N°1(2020) 22-34
33
Conclusion
The reactivation of spent FCC catalyst through oxidation and acid treatment was carried out with the
following conclusions drawn from the results.
The most effective oxidation condition was found at oxidant-to-catalyst ratio of 16 ml/g,
contact time of 60 minutes and temperature of 90oC. This condition produced about 89.55%
of carbon removal.
The acceptable acid treatment condition was found at acid-to-catalyst ratio of 20 ml/g, 75
minutes contact time and temperature of 50oC. This condition produced about SiO2/Al2O3
ratio of 2.30, which was an indication of insignificant dealumination of the catalyst
framework and hence the strong hydrophilic surface selectivity of the catalyst was still
preserved.
There was significant improvement in the crystalline peaks of treated catalyst when compared
with that of spent catalyst.
Acknowledgement
The authors wish to express profound gratitude to department of Chemical Engineering, Ahmadu
Bello University, Zaria, Nigeria for providing the facilities used for this work.
References
1. C. Costa, J. Marques, Sustainability, 10 (2018) 31-36.
2. A. Molnár, A. Papp, Coord. Chem. Rev., 349 (2017) 1–65.
3. H. S. Cerqueira, G. Caeiro, L. Costa, R. F. Ramoa, J. Molecular Catalysis. A Chemical, 292(1)
(2008) 1-13.
4. A. Akah, Journal of Rare Earths, 35 (10) (2017) 941-956.
5. X. Wang, M. Yao, J. Li, K. Zhang, H. Zhu, M. Zheng, Sustainability, 9, (2017)1003.
6. X. Liang, M. Ye, L. Yang, W. Fu, Z. Li, Sustainability, 10 (2018) 16 pages.
7. F. Ferella, V. Innocenzi, F. Maggiore, Resour. Conserv. Recycl., 108 (2016) 10–20.
8. W. Letzsch, Hart’s Fuel, 1 (2010) 10–14.
9. E. Vogt, B. Weckhuysen, Chem. Soc. Rev., 44 (2015) 7342-7370.
10. M. Marafi A. Stanislaus, Spent catalyst waste management, 52 (6) (2008) 859-873.
11. B. Pacewska, M. Nowacka, I. Wilinska, W. Kubissa, V. Antonovich, J. Therm. Anal. Calorim.,
105 (2011) 129–140.
12. F. Ferella, I. D’Adamo, S. Leone, V. Innocenzi, I. De Michelis, F. Vegliò, J. Ind. Eng. Chem.,
11(1) (2019) 113.
Waba & al./ Appl. J. Envir. Eng. Sci. 6 N°1(2020) 22-34
34
13. H. Zhang, R. Xiao, D. Wang, Z. Zhong, M. Song, Q. Pan, G. He, Energy Fuels, 23 (12) (2009)
6199-6206.
14. S. M. Sadeghi, J. M. O. M. Jesus, H. M. V. M. Soares, Recycling and Sustainable Dev. 11 (2018)
43-52.
15. K. M. M. Aung, Y. P. Ting, J. Biotechn., 116 (2005) 159-170.
16. F. Beolchini, V. Fonti, F. Ferella, F. Vegliò, J. Hazard Mater., 178 (2010) 529-534.
17. D. Santhiya, Y. Ting, J. Biotechn., 116 (2005) 171-184.
18. S. C. Kim, W. G. Shim, Hazard Materials, 154 (2008) 310-316.
19. Z. Liu, C. Shi, D. Wu, S. He, B. Ren, J. Nanotechn., (2016) Article ID 1486107, 6 pages.
20. S. Kulprathipanja, Zeolites in Industrial Separation and Catalysis. Wiley-VCH New York, USA,
2010.