Embed Size (px)
Citation preview

Evaluation of REMSAD-BRAVO Simulations Using Tracer Data
and Synthesized Modeling
Michael BarnaCooperative Institute for Research in the AtmosphereColorado State University, Fort Collins, CO
Bret Schichtel, Kristi Gebhart and William MalmAir Resources DivisionNational Park Service, Fort Collins, CO
PM Model Performance WorkshopRTP, NC
10-11 February 2004
Acknowledgements
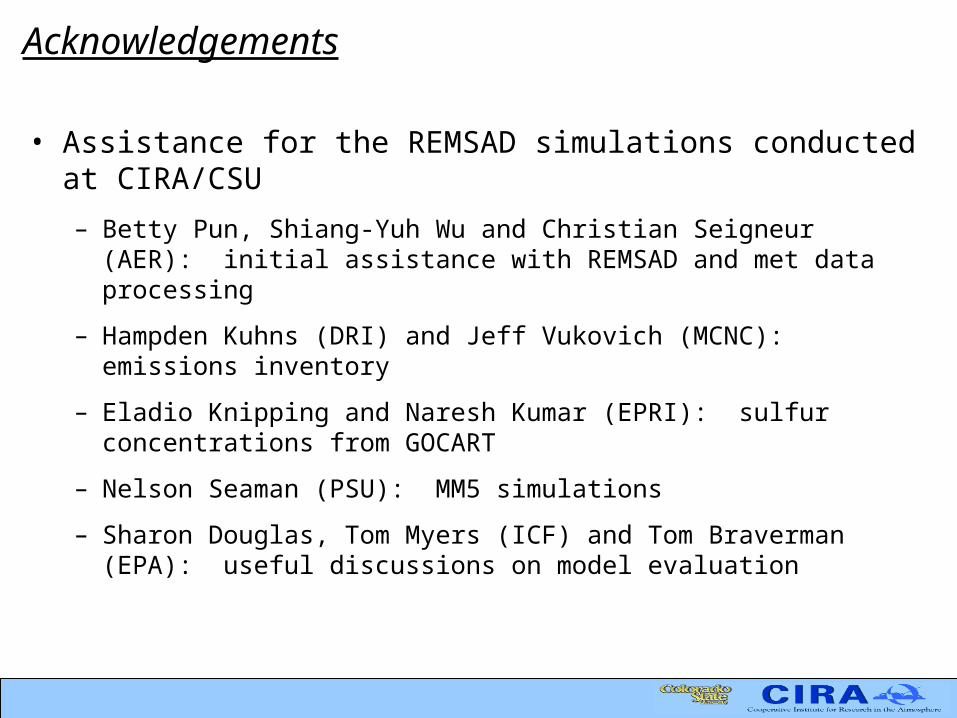
• Assistance for the REMSAD simulations conducted at CIRA/CSU
– Betty Pun, Shiang-Yuh Wu and Christian Seigneur (AER): initial assistance with REMSAD and met data processing
– Hampden Kuhns (DRI) and Jeff Vukovich (MCNC): emissions inventory
– Eladio Knipping and Naresh Kumar (EPRI): sulfur concentrations from GOCART
– Nelson Seaman (PSU): MM5 simulations
– Sharon Douglas, Tom Myers (ICF) and Tom Braverman (EPA): useful discussions on model evaluation

BRAVO: a study designed to understand haze at Big Bend National Park• Big Bend NP is located in remote southwestern
Texas, along the Texas/Mexico border
• Haze has increased in recent years – a rarity for a western park
• BRAVO (Big Bend Regional Aerosol and Visibility Observational Study) investigates the pollution sources that are contributing to this haze
– Field program: July-October 1999
– Many participants:
EPA NPS NOAA
EPRI CSU DRI
TCEQ AER Et al.

Flight Over BBNP Area (5 November 2003)

Who is contributing sulfate to BBNP?• Sulfate is the main constituent of visibility-impairing PM at
BBNP
• Who is contributing?
– the Carbon I/II power plant just over the border?
– sources in eastern Texas?
– sources in the eastern US?
– how large is the influence of the boundary concentrations?
Big Bend, Bext Budget, BRAVO
01020
3040506070
8090
100
7/1 7/15 7/29 8/12 8/26 9/9 9/23 10/7 10/21
1/M
m
Rayleigh Sulfate Nitrate Organics LAC Fine Soil Coarse

BRAVO’s “weight of evidence” approach to determine sulfate attributions
• Don’t rely on one analytical method or model; rather, use “weight of evidence” approach:
Source-oriented models: Receptor-oriented models:
Hybrid models:
REMSAD TrMB “Synthesized REMSAD”
CMAQ FMB “Synthesized CMAQ”

This talk will look at three ways to evaluate the BRAVO air quality simulations
• Simulation of conserved tracers
– Important but somewhat dull (Barna)
• Simulation of sulfate with base emissions
– Important but somewhat dull (Barna)
• Identifying model biases using “synthesis inversion analysis”
– Exciting! (Schichtel)

Evaluating the REMSAD BRAVO sims
• Simulation of conserved tracer
– examine transport and dispersion of conservative tracers
– if model can’t simulate transport and dispersion there’s not point in continuing
• Simulation of sulfate with base emissions
– time series analysis of predicted sulfate against BRAVO and CASTNET monitors
– evaluate different periods to identify potential temporal biases
– evaluate different monitors to identify potential spatial biases
– evaluate at spatial patterns of interpolated observations and predictions – do the match?

Evaluating the REMSAD BRAVO sims (cont’d)
• Use “synthesized inversion modeling” to identify biases with respect to different source regions
– A hybrid approach that starts with attribution results from REMSAD (or CMAQ or any model)
– Use a statistical approach to identify multiplicative terms for each source region that would result in a best fit to the measurement data
– If REMSAD attributions for that source region are
• perfect: scaling coef = 1
• underestimated: scaling coef > 1 (i.e., need to increase)
• overestimated: scaling coef < 1 (i.e., need to decrease)

Simulation of conserved tracers

Predicting transport is the most important aspect of air quality modeling
• No other modeled process, e.g., emissions, deposition, chemical transformation, has as big an impact on model results as transport
• transport = advection + turbulent diffusion
• A tracer experiment is the most robust method for evaluating transport
– Halocarbon tracer is conserved – negligible transformation and deposition
– Detectable at very low concentrations
– We know release rates – can check skill of receptor models for determining attribution
– expensive

BRAVO tracer source and receptor sites
Tracer release sites:•Eagle Pass•San Antonio•Big Brown PP•Parish PP
Tracer receptors at BBNP:
•Persimmon Gap•K-Bar•San Vicente
Example tracer plumes from REMSAD:

Observed and predicted tracer time series
REMSAD Tracer Prediction for BRAVO
-0.5
0.0
0.5
1.0
1.5
2.0
7/1
7/8
7/15
7/22
7/29
8/5
8/12
8/19
8/26
9/2
9/9
9/16
9/23
9/30
10/7
10/14
10/21
10/28
date 1999
mix
ing
rat
io (
pp
qV
)
Obs BBNP3 PDCH (ppqV) TRN.003 BBNP3 SOA-PDCH (ppqV)
REMSAD Tracer Prediction for BRAVO
-0.1
0.0
0.1
0.2
0.3
0.4
0.5
7/1
7/8
7/15
7/22
7/29
8/5
8/12
8/19
8/26
9/2
9/9
9/16
9/23
9/30
10/7
10/14
10/21
10/28
date 1999
mix
ing
rat
io (
pp
qV
)
Obs BBNP3 PPCH (ppqV) TRN.003 BBNP3 POA-PPCH (ppqV)
REMSAD Tracer Prediction for BRAVO
-1
0
1
2
3
4
5
9/17
9/24
10/1
10/8
10/15
10/22
10/29
date 1999
mix
ing
rat
io (
pp
qV
)
Obs BBNP3 PDCB (ppqV) TRN.003 BBNP3 PMF-PDCB (ppqV)
REMSAD Tracer Prediction for BRAVO
-0.1
0.0
0.1
0.2
0.3
0.4
0.5
9/17
9/24
10/1
10/8
10/15
10/22
10/29
date 1999
mix
ing
rat
io (
pp
qV
)
Obs BBNP3 PTCH (ppqV) TRN.003 BBNP3 PEC-PTCH (ppqV)
Eagle Pass Tracer NE Texas Tracer
San Antonio Tracer Houston Tracer
observedpredicted

Performance (or lack thereof?) statisticsEagle Pass NE Texas Houston
San Antonio
Average Observed (ppqV) 0.21 0.00 0.06 0.52
Average Predicted (ppqV) 0.39 0.02 0.03 0.33
R: 0.47 0.34 0.31 0.52
Normalized Gross Error: 412% 130% 74% 70%
Normalized Bias: 380% 65% -71% -24%
• What do we expect for “good performance”? Expecting perfection is naïve….
– Grid models aren’t ideal for simulating plumes – the “real” plumes likely have very strong concentration gradients that won’t be represented by model
– Complex terrain is complex…and will not be resolved at 36 km

Problems with this time series analysis
• Tracer concentrations at two of the four sites are too low for meaningful time series analysis (negative concentrations!), but there is still useful information here
• Looking at the preceding time series, your eye tells you that the model clearly has some skill (e.g., timing of Eagle Pass tracer), but this is not reflected in the bias or error statistics

Comparing interpolated spatial patterns• Need to move beyond simple time series analysis to something more comprehensivie
– How to assess patterns?
– Magnitude
– Concentration gradients
– Spatial shifts (e.g., tomorrow’s predicted pattern matches today’s observed pattern)
-0.3 to 00 to 0.20.2 to 0.40.4 to 0.60.6 to 0.80.8 to 11 to 1.21.2 to 1.41.4 to 1.61.6 to 9.1
ng/m3 2.347
0.057
0.099
0.084
0.7241.232
0.195
0.064
0.081 1.145
0.097
1.7130.029
0.09
ocPDCH (Eagle Pass) on 8/5/1999 (jday 217)
Standard Triangulation
Observed sulfate spatial patterns: Predicted sulfate spatial patterns:

Simulation of sulfate using the base emissions
inventory

REMSAD SO2 and SO4 plumes
Predicted SO2
• Before using REMSAD to assign sulfate source attributions, need to evaluate the “base case”
Predicted SO4

How much skill does REMSAD have in predicting sulfate? (BRAVO sites)
Wichita Mtns
Mtns Guadalupe
Amistad
Stephenville Lake Colorado City
Ft Lancaster Sanderson
Langtry
Brackettville
Laredo
Eagle Pass
LBJ
Falcon Dam Laguna Atascosa
Padre Island Lake Corpus Christi
Pleasanton
Hagerman
Purtis
Ft McKavett Stillhouse
Somerville
Aransas
Everton
San Bernard
Big Thicket
Wright
Center
Rio Grande
Persimmon Gap
Monahans
Esperanza McDonald
Presidio
Ft Stockton
Marathon
Big Bend K-Bar
Ranch
Patman
Creek
0123456789
101112131415
7/1
7/8
7/15
7/22
7/29
8/5
8/12
8/19
8/26
9/2
9/9
9/16
9/23
9/30
10/7
10/14
10/21
10/28
date 1999
con
cen
trat
ion
(u
g/m
3)
Observed Sulfate Predicted Sulfate
0123456789
101112131415
7/1
7/8
7/15
7/22
7/29
8/5
8/12
8/19
8/26
9/2
9/9
9/16
9/23
9/30
10/7
10/14
10/21
10/28
date 1999
con
cen
trat
ion
(u
g/m
3)
Observed Sulfate Predicted Sulfate
0123456789
101112131415
7/1
7/8
7/15
7/22
7/29
8/5
8/12
8/19
8/26
9/2
9/9
9/16
9/23
9/30
10/7
10/14
10/21
10/28
date 1999
con
cen
trat
ion
(u
g/m
3)
Observed Sulfate Predicted Sulfate
0123456789
101112131415
7/1
7/8
7/15
7/22
7/29
8/5
8/12
8/19
8/26
9/2
9/9
9/16
9/23
9/30
10/7
10/14
10/21
10/28
date 1999
con
cen
trat
ion
(u
g/m
3)
Observed Sulfate Predicted Sulfate
0123456789
101112131415
7/1
7/8
7/15
7/22
7/29
8/5
8/12
8/19
8/26
9/2
9/9
9/16
9/23
9/30
10/7
10/14
10/21
10/28
date 1999
con
cen
trat
ion
(u
g/m
3)
Observed Sulfate Predicted Sulfate

How much skill does REMSAD have in predicting sulfate? (BRAVO sites)
July1999:
Sept1999:
Oct1999:
Aug1999:
0
2
4
6
8
10
12
14
16
18
20
0 2 4 6 8 10 12 14 16 18 20
Observed SO4 (ug/m3)
Pre
dic
ted
SO
4 (u
g/m
3)
1:1y = 0.28 x + 0.55R = 0.40
0
2
4
6
8
10
12
14
16
18
20
0 2 4 6 8 10 12 14 16 18 20
Observed SO4 (ug/m3)
Pre
dic
ted
SO
4 (u
g/m
3)
1:1y = 0.84 x - 0.16R = 0.75
0
2
4
6
8
10
12
14
16
18
20
0 2 4 6 8 10 12 14 16 18 20
Observed SO4 (ug/m3)
Pre
dic
ted
SO
4 (u
g/m
3)
1:1y = 0.76 x + 1.17R = 0.63
0
2
4
6
8
10
12
14
16
18
20
0 2 4 6 8 10 12 14 16 18 20
Observed SO4 (ug/m3)
Pre
dic
ted
SO
4 (u
g/m
3)
1:1y = 1.07 x + 1.51R = 0.60

Performance statistics: 37 BRAVO sites
Overall Jul-99 Aug-99 Sep-99 Oct-99
Observed Average (ug/m3) 3.1 2.1 3.5 3.5 2.8
Predicted Average (ug/m3) 3.3 1.1 2.8 3.8 4.6
R 0.61 0.40 0.75 0.63 0.60
Normalized Error 62% 51% 53% 43% 98%
Normalized Bias 1% -41% -43% 2% 78%
Data Completeness 98% 88% 100% 100% 100%

How much skill does REMSAD have in predicting sulfate? (CASTNET sites)
July1999:
Sept1999:
Oct1999:
Aug1999:
0
2
4
6
8
10
12
14
16
18
20
0 2 4 6 8 10 12 14 16 18 20
Observed SO4 (ug/m3)
Pre
dic
ted
SO
4 (u
g/m
3)1:1
y = 0.87 x + 0.53R = 0.92
0
2
4
6
8
10
12
14
16
18
20
0 2 4 6 8 10 12 14 16 18 20
Observed SO4 (ug/m3)
Pre
dic
ted
SO
4 (u
g/m
3)
1:1y = 0.98 x + 0.38R = 0.88
0
2
4
6
8
10
12
14
16
18
20
0 2 4 6 8 10 12 14 16 18 20
Observed SO4 (ug/m3)
Pre
dic
ted
SO
4 (u
g/m
3)
1:1y = 1.03 x + 0.46R = 0.91
0
2
4
6
8
10
12
14
16
18
20
0 2 4 6 8 10 12 14 16 18 20
Observed SO4 (ug/m3)
Pre
dic
ted
SO
4 (u
g/m
3)
1:1y = 1.21 x + 0.49R = 0.87

Overall Jul-99 Aug-99 Sep-99 Oct-99
Observed Average (ug/m3) 4.5 5.8 5.6 4.1 2.6
Predicted Average (ug/m3) 5.0 5.6 6.2 4.5 3.6
R 0.90 0.92 0.91 0.88 0.87
Normalized Error 45% 36% 36% 43% 65%
Normalized Bias 21% 3% 12% 21% 50%
Data Completeness 97% 99% 97% 96% 97%
Performance statistics: 67 CASTNET sites

Monthly spatial patterns of bias
< -50-50 to -25-25 to 00 to 2525 to 5050 to 7575 to 100100 to 125> 125
(%)
-8
40
15
-69
259
-29
-11
0
-34
-4
23
107
-14
-21
6
3
21
-6
14
-14
21
-40
82
17
-82
-25
-58
-27
-22 -24
22
-46
36
1339
-1024
47
3 -8
5
-7
-27
66
202712
3
-78
4
-11
-7
-5
-10
1
56
-7
-20
-22
18
-32
-70
-43-54-39-45-48-40-40
-33-40
-29-29
-45
-42-59-63-53-49-70
-72
-84 -79
-77-67
-47-73
-17
-17-29
-5-9
-66-52
-40
-35
-31
SO4 Normalized Bias (%) July 1999
< -50-50 to -25-25 to 00 to 2525 to 5050 to 7575 to 100100 to 125> 125
(%)
32
39
11
-55
15
-27
25
17
32
7
35
31
20
112
22
0
-3
1
38
21
51
-38
38
17
-66
-8
-65
-15
-15 -21
-3
-43
41
11333
3433
26
58 21
21
3
4
24
2216-1
53
-74
171
-9
12
24
5
8
32
22
-34
11
53
7
-67
-41-41-45-42-37-38-14
-35-34
-15-21
-18
-32-34104-39-41-35
-25
-32 -38
-282
-16-1
-2
-5-18
-10-5
-27-1
40
18
28
-17
10
SO4 Normalized Bias (%) Aug 1999
< -50-50 to -25-25 to 00 to 2525 to 5050 to 7575 to 100100 to 125> 125
(%)
36
37
18
-15
16
-8
31
523
-3
24
37
5
77
10
11
11
13
58
26
-26
12
20
-59
9
-58
-19
20 -1
5
-43
39
31486
3564
26
35 27
19
13
24
82
327-11
18
-70
269
-5
18
51
18
-1
61
39
6
19
548
-17
-67
4-159222013
31-1
6850
50
14916282744
23
26 30
2426
1936
22
1738
2939
2717
24
42
36
24
127
SO4 Normalized Bias (%) Sep 1999
< -50-50 to -25-25 to 00 to 2525 to 5050 to 7575 to 100100 to 125> 125
(%)
63
72
69
8
76
40
45
30-9
103
30
35
37
43
65
0
51
79
45
41
24
90
46
-49
56
-47
8
22 36
-21
8
45
3062
45-12
31
48 18
47
-18
42
142
4423-10
279
-53
46
41
34
87
40
-27
77
38
13
301
104
-34
-46
35253043503030
4952
8173
71
422526476763
69
73 46
5263
7684
52
6268
7765
6948
62
92
100
53
SO4 Normalized Bias (%) Oct 1999

Observed and predicted spatial patterns
0 to 300300 to 600600 to 900900 to 12001200 to 15001500 to 18001800 to 21002100 to 24002400 to 27002700 to 5050
ng/m3 849.892811.645839.51792.188
707.385
638.82
624
825.148851
655.95
554.46
1090.68
600.8
690.46
617.04
591.63636.21
711.08611.71
560.04
266.35
470.98523.07
654.82
609.81
823.26
563.89
982.04
997.071164.94
1368
1157.22
633.15
693.25
1835.12
2676.9
1733.79
806.88
702.7
PIXE S on 8/19/1999 (jday 231)
Standard Triangulation
Observed sulfate Predicted sulfate
0 to 300300 to 600600 to 900900 to 12001200 to 15001500 to 18001800 to 21002100 to 24002400 to 27002700 to 5050
ng/m3 266266
225
213
274
465258
250
245
1049
783
565
472
205233
240317
202
176
151161
248
403
601
926
1214
1337999
1275
1334
480
1019
1082
1879
2060
344
963
REMSAD S on 8/19/1999 (jday 231)
Standard Triangulation
• Need to develop a quantitative metric that describes the agreement between two spatial patterns!

Synthesized inversion modeling

Using models for sulfate source apportionment in BRAVO
• Models can be used for “source attributions”, i.e., “who is causing the pollution at a receptor”
Example: remove SO2 emissions from Texas and re-run the model. How do sulfate concentrations at a receptor site change.
BBNPBBNP
• How this was done for BRAVO: remove SO2 from a source region and re-run REMSAD

Sulfate contributions for each region from REMSAD – “unscramble the sulfate egg”
Base Case Sulfate = Texas Sulfate + E. US Sulfate
+ Mexico Sulfate + W. US Sulfate + Boundary Sulfate

REMSAD daily attributions for sulfate at Big Bend NP for the major source regions
need to add mass here….
...but which sources need to increased or decreased?
and reduce mass here….

Use synthesis inversion modeling to address biases when determining attributions
• Synthesis inversion modeling – a technique for identifying model biases by combining observations with model results
iij
ijiji msGc ci = vector of sulfate observations
Gij = matrix of the source attribution from each source region/time pair to each observation
sj = source attribution scaling coefficients
mi = modeled concentration values
i = errors in ci

Apply scaling factors to original predictions to get “synthesized REMSAD”
0
1
2
3
4
5
6
7
8
July 9 August 9 September 9 October 9
Su
lfa
te S
ou
rce
Att
rib
uti
on
(g
/m3)
OtherWestern USEastern USMexicoTexasObserved S * 3
0%
20%
40%
60%
80%
100%
July 9 August 9 September 9 October 9
Su
lfa
te S
ou
rce
Att
rib
uti
on
(g
/m3)
0
1
2
3
4
5
6
7
8
Ob
se
rve
d S
ulf
ate
(g
/m3)
Texas Mexico Eastern US Western US Other Observed S * 3

New sulfate attributions at Big Bend NP for the BRAVO period
Average Sulfate Attribution at Big Bend
Carbon: 23% (14%)
E. TX: 14% (14%)
39% (23%)
16% (16%)
32% (42%)
6% (9%)
7% (7%)
0 0.2 0.4 0.6 0.8 1
Bndy Cond.
Western US
Eastern US
Texas
Mexico
Source Attribution (mg/m3)

Conclusions• REMSAD is one tool among many used in BRAVO for
developing sulfate source attributions….but we need to try and understand model errors and biases
• Unfortunately, model evaluation is often ambiguous, difficult and incomplete
• We often can’t determine why certain model results arise – it is too hard to analyze the individual processes that drive the results
– “Cloud processing” of SO2 - are clouds in the right place? Rainout?
– Are Mexican emission rates known?
– Are predicted oxidant concentrations correct?
– And lots more conjecture….

Conclusions (cont’d)
• Tracer experiments provide the minimum bar that the model should get over – if transport can’t be simulated then everything else is suspect
• Longer simulations (months) are necessary to elucidate temporal biases
• Larger domains (continental) are necessary to elucidate spatial biases
• We need better tools than the “standard issue” time series analyses
– Synthesized inversion to merge observations with model predictions to identify
– Develop a metric that describes the agreement between spatial patterns

Conclusions (cont’d)
• Don’t trust one model; rather, examine results from both receptor models and regional models
• Questions:
– [email protected] (synthesis inversion)
Source Attributon of Big Bend's Sulfate
0
5
10
15
20
25
30
35
40
45
50
Carbon Mexico Texas E. US W. US OtherS
ulf
at S
ou
rce
Att
rib
uti
on
(%
)
Synthesized CMAQSynthesized REMSADScaled FMBRScaled TrMB
Original Source Attributon of Big Bend's Sulfate
0
10
20
30
40
50
60
Carbon Mexico Texas EasternUS
WesternUS
B.C.Su
lfat
So
urc
e A
ttri
bu
tio
n (
%)
CMAQ REMSAD FMBR - MM5 TRMB - MM5