Embed Size (px)
Citation preview

Energetics of chromospheric flares: Continuum radiation
P. Heinzel

Solar white-‐light flare (WLF)
Mauas+ 1991

!"#"$%&""'(')"
!*"##"$%&""+,-"
./"##"0"1"2""(3,,"
45"##"6"1"!""+7++"
The solar VUV spectrum

Milligan+ 2014
about 15% of the total non-thermal energy radiated in these lines and continuum channels

Two types of WLFs
Hydrogen free-bound recombination continuum (e.g. Balmer) enhancement (chromosphere)
Visible-continuum enhancement due to H-minus
opacity (photosphere)
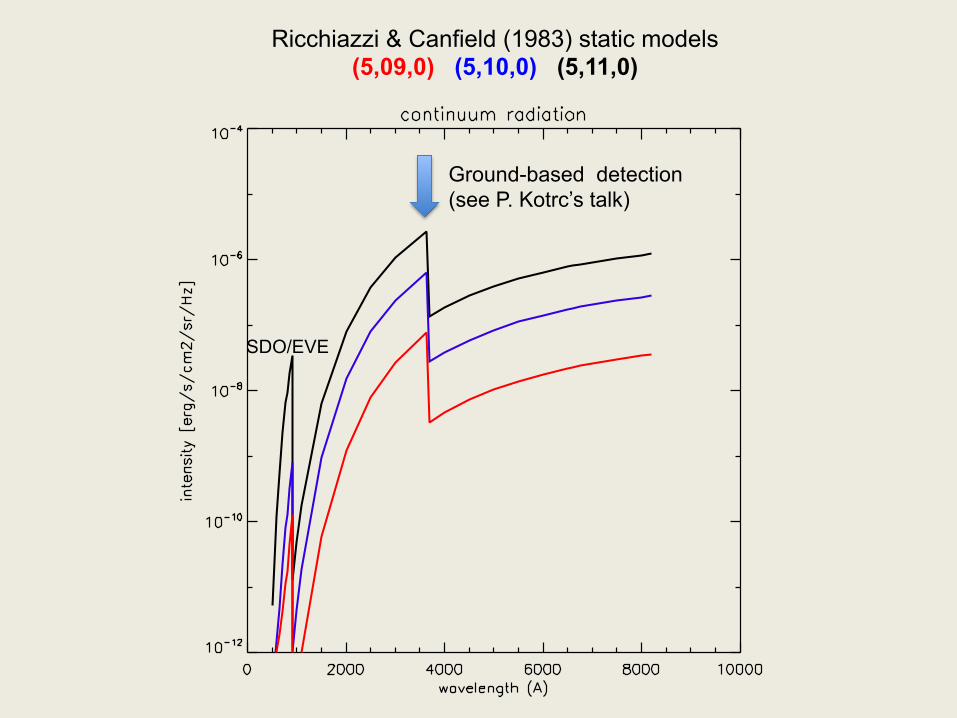
Ricchiazzi & Canfield (1983) static models (5,09,0) (5,10,0) (5,11,0)
Ground-based detection (see P. Kotrc’s talk)
SDO/EVE

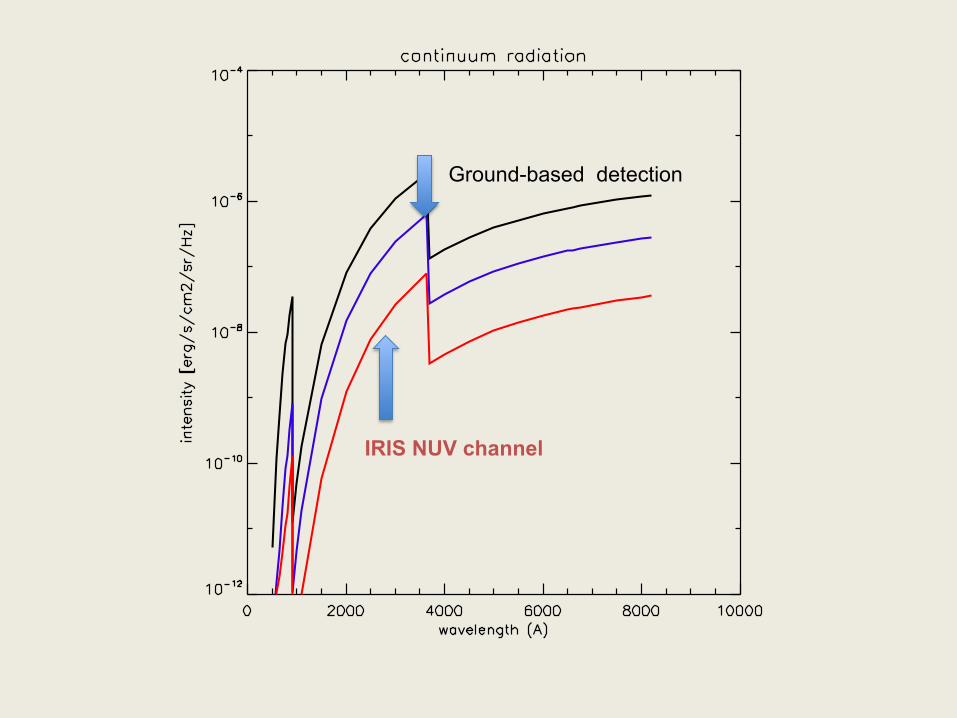
Ground-based detection
IRIS NUV channel

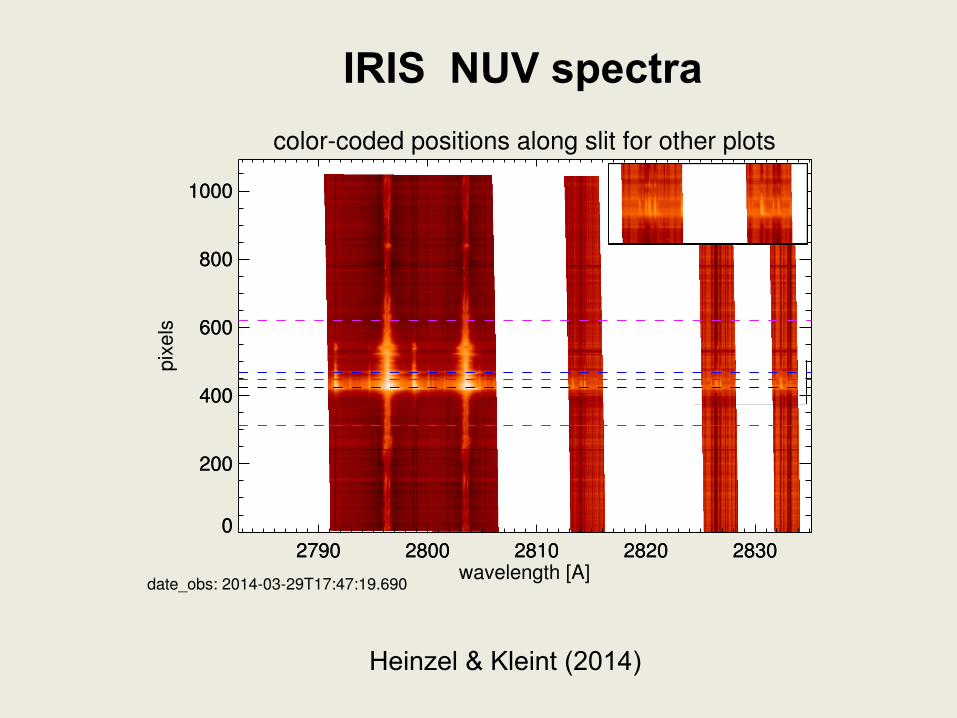
color-coded positions along slit for other plots
2790 2800 2810 2820 2830wavelength [A]
0
200
400
600
800
1000
pix
els
2790 2800 2810 2820 28300
200
400
600
800
1000
date_obs: 2014-03-29T17:47:19.690
IRIS NUV spectra
Heinzel & Kleint (2014)
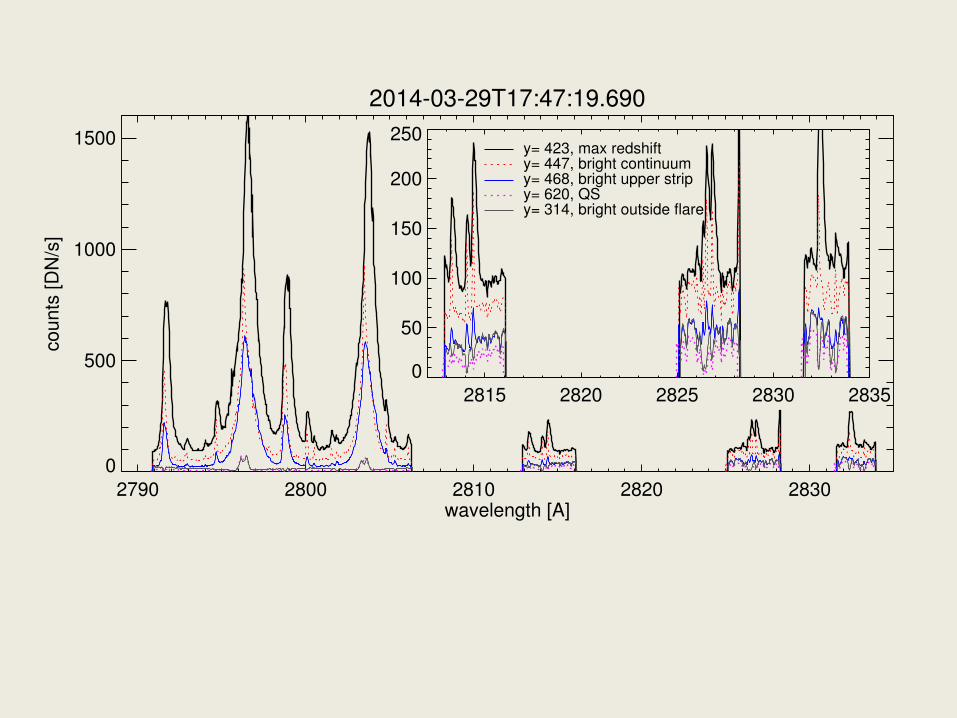
2014-03-29T17:47:19.690
2790 2800 2810 2820 2830wavelength [A]
0
500
1000
1500
counts
[D
N/s
]
y= 423, max redshifty= 447, bright continuumy= 468, bright upper stripy= 620, QSy= 314, bright outside flare
2815 2820 2825 2830 28350
50
100
150
200
250
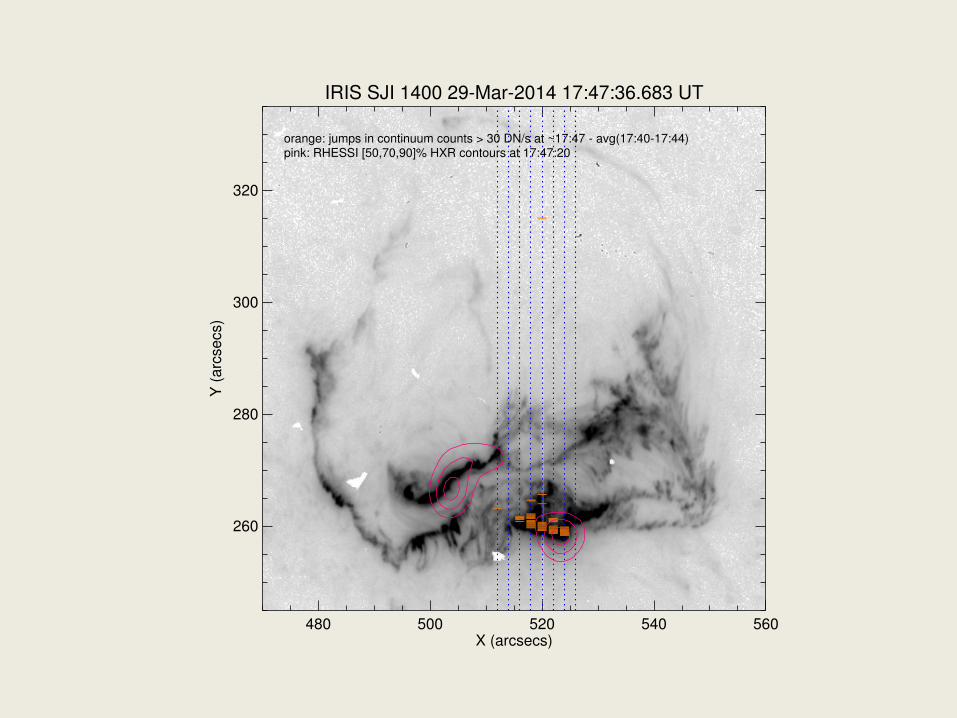
IRIS SJI 1400 29-Mar-2014 17:47:36.683 UT
480 500 520 540 560X (arcsecs)
260
280
300
320
Y (
arc
secs
)
______ _________
________
____________
__
_____________
__________
orange: jumps in continuum counts > 30 DN/s at ~17:47 - avg(17:40-17:44)pink: RHESSI [50,70,90]% HXR contours at 17:47:20
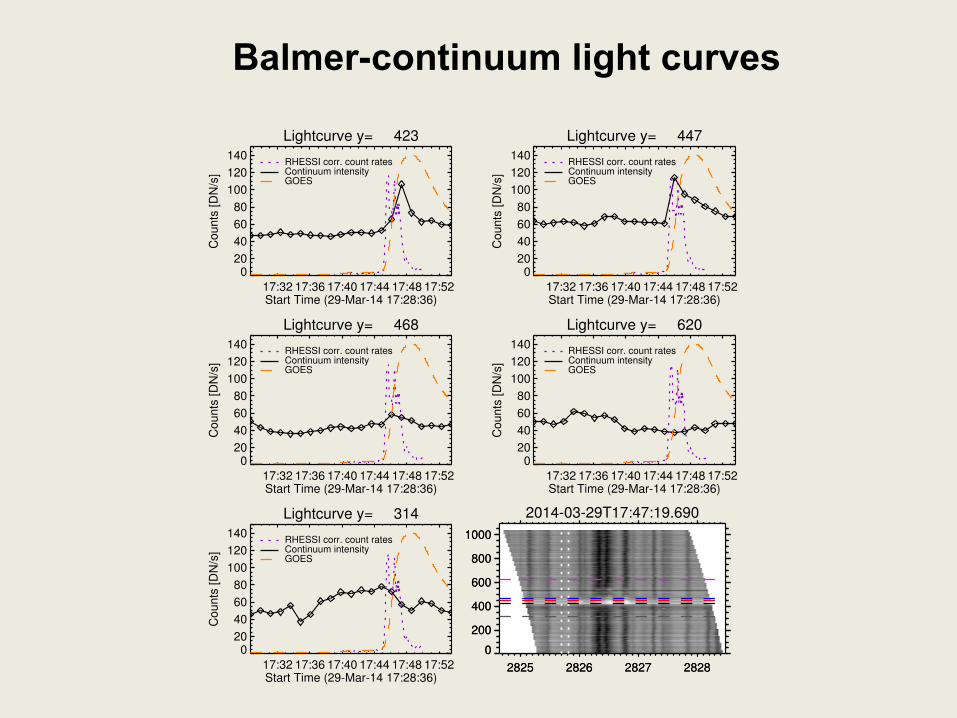
Lightcurve y= 423
17:32 17:36 17:40 17:44 17:48 17:52Start Time (29-Mar-14 17:28:36)
020
40
60
80
100
120
140
Counts
[D
N/s
]
RHESSI corr. count ratesContinuum intensityGOES
Lightcurve y= 447
17:32 17:36 17:40 17:44 17:48 17:52Start Time (29-Mar-14 17:28:36)
020
40
60
80
100
120
140
Counts
[D
N/s
]
RHESSI corr. count ratesContinuum intensityGOES
Lightcurve y= 468
17:32 17:36 17:40 17:44 17:48 17:52Start Time (29-Mar-14 17:28:36)
020
40
60
80
100
120
140
Counts
[D
N/s
]
RHESSI corr. count ratesContinuum intensityGOES
Lightcurve y= 620
17:32 17:36 17:40 17:44 17:48 17:52Start Time (29-Mar-14 17:28:36)
020
40
60
80
100
120
140
Counts
[D
N/s
]
RHESSI corr. count ratesContinuum intensityGOES
Lightcurve y= 314
17:32 17:36 17:40 17:44 17:48 17:52Start Time (29-Mar-14 17:28:36)
020
40
60
80
100
120
140
Counts
[D
N/s
]
RHESSI corr. count ratesContinuum intensityGOES
2014-03-29T17:47:19.690
2825 2826 2827 2828
0
200
400
600
800
1000
2825 2826 2827 2828
0
200
400
600
800
1000
Balmer-continuum light curves
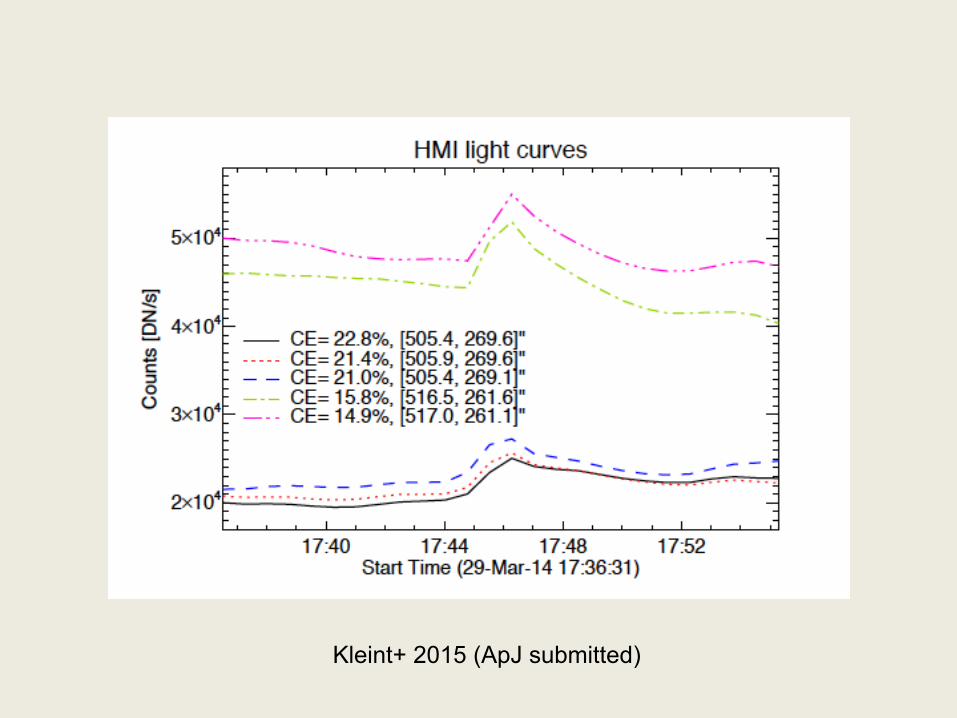
Kleint+ 2015 (ApJ submitted)


Kleint+ 2015 Heinzel & Kasparova 2015

Flare radiative output in the continuum:
Kleint+ 2015 - Balmer continuum added and backwarming tested for X-class flare of 29 March 2014
Balmer-continuum radiation losses – 3.8 1010 erg s-1 cm-2
fits the IRIS data
WL radiation losses (FLA model) - 2.4 1010 erg s-1 cm-2
electron-beam energy deposit (RHESSI) - 3.5 1011 erg s-1 cm-2
about 10 % of deposited energy is radiated in the continua
some energy radiated away in spectral lines
rougly 80 – 90 % goes into heating and dynamics

Set of 1D plane-parallel equations of RHD Flarix code
non-thermal coll. rates non-equilibrium hydrogen ionization
beam heating Q
Kasparova+ 2009 Varady+ 2010
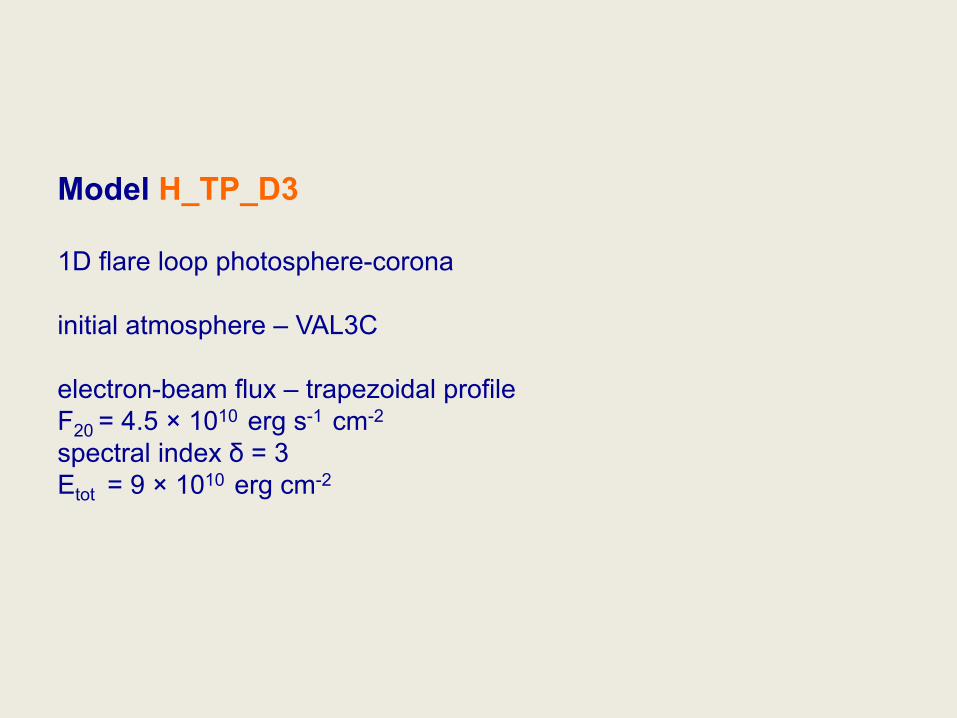
Model H_TP_D3 1D flare loop photosphere-corona initial atmosphere – VAL3C electron-beam flux – trapezoidal profile F20 = 4.5 × 10¹⁰ erg s-1 cm-2 spectral index δ = 3 Etot = 9 × 10¹⁰ erg cm-2


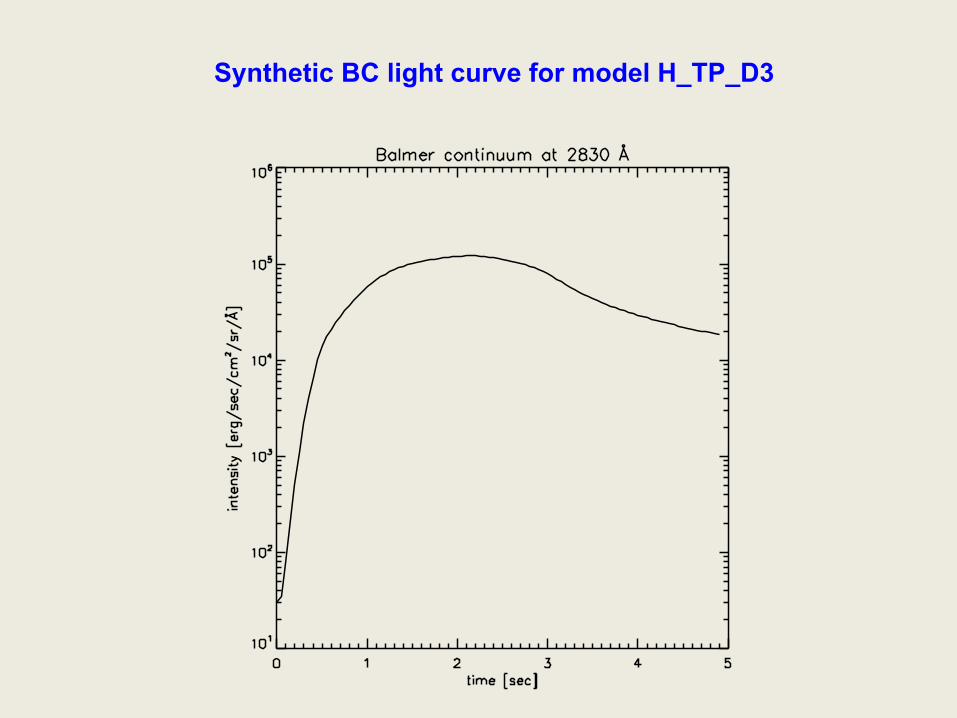
Synthetic BC light curve for model H_TP_D3

constrained by IRIS NUV spectra

Summary
§ RHD time variations of the Balmer-continuum emission are consistent with IRIS-NUV light curves
§ Slow non-equilibrium hydrogen recombination is well reflected in BC light curves
§ For a short trapezoidal electron-beam pulse the synthetic intensity is a factor of five lower than IRIS spectra from an X-class flare
§ A series of beam pulses should lead to a stronger Balmer continuum more consistent with the IRIS spectra
§ Radiative cooling is dominated by Balmer and Paschen continuum => significant amount of deposited energy is radiated away in subordinate continua

The research leading to these results has received funding from the European Community's Seventh Framework Programme (FP7/2007-‐2013) under grant agreement no. 606862 (F-‐CHROMA)


![MHD Wave Modes Resolved in Fine-Scale Chromospheric … · MHD Wave MoDeS ReSoLveD in Fine‐SCaLe CHRoMoSpHeRiC MagnetiC StRuCtuReS 435 Erdélyi [2009]). However, what causes their](https://img.dokumen.tips/doc/110x75/5e6ceebc20674f6d791c9507/mhd-wave-modes-resolved-in-fine-scale-chromospheric-mhd-wave-modes-resolved-in-fineascale.jpg)