Embed Size (px)
DESCRIPTION
Observational evidences of the propagating waves in/above chromospheric network. Peter Gömöry Astronomical Institue of the Slovak Academy of Sciences. Institut d’Astrophysique Spatiale, Orsay, France. Motivation (I). - PowerPoint PPT Presentation
Citation preview
Observational evidences of the propagating waves in/above
chromospheric network
Peter GömöryAstronomical Institue of the Slovak Academy of Sciences
Institut d’Astrophysique Spatiale, Orsay, France
Motivation (I)• previous work based on analysis of the SOHO/CDS measurements
(Gömöry et al. 2006, A&A 448, 1169) – target: chromospheric network near the center of the solar disk
– spectral lines: He I 584.33 Å (log T = 4.5) → chromosphere
O V 629.73 Å (log T = 5.3) → transition region
Mg IX 368.07 Å (log T = 6.0) → corona
– analyzed parameters: temporal variations of the I and vD
– techniques: cross-correlations, wavelet and phase difference analysis
• determined results – significant negative time shift of ~27 s between temporal variations of the
He I and O V intensities
– determined time shift dominated by oscillations with ~300 s periodicity
– no relevant time shift between temporal variations of the He I and O V Doppler shifts
– only very ambiguous results based on the analysis of the temporal variations of the Mg IX intensities and Doppler shifts
Institut d’Astrophysique Spatiale, Orsay, France

Motivation (II)• interpretation of the results
– negative time shift between the He I and O V intensities and no time shift between their Doppler shifts → non-radiative energy had to be transferred from transition region to chromosphere without any significant bulk mass motion downward propagating magneto-acoustic waves in network
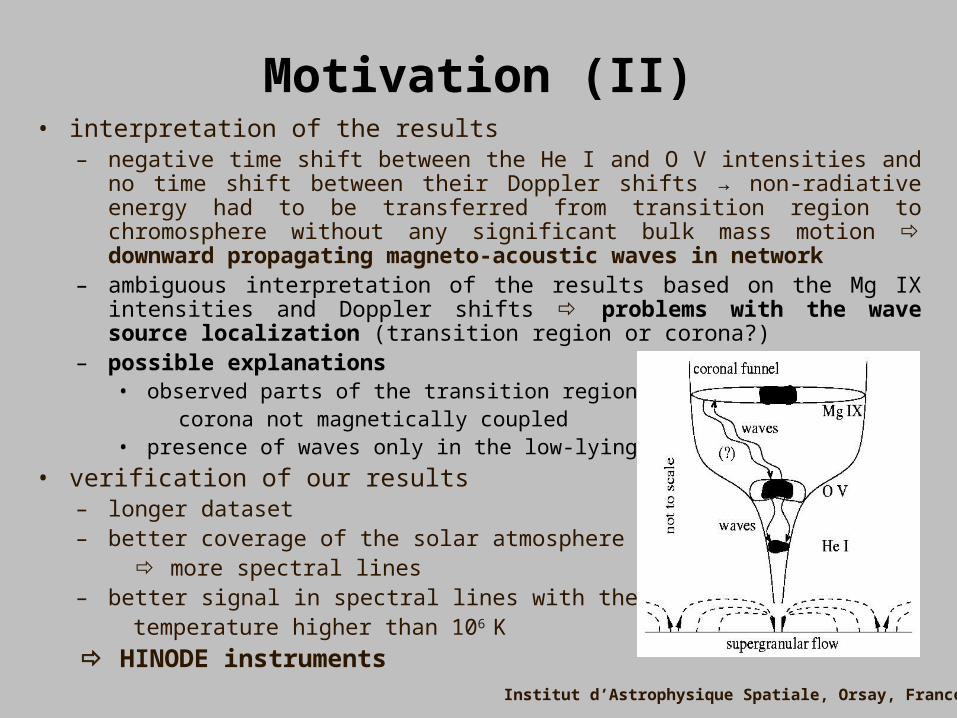
– ambiguous interpretation of the results based on the Mg IX intensities and Doppler shifts problems with the wave source localization (transition region or corona?)
– possible explanations• observed parts of the transition region and corona not magnetically coupled• presence of waves only in the low-lying loops
• verification of our results– longer dataset– better coverage of the solar atmosphere more spectral lines– better signal in spectral lines with the formation temperature higher than 106 K
HINODE instrumentsInstitut d’Astrophysique Spatiale, Orsay, France
Motivation (II)• interpretation of the results
– negative time shift between the He I and O V intensities and no time shift between their Doppler shifts → non-radiative energy had to be transferred from transition region to chromosphere without any significant bulk mass motion downward propagating magneto-acoustic waves in network
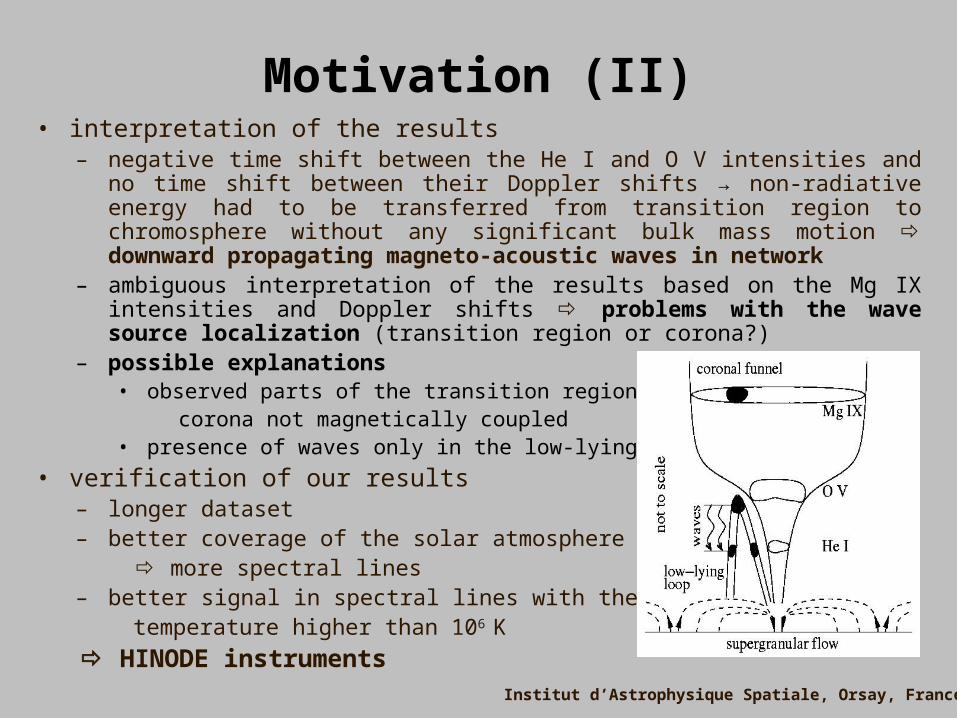
– ambiguous interpretation of the results based on the Mg IX intensities and Doppler shifts problems with the wave source localization (transition region or corona?)
– possible explanations• observed parts of the transition region and corona not magnetically coupled• presence of waves only in the low-lying loops
• verification of our results– longer dataset– better coverage of the solar atmosphere more spectral lines– better signal in spectral lines with the formation temperature higher than 106 K
HINODE instrumentsInstitut d’Astrophysique Spatiale, Orsay, France
HINODE data (I)• HINODE/EIS → spectroscopic measurements of the TR and corona
– target: chromospheric network near the center of the solar disk
– date/time: August 18, 2007; 10:49 UT – 13:20 UT
– 11 spectral lines: • He II 256 Å (log T = 4.9); Fe VIII 185 Å (log T = 5.6); Si VII 275 Å (log T = 4.9) →
transition region• Fe X 184 Å (log T = 6.0); Fe XII 195 Å (log T = 6.1); Fe XIII 196 Å (log T = 6.2);
Fe XIII 202 Å (log T = 6.2); Fe XIII 203 Å (log T = 6.2); Fe XV 284 Å (log T = 6.3); Ca XVII 192 Å (log T = 6.7); Fe XXIV 192 Å (log T = 7.2) → corona
– observing modes: • 2D rasters → spatial coalignment with other data (DOT,TRACE, SoHO/EIT,CDS)
– number of repetitions: 6 (3 before and 3 after “sit-and_stare” mode)
– slit: 2” × 304”
– step in X direction: 2”; number of steps: 41” FOV: 82” × 304”
• 1D “sit-and-stare” → temporal evolutions of the I and vD in/above network
– number of repetitions: 5
– exposure time: 10 s + readout; number of exposures per one run: 135
– duration of one run: ~25 min. total duration: ~ 125 min. (~2 hours)
– slit: 2” × 304” Institut d’Astrophysique Spatiale, Orsay, France
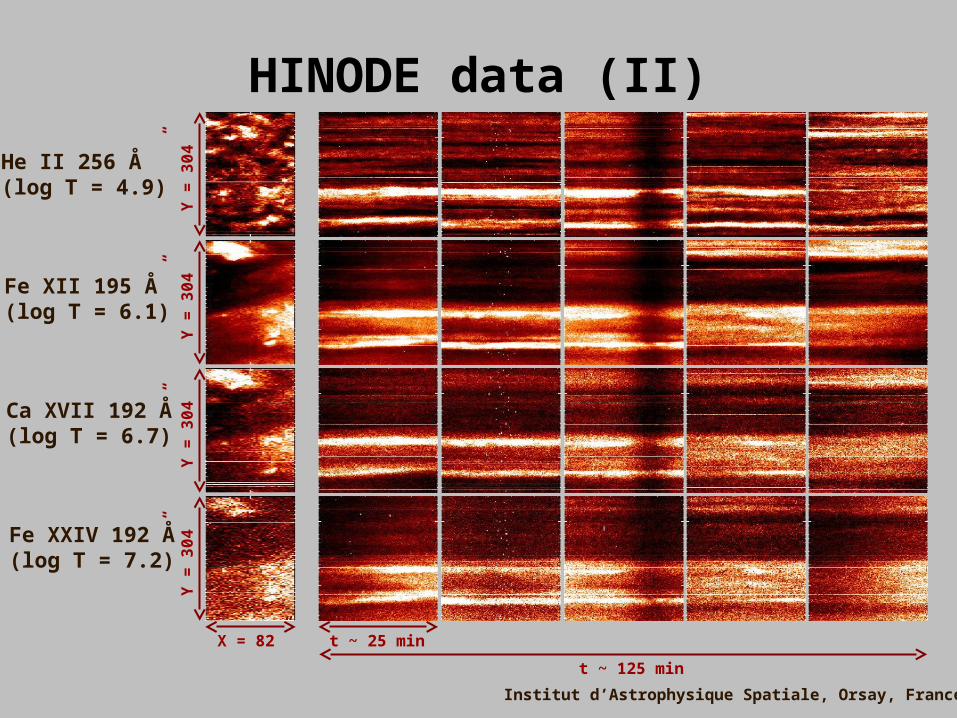
HINODE data (II)
Institut d’Astrophysique Spatiale, Orsay, France
He II 256 Å (log T = 4.9)
Ca XVII 192 Å (log T = 6.7)
Fe XII 195 Å (log T = 6.1)
Fe XXIV 192 Å (log T = 7.2)
Y =
30
4”
Y =
30
4”
Y =
30
4”
Y =
30
4”
X = 82” t ~ 25 min
t ~ 125 min
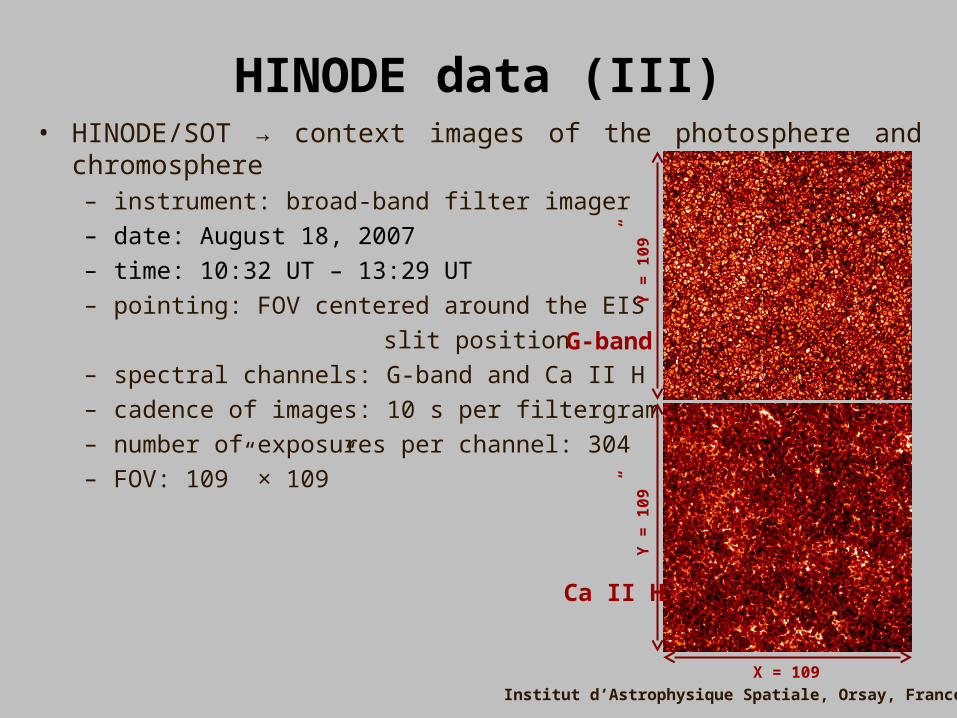
HINODE data (III)• HINODE/SOT → context images of the photosphere and chromosphere
– instrument: broad-band filter imager
– date: August 18, 2007
– time: 10:32 UT – 13:29 UT
– pointing: FOV centered around the EIS
slit position
– spectral channels: G-band and Ca II H
– cadence of images: 10 s per filtergram
– number of exposures per channel: 304
– FOV: 109” × 109”
Institut d’Astrophysique Spatiale, Orsay, France
X = 109”
Y =
10
9”
Y =
10
9”
G-band
Ca II H
Planned analysis• similar to our previous work (i.e. cross-correlations, wavelet analysis,
phase difference analysis) but applied on much more complex dataset taken on August 18, 2007
• dataset– HINODE/EIS: spectroscopy → searching for the evidences of propagating
waves in the transition region and corona
– HINODE/SOT: imaging → photospheric and chromospheric response to propagating waves; dynamics of bright points → possible source of waves
– SoHO/CDS: spectroscopy → presence of possible waves in the upper chromosphere and transition region
– SoHO/MDI: magnetometry → changes in the photospheric magnetic field → physical mechanism responsible for the excitation of waves
– SoHO/EIT: imaging → context images of the chromosphere and corona
– TRACE: imaging → context images of the corona
– DOT: imaging → photospheric and chromospheric response to propagating waves; Hα channel with high spatial resolution
Institut d’Astrophysique Spatiale, Orsay, France