Embed Size (px)
Citation preview

Chromospheric and Transition Region
Signatures of Emerging Magnetic Flux Bubbles
Viggo H. Hansteen & Ada OrtizLuis Bellot, Jaime de la Cruz
Mats Carlsson, Bart De Pontieu Luc Rouppe van der Voort
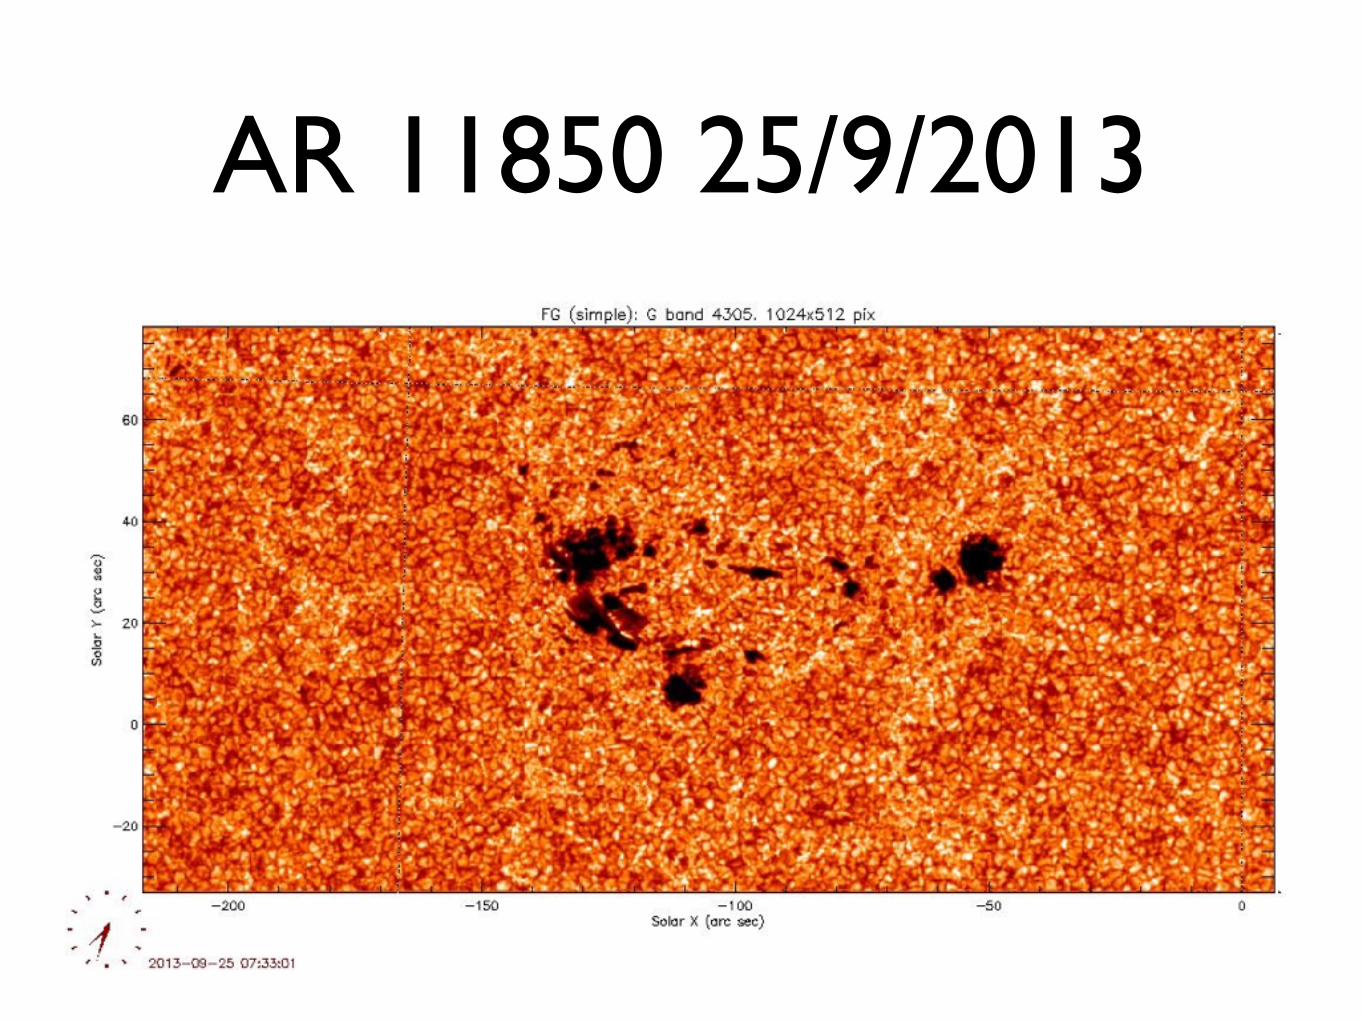
AR 11850 25/9/2013

Schmieder & Pariat 2007 Scholarpedia 2(12):4335
…complex evolution as field and plasma rise into outer atmosphere.

What do we observe when field penetrates photosphere and rises into outer atmosphere?
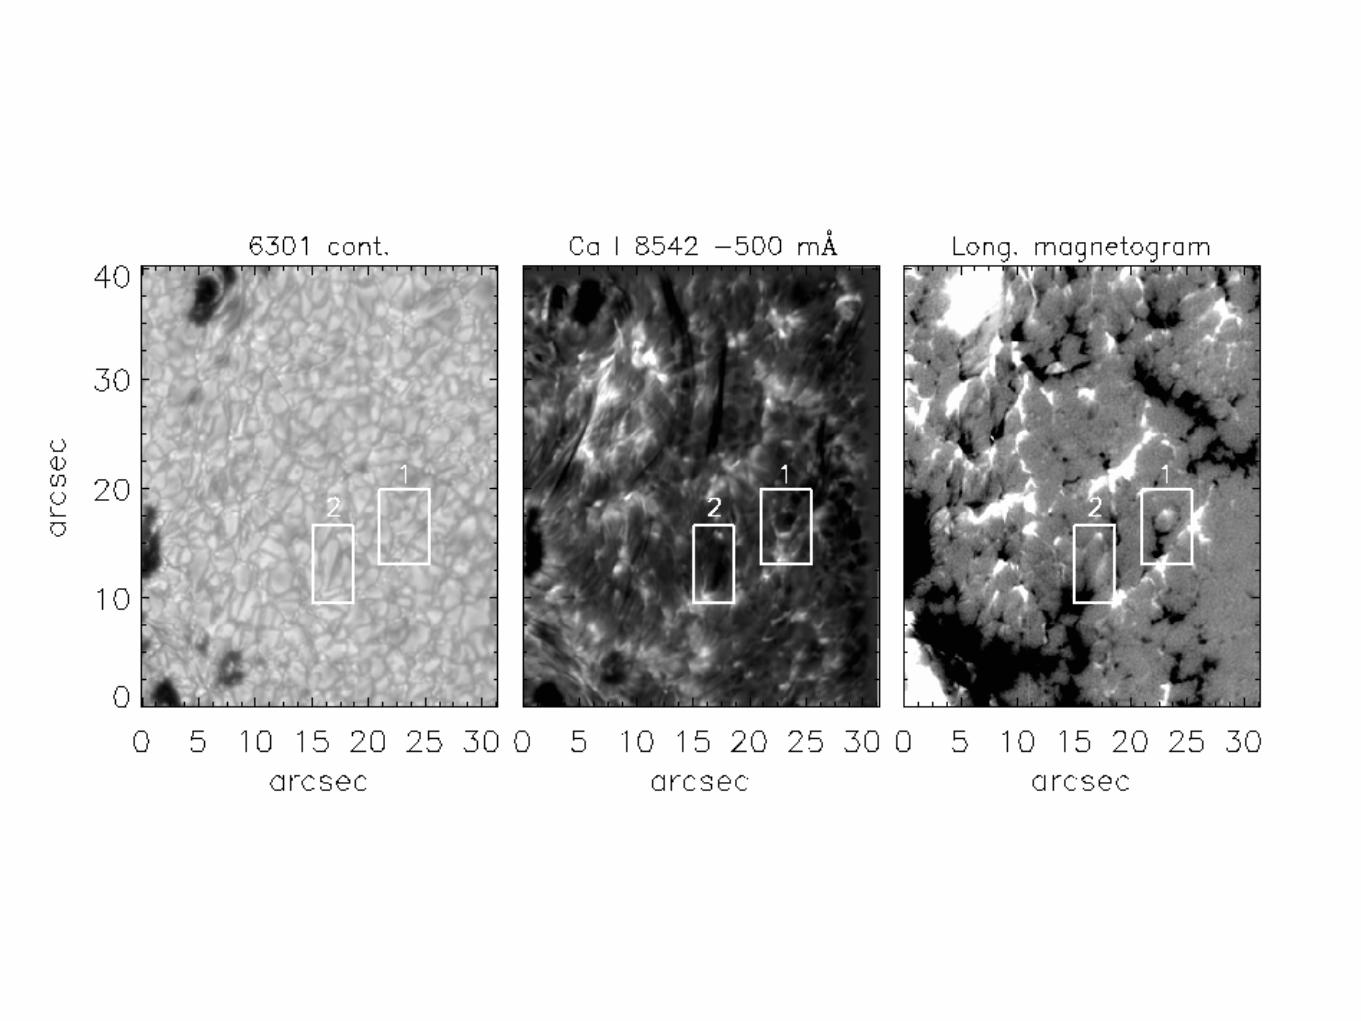
Swedish 1-meter Solar Telescope (SST) observations
Ortiz et al. 2014, ApJ 781, 126see also Title 1994, AAS 26, 1464, Strous et al. 1996, A&A 306, 947, and Strous & Zwaan ApJ 527, 435

1. Field breaks through photosphere in the form of bubbles
2. Pushing aside and/or reconnecting with ambient field
3. Large perturbations to upper atmosphere properties
Small scale flux emergence
Archontis & Hansteen 2014 ApJL 788 L2Ortiz et al. 2014 ApJ 781 126

Simulations •BIFROST: MHD+RT •24x24 Mm box •Vertical range: -2.5 Mm to +14 Mm above •3360 G flux sheet injected at lower boundary for 105 min
Ortiz et al. 2014, ApJ 781, 126

What happens when small scale bubble interacts with the overlying atmosphere and field?

SST and IRIS observations
AR 11850 25/9/2013

IRIS Slit Jaws

25 September 2013: case 1
Schematic representation of flux emergence event #1
Configuration of the magnetic field lines at 09:11:34 UT
Positive (white) polarities
Negative (black) polarities
Newly emerged bipole
Pre-existing loop(s)

SJI 1400: …both dark bubble and bright footpoints, some indication of loops joining
Ca 854.2 -60 nm: Dark bubble and (later) bright footpoints

Event #1 movieLP CP Ca 854.2 SJI 1400Mg II 2796
Hα
Ca 854.2

IRIS slit
This case is located right at the IRIS spectrograph slit!
Event #2 movie

Wavelength
Time
Time-sliced spectra at highlighted pixel:
history of event #2
LP pierces photosphereBlue shift in Ca 8542
Blue shift in Mg II k 2796
Blue shift in Si IV 1403
Ortiz et al. 2015, in prep

Transient blueshifts within the dark bubble region
Ca II 8542 blueshift and strong emission at
08:54:16 UT
Si IV blueshifts at 09:02:11 UT
… and 8 minutes later, higher up …
4 ideas: 1. everything happens within the dark bubble
perimeter2. plasma moving upwards3. delay4. transient events

… can’t say too much about the corona … yet!Our emerging loop reaches the TR! but …

Connection between Hinode/XRT or SDO/AIA and small scale emergence far from obvious…

Ni II 139.3 nm
Absorption due to high cool (cold loops)

Discussion/Summary
• Can follow small scale flux emergence (in active regions) from photosphere through chromosphere to transition region and perhaps beyond
• Observations, inversions, and simulations tell a quantitatively consistent story
• Pre-existing ambient field plays an important role
• High lying, cool material with high opacity can obscure coronal response
• How much of AR heating is due to reconnection of ambient field with fresh new field from below?

Flux emergence: a trilogy. Paper IIIOrtiz et al. (2015, to be submitted)
Up, up and above!: connecting SST - IRIS - SDO observations
• This paper takes the study initiated in Ortiz et al. (2014) and de la Cruz Rodriguez (2015) further up in the atmosphere.
• Goal: to follow a single event of magnetic flux emergence from the photosphere to the corona with unprecedented spatial, spectral and temporal resolution, presenting thus an integral multi-wavelength study of the solar atmosphere in a case of FE.
• IRIS: 25 September 2013; AR11850: four-step dense raster
• Slit -jaw images: 1330 (TR), 1400 (TR), 2796 (upper chrom.) and 2832 Å (photosphere)
• FOV=50” x 51”
•Rasters in 3 spectral windows:
•FUV 1: 1331.6 - 1358.4 Å (C II)
•FUV 2: 1380.6 - 1406.6 Å (Si IV)
•NUV: 2782.6 - 2833.9 Å (Mg II k)
IRIS
• AIA/SDO images at 171 (Fe IX, upper TR), 193 (Fe XII, corona) and 304 (He II,. chromosphere & TR) ÅAIA
• CRISP @ 1-m SST: 25 September 2013; AR11850: flux emergence
• Scans of Fe I 6302.5 Å (full Stokes), 6563 Å and Ca II 8542 Å:
•1 + 15 + 25 points sequence in 11 s.
• sampling = 200 mÅ for Halpha and 100 mÅ for Ca IR
• FOV=60” x 60”
SST


Time: 7 minutes 1 min. / time step
Wavelength Photosphere Chromosphere
core - 400 mÅ - 600 mÅ - 300 mÅ - 200 mÅ - 100 mÅ
Dark bubbles

Velocities
upflow: -2.4 km/s
upflow: -2 km/s
downflows: 2-3.5 km/s
Time
chromospheric upflows: -5 km/s
Height Photosphere
Chromosphere

Numerical simulations: structuring of atmospheric parameters

Numerical simulations: shape of Ca II 8542 profiles
Using the 3D MHD simulations to understand the profiles:
• The emission is present on both wings without a velocity gradient. The displacement of the absorption profile blocks the peak in the blue wing and reduces the opacity in the red wing (Scharmer 1984).
• The source function increases exactly when the temperature drops steeply at the base of the bubble. non-LTE behaviour already from z~450 km.