Embed Size (px)
Citation preview
Research in Astron. Astrophys. 2014 Vol. 9 No. XX, 000–000http://www.raa-journal.org http://www.iop.org/journals/raa
Research inAstronomy andAstrophysics
Chromospheric activity on several single late-type stars
Li-Yun Zhang1,2, Dai-Mei Wang1, Qing-Feng Pi1 and Zhong-Zhong Zhu1
1 College of Science/Department of Physics & NAOC-GZU-Sponsored Center for AstronomyResearch, Guizhou University, Guiyang 550025, China; Liy [email protected]
2 Guizhou Province Big Data Industry development Application Research institute, GuizhouUniversity, Guiyang 550025, China
Received 2014 January 24; accepted 2014 June 3
Abstract New high-resolution echelle spectra of six single late-type Pleiades-likestars (V368 Cep, EP Eri, DX Leo, GJ 211, PW And and V383 Lac) were obtainedwith a 2.16 meter telescope at Xinglong Station in 2008–2010. Using the spectralsubtraction technique, we analyzed our spectroscopic data and calculated the equiv-alent widths of the excess emission of several chromospheric active indicators (Na ID1, D2, Hα, and Ca II infrared triplet lines). All our results of chromospheric activeindicators confirmed the previous results. Meanwhile, the maximum amplitudes ofchromospheric rotational modulation, and the ratio of EW8542/EW8498 were found toshow an increment with increasing v sin i velocity.
Key words: late-type — stars: chromospheres — stars: spectroscopic — stars: activ-ity — stars: rotation
1 INTRODUCTION
Late-type stars with thick convective zones and rapid rotation exhibit magnetic activity phenomena,such as starspot, plage and flare ,... (Berdyugina 2005; Gudel 2002; Hall 2008; Strassmeier 2009;Gu et al. 2002). However, in many such kinds of stars, the details of the active phenomena are notwell understood and needed to be studied, especially their chromospheric active properties (Wanget al. 2009; Zhao et al. 2011, 2013), the chromospheric rotational modulation and magnetic cycle(Baliunas et al. 1995; etc). To understand the stellar chromospheric activities, herein we study themagnetic activities of the late-type stars with different stellar parameters by high-resolution spec-troscopy, and investigated the properties of the detailed magnetic activity in the chromosphere, andthe relations between the chromospheric activity and stellar parameters (Zhang 2011).
Chromospheric activity is a proxy for the active variability levels of late-type stars. The spectralsubtraction technique was used widely to discuss the chromospheric activity by several optical lines:the Ca II H & K, He I D3, Na I D1, D2, Hα, Hβ, Ca II IRT lines (Barden 1985; Fekel et al. 1986;Gunn & Doyle 1997; Lazaro & Arevalo 1997; Montes et al. 2000; Frasca et al. 2002; Griffin &Griffin 2004; Galvez et al. 2009; Frasca et al. 2010; Cao & Gu 2012 Cao & Gu 2014 :::No::::this:::::entry
::in::::::::reference::::list; Zhang et al. 2014; etc.). Because the chromospheric activities are mostly variablewith time and phase (Baliunas et al. 1995), we need more data to calculate their average values toobtain the precise relationship of the chromospheric activity with stellar parameters.
2 L. Y. Zhang
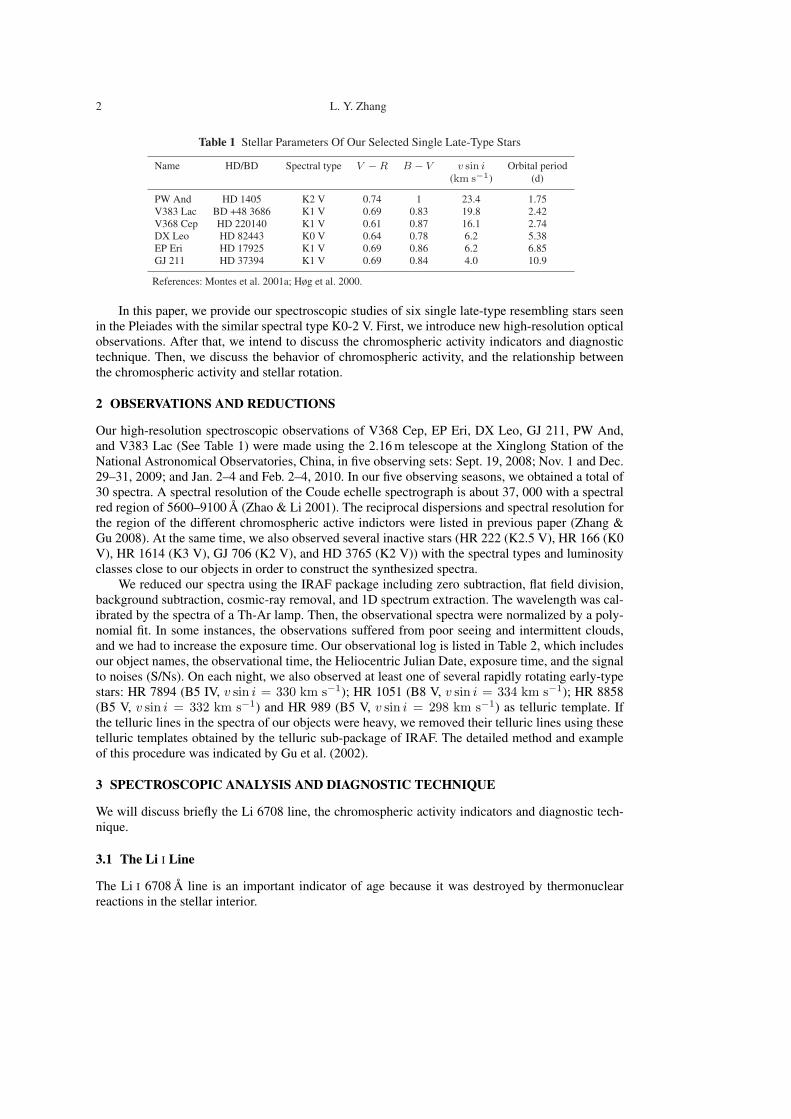
Table 1 Stellar Parameters Of Our Selected Single Late-Type Stars
Name HD/BD Spectral type V −R B − V v sin i Orbital period(km s−1) (d)
PW And HD 1405 K2 V 0.74 1 23.4 1.75V383 Lac BD +48 3686 K1 V 0.69 0.83 19.8 2.42V368 Cep HD 220140 K1 V 0.61 0.87 16.1 2.74DX Leo HD 82443 K0 V 0.64 0.78 6.2 5.38EP Eri HD 17925 K1 V 0.69 0.86 6.2 6.85GJ 211 HD 37394 K1 V 0.69 0.84 4.0 10.9
References: Montes et al. 2001a; Høg et al. 2000.
In this paper, we provide our spectroscopic studies of six single late-type resembling stars seenin the Pleiades with the similar spectral type K0-2 V. First, we introduce new high-resolution opticalobservations. After that, we intend to discuss the chromospheric activity indicators and diagnostictechnique. Then, we discuss the behavior of chromospheric activity, and the relationship betweenthe chromospheric activity and stellar rotation.
2 OBSERVATIONS AND REDUCTIONS
Our high-resolution spectroscopic observations of V368 Cep, EP Eri, DX Leo, GJ 211, PW And,and V383 Lac (See Table 1) were made using the 2.16 m telescope at the Xinglong Station of theNational Astronomical Observatories, China, in five observing sets: Sept. 19, 2008; Nov. 1 and Dec.29–31, 2009; and Jan. 2–4 and Feb. 2–4, 2010. In our five observing seasons, we obtained a total of30 spectra. A spectral resolution of the Coude echelle spectrograph is about 37, 000 with a spectralred region of 5600–9100 A (Zhao & Li 2001). The reciprocal dispersions and spectral resolution forthe region of the different chromospheric active indictors were listed in previous paper (Zhang &Gu 2008). At the same time, we also observed several inactive stars (HR 222 (K2.5 V), HR 166 (K0V), HR 1614 (K3 V), GJ 706 (K2 V), and HD 3765 (K2 V)) with the spectral types and luminosityclasses close to our objects in order to construct the synthesized spectra.
We reduced our spectra using the IRAF package including zero subtraction, flat field division,background subtraction, cosmic-ray removal, and 1D spectrum extraction. The wavelength was cal-ibrated by the spectra of a Th-Ar lamp. Then, the observational spectra were normalized by a poly-nomial fit. In some instances, the observations suffered from poor seeing and intermittent clouds,and we had to increase the exposure time. Our observational log is listed in Table 2, which includesour object names, the observational time, the Heliocentric Julian Date, exposure time, and the signalto noises (S/Ns). On each night, we also observed at least one of several rapidly rotating early-typestars: HR 7894 (B5 IV, v sin i = 330 km s−1); HR 1051 (B8 V, v sin i = 334 km s−1); HR 8858(B5 V, v sin i = 332 km s−1) and HR 989 (B5 V, v sin i = 298 km s−1) as telluric template. Ifthe telluric lines in the spectra of our objects were heavy, we removed their telluric lines using thesetelluric templates obtained by the telluric sub-package of IRAF. The detailed method and exampleof this procedure was indicated by Gu et al. (2002).
3 SPECTROSCOPIC ANALYSIS AND DIAGNOSTIC TECHNIQUE
We will discuss briefly the Li 6708 line, the chromospheric activity indicators and diagnostic tech-nique.
3.1 The Li I Line
The Li I 6708 A line is an important indicator of age because it was destroyed by thermonuclearreactions in the stellar interior.
Chromospheric Activity 3
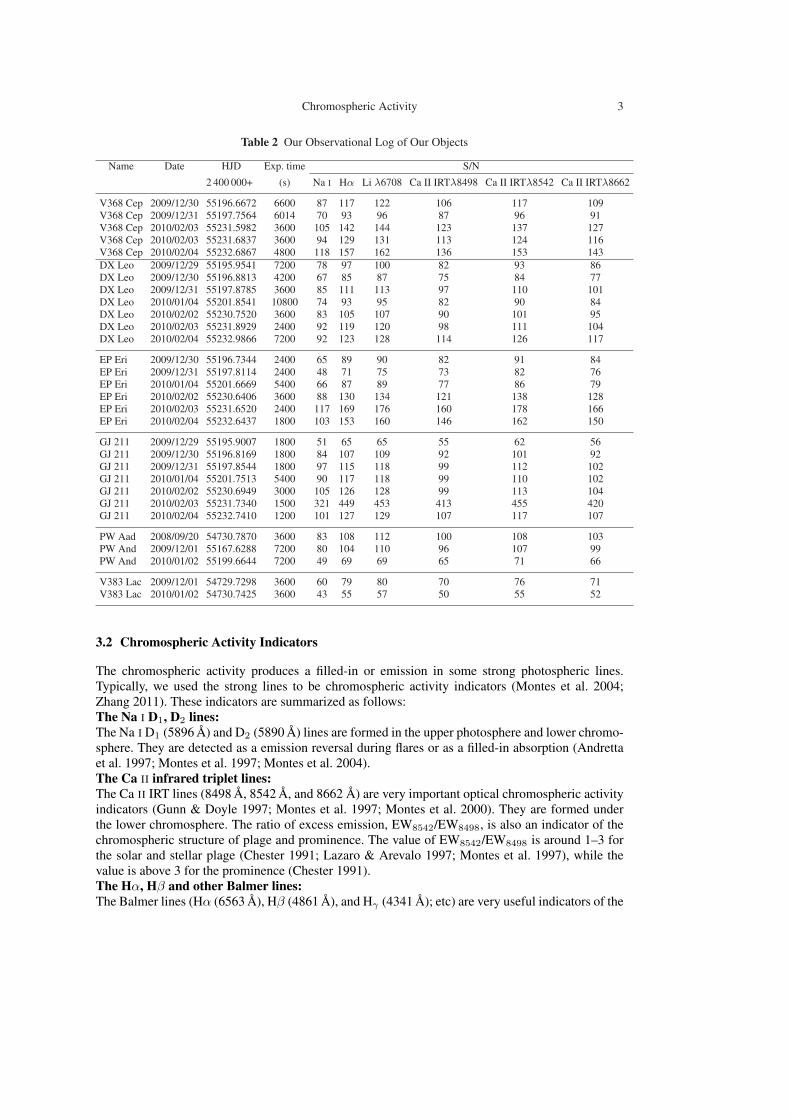
Table 2 Our Observational Log of Our Objects
Name Date HJD Exp. time S/N
2 400 000+ (s) Na I Hα Li λ6708 Ca II IRTλ8498 Ca II IRTλ8542 Ca II IRTλ8662
V368 Cep 2009/12/30 55196.6672 6600 87 117 122 106 117 109V368 Cep 2009/12/31 55197.7564 6014 70 93 96 87 96 91V368 Cep 2010/02/03 55231.5982 3600 105 142 144 123 137 127V368 Cep 2010/02/03 55231.6837 3600 94 129 131 113 124 116V368 Cep 2010/02/04 55232.6867 4800 118 157 162 136 153 143DX Leo 2009/12/29 55195.9541 7200 78 97 100 82 93 86DX Leo 2009/12/30 55196.8813 4200 67 85 87 75 84 77DX Leo 2009/12/31 55197.8785 3600 85 111 113 97 110 101DX Leo 2010/01/04 55201.8541 10800 74 93 95 82 90 84DX Leo 2010/02/02 55230.7520 3600 83 105 107 90 101 95DX Leo 2010/02/03 55231.8929 2400 92 119 120 98 111 104DX Leo 2010/02/04 55232.9866 7200 92 123 128 114 126 117
EP Eri 2009/12/30 55196.7344 2400 65 89 90 82 91 84EP Eri 2009/12/31 55197.8114 2400 48 71 75 73 82 76EP Eri 2010/01/04 55201.6669 5400 66 87 89 77 86 79EP Eri 2010/02/02 55230.6406 3600 88 130 134 121 138 128EP Eri 2010/02/03 55231.6520 2400 117 169 176 160 178 166EP Eri 2010/02/04 55232.6437 1800 103 153 160 146 162 150
GJ 211 2009/12/29 55195.9007 1800 51 65 65 55 62 56GJ 211 2009/12/30 55196.8169 1800 84 107 109 92 101 92GJ 211 2009/12/31 55197.8544 1800 97 115 118 99 112 102GJ 211 2010/01/04 55201.7513 5400 90 117 118 99 110 102GJ 211 2010/02/02 55230.6949 3000 105 126 128 99 113 104GJ 211 2010/02/03 55231.7340 1500 321 449 453 413 455 420GJ 211 2010/02/04 55232.7410 1200 101 127 129 107 117 107
PW Aad 2008/09/20 54730.7870 3600 83 108 112 100 108 103PW And 2009/12/01 55167.6288 7200 80 104 110 96 107 99PW And 2010/01/02 55199.6644 7200 49 69 69 65 71 66
V383 Lac 2009/12/01 54729.7298 3600 60 79 80 70 76 71V383 Lac 2010/01/02 54730.7425 3600 43 55 57 50 55 52
3.2 Chromospheric Activity Indicators
The chromospheric activity produces a filled-in or emission in some strong photospheric lines.Typically, we used the strong lines to be chromospheric activity indicators (Montes et al. 2004;Zhang 2011). These indicators are summarized as follows:The Na I D1, D2 lines:The Na I D1 (5896 A) and D2 (5890 A) lines are formed in the upper photosphere and lower chromo-sphere. They are detected as a emission reversal during flares or as a filled-in absorption (Andrettaet al. 1997; Montes et al. 1997; Montes et al. 2004).The Ca II infrared triplet lines:The Ca II IRT lines (8498 A, 8542 A, and 8662 A) are very important optical chromospheric activityindicators (Gunn & Doyle 1997; Montes et al. 1997; Montes et al. 2000). They are formed underthe lower chromosphere. The ratio of excess emission, EW8542/EW8498, is also an indicator of thechromospheric structure of plage and prominence. The value of EW8542/EW8498 is around 1–3 forthe solar and stellar plage (Chester 1991; Lazaro & Arevalo 1997; Montes et al. 1997), while thevalue is above 3 for the prominence (Chester 1991).The Hα, Hβ and other Balmer lines:The Balmer lines (Hα (6563 A), Hβ (4861 A), and Hγ (4341 A); etc) are very useful indicators of the
4 L. Y. Zhang
chromospheric activity and are formed in the middle chromosphere. For less active stars, their pro-files are filled-in absorption. However, their emissions are above the continuum for many active stars.Furthermore, the ratio of EWHα/EWHβ can also be used as a diagnostic indicator for discriminatingbetween plage and prominence (Hall & Ramsey 1992; Montes et al. 2004), and as a diagnostic toolfor non-thermal electron presence (Kashapova et al. 2008). According to the Buzasi model (Buzasi1989), the low ratio (1-2) represents plage and prominence viewed against the stellar disk, while thehigh ratio (> 3, to a theoretical maximum of about 15) represents the extended regions viewed offthe limb (Hall & Ramsey 1992).The Ca II H & K lines:The Ca II H (3968 A) & K (3933 A) lines were the traditional chromospheric indicators (Monteset al. 2004; Zhao et al. 2013). They are formed in the middle chromosphere, and the correspondingcore emissions are the most usual behavior of chromospheric activity.The He I lines:The He I D3 5876 A and He I 10830 A lines come into being in the upper chromosphere(Shcherbakov et al. 1996; Houdebine et al. 2009). The emission above continuum is a probe ofthe flare event (Zirin 1988; Montes et al. 1999).Our observational spectral region was about 5600–9100 A, which includes the Na I D1, D2 lines,the Hα line, the Ca II IRT lines and the He I D3 line. We can use these indicators to discuss theirchromospheric activities.
3.3 The Spectral Analysis Technique
To obtain the chromospheric active contribution, the spectral subtraction technique is commonlyemployed. The principle of the method is that chromospheric contribution equals to the observedspectra minus the synthesized spectra. The key of the technique is to construct the reasonable syn-thesized spectrum standing for the underlying photospheric contribution. There are two methods.One is to use the theoretical spectra on the basis of the radiation transfer equation (Fraquelli 1984),while the other employs the observed spectra of inactive stars (Barden 1985; Herbig 1985; Eker et al.1995; Gunn & Doyle 1997; :::::::Please:::::::::AUTHOR::::::check::::::which::::this::::::Frasca:::et ::al.:::::2000:::is Frasca et al.2000a:::or:Frasca et al. 2000b; etc).
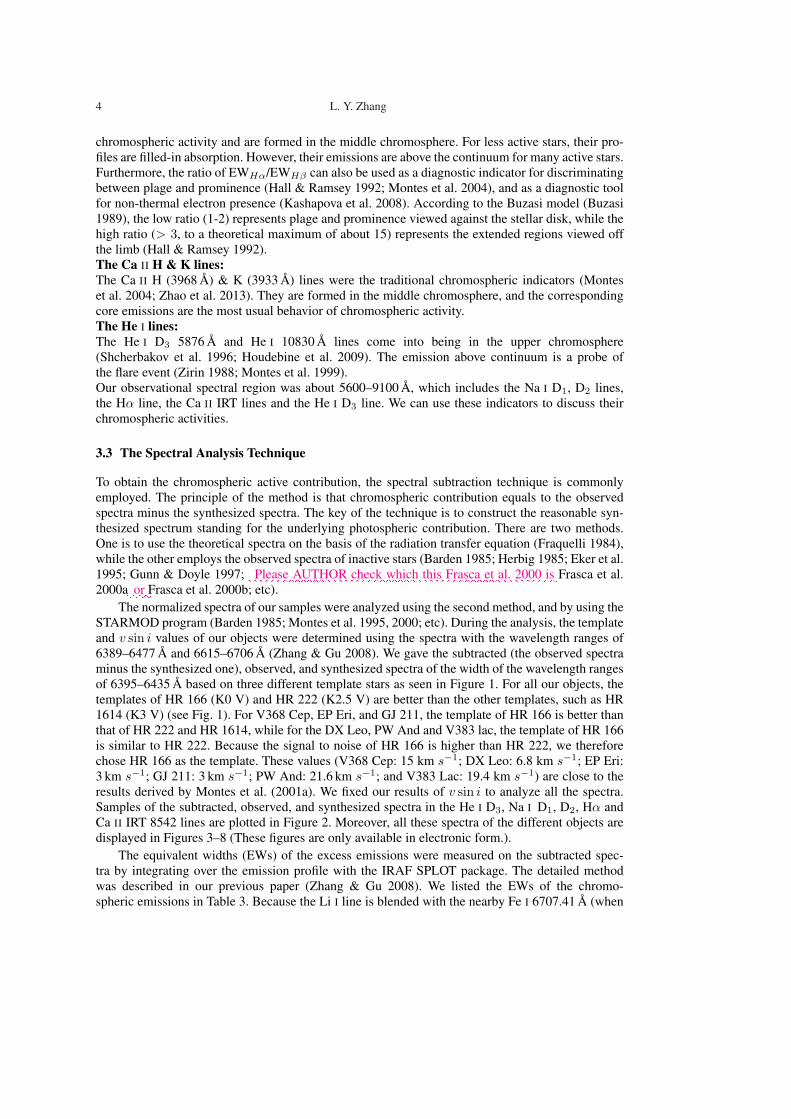
The normalized spectra of our samples were analyzed using the second method, and by using theSTARMOD program (Barden 1985; Montes et al. 1995, 2000; etc). During the analysis, the templateand v sin i values of our objects were determined using the spectra with the wavelength ranges of6389–6477 A and 6615–6706 A (Zhang & Gu 2008). We gave the subtracted (the observed spectraminus the synthesized one), observed, and synthesized spectra of the width of the wavelength rangesof 6395–6435 A based on three different template stars as seen in Figure 1. For all our objects, thetemplates of HR 166 (K0 V) and HR 222 (K2.5 V) are better than the other templates, such as HR1614 (K3 V) (see Fig. 1). For V368 Cep, EP Eri, and GJ 211, the template of HR 166 is better thanthat of HR 222 and HR 1614, while for the DX Leo, PW And and V383 lac, the template of HR 166is similar to HR 222. Because the signal to noise of HR 166 is higher than HR 222, we thereforechose HR 166 as the template. These values (V368 Cep: 15 km s−1; DX Leo: 6.8 km s−1; EP Eri:3 km s−1; GJ 211: 3 km s−1; PW And: 21.6 km s−1; and V383 Lac: 19.4 km s−1) are close to theresults derived by Montes et al. (2001a). We fixed our results of v sin i to analyze all the spectra.Samples of the subtracted, observed, and synthesized spectra in the He I D3, Na I D1, D2, Hα andCa II IRT 8542 lines are plotted in Figure 2. Moreover, all these spectra of the different objects aredisplayed in Figures 3–8 (These figures are only available in electronic form.).
The equivalent widths (EWs) of the excess emissions were measured on the subtracted spec-tra by integrating over the emission profile with the IRAF SPLOT package. The detailed methodwas described in our previous paper (Zhang & Gu 2008). We listed the EWs of the chromo-spheric emissions in Table 3. Because the Li I line is blended with the nearby Fe I 6707.41 A (when
Chromospheric Activity 5
Fig. 1 Samples of the observed, synthesized, and subtracted spectra in 6395–6435 A derived by thedifferent inactive samples. The number below each spectra in this figure represents the observationdate (year month days).
v sin i > 8 km s−1), the equivalent width of the Li I was calculated by subtracting the EW ofFe I 6707.41 line (Montes et al. 2001a), which could be obtained from the relationship derived by
::::::Please::::::::::AUTHOR:::::check:::::::::::Soderblom::et:::al.::::::(1993):::is Soderblom et al. (1993a) :::or Soderblom et al.(1993b):?. The phases were calculated using the equation under the line in the Tables 4 and 5.
4 INDIVIDUAL RESULTS
We illustrate the individual results about chromospheric activity of our objects.
4.1 V368 Cep
V368 Cep (K1 V, v sin i = 16.1 km s−1, Porb = 2.75d) is an optical counterpart of the X-raysource H2311+77 (Fekel 1997; Nugent et al. 1983; Pravdo et al. 1985; Kahanpaa et al. 1999). It ismanifested as a photospheric spot (Poretti et al. 1985; Bianchi et al. 1991; Mantegazza et al. 1992;Kahanpaa et al. 1999), chromospheric emission (Joy & Wilson 1949; Montes et al. 2001a), transitionregion emission (Bianchi et al. 1991); coronal X-ray radiation (Pravdo et al. 1985; Pandey & Singh2008), and flare events (Bowyer et al. 1994; Pye et al. 1995).
6 L. Y. Zhang
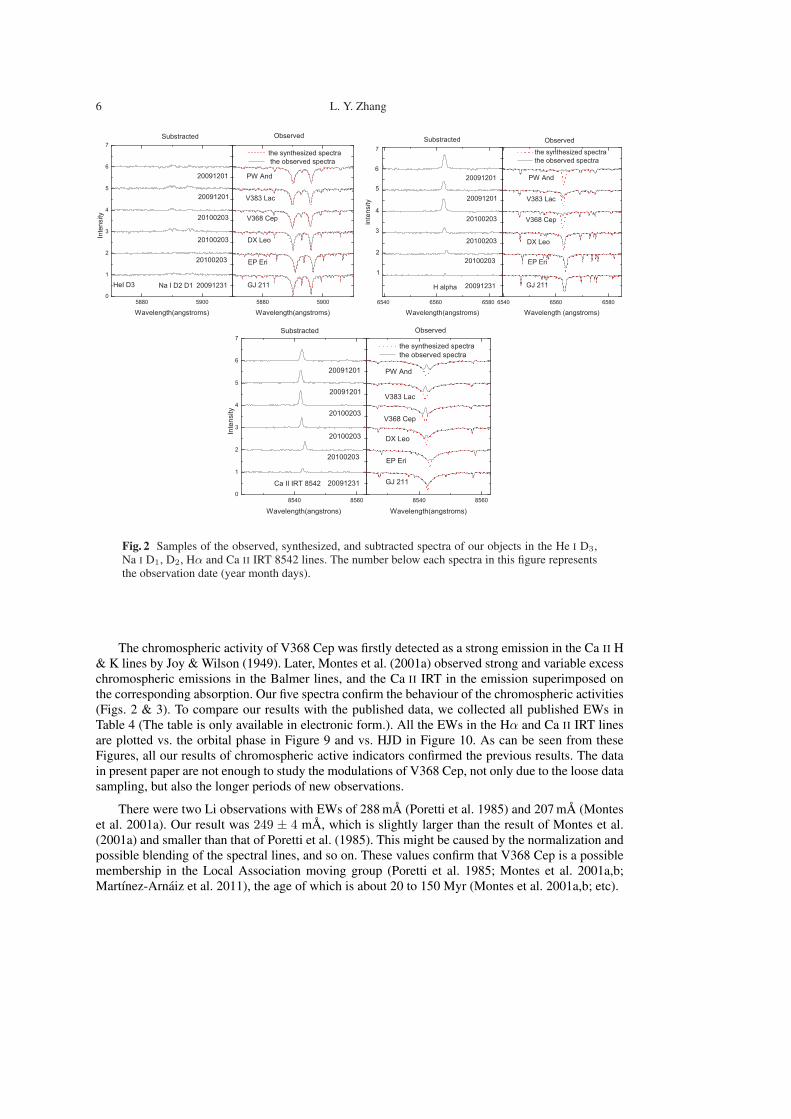
Fig. 2 Samples of the observed, synthesized, and subtracted spectra of our objects in the He I D3,Na I D1, D2, Hα and Ca II IRT 8542 lines. The number below each spectra in this figure representsthe observation date (year month days).
The chromospheric activity of V368 Cep was firstly detected as a strong emission in the Ca II H& K lines by Joy & Wilson (1949). Later, Montes et al. (2001a) observed strong and variable excesschromospheric emissions in the Balmer lines, and the Ca II IRT in the emission superimposed onthe corresponding absorption. Our five spectra confirm the behaviour of the chromospheric activities(Figs. 2 & 3). To compare our results with the published data, we collected all published EWs inTable 4 (The table is only available in electronic form.). All the EWs in the Hα and Ca II IRT linesare plotted vs. the orbital phase in Figure 9 and vs. HJD in Figure 10. As can be seen from theseFigures, all our results of chromospheric active indicators confirmed the previous results. The datain present paper are not enough to study the modulations of V368 Cep, not only due to the loose datasampling, but also the longer periods of new observations.
There were two Li observations with EWs of 288 mA (Poretti et al. 1985) and 207 mA (Monteset al. 2001a). Our result was 249 ± 4 mA, which is slightly larger than the result of Montes et al.(2001a) and smaller than that of Poretti et al. (1985). This might be caused by the normalization andpossible blending of the spectral lines, and so on. These values confirm that V368 Cep is a possiblemembership in the Local Association moving group (Poretti et al. 1985; Montes et al. 2001a,b;Martınez-Arnaiz et al. 2011), the age of which is about 20 to 150 Myr (Montes et al. 2001a,b; etc).
Chromospheric Activity 7
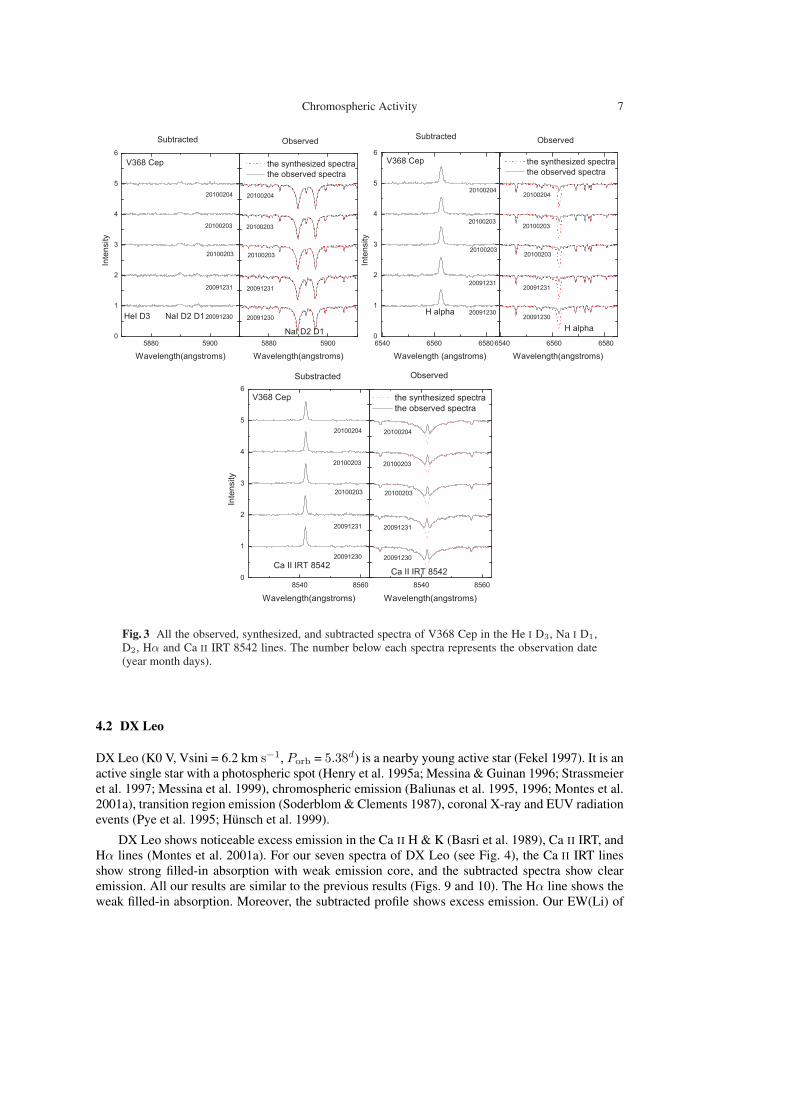
Fig. 3 All the observed, synthesized, and subtracted spectra of V368 Cep in the He I D3, Na I D1,D2, Hα and Ca II IRT 8542 lines. The number below each spectra represents the observation date(year month days).
4.2 DX Leo
DX Leo (K0 V, Vsini = 6.2 km s−1, Porb = 5.38d) is a nearby young active star (Fekel 1997). It is anactive single star with a photospheric spot (Henry et al. 1995a; Messina & Guinan 1996; Strassmeieret al. 1997; Messina et al. 1999), chromospheric emission (Baliunas et al. 1995, 1996; Montes et al.2001a), transition region emission (Soderblom & Clements 1987), coronal X-ray and EUV radiationevents (Pye et al. 1995; Hunsch et al. 1999).
DX Leo shows noticeable excess emission in the Ca II H & K (Basri et al. 1989), Ca II IRT, andHα lines (Montes et al. 2001a). For our seven spectra of DX Leo (see Fig. 4), the Ca II IRT linesshow strong filled-in absorption with weak emission core, and the subtracted spectra show clearemission. All our results are similar to the previous results (Figs. 9 and 10). The Hα line shows theweak filled-in absorption. Moreover, the subtracted profile shows excess emission. Our EW(Li) of
8 L. Y. Zhang
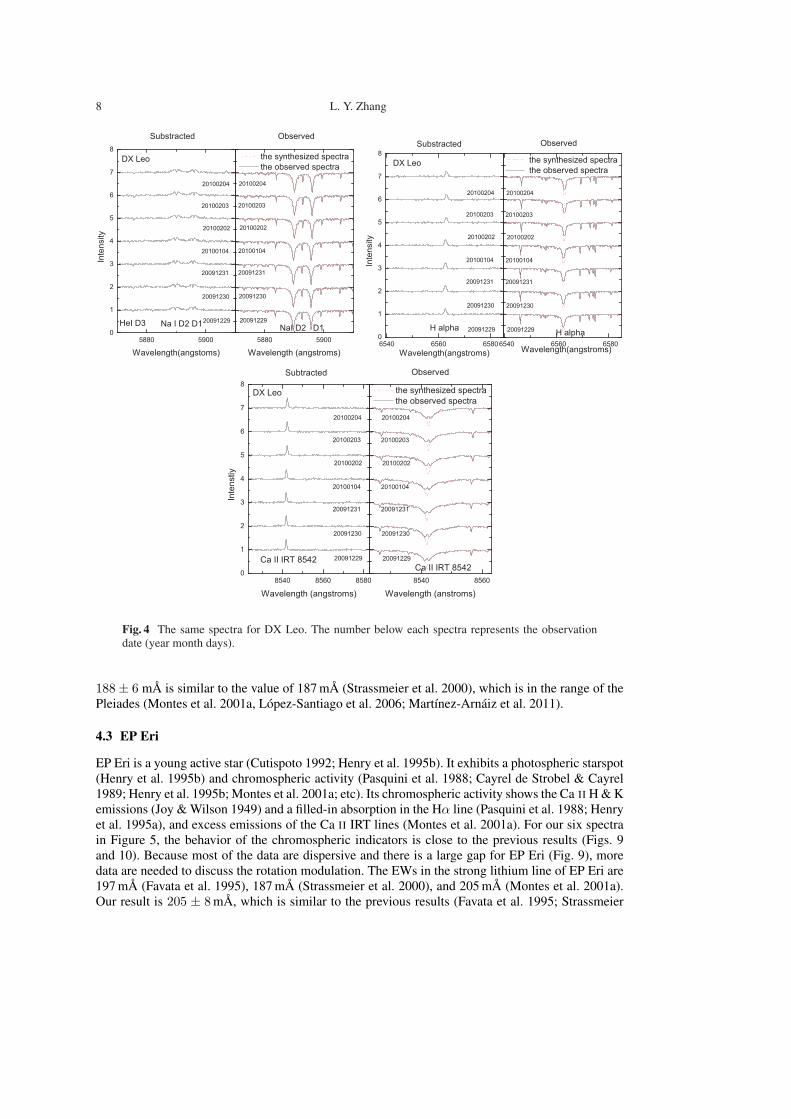
Fig. 4 The same spectra for DX Leo. The number below each spectra represents the observationdate (year month days).
188± 6 mA is similar to the value of 187 mA (Strassmeier et al. 2000), which is in the range of thePleiades (Montes et al. 2001a, Lopez-Santiago et al. 2006; Martınez-Arnaiz et al. 2011).
4.3 EP Eri
EP Eri is a young active star (Cutispoto 1992; Henry et al. 1995b). It exhibits a photospheric starspot(Henry et al. 1995b) and chromospheric activity (Pasquini et al. 1988; Cayrel de Strobel & Cayrel1989; Henry et al. 1995b; Montes et al. 2001a; etc). Its chromospheric activity shows the Ca II H & Kemissions (Joy & Wilson 1949) and a filled-in absorption in the Hα line (Pasquini et al. 1988; Henryet al. 1995a), and excess emissions of the Ca II IRT lines (Montes et al. 2001a). For our six spectrain Figure 5, the behavior of the chromospheric indicators is close to the previous results (Figs. 9and 10). Because most of the data are dispersive and there is a large gap for EP Eri (Fig. 9), moredata are needed to discuss the rotation modulation. The EWs in the strong lithium line of EP Eri are197 mA (Favata et al. 1995), 187 mA (Strassmeier et al. 2000), and 205 mA (Montes et al. 2001a).Our result is 205 ± 8 mA, which is similar to the previous results (Favata et al. 1995; Strassmeier
Chromospheric Activity 9
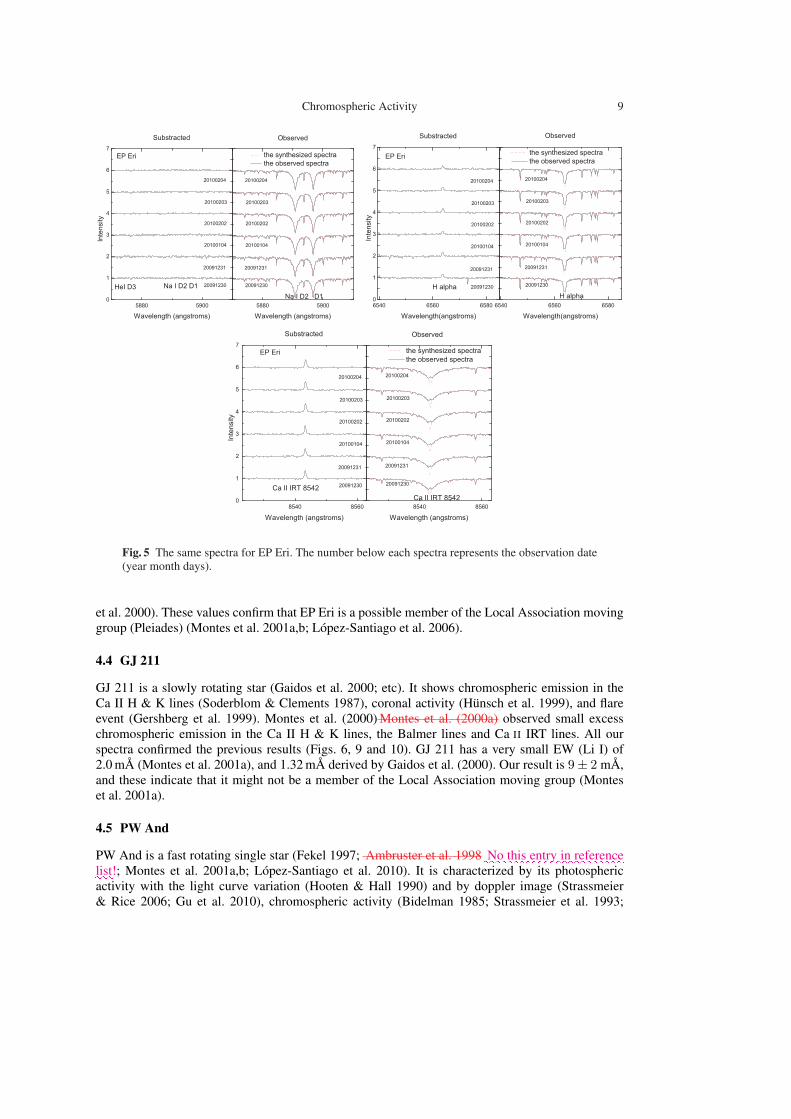
Fig. 5 The same spectra for EP Eri. The number below each spectra represents the observation date(year month days).
et al. 2000). These values confirm that EP Eri is a possible member of the Local Association movinggroup (Pleiades) (Montes et al. 2001a,b; Lopez-Santiago et al. 2006).
4.4 GJ 211
GJ 211 is a slowly rotating star (Gaidos et al. 2000; etc). It shows chromospheric emission in theCa II H & K lines (Soderblom & Clements 1987), coronal activity (Hunsch et al. 1999), and flareevent (Gershberg et al. 1999). Montes et al. (2000) Montes et al. (2000a) observed small excesschromospheric emission in the Ca II H & K lines, the Balmer lines and Ca II IRT lines. All ourspectra confirmed the previous results (Figs. 6, 9 and 10). GJ 211 has a very small EW (Li I) of2.0 mA (Montes et al. 2001a), and 1.32 mA derived by Gaidos et al. (2000). Our result is 9± 2 mA,and these indicate that it might not be a member of the Local Association moving group (Monteset al. 2001a).
4.5 PW And
PW And is a fast rotating single star (Fekel 1997; Ambruster et al. 1998 :::No::::this:::::entry::in:::::::::reference
:::list!; Montes et al. 2001a,b; Lopez-Santiago et al. 2010). It is characterized by its photosphericactivity with the light curve variation (Hooten & Hall 1990) and by doppler image (Strassmeier& Rice 2006; Gu et al. 2010), chromospheric activity (Bidelman 1985; Strassmeier et al. 1993;
10 L. Y. Zhang
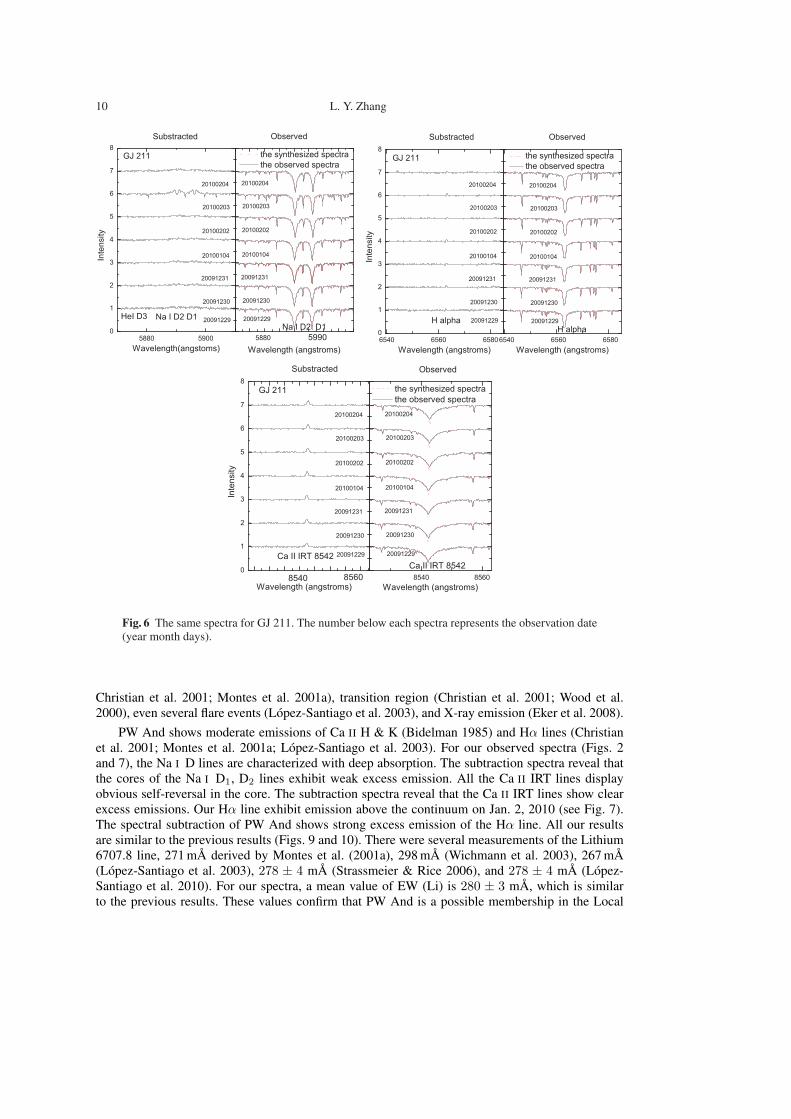
Fig. 6 The same spectra for GJ 211. The number below each spectra represents the observation date(year month days).
Christian et al. 2001; Montes et al. 2001a), transition region (Christian et al. 2001; Wood et al.2000), even several flare events (Lopez-Santiago et al. 2003), and X-ray emission (Eker et al. 2008).
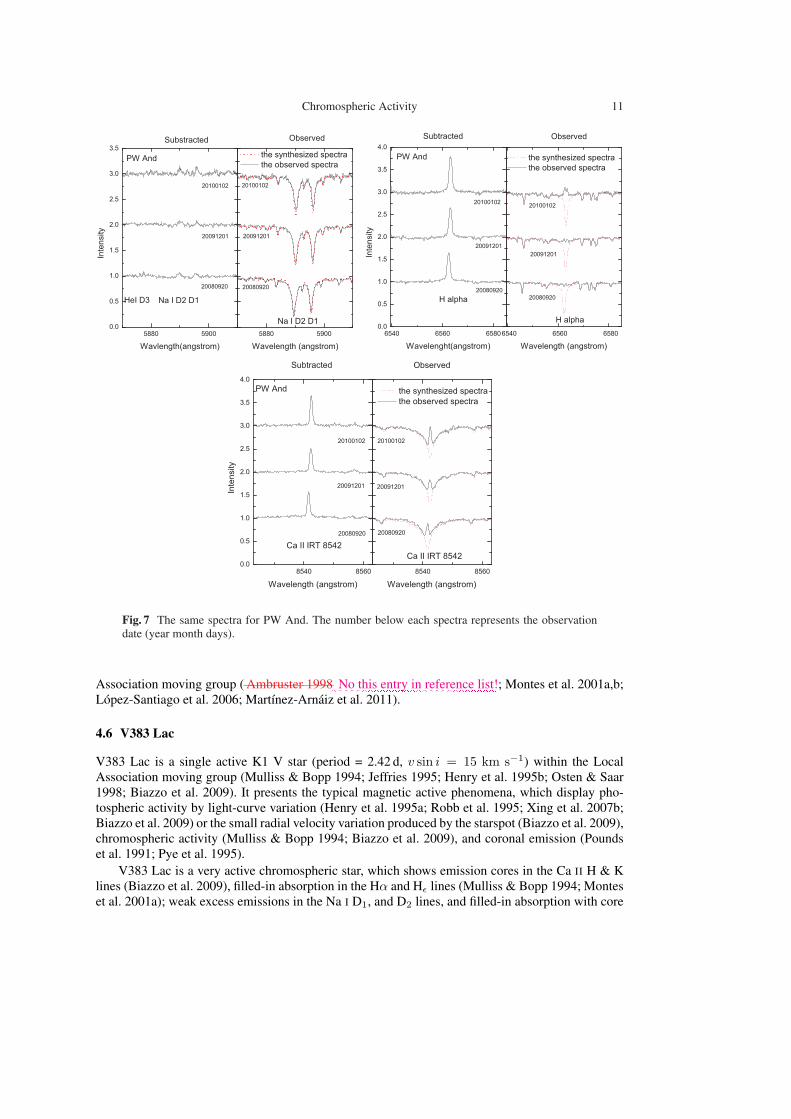
PW And shows moderate emissions of Ca II H & K (Bidelman 1985) and Hα lines (Christianet al. 2001; Montes et al. 2001a; Lopez-Santiago et al. 2003). For our observed spectra (Figs. 2and 7), the Na I D lines are characterized with deep absorption. The subtraction spectra reveal thatthe cores of the Na I D1, D2 lines exhibit weak excess emission. All the Ca II IRT lines displayobvious self-reversal in the core. The subtraction spectra reveal that the Ca II IRT lines show clearexcess emissions. Our Hα line exhibit emission above the continuum on Jan. 2, 2010 (see Fig. 7).The spectral subtraction of PW And shows strong excess emission of the Hα line. All our resultsare similar to the previous results (Figs. 9 and 10). There were several measurements of the Lithium6707.8 line, 271 mA derived by Montes et al. (2001a), 298 mA (Wichmann et al. 2003), 267 mA(Lopez-Santiago et al. 2003), 278 ± 4 mA (Strassmeier & Rice 2006), and 278 ± 4 mA (Lopez-Santiago et al. 2010). For our spectra, a mean value of EW (Li) is 280 ± 3 mA, which is similarto the previous results. These values confirm that PW And is a possible membership in the Local
Chromospheric Activity 11
Fig. 7 The same spectra for PW And. The number below each spectra represents the observationdate (year month days).
Association moving group ( Ambruster 1998::::No:::this:::::entry:::in::::::::reference::::list!; Montes et al. 2001a,b;Lopez-Santiago et al. 2006; Martınez-Arnaiz et al. 2011).
4.6 V383 Lac
V383 Lac is a single active K1 V star (period = 2.42 d, v sin i = 15 km s−1) within the LocalAssociation moving group (Mulliss & Bopp 1994; Jeffries 1995; Henry et al. 1995b; Osten & Saar1998; Biazzo et al. 2009). It presents the typical magnetic active phenomena, which display pho-tospheric activity by light-curve variation (Henry et al. 1995a; Robb et al. 1995; Xing et al. 2007b;Biazzo et al. 2009) or the small radial velocity variation produced by the starspot (Biazzo et al. 2009),chromospheric activity (Mulliss & Bopp 1994; Biazzo et al. 2009), and coronal emission (Poundset al. 1991; Pye et al. 1995).
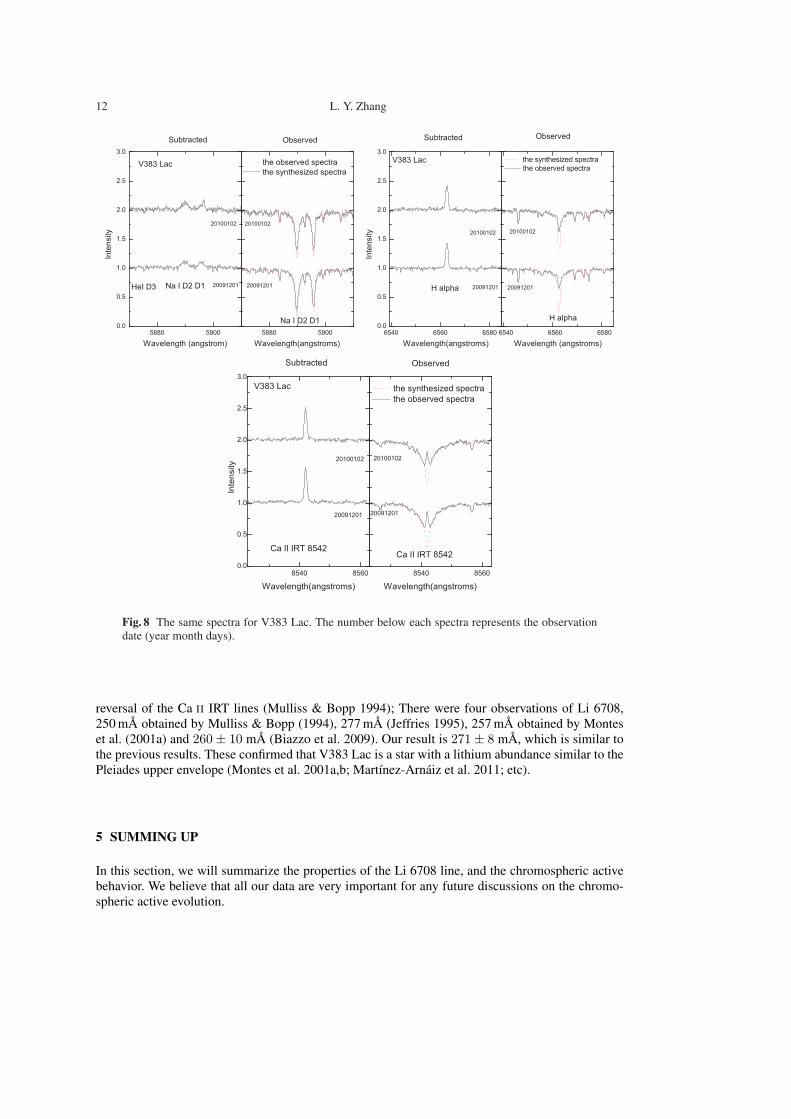
V383 Lac is a very active chromospheric star, which shows emission cores in the Ca II H & Klines (Biazzo et al. 2009), filled-in absorption in the Hα and Hε lines (Mulliss & Bopp 1994; Monteset al. 2001a); weak excess emissions in the Na I D1, and D2 lines, and filled-in absorption with core
12 L. Y. Zhang
Fig. 8 The same spectra for V383 Lac. The number below each spectra represents the observationdate (year month days).
reversal of the Ca II IRT lines (Mulliss & Bopp 1994); There were four observations of Li 6708,250 mA obtained by Mulliss & Bopp (1994), 277 mA (Jeffries 1995), 257 mA obtained by Monteset al. (2001a) and 260 ± 10 mA (Biazzo et al. 2009). Our result is 271 ± 8 mA, which is similar tothe previous results. These confirmed that V383 Lac is a star with a lithium abundance similar to thePleiades upper envelope (Montes et al. 2001a,b; Martınez-Arnaiz et al. 2011; etc).
5 SUMMING UP
In this section, we will summarize the properties of the Li 6708 line, and the chromospheric activebehavior. We believe that all our data are very important for any future discussions on the chromo-spheric active evolution.
Chromospheric Activity 13
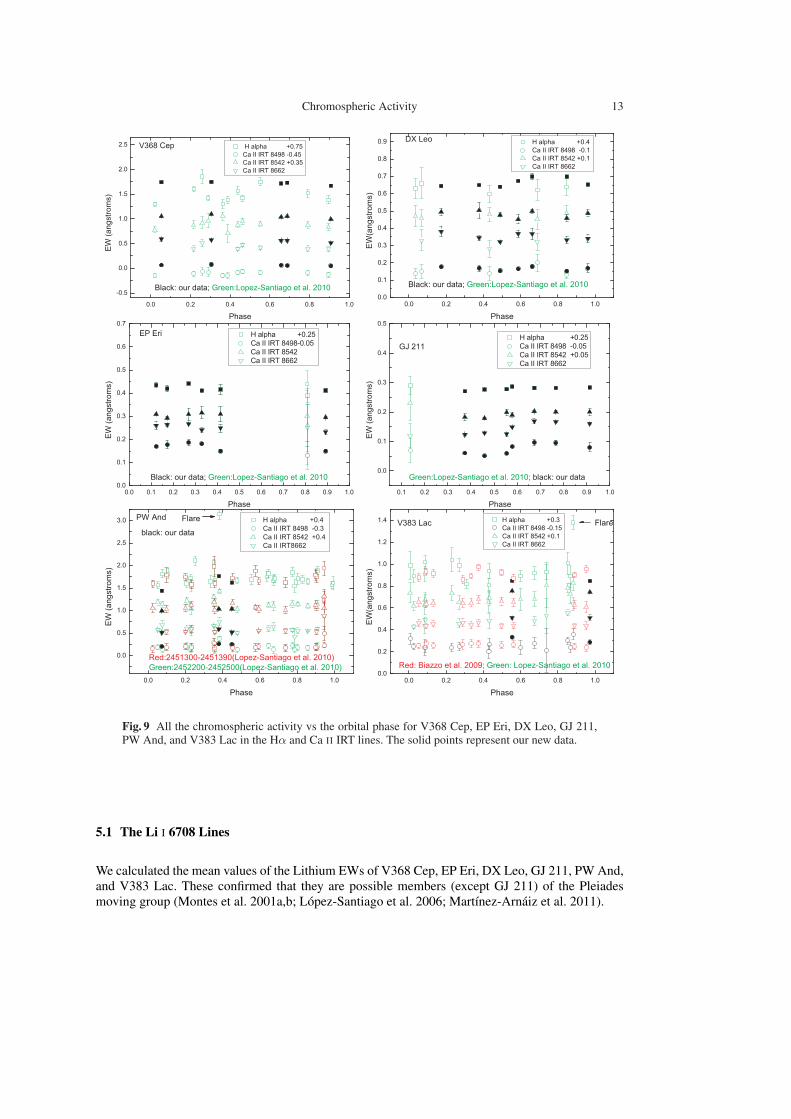
Fig. 9 All the chromospheric activity vs the orbital phase for V368 Cep, EP Eri, DX Leo, GJ 211,PW And, and V383 Lac in the Hα and Ca II IRT lines. The solid points represent our new data.
5.1 The Li I 6708 Lines
We calculated the mean values of the Lithium EWs of V368 Cep, EP Eri, DX Leo, GJ 211, PW And,and V383 Lac. These confirmed that they are possible members (except GJ 211) of the Pleiadesmoving group (Montes et al. 2001a,b; Lopez-Santiago et al. 2006; Martınez-Arnaiz et al. 2011).
14 L. Y. Zhang
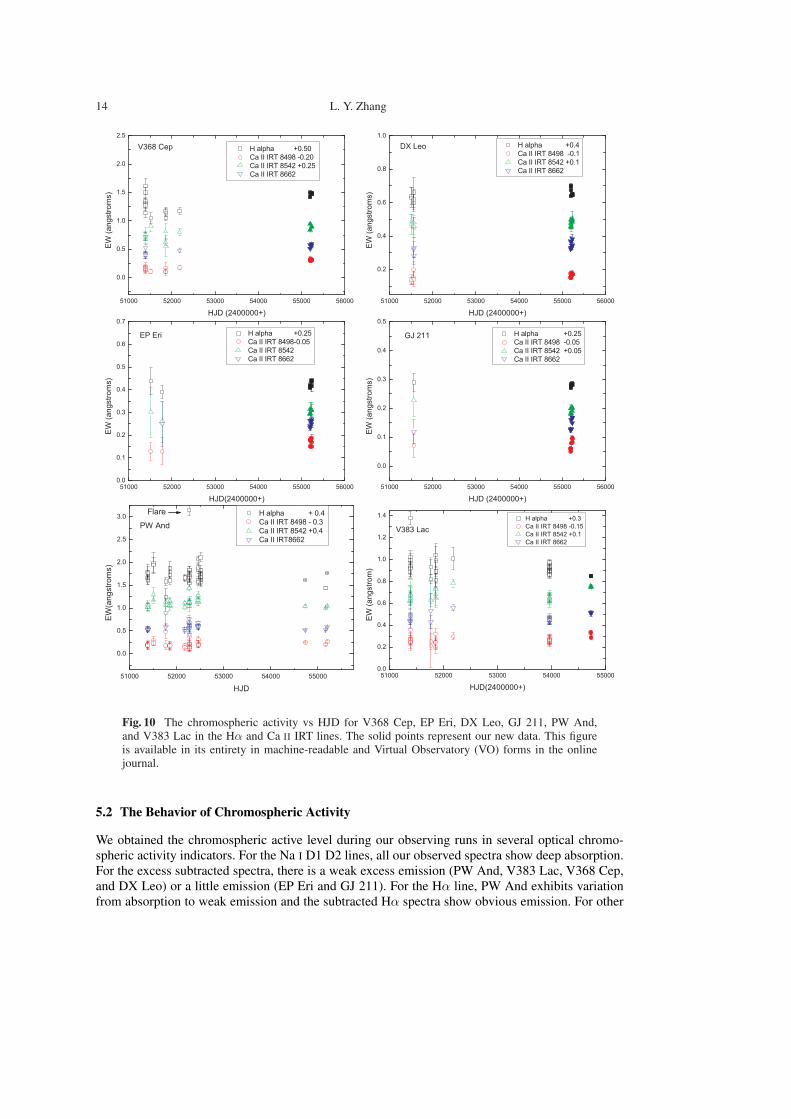
Fig. 10 The chromospheric activity vs HJD for V368 Cep, EP Eri, DX Leo, GJ 211, PW And,and V383 Lac in the Hα and Ca II IRT lines. The solid points represent our new data. This figureis available in its entirety in machine-readable and Virtual Observatory (VO) forms in the onlinejournal.
5.2 The Behavior of Chromospheric Activity
We obtained the chromospheric active level during our observing runs in several optical chromo-spheric activity indicators. For the Na I D1 D2 lines, all our observed spectra show deep absorption.For the excess subtracted spectra, there is a weak excess emission (PW And, V383 Lac, V368 Cep,and DX Leo) or a little emission (EP Eri and GJ 211). For the Hα line, PW And exhibits variationfrom absorption to weak emission and the subtracted Hα spectra show obvious emission. For other
Chromospheric Activity 15
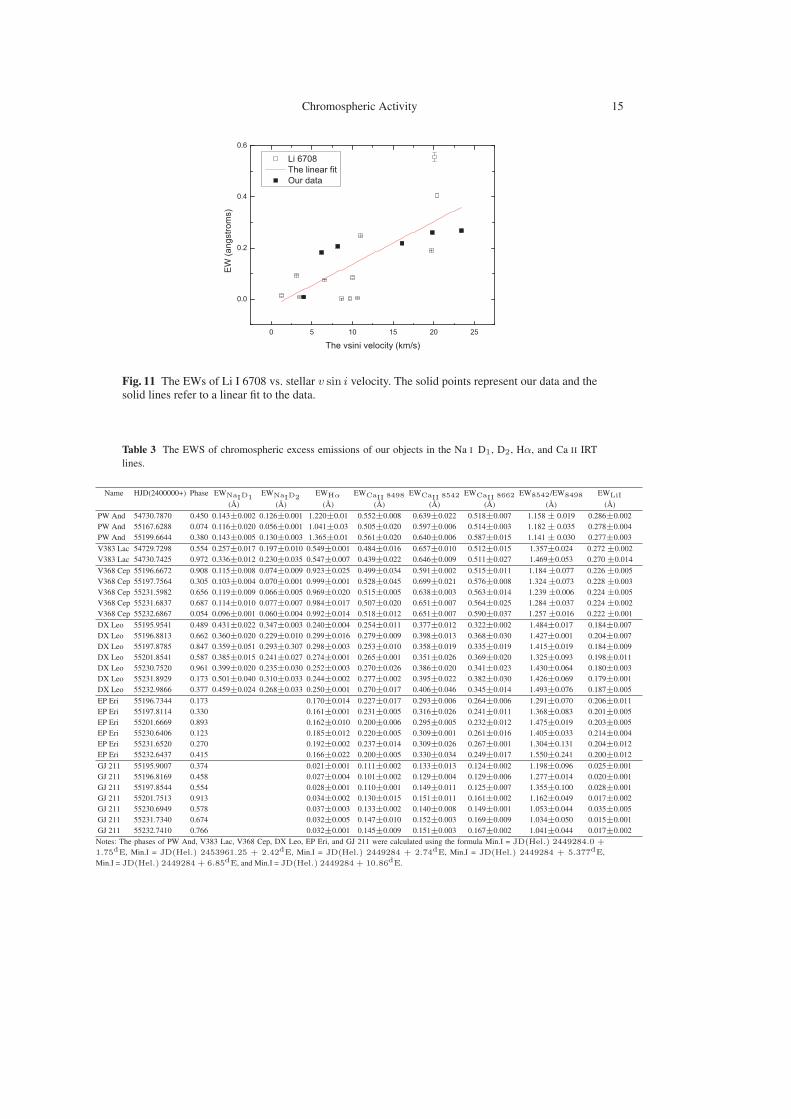
Fig. 11 The EWs of Li I 6708 vs. stellar v sin i velocity. The solid points represent our data and thesolid lines refer to a linear fit to the data.
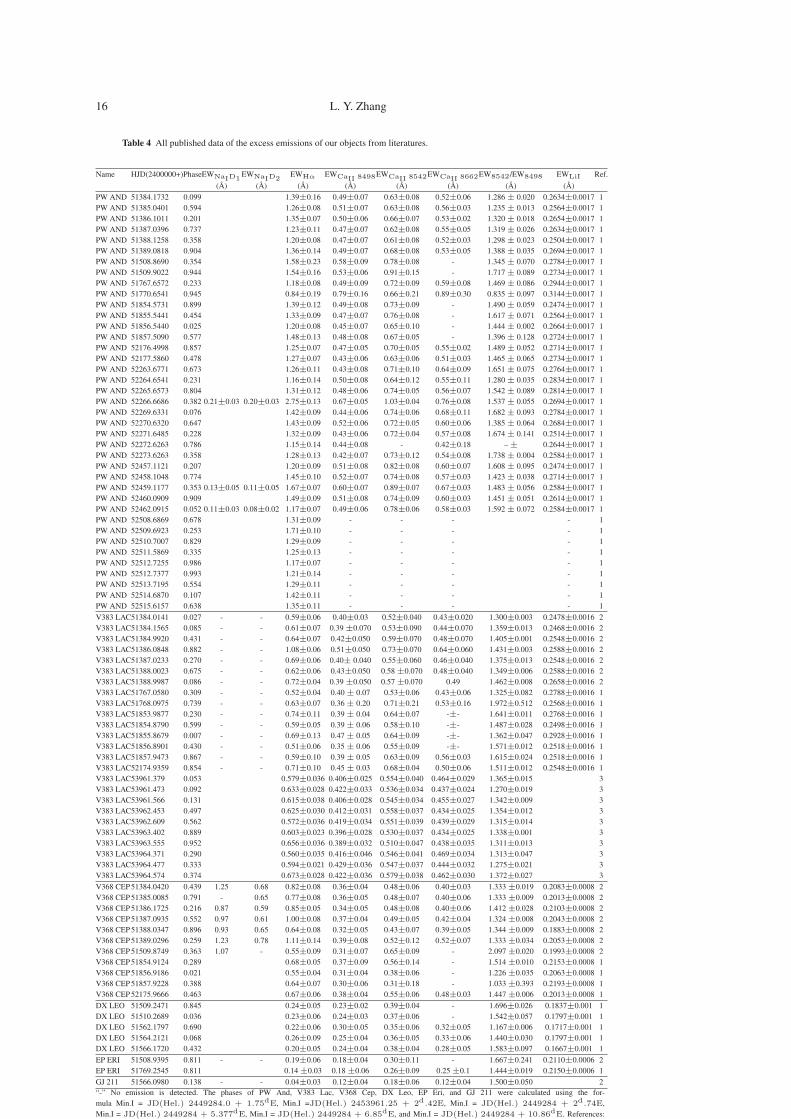
Table 3 The EWS of chromospheric excess emissions of our objects in the Na I D1, D2, Hα, and Ca II IRTlines.
Name HJD(2400000+) Phase EWNaID1 EWNaID2 EWHα EWCaII 8498 EWCaII 8542 EWCaII 8662 EW8542/EW8498 EWLiI(A) (A) (A) (A) (A) (A) (A) (A)
PW And 54730.7870 0.450 0.143±0.002 0.126±0.001 1.220±0.01 0.552±0.008 0.639±0.022 0.518±0.007 1.158± 0.019 0.286±0.002PW And 55167.6288 0.074 0.116±0.020 0.056±0.001 1.041±0.03 0.505±0.020 0.597±0.006 0.514±0.003 1.182± 0.035 0.278±0.004PW And 55199.6644 0.380 0.143±0.005 0.130±0.003 1.365±0.01 0.561±0.020 0.640±0.006 0.587±0.015 1.141± 0.030 0.277±0.003V383 Lac 54729.7298 0.554 0.257±0.017 0.197±0.010 0.549±0.001 0.484±0.016 0.657±0.010 0.512±0.015 1.357±0.024 0.272±0.002V383 Lac 54730.7425 0.972 0.336±0.012 0.230±0.035 0.547±0.007 0.439±0.022 0.646±0.009 0.511±0.027 1.469±0.053 0.270±0.014V368 Cep 55196.6672 0.908 0.115±0.008 0.074±0.009 0.923±0.025 0.499±0.034 0.591±0.002 0.515±0.011 1.184±0.077 0.226±0.005V368 Cep 55197.7564 0.305 0.103±0.004 0.070±0.001 0.999±0.001 0.528±0.045 0.699±0.021 0.576±0.008 1.324±0.073 0.228±0.003V368 Cep 55231.5982 0.656 0.119±0.009 0.066±0.005 0.969±0.020 0.515±0.005 0.638±0.003 0.563±0.014 1.239±0.006 0.224±0.005V368 Cep 55231.6837 0.687 0.114±0.010 0.077±0.007 0.984±0.017 0.507±0.020 0.651±0.007 0.564±0.025 1.284±0.037 0.224±0.002V368 Cep 55232.6867 0.054 0.096±0.001 0.060±0.004 0.992±0.014 0.518±0.012 0.651±0.007 0.590±0.037 1.257±0.016 0.222±0.001DX Leo 55195.9541 0.489 0.431±0.022 0.347±0.003 0.240±0.004 0.254±0.011 0.377±0.012 0.322±0.002 1.484±0.017 0.184±0.007DX Leo 55196.8813 0.662 0.360±0.020 0.229±0.010 0.299±0.016 0.279±0.009 0.398±0.013 0.368±0.030 1.427±0.001 0.204±0.007DX Leo 55197.8785 0.847 0.359±0.051 0.293±0.307 0.298±0.003 0.253±0.010 0.358±0.019 0.335±0.019 1.415±0.019 0.184±0.009DX Leo 55201.8541 0.587 0.385±0.015 0.241±0.027 0.274±0.001 0.265±0.001 0.351±0.026 0.369±0.020 1.325±0.093 0.198±0.011DX Leo 55230.7520 0.961 0.399±0.020 0.235±0.030 0.252±0.003 0.270±0.026 0.386±0.020 0.341±0.023 1.430±0.064 0.180±0.003DX Leo 55231.8929 0.173 0.501±0.040 0.310±0.033 0.244±0.002 0.277±0.002 0.395±0.022 0.382±0.030 1.426±0.069 0.179±0.001DX Leo 55232.9866 0.377 0.459±0.024 0.268±0.033 0.250±0.001 0.270±0.017 0.406±0.046 0.345±0.014 1.493±0.076 0.187±0.005EP Eri 55196.7344 0.173 0.170±0.014 0.227±0.017 0.293±0.006 0.264±0.006 1.291±0.070 0.206±0.011EP Eri 55197.8114 0.330 0.161±0.001 0.231±0.005 0.316±0.026 0.241±0.011 1.368±0.083 0.201±0.005EP Eri 55201.6669 0.893 0.162±0.010 0.200±0.006 0.295±0.005 0.232±0.012 1.475±0.019 0.203±0.005EP Eri 55230.6406 0.123 0.185±0.012 0.220±0.005 0.309±0.001 0.261±0.016 1.405±0.033 0.214±0.004EP Eri 55231.6520 0.270 0.192±0.002 0.237±0.014 0.309±0.026 0.267±0.001 1.304±0.131 0.204±0.012EP Eri 55232.6437 0.415 0.166±0.022 0.200±0.005 0.330±0.034 0.249±0.017 1.550±0.241 0.200±0.012GJ 211 55195.9007 0.374 0.021±0.001 0.111±0.002 0.133±0.013 0.124±0.002 1.198±0.096 0.025±0.001GJ 211 55196.8169 0.458 0.027±0.004 0.101±0.002 0.129±0.004 0.129±0.006 1.277±0.014 0.020±0.001GJ 211 55197.8544 0.554 0.028±0.001 0.110±0.001 0.149±0.011 0.125±0.007 1.355±0.100 0.028±0.001GJ 211 55201.7513 0.913 0.034±0.002 0.130±0.015 0.151±0.011 0.161±0.002 1.162±0.049 0.017±0.002GJ 211 55230.6949 0.578 0.037±0.003 0.133±0.002 0.140±0.008 0.149±0.001 1.053±0.044 0.035±0.005GJ 211 55231.7340 0.674 0.032±0.005 0.147±0.010 0.152±0.003 0.169±0.009 1.034±0.050 0.015±0.001GJ 211 55232.7410 0.766 0.032±0.001 0.145±0.009 0.151±0.003 0.167±0.002 1.041±0.044 0.017±0.002Notes: The phases of PW And, V383 Lac, V368 Cep, DX Leo, EP Eri, and GJ 211 were calculated using the formula Min.I = JD(Hel.) 2449284.0 +
1.75dE, Min.I = JD(Hel.) 2453961.25 + 2.42dE, Min.I = JD(Hel.) 2449284 + 2.74dE, Min.I = JD(Hel.) 2449284 + 5.377dE,Min.I = JD(Hel.) 2449284 + 6.85dE, and Min.I = JD(Hel.) 2449284 + 10.86dE.
16 L. Y. Zhang
Table 4 All published data of the excess emissions of our objects from literatures.
Name HJD(2400000+)PhaseEWNaID1 EWNaID2 EWHα EWCaII 8498EWCaII 8542EWCaII 8662EW8542/EW8498 EWLiI Ref.(A) (A) (A) (A) (A) (A) (A) (A)
PW AND 51384.1732 0.099 1.39±0.16 0.49±0.07 0.63±0.08 0.52±0.06 1.286± 0.020 0.2634±0.0017 1PW AND 51385.0401 0.594 1.26±0.08 0.51±0.07 0.63±0.08 0.56±0.03 1.235± 0.013 0.2564±0.0017 1PW AND 51386.1011 0.201 1.35±0.07 0.50±0.06 0.66±0.07 0.53±0.02 1.320± 0.018 0.2654±0.0017 1PW AND 51387.0396 0.737 1.23±0.11 0.47±0.07 0.62±0.08 0.55±0.05 1.319± 0.026 0.2634±0.0017 1PW AND 51388.1258 0.358 1.20±0.08 0.47±0.07 0.61±0.08 0.52±0.03 1.298± 0.023 0.2504±0.0017 1PW AND 51389.0818 0.904 1.36±0.14 0.49±0.07 0.68±0.08 0.53±0.05 1.388± 0.035 0.2694±0.0017 1PW AND 51508.8690 0.354 1.58±0.23 0.58±0.09 0.78±0.08 - 1.345± 0.070 0.2784±0.0017 1PW AND 51509.9022 0.944 1.54±0.16 0.53±0.06 0.91±0.15 - 1.717± 0.089 0.2734±0.0017 1PW AND 51767.6572 0.233 1.18±0.08 0.49±0.09 0.72±0.09 0.59±0.08 1.469± 0.086 0.2944±0.0017 1PW AND 51770.6541 0.945 0.84±0.19 0.79±0.16 0.66±0.21 0.89±0.30 0.835± 0.097 0.3144±0.0017 1PW AND 51854.5731 0.899 1.39±0.12 0.49±0.08 0.73±0.09 - 1.490± 0.059 0.2474±0.0017 1PW AND 51855.5441 0.454 1.33±0.09 0.47±0.07 0.76±0.08 - 1.617± 0.071 0.2564±0.0017 1PW AND 51856.5440 0.025 1.20±0.08 0.45±0.07 0.65±0.10 - 1.444± 0.002 0.2664±0.0017 1PW AND 51857.5090 0.577 1.48±0.13 0.48±0.08 0.67±0.05 - 1.396± 0.128 0.2724±0.0017 1PW AND 52176.4998 0.857 1.25±0.07 0.47±0.05 0.70±0.05 0.55±0.02 1.489± 0.052 0.2714±0.0017 1PW AND 52177.5860 0.478 1.27±0.07 0.43±0.06 0.63±0.06 0.51±0.03 1.465± 0.065 0.2734±0.0017 1PW AND 52263.6771 0.673 1.26±0.11 0.43±0.08 0.71±0.10 0.64±0.09 1.651± 0.075 0.2764±0.0017 1PW AND 52264.6541 0.231 1.16±0.14 0.50±0.08 0.64±0.12 0.55±0.11 1.280± 0.035 0.2834±0.0017 1PW AND 52265.6573 0.804 1.31±0.12 0.48±0.06 0.74±0.05 0.56±0.07 1.542± 0.089 0.2814±0.0017 1PW AND 52266.6686 0.382 0.21±0.03 0.20±0.03 2.75±0.13 0.67±0.05 1.03±0.04 0.76±0.08 1.537± 0.055 0.2694±0.0017 1PW AND 52269.6331 0.076 1.42±0.09 0.44±0.06 0.74±0.06 0.68±0.11 1.682± 0.093 0.2784±0.0017 1PW AND 52270.6320 0.647 1.43±0.09 0.52±0.06 0.72±0.05 0.60±0.06 1.385± 0.064 0.2684±0.0017 1PW AND 52271.6485 0.228 1.32±0.09 0.43±0.06 0.72±0.04 0.57±0.08 1.674± 0.141 0.2514±0.0017 1PW AND 52272.6263 0.786 1.15±0.14 0.44±0.08 - 0.42±0.18 –± 0.2644±0.0017 1PW AND 52273.6263 0.358 1.28±0.13 0.42±0.07 0.73±0.12 0.54±0.08 1.738± 0.004 0.2584±0.0017 1PW AND 52457.1121 0.207 1.20±0.09 0.51±0.08 0.82±0.08 0.60±0.07 1.608± 0.095 0.2474±0.0017 1PW AND 52458.1048 0.774 1.45±0.10 0.52±0.07 0.74±0.08 0.57±0.03 1.423± 0.038 0.2714±0.0017 1PW AND 52459.1177 0.353 0.13±0.05 0.11±0.05 1.67±0.07 0.60±0.07 0.89±0.07 0.67±0.03 1.483± 0.056 0.2584±0.0017 1PW AND 52460.0909 0.909 1.49±0.09 0.51±0.08 0.74±0.09 0.60±0.03 1.451± 0.051 0.2614±0.0017 1PW AND 52462.0915 0.052 0.11±0.03 0.08±0.02 1.17±0.07 0.49±0.06 0.78±0.06 0.58±0.03 1.592± 0.072 0.2584±0.0017 1PW AND 52508.6869 0.678 1.31±0.09 - - - - 1PW AND 52509.6923 0.253 1.71±0.10 - - - - 1PW AND 52510.7007 0.829 1.29±0.09 - - - - 1PW AND 52511.5869 0.335 1.25±0.13 - - - - 1PW AND 52512.7255 0.986 1.17±0.07 - - - - 1PW AND 52512.7377 0.993 1.21±0.14 - - - - 1PW AND 52513.7195 0.554 1.29±0.11 - - - - 1PW AND 52514.6870 0.107 1.42±0.11 - - - - 1PW AND 52515.6157 0.638 1.35±0.11 - - - - 1V383 LAC51384.0141 0.027 - - 0.59±0.06 0.40±0.03 0.52±0.040 0.43±0.020 1.300±0.003 0.2478±0.0016 2V383 LAC51384.1565 0.085 - - 0.61±0.07 0.39±0.070 0.53±0.090 0.44±0.070 1.359±0.013 0.2468±0.0016 2V383 LAC51384.9920 0.431 - - 0.64±0.07 0.42±0.050 0.59±0.070 0.48±0.070 1.405±0.001 0.2548±0.0016 2V383 LAC51386.0848 0.882 - - 1.08±0.06 0.51±0.050 0.73±0.070 0.64±0.060 1.431±0.003 0.2588±0.0016 2V383 LAC51387.0233 0.270 - - 0.69±0.06 0.40± 0.040 0.55±0.060 0.46±0.040 1.375±0.013 0.2548±0.0016 2V383 LAC51388.0023 0.675 - - 0.62±0.06 0.43±0.050 0.58±0.070 0.48±0.040 1.349±0.006 0.2588±0.0016 2V383 LAC51388.9987 0.086 - - 0.72±0.04 0.39±0.050 0.57±0.070 0.49 1.462±0.008 0.2658±0.0016 2V383 LAC51767.0580 0.309 - - 0.52±0.04 0.40± 0.07 0.53±0.06 0.43±0.06 1.325±0.082 0.2788±0.0016 1V383 LAC51768.0975 0.739 - - 0.63±0.07 0.36± 0.20 0.71±0.21 0.53±0.16 1.972±0.512 0.2568±0.0016 1V383 LAC51853.9877 0.230 - - 0.74±0.11 0.39± 0.04 0.64±0.07 -±- 1.641±0.011 0.2768±0.0016 1V383 LAC51854.8790 0.599 - - 0.59±0.05 0.39± 0.06 0.58±0.10 -±- 1.487±0.028 0.2498±0.0016 1V383 LAC51855.8679 0.007 - - 0.69±0.13 0.47± 0.05 0.64±0.09 -±- 1.362±0.047 0.2928±0.0016 1V383 LAC51856.8901 0.430 - - 0.51±0.06 0.35± 0.06 0.55±0.09 -±- 1.571±0.012 0.2518±0.0016 1V383 LAC51857.9473 0.867 - - 0.59±0.10 0.39± 0.05 0.63±0.09 0.56±0.03 1.615±0.024 0.2518±0.0016 1V383 LAC52174.9359 0.854 - - 0.71±0.10 0.45± 0.03 0.68±0.04 0.50±0.06 1.511±0.012 0.2548±0.0016 1V383 LAC53961.379 0.053 0.579±0.036 0.406±0.025 0.554±0.040 0.464±0.029 1.365±0.015 3V383 LAC53961.473 0.092 0.633±0.028 0.422±0.033 0.536±0.034 0.437±0.024 1.270±0.019 3V383 LAC53961.566 0.131 0.615±0.038 0.406±0.028 0.545±0.034 0.455±0.027 1.342±0.009 3V383 LAC53962.453 0.497 0.625±0.030 0.412±0.031 0.558±0.037 0.434±0.025 1.354±0.012 3V383 LAC53962.609 0.562 0.572±0.036 0.419±0.034 0.551±0.039 0.439±0.029 1.315±0.014 3V383 LAC53963.402 0.889 0.603±0.023 0.396±0.028 0.530±0.037 0.434±0.025 1.338±0.001 3V383 LAC53963.555 0.952 0.656±0.036 0.389±0.032 0.510±0.047 0.438±0.035 1.311±0.013 3V383 LAC53964.371 0.290 0.560±0.035 0.416±0.046 0.546±0.041 0.469±0.034 1.313±0.047 3V383 LAC53964.477 0.333 0.594±0.021 0.429±0.036 0.547±0.037 0.444±0.032 1.275±0.021 3V383 LAC53964.574 0.374 0.673±0.028 0.422±0.036 0.579±0.038 0.462±0.030 1.372±0.027 3V368 CEP 51384.0420 0.439 1.25 0.68 0.82±0.08 0.36±0.04 0.48±0.06 0.40±0.03 1.333±0.019 0.2083±0.0008 2V368 CEP 51385.0085 0.791 - 0.65 0.77±0.08 0.36±0.05 0.48±0.07 0.40±0.06 1.333±0.009 0.2013±0.0008 2V368 CEP 51386.1725 0.216 0.87 0.59 0.85±0.05 0.34±0.05 0.48±0.08 0.40±0.06 1.412±0.028 0.2103±0.0008 2V368 CEP 51387.0935 0.552 0.97 0.61 1.00±0.08 0.37±0.04 0.49±0.05 0.42±0.04 1.324±0.008 0.2043±0.0008 2V368 CEP 51388.0347 0.896 0.93 0.65 0.64±0.08 0.32±0.05 0.43±0.07 0.39±0.05 1.344±0.009 0.1883±0.0008 2V368 CEP 51389.0296 0.259 1.23 0.78 1.11±0.14 0.39±0.08 0.52±0.12 0.52±0.07 1.333±0.034 0.2053±0.0008 2V368 CEP 51509.8749 0.363 1.07 - 0.55±0.09 0.31±0.07 0.65±0.09 - 2.097±0.020 0.1993±0.0008 2V368 CEP 51854.9124 0.289 0.68±0.05 0.37±0.09 0.56±0.14 - 1.514±0.010 0.2153±0.0008 1V368 CEP 51856.9186 0.021 0.55±0.04 0.31±0.04 0.38±0.06 - 1.226±0.035 0.2063±0.0008 1V368 CEP 51857.9228 0.388 0.64±0.07 0.30±0.06 0.31±0.18 - 1.033±0.393 0.2193±0.0008 1V368 CEP 52175.9666 0.463 0.67±0.06 0.38±0.04 0.55±0.06 0.48±0.03 1.447±0.006 0.2013±0.0008 1DX LEO 51509.2471 0.845 0.24±0.05 0.23±0.02 0.39±0.04 - 1.696±0.026 0.1837±0.001 1DX LEO 51510.2689 0.036 0.23±0.06 0.24±0.03 0.37±0.06 - 1.542±0.057 0.1797±0.001 1DX LEO 51562.1797 0.690 0.22±0.06 0.30±0.05 0.35±0.06 0.32±0.05 1.167±0.006 0.1717±0.001 1DX LEO 51564.2121 0.068 0.26±0.09 0.25±0.04 0.36±0.05 0.33±0.06 1.440±0.030 0.1797±0.001 1DX LEO 51566.1720 0.432 0.20±0.05 0.24±0.04 0.38±0.04 0.28±0.05 1.583±0.097 0.1667±0.001 1EP ERI 51508.9395 0.811 - - 0.19±0.06 0.18±0.04 0.30±0.11 - 1.667±0.241 0.2110±0.0006 2EP ERI 51769.2545 0.811 0.14±0.03 0.18±0.06 0.26±0.09 0.25±0.1 1.444±0.019 0.2150±0.0006 1GJ 211 51566.0980 0.138 - - 0.04±0.03 0.12±0.04 0.18±0.06 0.12±0.04 1.500±0.050 2“-” No emission is detected. The phases of PW And, V383 Lac, V368 Cep, DX Leo, EP Eri, and GJ 211 were calculated using the for-mula Min.I = JD(Hel.) 2449284.0 + 1.75dE, Min.I =JD(Hel.) 2453961.25 + 2d.42E, Min.I = JD(Hel.) 2449284 + 2d.74E,Min.I = JD(Hel.) 2449284 + 5.377dE, Min.I = JD(Hel.) 2449284 + 6.85dE, and Min.I = JD(Hel.) 2449284 + 10.86dE. References:[1] Lopez-Santiago et al. (2010); [2]Montes et al. 2001a; [3] Biazzo et al. 2009; This table is available in its entirety in machine-readable forms in the onlinejournal.
Chromospheric Activity 17
Table 5 The average values of the excess chromospheric emissions for our objects and other singlestars in Pleiades.
Name Sp v sin i P EWNaID1 EWNaID2 EWHβ EWHα EWCa 8498 EWCa 8542 EWCa 8662 8542/8498 EWHα /Hβ EWLiI Ref.(A) (A) (A) (A) (A) (A) (A) (A) (A) (A)
DX Leo K0V6.2 5.380.413±0.0270.274±0.063 0.251±0.0280.261±0.021 0.377±0.034 0.339±0.030 1.444±0.014 0.183±0.0031EP Eri K1V8.2 6.85 0.171±0.0190.209±0.019 0.299±0.037 0.252±0.023 1.431±0.047 0.207±0.0061GJ 211 K1V4 10.9 - 0.031±0.0060.125±0.010 0.148±0.014 0.143±0.008 1.184±0.017 0.009±0.0021HD 166 K0V6.54 5.69 - 0.055±0.0200.165±0.100 0.200±0.130 1.212±0.053 0.076±0.0011BD+174799K0V11.03 0.61 0.170±0.0060.613±0.0680.375±0.043 0.510±0.073 0.450±0.043 1.360±0.0393.588±0.2730.248±0.0021BD+17232 K4V20.4 - 0.014±0.03 0.026±0.04 0.810±0.0171.87±0.23 - - - - 2.309±0.2360.406±0.0091HD 21845 K1V 1.45 - - - 0.34±0.004 0.27±0.04 0.48±0.06 - 1.778±0.041 0.220±0.0011HD 25665 K3V10.6 - - - - - - - - - 0.005±0.0011GJ 211 K1V8.69 10.0 - - - 0.04±0.03 0.12±0.04 0.18±0.06 0.12±0.04 1.500±0.000 0.002±0.0011BD+201790K5V10.03 - 0.075±0.04 0.098±0.03 0.878±0.0071.76±0.12 0.54±0.06 - - - 2.005±0.1210.085±0.0041HIP 39721 K5V0.60 - - - - - 0.05±0.03 0.05±0.03 - 1.000±1.00 - 1GJ 9251B K7V1.40 - - - - 0.02±0.01 0.05±0.02 0.05±0.01 0.04±0.03 1.000±0.20 - 1HIP39896 K7V11.35 - 0.045±0.03 0.07±0.02 0.655±0.0601.44±0.09 0.431±0.03 0.63±0.05 0.46±0.07 1.462±0.0142.198±0.064- 1HIP 50156 K7V7.68 7.98 0.06±0.02 0.09±0.02 0.795±0.1101.82±0.13 0.40±0.05 0.56±0.07 0.44±0.06 1.400±0.70 2.289±0.153- 1HD 98736 K1V1.25 - - - - - - - - - 0.015±0.0021GJ426B K7V3.47 - - - - - - - - - 0.009±0.0021HD 112733 K0V3.11 - - - - - - - - - 0.094±0.0021HD 147379 K7V9.69 - - - 1 - 0.02±0.03 0.04±0.02 0.08±0.01 0.12±0.09 2.000±0.750 - 1HD 160934 K7V19.73 1.84 0.083±0.03 0.12±0.03 0.840±0.1031.94±0.10 0.49±0.08 0.78±0.08 0.57±0.05 1.592±0.0972.310±0.1640.004±0.0031HIP 87768 K5V6.92 - - - - 0.03±0.03 0.03±0.02 0.04±0.01 0.03±0.01 1.333±0.556 - 1HIP 89874 K5V20.08 5.15 0.24±0.07 0.27±0.09 1.055±0.2005.17±0.39 0.92±0.18 1.89±0.22 1.49±0.19 2.054±0.1634.900±0.5590.555±0.0171HIP 101262 K4V9.79 - - - - 0.06±0.03 0.17±0.04 0.15±0.06 0.13±0.08 0.880±0.145 - 1HIP 106231 K3V73.52 0.42 0.14±0.06 0.18±0.07 0.748±0.1151.70±0.11 0.61±0.20 0.78±0.20 0.61±0.18 - 2.273±0.2020.233±0.0021PW And K2V23.4 1.750.142±0.0230.117±0.0180.546±0.0681.346±0.0010.506±0.068 0.716±0.076 0.582±0.065 1.415±0.0402.505±0.1260.268±0.0022,4V383 Lac K1V19.8 2.420.296±0.0150.213±0.0230.234±0.0490.635±0.0530.415±0.046 0.587±0.060 0.477±0.041 1.414±0.0122.979±0.3140.261±0.0023,4V368 Cep K1V16.1 2.740.109±0.0060.070±0.0050.275±0.0700.822±0.0560.399±0.044 0.535±0.064 0.485±0.036 1.341±0.0132.790±0.36 0.219±0.0024Ref: [1] Lopez-Santiago et al. 2010; [2]Montes et al. 2001a; [3] Biazzo et al. 2009; [4] my paper. “-” No emission is detected. This table is available in its entirety
in machine-readable and Virtual Observatory (VO) forms in the online journal.
objects, they exhibit filled-in absorption (V383 Lac and V368 Cep), and deep absorption (EP Eri,DX Leo, and GJ 211). The corresponding subtracted show obvious excess emission (V383 Lac andV368 Cep) or weak emission (EP Eri, DX Leo, and GJ 211). For the Ca II IRT lines, all these objectsshow a clear filled-in absorption with core-emission (PW And, V383 Lac, V368 Cep, DX Leo, andEP Eri) or unobservable emission (GJ 211). It is well known that the He I D3 line is a probe of flare-like events (Zirin 1988). For the He I D3 lines of our 30 spectra, we did not observe any emission,which means there were no strong flare-like episodes in our observing seasons. The data in presentpaper are not enough to study the chromophseric active rotational modulations of our targets.
The ratio of excess emission, EW8542/EW8498, is an indicator of the plage and prominence. Theratios of our objects are about 1.3 (Table 3). These small ratios support the previous results (:::::::Please
::::::author :::::check::is Montes et al. 2001a:::or:Montes et al. 2001b :?; etc) and indicate that there are opticallythick emissions in plage-like regions. These values were also detected in chromospheric active starsby previous authors: Lazaro & Arevalo (1997); Montes et al. (2000); Gu et al. (2002); Galvez et al.(2009); and Zhang & Gu (2008).
6 DISCUSSION
We will discuss the relationship of the equivalent widths of the Li I 6708 with rotation, and therelations between chromospheric activity with the stellar rotation by the average values of the chro-mospheric excess emission, the maximum amplitudes of the chromospheric rotational modulation,and the ratios of excess emissions of the EWCa8542/EWCa8498.
18 L. Y. Zhang
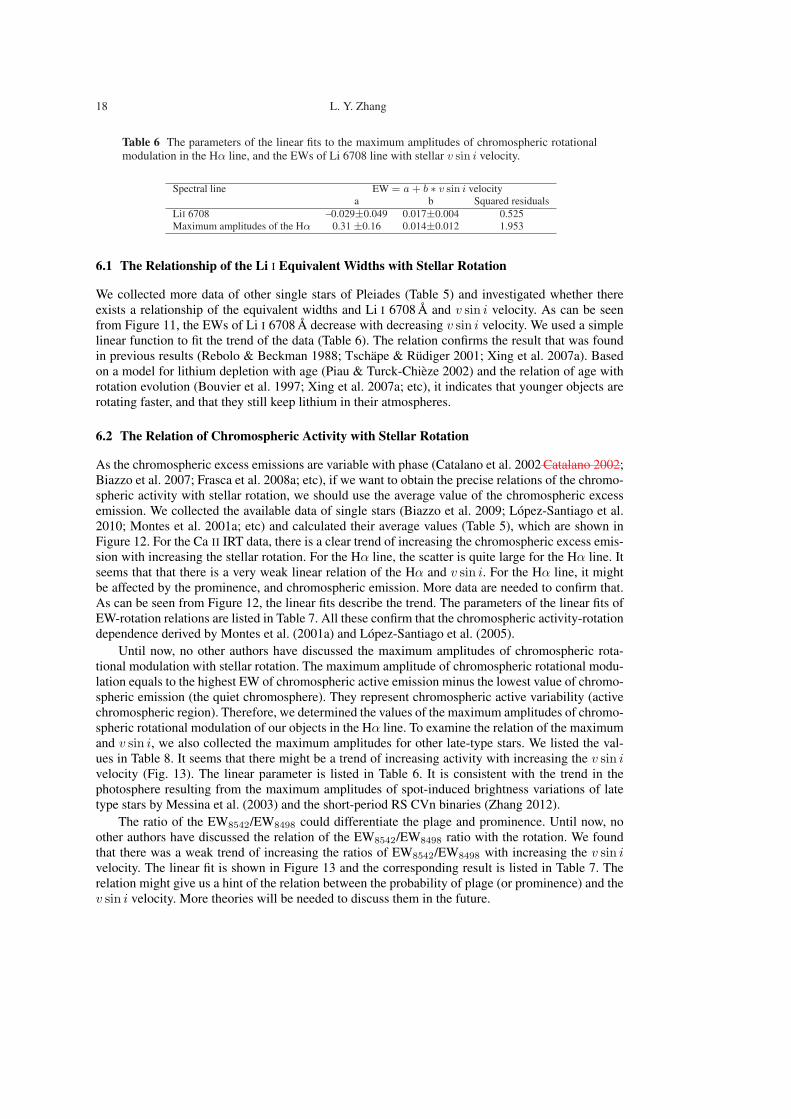
Table 6 The parameters of the linear fits to the maximum amplitudes of chromospheric rotationalmodulation in the Hα line, and the EWs of Li 6708 line with stellar v sin i velocity.
Spectral line EW = a + b ∗ v sin i velocitya b Squared residuals
LiI 6708 –0.029±0.049 0.017±0.004 0.525Maximum amplitudes of the Hα 0.31 ±0.16 0.014±0.012 1.953
6.1 The Relationship of the Li I Equivalent Widths with Stellar Rotation
We collected more data of other single stars of Pleiades (Table 5) and investigated whether thereexists a relationship of the equivalent widths and Li I 6708 A and v sin i velocity. As can be seenfrom Figure 11, the EWs of Li I 6708 A decrease with decreasing v sin i velocity. We used a simplelinear function to fit the trend of the data (Table 6). The relation confirms the result that was foundin previous results (Rebolo & Beckman 1988; Tschape & Rudiger 2001; Xing et al. 2007a). Basedon a model for lithium depletion with age (Piau & Turck-Chieze 2002) and the relation of age withrotation evolution (Bouvier et al. 1997; Xing et al. 2007a; etc), it indicates that younger objects arerotating faster, and that they still keep lithium in their atmospheres.
6.2 The Relation of Chromospheric Activity with Stellar Rotation
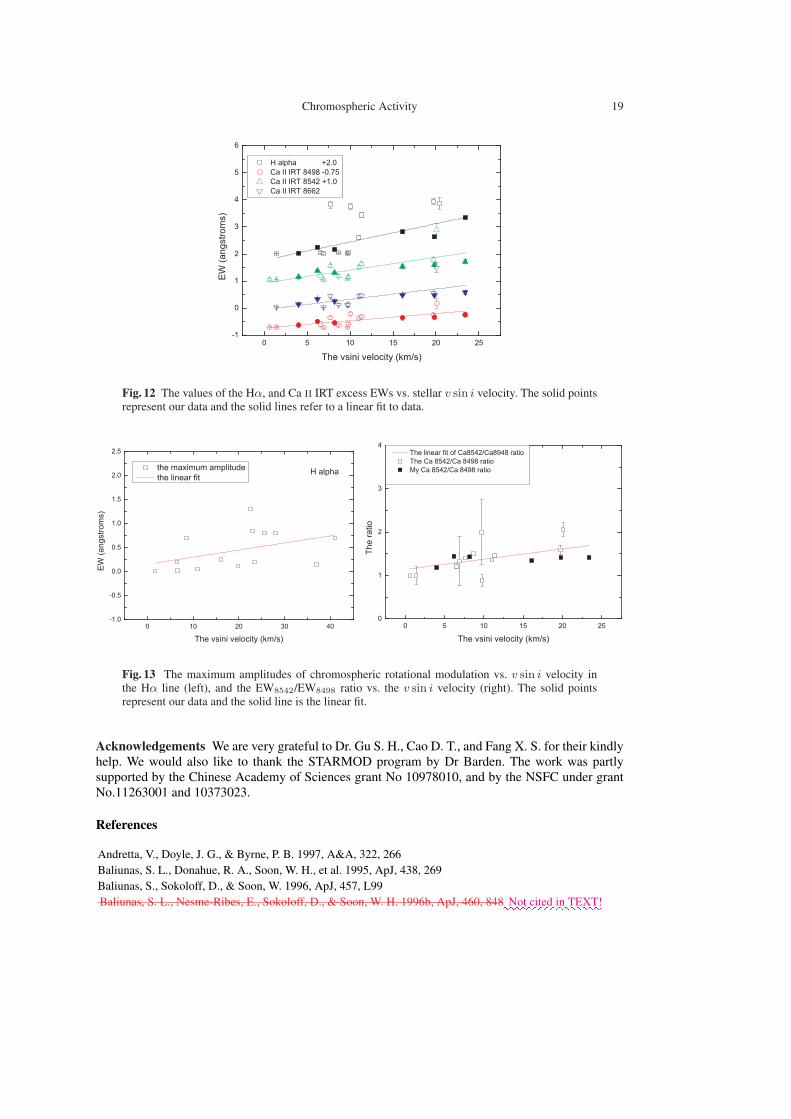
As the chromospheric excess emissions are variable with phase (Catalano et al. 2002 Catalano 2002;Biazzo et al. 2007; Frasca et al. 2008a; etc), if we want to obtain the precise relations of the chromo-spheric activity with stellar rotation, we should use the average value of the chromospheric excessemission. We collected the available data of single stars (Biazzo et al. 2009; Lopez-Santiago et al.2010; Montes et al. 2001a; etc) and calculated their average values (Table 5), which are shown inFigure 12. For the Ca II IRT data, there is a clear trend of increasing the chromospheric excess emis-sion with increasing the stellar rotation. For the Hα line, the scatter is quite large for the Hα line. Itseems that that there is a very weak linear relation of the Hα and v sin i. For the Hα line, it mightbe affected by the prominence, and chromospheric emission. More data are needed to confirm that.As can be seen from Figure 12, the linear fits describe the trend. The parameters of the linear fits ofEW-rotation relations are listed in Table 7. All these confirm that the chromospheric activity-rotationdependence derived by Montes et al. (2001a) and Lopez-Santiago et al. (2005).
Until now, no other authors have discussed the maximum amplitudes of chromospheric rota-tional modulation with stellar rotation. The maximum amplitude of chromospheric rotational modu-lation equals to the highest EW of chromospheric active emission minus the lowest value of chromo-spheric emission (the quiet chromosphere). They represent chromospheric active variability (activechromospheric region). Therefore, we determined the values of the maximum amplitudes of chromo-spheric rotational modulation of our objects in the Hα line. To examine the relation of the maximumand v sin i, we also collected the maximum amplitudes for other late-type stars. We listed the val-ues in Table 8. It seems that there might be a trend of increasing activity with increasing the v sin ivelocity (Fig. 13). The linear parameter is listed in Table 6. It is consistent with the trend in thephotosphere resulting from the maximum amplitudes of spot-induced brightness variations of latetype stars by Messina et al. (2003) and the short-period RS CVn binaries (Zhang 2012).
The ratio of the EW8542/EW8498 could differentiate the plage and prominence. Until now, noother authors have discussed the relation of the EW8542/EW8498 ratio with the rotation. We foundthat there was a weak trend of increasing the ratios of EW8542/EW8498 with increasing the v sin ivelocity. The linear fit is shown in Figure 13 and the corresponding result is listed in Table 7. Therelation might give us a hint of the relation between the probability of plage (or prominence) and thev sin i velocity. More theories will be needed to discuss them in the future.
Chromospheric Activity 19
Fig. 12 The values of the Hα, and Ca II IRT excess EWs vs. stellar v sin i velocity. The solid pointsrepresent our data and the solid lines refer to a linear fit to data.
Fig. 13 The maximum amplitudes of chromospheric rotational modulation vs. v sin i velocity inthe Hα line (left), and the EW8542/EW8498 ratio vs. the v sin i velocity (right). The solid pointsrepresent our data and the solid line is the linear fit.
Acknowledgements We are very grateful to Dr. Gu S. H., Cao D. T., and Fang X. S. for their kindlyhelp. We would also like to thank the STARMOD program by Dr Barden. The work was partlysupported by the Chinese Academy of Sciences grant No 10978010, and by the NSFC under grantNo.11263001 and 10373023.
References
Andretta, V., Doyle, J. G., & Byrne, P. B. 1997, A&A, 322, 266Baliunas, S. L., Donahue, R. A., Soon, W. H., et al. 1995, ApJ, 438, 269Baliunas, S., Sokoloff, D., & Soon, W. 1996, ApJ, 457, L99Baliunas, S. L., Nesme-Ribes, E., Sokoloff, D., & Soon, W. H. 1996b, ApJ, 460, 848::::Not::::cited::in::::::TEXT!
20 L. Y. Zhang
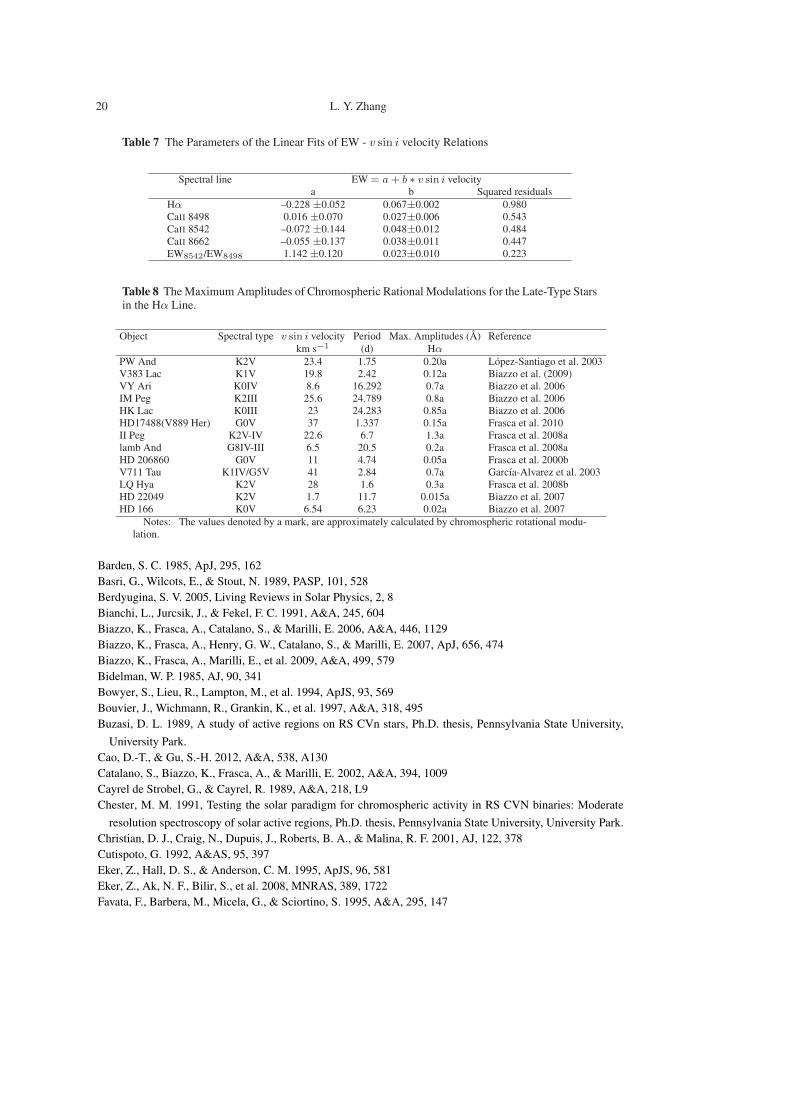
Table 7 The Parameters of the Linear Fits of EW - v sin i velocity Relations
Spectral line EW = a + b ∗ v sin i velocitya b Squared residuals
Hα –0.228 ±0.052 0.067±0.002 0.980CaII 8498 0.016 ±0.070 0.027±0.006 0.543CaII 8542 –0.072 ±0.144 0.048±0.012 0.484CaII 8662 –0.055 ±0.137 0.038±0.011 0.447EW8542/EW8498 1.142 ±0.120 0.023±0.010 0.223
Table 8 The Maximum Amplitudes of Chromospheric Rational Modulations for the Late-Type Starsin the Hα Line.
Object Spectral type v sin i velocity Period Max. Amplitudes (A) Referencekm s−1 (d) Hα
PW And K2V 23.4 1.75 0.20a Lopez-Santiago et al. 2003V383 Lac K1V 19.8 2.42 0.12a Biazzo et al. (2009)VY Ari K0IV 8.6 16.292 0.7a Biazzo et al. 2006IM Peg K2III 25.6 24.789 0.8a Biazzo et al. 2006HK Lac K0III 23 24.283 0.85a Biazzo et al. 2006HD17488(V889 Her) G0V 37 1.337 0.15a Frasca et al. 2010II Peg K2V-IV 22.6 6.7 1.3a Frasca et al. 2008alamb And G8IV-III 6.5 20.5 0.2a Frasca et al. 2008aHD 206860 G0V 11 4.74 0.05a Frasca et al. 2000bV711 Tau K1IV/G5V 41 2.84 0.7a Garcıa-Alvarez et al. 2003LQ Hya K2V 28 1.6 0.3a Frasca et al. 2008bHD 22049 K2V 1.7 11.7 0.015a Biazzo et al. 2007HD 166 K0V 6.54 6.23 0.02a Biazzo et al. 2007
Notes: The values denoted by a mark, are approximately calculated by chromospheric rotational modu-lation.
Barden, S. C. 1985, ApJ, 295, 162Basri, G., Wilcots, E., & Stout, N. 1989, PASP, 101, 528Berdyugina, S. V. 2005, Living Reviews in Solar Physics, 2, 8Bianchi, L., Jurcsik, J., & Fekel, F. C. 1991, A&A, 245, 604Biazzo, K., Frasca, A., Catalano, S., & Marilli, E. 2006, A&A, 446, 1129Biazzo, K., Frasca, A., Henry, G. W., Catalano, S., & Marilli, E. 2007, ApJ, 656, 474Biazzo, K., Frasca, A., Marilli, E., et al. 2009, A&A, 499, 579Bidelman, W. P. 1985, AJ, 90, 341Bowyer, S., Lieu, R., Lampton, M., et al. 1994, ApJS, 93, 569Bouvier, J., Wichmann, R., Grankin, K., et al. 1997, A&A, 318, 495Buzasi, D. L. 1989, A study of active regions on RS CVn stars, Ph.D. thesis, Pennsylvania State University,
University Park.Cao, D.-T., & Gu, S.-H. 2012, A&A, 538, A130Catalano, S., Biazzo, K., Frasca, A., & Marilli, E. 2002, A&A, 394, 1009Cayrel de Strobel, G., & Cayrel, R. 1989, A&A, 218, L9Chester, M. M. 1991, Testing the solar paradigm for chromospheric activity in RS CVN binaries: Moderate
resolution spectroscopy of solar active regions, Ph.D. thesis, Pennsylvania State University, University Park.Christian, D. J., Craig, N., Dupuis, J., Roberts, B. A., & Malina, R. F. 2001, AJ, 122, 378Cutispoto, G. 1992, A&AS, 95, 397Eker, Z., Hall, D. S., & Anderson, C. M. 1995, ApJS, 96, 581Eker, Z., Ak, N. F., Bilir, S., et al. 2008, MNRAS, 389, 1722Favata, F., Barbera, M., Micela, G., & Sciortino, S. 1995, A&A, 295, 147
Chromospheric Activity 21
Fekel, F. C., Bopp, B. W., Africano, J. L., et al. 1986, AJ, 92, 1150Fekel, F. C. 1997, PASP, 109, 514Fraquelli, D. A. 1984, ApJ, 276, 243Frasca, A., Freire Ferrero, R., Marilli, E., & Catalano, S. 2000a, A&A, 364, 179Frasca, A., Marino, G., Catalano, S., & Marilli, E. 2000b, A&A, 358, 1007Frasca, A., Cakırlı, O., Catalano, S., et al. 2002, A&A, 388, 298Frasca, A., Biazzo, K., Tas, G., Evren, S., & Lanzafame, A. C. 2008a, A&A, 479, 557Frasca, A., Kovari, Z., Strassmeier, K. G., & Biazzo, K. 2008b, A&A, 481, 229Frasca, A., Biazzo, K., Kovari, Z., Marilli, E., & Cakırlı, O. 2010, A&A, 518, A48Gaidos, E. J., Henry, G. W., & Henry, S. M. 2000, AJ, 120, 1006Galvez, M. C., Montes, D., Fernandez-Figueroa, M. J., de Castro, E., & Cornide, M. 2007, A&A, 472, 587::::Not:::::cited!
Galvez, M. C., Montes, D., Fernandez-Figueroa, M. J., De Castro, E., & Cornide, M. 2009, AJ, 137, 3965Garcıa-Alvarez, D., Foing, B. H., Montes, D., et al. 2003, A&A, 397, 285Gershberg, R. E., Katsova, M. M., Lovkaya, M. N., Terebizh, A. V., & Shakhovskaya, N. I. 1999, A&AS, 139,
555Griffin, R. E. M., & Griffin, R. F. 2004, MNRAS, 350, 685Gu, S.-h., Collier Cameron, A., & Kim, K. M. 2010, in IAU Symposium, vol. 264, eds. A. G. Kosovichev,
A. H. Andrei, & J.-P. Rozelot, 90Gu, S.-H., Tan, H.-S., Shan, H.-G., & Zhang, F.-H. 2002, A&A, 388, 889Gudel, M. 2002, ARA&A, 40, 217Gunn, A. G., & Doyle, J. G. 1997, A&A, 318, 60Hall, J. C. 2008, Living Reviews in Solar Physics, 5, 2Hall, J. C., & Ramsey, L. W. 1992, AJ, 104, 1942Henry, G. W., Eaton, J. A., Hamer, J., & Hall, D. S. 1995a, ApJS, 97, 513Henry, G. W., Fekel, F. C., & Hall, D. S. 1995b, AJ, 110, 2926Herbig, G. H. 1985, ApJ, 289, 269Høg, E., Fabricius, C., Makarov, V. V., et al. 2000, A&A, 500 355, 583 L27Hooten, J. T., & Hall, D. S. 1990, ApJS, 74, 225Houdebine, E. R., Stempels, H. C., & Oliveira, J. H. 2009, MNRAS, 400, 238Hunsch, M., Schmitt, J. H. M. M., Sterzik, M. F., & Voges, W. 1999, A&AS, 135, 319Jeffries, R. D. 1995, MNRAS, 273, 559Joy, A. H., & Wilson, R. E. 1949, ApJ, 109, 231Kahanpaa, J., Jetsu, L., Alha, L., et al. 1999, A&A, 350, 513Kashapova, L. K., Kotrc, P., & Kupryakov, Y. A. 2008, Annales Geophysicae, 26, 2975Lampton, M., Lieu, R., Schmitt, J. H. M. M., et al. 1997, ApJS, 108, 545:::Not:::::cited!Lazaro, C., & Arevalo, M. J. 1997, AJ, 113, 2283Lopez-Santiago, J., Montes, D., Fernandez-Figueroa, M. J., & Ramsey, L. W. 2003, A&A, 411, 489Lopez-Santiago, J., Montes, D., Fernandez-Figueroa, M. J., Galvez, M. C., & Crespo-Chacon, I. 2005, in 13th
Cambridge Workshop on Cool Stars, Stellar Systems and the Sun, ESA Special Publication, vol. 560, eds.F. Favata, G. A. J. Hussain, & B. Battrick, 775
Lopez-Santiago, J., Montes, D., Crespo-Chacon, I., & Fernandez-Figueroa, M. J. 2006, ApJ, 643, 1160Lopez-Santiago, J., Montes, D., Galvez-Ortiz, M. C., et al. 2010, A&A, 514, A97Malina, R. F., Marshall, H. L., Antia, B., et al. 1994, AJ, 107, 751::::Not:::::cited!Mantegazza, L., Poretti, E., Antonello, E., & Bossi, M. 1992, A&A, 256, 459Martınez-Arnaiz, R., Lopez-Santiago, J., Crespo-Chacon, I., & Montes, D. 2011, MNRAS, 414, 2629Messina, S., & Guinan, E. F. 1996, Information Bulletin on Variable Stars, 4286, 1Messina, S., Guinan, E. F., Lanza, A. F., & Ambruster, C. 1999, A&A, 347, 249
22 L. Y. Zhang
Messina, S., Pizzolato, N., Guinan, E. F., & Rodono, M. 2003, A&A, 410, 671Montes, D., Fernandez-Figueroa, M. J., de Castro, E., & Cornide, M. 1995, A&A, 294, 165Montes, D., Fernandez-Figueroa, M. J., de Castro, E., & Sanz-Forcada, J. 1997, A&AS, 125, 263Montes, D., Saar, S. H., Collier Cameron, A., & Unruh, Y. C. 1999, MNRAS, 305, 45Montes, D., Fernandez-Figueroa, M. J., De Castro, E., et al. 2000, A&AS, 146, 103Montes, D., Lopez-Santiago, J., Fernandez-Figueroa, M. J., & Galvez, M. C. 2001a, A&A, 379, 976Montes, D., Lopez-Santiago, J., Galvez, M. C., et al. 2001b, MNRAS, 328, 45Montes, D., Crespo-Chacon, I., Galvez, M. C., et al. 2004, Lecture Notes and Essays in Astrophysics, 1, 119Mulliss, C. L., & Bopp, B. W. 1994, PASP, 106, 822Nugent, J. J., Jensen, K. A., Nousek, J. A., et al. 1983, ApJS, 51, 1Osten, R. A., & Saar, S. H. 1998, MNRAS, 295, 257Pandey, J. C., & Singh, K. P. 2008, MNRAS, 387, 1627Pasquini, L., Pallavicini, R., & Pakull, M. 1988, A&A, 191, 253Piau, L., & Turck-Chieze, S. 2002, ApJ, 566, 419Poretti, E., Mantegazza, L., & Antonello, E. 1985, Information Bulletin on Variable Stars, 2807, 1Pounds, K. A., Abbey, A. F., Barstow, M. A., et al. 1991, MNRAS, 253, 364Pravdo, S. H., White, N. E., & Giommi, P. 1985, MNRAS, 215, 11Pye, J. P., McGale, P. A., Allan, D. J., et al. 1995, MNRAS, 274, 1165Rebolo, R., & Beckman, J. E. 1988, A&A, 201, 267Robb, R. M., Steinbring, E., Balogh, M., et al. 1995, Information Bulletin on Variable Stars, 4281, 1Shcherbakov, A. G., Shcherbakova, Z. A., Tuominen, I., & Jetsu, L. 1996, A&A, 309, 655Soderblom, D. R., & Clements, S. D. 1987, AJ, 93, 920Soderblom, D. R., Pilachowski, C. A., Fedele, S. B., & Jones, B. F. 1993a, AJ, 105, 2299Soderblom, D. R., Stauffer, J. R., Hudon, J. D., & Jones, B. F. 1993b, ApJS, 85, 315Strassmeier, K. G., Hall, D. S., Fekel, F. C., & Scheck, M. 1993, A&AS, 100, 173Strassmeier, K. G., Bartus, J., Cutispoto, G., & Rodono, M. 1997, A&AS, 125, 11Strassmeier, K., Washuettl, A., Granzer, T., Scheck, M., & Weber, M. 2000, A&AS, 142, 275Strassmeier, K. G., & Rice, J. B. 2006, A&A, 460, 751Strassmeier, K. G. 2009, A&A Rev., 17, 251Tschape, R., & Rudiger, G. 2001, A&A, 377, 84Vaughan, A. H., Preston, G. W., Baliunas, S. L., et al. 1981, ApJ, 250, 276::::Not:::::cited!Wang, H. J., Wei, J. Y., Shi, J. R., & Zhao, J. K. 2009, A&A, 500, 1215Wichmann, R., Schmitt, J. H. M. M., & Hubrig, S. 2003, A&A, 399, 983Wood, B. E., Ambruster, C. W., Brown, A., & Linsky, J. L. 2000, ApJ, 542, 411Xing, L.-F., Shi, J.-R., & Wei, J.-Y. 2007a, New Astron., 12, 4 265Xing, L.-F., Zhao, S.-Y., Su, W., et al. 2007b, ChJAA (Chin. J. Astron. Astrophys.), 7, 551Zhang, L.-Y., & Gu, S.-H. 2008, A&A, 487, 709Zhang, L. 2011, in Astronomical Society of the Pacific Conference Series, vol. 451, eds. S. Qain, K. Leung,
L. Zhu, & S. Kwok, 123Zhang, L.-Y. 2012, RAA (Research in Astronomy and Astrophysics), 12, 433Zhang, L., Pi, Q., Zhu, Z., Zhang, X., & Li, Z. 2014, New Astron., 32, 1Zhao, G., & Li, H.-B. 2001, ChJAA (Chin. J. Astron. Astrophys.), 1, 555Zhao, J. K., Oswalt, T. D., Rudkin, M., Zhao, G., & Chen, Y. Q. 2011, AJ, 141, 107Zhao, J. K., Oswalt, T. D., Zhao, G., et al. 2013, AJ, 145, 140Zirin, H. 1988, Astrophysics of the sun (Cambridge and New York, Cambridge University Press, 1988, 440 p.)


![MHD Wave Modes Resolved in Fine-Scale Chromospheric … · MHD Wave MoDeS ReSoLveD in Fine‐SCaLe CHRoMoSpHeRiC MagnetiC StRuCtuReS 435 Erdélyi [2009]). However, what causes their](https://img.dokumen.tips/doc/110x75/5e6ceebc20674f6d791c9507/mhd-wave-modes-resolved-in-fine-scale-chromospheric-mhd-wave-modes-resolved-in-fineascale.jpg)