Embed Size (px)
Citation preview
Econometric Analysis of the India–Sri LankaFree Trade Agreement*
Vivek Joshi
Received 19 March 2010; accepted 21 November 2011
This paper investigates whether the India–Sri Lanka Free Trade Agreement(ISLFTA) has had trade creation or trade diversion effects on the rest of the world.Using data on tariffs at the six-digit level of the Harmonized System classificationfor the period 1996 to 2006, the methodology of the present paper follows a studyon the North American Free Trade Agreement by Romalis (2005) We use thecommodity and time variation in the tariff preferences allowed under ISLFTA toidentify its effect on sourcing of different products from the ‘control country’ to theISLFTA region. Using a fixed effects model, we find that the ISLFTA has had smalltrade creation effects in the control countries.
Keywords: free trade agreement, tariffs, trade creation.
JEL classification codes: F10, F13, F15.
doi: 10.1111/j.1467-8381.2012.02078.x
I. Introduction
The growth of regional trade blocs has been a major development in internationalrelations over the past decade. During the 1990s, regionalism was conceived as adevelopmental option that would promote competitiveness of trade bloc membersand help accelerate members’ integration into the international economy. Theboom in free trade agreements (FTA) reflects changes in trade policy objectives ofcertain countries, changing perceptions of the multilateral liberalization process,and reintegration into the global economy of countries in transition from socialism.
Free trade agreements vary widely but all have the objective of reducing tradebarriers between member countries, which implies discrimination in trade withnon-member countries. At their simplest, these agreements merely remove tariffson intra-bloc trade in goods, but many go beyond this to cover non-tariff barriersand to extend liberalization to investment and other policies. In contrast, othershave the goal of economic union and involve construction of shared executive,judicial and legislative institutions. Many factors, some explicitly stated and othersnot so publicly admitted, have been responsible for the recent spurt in regionalism.
*Joshi: Graduate Institute of International and Development Studies, Avenue de la Paix 11A,CH-1202 Geneva, Switzerland. Email: [email protected]. I gratefully acknowledgevaluable guidance from my supervisor, Richard Baldwin. I also thank Patrick Low, John Cuddy, JayaKrishnakumar and Theresa Carpenter for helpful comments on previous drafts. Last but not least, Iacknowledge support from the Swiss National Centre of Competence in Research (Trade).
bs_bs_banner
Asian Economic Journal 2012, Vol. 26 No. 2, 159–180 159
© 2012 The AuthorAsian Economic Journal © 2012 East Asian Economic Association and Blackwell Publishing Pty Ltd
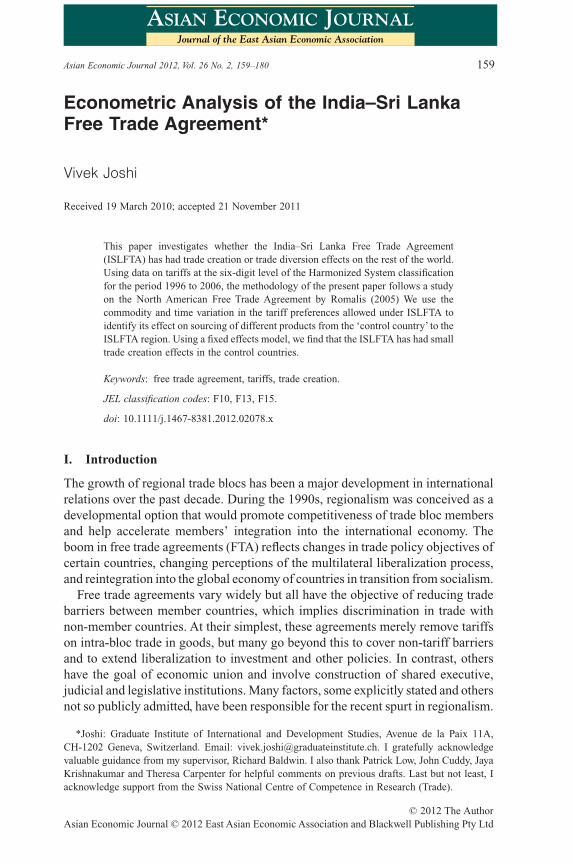
The desire to accelerate multilateral integration in selected areas by creating morepowerful blocs that would operate within the GATT/WTO system and the fear ofbeing left out while the rest of the world pursues regionalism are often cited asmajor reasons for the growth of FTA.1 Since China’s entry into the WTO, East Asiahas experienced a massive domino effect, with dozens of new FTA beingannounced, negotiated and signed (Baldwin, 2006). The growth of FTA in Asia asestimated by the Asian Development Bank (ADB) is depicted in Figure 1.
There has been considerable debate in academic circles about the impact of FTAon member countries and on the rest of the world (Bhagwati and Krueger, 1995).One view is that FTA improve resource allocation within a region and improveincome for member countries by reducing trade barriers. Consumers are better offas they can buy goods from the most efficient supplier at the lowest cost. This is theso-called trade creation effect for FTA members. In general, an FTA would lead tosome amount of trade creation and trade diversion. If the trade diversion issufficiently large relative to the trade creation effects, the FTA could conceivablyend up being harmful to the member countries.
In this paper, we analyze the India–Sri Lanka Free Trade Agreement (ISLFTA)to clarify its trade creation and trade diversion effects on the rest of the world. Weuse detailed trade data at the Harmonized System (HS) six-digit level to study thetrade effects under ISLFTA. We choose this FTA because it is one of the few
1 Article XXIV of the GATT, 1994 imposes three basic obligations on WTO members wishing toenter into an FTA covering trade in goods: (i) an obligation to notify the FTA of the WTO; (ii) anobligation not to raise the overall level of protection and make access of products of third parties notparticipating in the FTA more onerous (the so-called external trade requirement); and (iii) an obliga-tion to liberalize substantially all the trade among constituents of the FTA (the so-called internal traderequirement).
Figure 1 Free trade agreements in Asia: Cumulative status (December, 2007)
1975
1980
1982
1989
1992
1994
Year
Free trade agreements
0
50
100
150
200
250
Num
ber
1996
1998
2000
2002
2004
2006
Source: ADB, Manila.
ASIAN ECONOMIC JOURNAL 160
© 2012 The AuthorAsian Economic Journal © 2012 East Asian Economic Association and Blackwell Publishing Pty Ltd
south–south agreements that is successful and could be an example for other suchagreements to emulate. Holmes (2005) concludes that ISLFTA is one of the feweffective south–south FTA. Using a gravity model, Holmes tested 122 FTA andfound that only 46 percent of FTA (including ISLFTA) were effectively imple-mented, in the sense that they positively and significantly increased the trade flowsbetween member countries. The success of ISLFTA has suggested that if theconcerns of a smaller economy are taken into account, then differences in sizeamong FTA partners do not matter. Being the first of its kind in the South Asianregion, ISLFTA has attracted a lot of interest among the exporters of the region.
This paper is organized as follows. Section II briefly outlines of the ISLFTAand preliminarily assesses its effectiveness. Sections III–V review the relevantliterature, discuss the analytical methodology and summarize the theoreticalmodel, respectively. Section VI describes the data and their limitations. SectionVII analyzes the econometric results and related problems. Finally, Section VIIIsummarizes the major findings.
II. Assessment of Trade under the India–Sri Lanka Free TradeAgreement
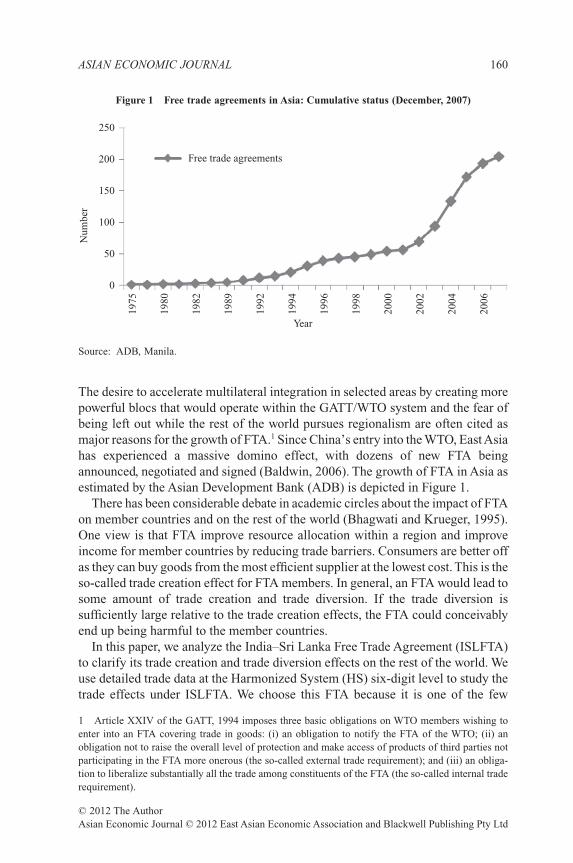
The India Sri Lanka FTA was signed in 1998 and became operational in March2000. Mutual phased tariff concessions on different products on the basis ofsix-digit HS code have been granted by both partners.2 Under the framework ofISLFTA, each side has its negative list (no concessions),3 positive list (immediatefull concessions) and a residual list (phased tariff reductions).4 The preferentialtrade under the FTA is governed by Rules of Origin,5 which specify the criteria fora product to qualify for tariff concessions from the importing member. Figure 2
2 The Harmonized Commodity Description and Coding System, commonly referred to as the‘Harmonized System’ or HS, is an international commodity classification system developed under theauspices of the Brussels-based Customs Cooperation Council, known today as the World CustomsOrganization. The HS consists of 21 sections covering 99 chapters, 1241 headings and over 5000commodity groups.3 Products that are considered sensitive to the domestic industry by each FTA partner are includedin the respective negative list. The products in the negative list for Sri Lanka are not entitled to any dutyconcessions for imports from India. The same rule applies in case of India’s negative list for SriLankan products.4 The positive list and residual list are considered less sensitive to domestic interests by each partnerand are included in the phased reduction of tariffs by both sides. All three lists in respect of India andSri Lanka are available on Sri Lanka’s Department of Commerce website: http://www.doc.gov.lk/web/indusrilanka_freetrade.php.5 The customs duties applied to imported products may differ depending on the country from whichthe products were exported. Most industrial products available on the market today are produced inmore than one country. For example, in the case of cotton shirts, it is possible that the cotton used intheir production is manufactured in country A, the textile woven, dyed and printed in country B, thecloth cut and stitched in country C and the shirts packed for retail in country D before being exportedto country E. Article VII together with Appendix C of the India Sri Lanka FTA specify the rules oforigin for the preferential treatment of products by partner countries. Rules of origin criteria are crucialto ensure that preferential tariffs are not used to route the non-FTA country products to the FTA.
INDIA–SRI LANKA FREE TRADE AGREEMENT 161
© 2012 The AuthorAsian Economic Journal © 2012 East Asian Economic Association and Blackwell Publishing Pty Ltd
compares India’s (Sri Lanka’s) average applied most favored nation (MFN) tariffwith its preferential tariffs for Sri Lanka (India).6 Further details about the com-mitment of both partners are shown in Appendix I.
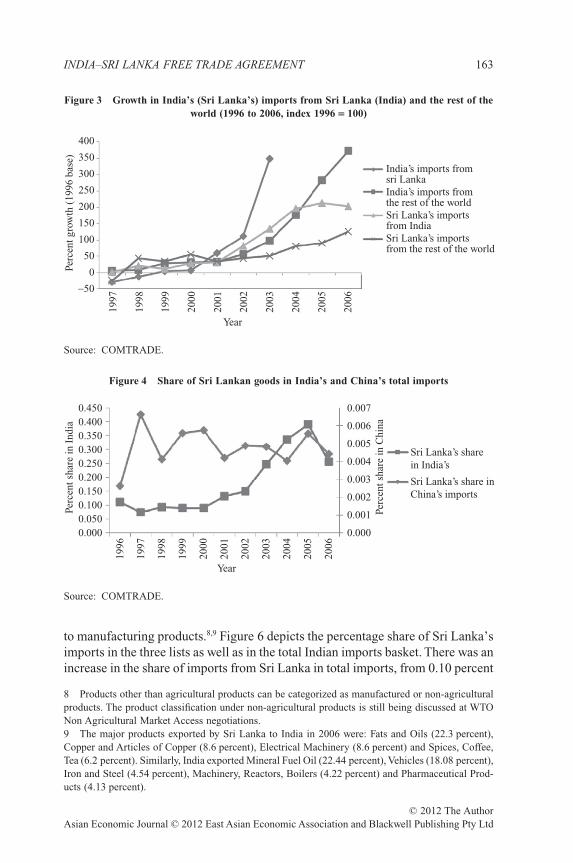
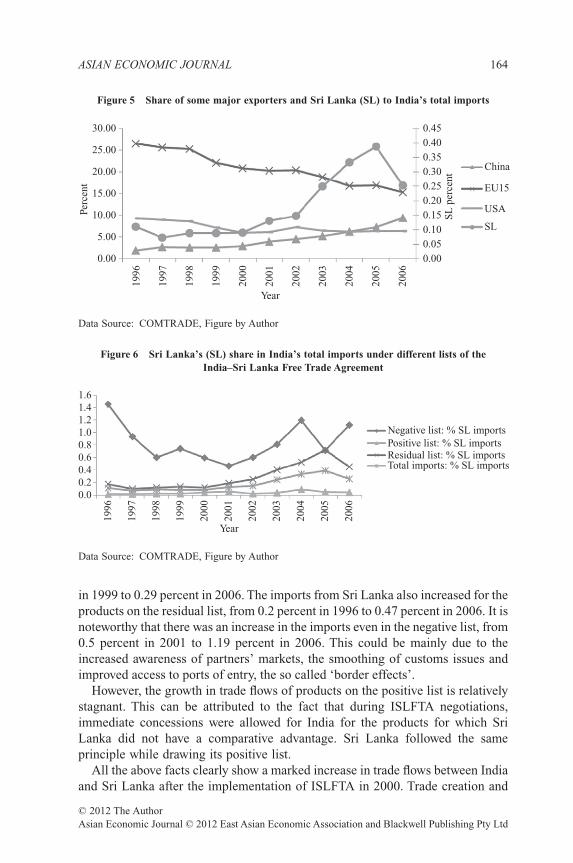
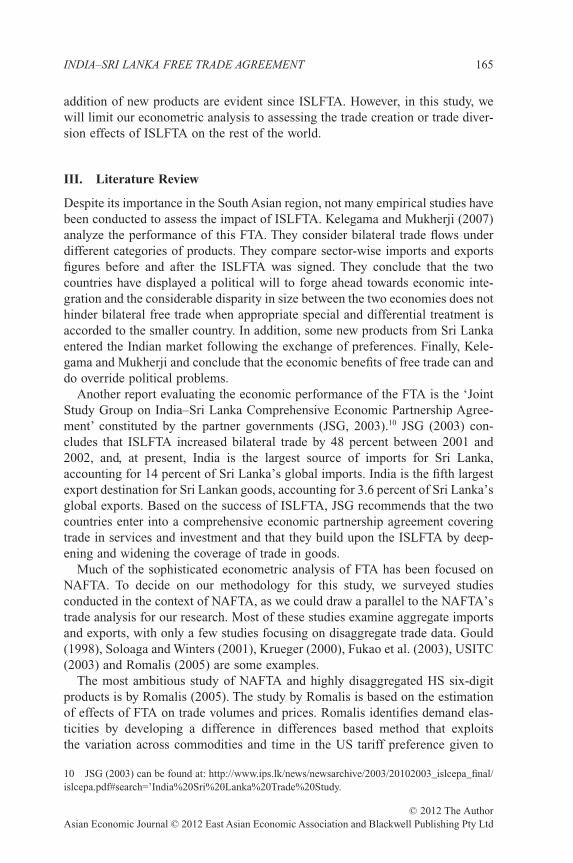
After the signing of ISLFTA, trade between India and Sri Lanka has increasedmany fold. Between 1999 and 2006, India’s imports from Sri Lanka rose fromUS$45 million to US$499 million, and India’s exports to Sri Lanka rose fromUS$482 million to US$2110 million. Similarly, Sri Lanka’s imports from India in1998 were merely US$538 million, but increased to US$1804 million by 2006. SriLanka’s exports to India grew from US$35 million in 1998 to US$490 million in2006. In this way, India became Sri Lanka’s major trading partner after thesigning of the Agreement. Figure 3 compares the growth of India’s (Sri Lanka’s)imports from Sri Lanka (India) with the growth of India’s (Sri Lanka’s) importsfrom the rest of the world since 1996. Comparing Sri Lanka’s performance in twoof its major exporting destinations (India and China), Figure 4 shows that SriLanka’s share in India’s total imports has been rising since 2000. In contrast, SriLanka’s share in China’s total imports has remained almost constant. Figure 5further shows the shares of some major exporters in India’s total imports.Although exports from the USA, the EU and other countries (except China) toIndia had declined during the period from 1996 to 2006, the share of Sri Lanka’sexports in Indian imports increased consistently from 2000 to 2005.
The number of products exported by Sri Lanka increased from 505 products in1996 to 1026 products in 2006 based on the HS-6 classification codes. Further-more, there is a visible shift in Sri Lanka’s product mix from agricultural products7
6 The MFN principle is a principle of non-discrimination; it is a legal obligation under Article I ofGATT to accord equal treatment to all WTO members.7 Agricultural products are defined under Appendix 1 of the WTO Agreement on Agriculture.
Figure 2 India’s (IND) and Sri Lanka’s (SL) average most favored nation (MFN) andpreferential tariffs (PRF)
1996
1997
1998
Year
MFN_SL
PRF for IND
PRF for SL
MFN_IND
05
1015202530354045
1999
2000
MF
N/p
refe
rent
ial t
arif
f
2001
2002
2003
2004
2005
2006
Source: WITS, World Bank.
ASIAN ECONOMIC JOURNAL 162
© 2012 The AuthorAsian Economic Journal © 2012 East Asian Economic Association and Blackwell Publishing Pty Ltd
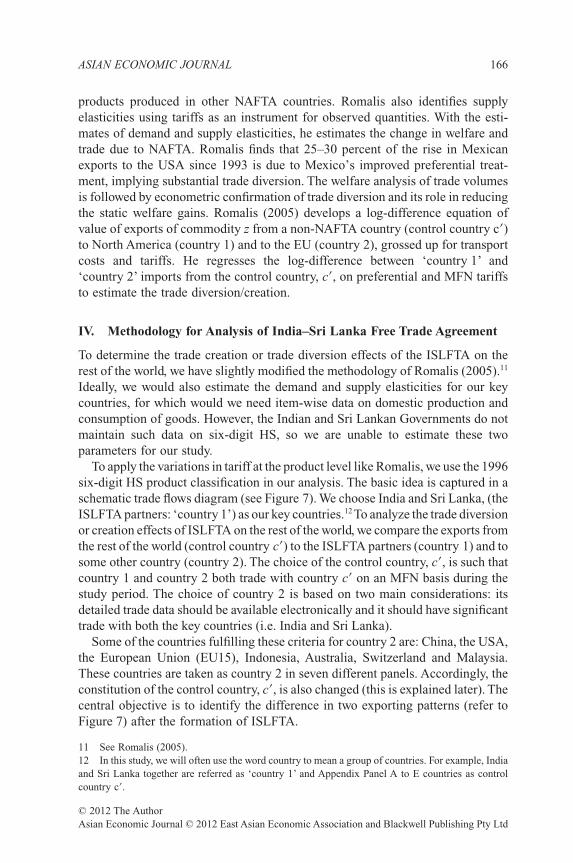
to manufacturing products.8,9 Figure 6 depicts the percentage share of Sri Lanka’simports in the three lists as well as in the total Indian imports basket. There was anincrease in the share of imports from Sri Lanka in total imports, from 0.10 percent
8 Products other than agricultural products can be categorized as manufactured or non-agriculturalproducts. The product classification under non-agricultural products is still being discussed at WTONon Agricultural Market Access negotiations.9 The major products exported by Sri Lanka to India in 2006 were: Fats and Oils (22.3 percent),Copper and Articles of Copper (8.6 percent), Electrical Machinery (8.6 percent) and Spices, Coffee,Tea (6.2 percent). Similarly, India exported Mineral Fuel Oil (22.44 percent), Vehicles (18.08 percent),Iron and Steel (4.54 percent), Machinery, Reactors, Boilers (4.22 percent) and Pharmaceutical Prod-ucts (4.13 percent).
Figure 3 Growth in India’s (Sri Lanka’s) imports from Sri Lanka (India) and the rest of theworld (1996 to 2006, index 1996 = 100)
1997
Perc
ent g
row
th (
1996
bas
e)
−50
0
50
100
150
200
250
300
350
40019
98
1999
2000
2001
Year
India’s imports fromsri LankaIndia’s imports fromthe rest of the worldSri Lanka’s importsfrom IndiaSri Lanka’s importsfrom the rest of the world
2002
2003
2004
2005
2006
Source: COMTRADE.
Figure 4 Share of Sri Lankan goods in India’s and China’s total imports
1996
1997
1998
Perc
ent s
hare
in I
ndia
Perc
ent s
hare
in C
hina
1999
2000
2001
2002
Year
0.0000.0500.1000.1500.2000.2500.3000.3500.4000.450
0.000
0.001
0.002
0.003
0.004
0.005Sri Lanka’s sharein India’s
Sri Lanka’s share inChina’s imports
0.006
0.007
2003
2004
2005
2006
Source: COMTRADE.
INDIA–SRI LANKA FREE TRADE AGREEMENT 163
© 2012 The AuthorAsian Economic Journal © 2012 East Asian Economic Association and Blackwell Publishing Pty Ltd
in 1999 to 0.29 percent in 2006. The imports from Sri Lanka also increased for theproducts on the residual list, from 0.2 percent in 1996 to 0.47 percent in 2006. It isnoteworthy that there was an increase in the imports even in the negative list, from0.5 percent in 2001 to 1.19 percent in 2006. This could be mainly due to theincreased awareness of partners’ markets, the smoothing of customs issues andimproved access to ports of entry, the so called ‘border effects’.
However, the growth in trade flows of products on the positive list is relativelystagnant. This can be attributed to the fact that during ISLFTA negotiations,immediate concessions were allowed for India for the products for which SriLanka did not have a comparative advantage. Sri Lanka followed the sameprinciple while drawing its positive list.
All the above facts clearly show a marked increase in trade flows between Indiaand Sri Lanka after the implementation of ISLFTA in 2000. Trade creation and
Figure 5 Share of some major exporters and Sri Lanka (SL) to India’s total imports
1996
1997
1998
1999
2000
Perc
ent
Year
0.00
5.00
10.00
15.00
20.00
25.00
30.00
0.000.05
China
EU15
USA
SL0.100.15
0.250.20
0.300.350.400.45
2001
2002
2003
2004
2005
2006
SL
per
cent
Data Source: COMTRADE, Figure by Author
Figure 6 Sri Lanka’s (SL) share in India’s total imports under different lists of theIndia–Sri Lanka Free Trade Agreement
1.61.41.21.00.80.60.40.20.0
1996
1997
1998
1999
2000
2001
Year
Negative list: % SL importsPositive list: % SL importsResidual list: % SL importsTotal imports: % SL imports
2002
2003
2004
2005
2006
Data Source: COMTRADE, Figure by Author
ASIAN ECONOMIC JOURNAL 164
© 2012 The AuthorAsian Economic Journal © 2012 East Asian Economic Association and Blackwell Publishing Pty Ltd
addition of new products are evident since ISLFTA. However, in this study, wewill limit our econometric analysis to assessing the trade creation or trade diver-sion effects of ISLFTA on the rest of the world.
III. Literature Review
Despite its importance in the South Asian region, not many empirical studies havebeen conducted to assess the impact of ISLFTA. Kelegama and Mukherji (2007)analyze the performance of this FTA. They consider bilateral trade flows underdifferent categories of products. They compare sector-wise imports and exportsfigures before and after the ISLFTA was signed. They conclude that the twocountries have displayed a political will to forge ahead towards economic inte-gration and the considerable disparity in size between the two economies does nothinder bilateral free trade when appropriate special and differential treatment isaccorded to the smaller country. In addition, some new products from Sri Lankaentered the Indian market following the exchange of preferences. Finally, Kele-gama and Mukherji and conclude that the economic benefits of free trade can anddo override political problems.
Another report evaluating the economic performance of the FTA is the ‘JointStudy Group on India–Sri Lanka Comprehensive Economic Partnership Agree-ment’ constituted by the partner governments (JSG, 2003).10 JSG (2003) con-cludes that ISLFTA increased bilateral trade by 48 percent between 2001 and2002, and, at present, India is the largest source of imports for Sri Lanka,accounting for 14 percent of Sri Lanka’s global imports. India is the fifth largestexport destination for Sri Lankan goods, accounting for 3.6 percent of Sri Lanka’sglobal exports. Based on the success of ISLFTA, JSG recommends that the twocountries enter into a comprehensive economic partnership agreement coveringtrade in services and investment and that they build upon the ISLFTA by deep-ening and widening the coverage of trade in goods.
Much of the sophisticated econometric analysis of FTA has been focused onNAFTA. To decide on our methodology for this study, we surveyed studiesconducted in the context of NAFTA, as we could draw a parallel to the NAFTA’strade analysis for our research. Most of these studies examine aggregate importsand exports, with only a few studies focusing on disaggregate trade data. Gould(1998), Soloaga and Winters (2001), Krueger (2000), Fukao et al. (2003), USITC(2003) and Romalis (2005) are some examples.
The most ambitious study of NAFTA and highly disaggregated HS six-digitproducts is by Romalis (2005). The study by Romalis is based on the estimationof effects of FTA on trade volumes and prices. Romalis identifies demand elas-ticities by developing a difference in differences based method that exploitsthe variation across commodities and time in the US tariff preference given to
10 JSG (2003) can be found at: http://www.ips.lk/news/newsarchive/2003/20102003_islcepa_final/islcepa.pdf#search=’India%20Sri%20Lanka%20Trade%20Study.
INDIA–SRI LANKA FREE TRADE AGREEMENT 165
© 2012 The AuthorAsian Economic Journal © 2012 East Asian Economic Association and Blackwell Publishing Pty Ltd
products produced in other NAFTA countries. Romalis also identifies supplyelasticities using tariffs as an instrument for observed quantities. With the esti-mates of demand and supply elasticities, he estimates the change in welfare andtrade due to NAFTA. Romalis finds that 25–30 percent of the rise in Mexicanexports to the USA since 1993 is due to Mexico’s improved preferential treat-ment, implying substantial trade diversion. The welfare analysis of trade volumesis followed by econometric confirmation of trade diversion and its role in reducingthe static welfare gains. Romalis (2005) develops a log-difference equation ofvalue of exports of commodity z from a non-NAFTA country (control country c�)to North America (country 1) and to the EU (country 2), grossed up for transportcosts and tariffs. He regresses the log-difference between ‘country 1’ and‘country 2’ imports from the control country, c�, on preferential and MFN tariffsto estimate the trade diversion/creation.
IV. Methodology for Analysis of India–Sri Lanka Free Trade Agreement
To determine the trade creation or trade diversion effects of the ISLFTA on therest of the world, we have slightly modified the methodology of Romalis (2005).11
Ideally, we would also estimate the demand and supply elasticities for our keycountries, for which would we need item-wise data on domestic production andconsumption of goods. However, the Indian and Sri Lankan Governments do notmaintain such data on six-digit HS, so we are unable to estimate these twoparameters for our study.
To apply the variations in tariff at the product level like Romalis, we use the 1996six-digit HS product classification in our analysis. The basic idea is captured in aschematic trade flows diagram (see Figure 7). We choose India and Sri Lanka, (theISLFTA partners: ‘country 1’) as our key countries.12 To analyze the trade diversionor creation effects of ISLFTA on the rest of the world, we compare the exports fromthe rest of the world (control country c�) to the ISLFTA partners (country 1) and tosome other country (country 2). The choice of the control country, c�, is such thatcountry 1 and country 2 both trade with country c� on an MFN basis during thestudy period. The choice of country 2 is based on two main considerations: itsdetailed trade data should be available electronically and it should have significanttrade with both the key countries (i.e. India and Sri Lanka).
Some of the countries fulfilling these criteria for country 2 are: China, the USA,the European Union (EU15), Indonesia, Australia, Switzerland and Malaysia.These countries are taken as country 2 in seven different panels. Accordingly, theconstitution of the control country, c�, is also changed (this is explained later). Thecentral objective is to identify the difference in two exporting patterns (refer toFigure 7) after the formation of ISLFTA.
11 See Romalis (2005).12 In this study, we will often use the word country to mean a group of countries. For example, Indiaand Sri Lanka together are referred as ‘country 1’ and Appendix Panel A to E countries as controlcountry c�.
ASIAN ECONOMIC JOURNAL 166
© 2012 The AuthorAsian Economic Journal © 2012 East Asian Economic Association and Blackwell Publishing Pty Ltd
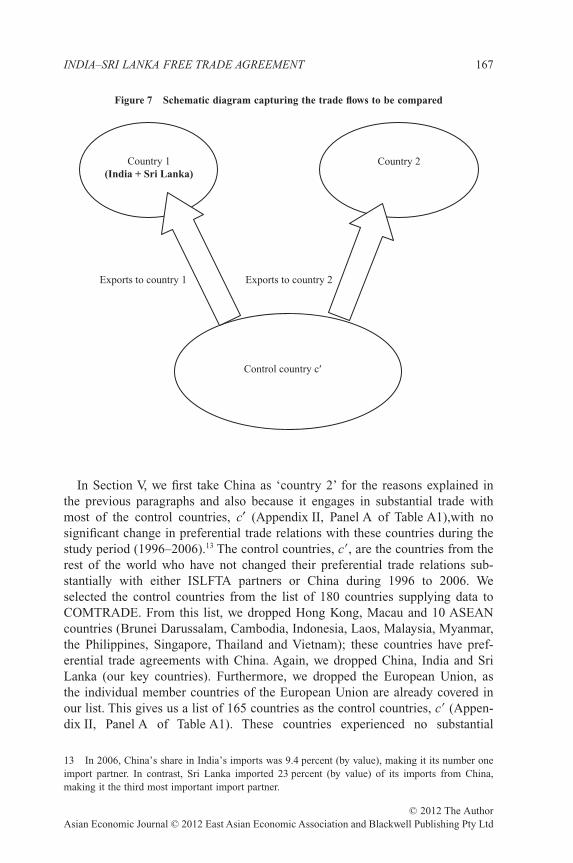
In Section V, we first take China as ‘country 2’ for the reasons explained inthe previous paragraphs and also because it engages in substantial trade withmost of the control countries, c′ (Appendix II, Panel A of Table A1),with nosignificant change in preferential trade relations with these countries during thestudy period (1996–2006).13 The control countries, c�, are the countries from therest of the world who have not changed their preferential trade relations sub-stantially with either ISLFTA partners or China during 1996 to 2006. Weselected the control countries from the list of 180 countries supplying data toCOMTRADE. From this list, we dropped Hong Kong, Macau and 10 ASEANcountries (Brunei Darussalam, Cambodia, Indonesia, Laos, Malaysia, Myanmar,the Philippines, Singapore, Thailand and Vietnam); these countries have pref-erential trade agreements with China. Again, we dropped China, India and SriLanka (our key countries). Furthermore, we dropped the European Union, asthe individual member countries of the European Union are already covered inour list. This gives us a list of 165 countries as the control countries, c� (Appen-dix II, Panel A of Table A1). These countries experienced no substantial
13 In 2006, China’s share in India’s imports was 9.4 percent (by value), making it its number oneimport partner. In contrast, Sri Lanka imported 23 percent (by value) of its imports from China,making it the third most important import partner.
Figure 7 Schematic diagram capturing the trade flows to be compared
Exports to country 1 Exports to country 2
Control country c′
Country 1 (India + Sri Lanka)
Country 2
INDIA–SRI LANKA FREE TRADE AGREEMENT 167
© 2012 The AuthorAsian Economic Journal © 2012 East Asian Economic Association and Blackwell Publishing Pty Ltd
changes in trade relations with China (country 2) or ISLFTA countries (coun-try 1) during the study period.
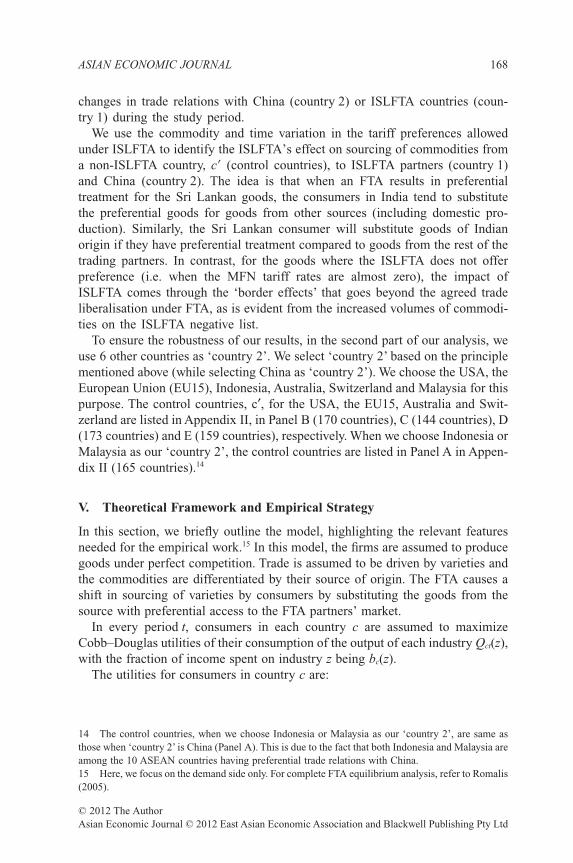
We use the commodity and time variation in the tariff preferences allowedunder ISLFTA to identify the ISLFTA’s effect on sourcing of commodities froma non-ISLFTA country, c� (control countries), to ISLFTA partners (country 1)and China (country 2). The idea is that when an FTA results in preferentialtreatment for the Sri Lankan goods, the consumers in India tend to substitutethe preferential goods for goods from other sources (including domestic pro-duction). Similarly, the Sri Lankan consumer will substitute goods of Indianorigin if they have preferential treatment compared to goods from the rest of thetrading partners. In contrast, for the goods where the ISLFTA does not offerpreference (i.e. when the MFN tariff rates are almost zero), the impact ofISLFTA comes through the ‘border effects’ that goes beyond the agreed tradeliberalisation under FTA, as is evident from the increased volumes of commodi-ties on the ISLFTA negative list.
To ensure the robustness of our results, in the second part of our analysis, weuse 6 other countries as ‘country 2’. We select ‘country 2’ based on the principlementioned above (while selecting China as ‘country 2’). We choose the USA, theEuropean Union (EU15), Indonesia, Australia, Switzerland and Malaysia for thispurpose. The control countries, c′, for the USA, the EU15, Australia and Swit-zerland are listed in Appendix II, in Panel B (170 countries), C (144 countries), D(173 countries) and E (159 countries), respectively. When we choose Indonesia orMalaysia as our ‘country 2’, the control countries are listed in Panel A in Appen-dix II (165 countries).14
V. Theoretical Framework and Empirical Strategy
In this section, we briefly outline the model, highlighting the relevant featuresneeded for the empirical work.15 In this model, the firms are assumed to producegoods under perfect competition. Trade is assumed to be driven by varieties andthe commodities are differentiated by their source of origin. The FTA causes ashift in sourcing of varieties by consumers by substituting the goods from thesource with preferential access to the FTA partners’ market.
In every period t, consumers in each country c are assumed to maximizeCobb–Douglas utilities of their consumption of the output of each industry Qct(z),with the fraction of income spent on industry z being bc(z).
The utilities for consumers in country c are:
14 The control countries, when we choose Indonesia or Malaysia as our ‘country 2’, are same asthose when ‘country 2’ is China (Panel A). This is due to the fact that both Indonesia and Malaysia areamong the 10 ASEAN countries having preferential trade relations with China.15 Here, we focus on the demand side only. For complete FTA equilibrium analysis, refer to Romalis(2005).
ASIAN ECONOMIC JOURNAL 168
© 2012 The AuthorAsian Economic Journal © 2012 East Asian Economic Association and Blackwell Publishing Pty Ltd
U b z Q z dzct c ct= ∫ ( ) ln ( )0
1
(1)
b z dzc ( )0
1
1∫ = (2)
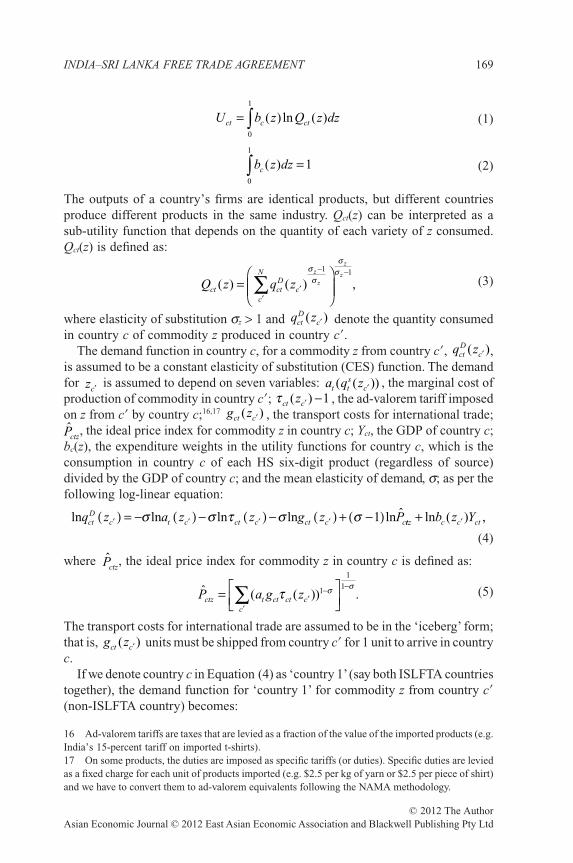
The outputs of a country’s firms are identical products, but different countriesproduce different products in the same industry. Qct(z) can be interpreted as asub-utility function that depends on the quantity of each variety of z consumed.Qct(z) is defined as:
Q z q zct ctD
cc
N z
z
z
z
( ) ( ) ,=⎛
⎝⎜⎜
⎞
⎠⎟⎟′
−
′
−
∑σσ
σσ1 1
(3)
where elasticity of substitution sz > 1 and q zctD
c( )′ denote the quantity consumedin country c of commodity z produced in country c�.
The demand function in country c, for a commodity z from country c�, q zctD
c( )′ ,is assumed to be a constant elasticity of substitution (CES) function. The demandfor zc′ is assumed to depend on seven variables: a q zt t
sc( ( ))′ , the marginal cost of
production of commodity in country c�; τ ct cz( )′ −1 , the ad-valorem tariff imposedon z from c� by country c;16,17 g zct c( )′ , the transport costs for international trade;P̂ctz
, the ideal price index for commodity z in country c; Yct, the GDP of country c;bc(z), the expenditure weights in the utility functions for country c, which is theconsumption in country c of each HS six-digit product (regardless of source)divided by the GDP of country c; and the mean elasticity of demand, s; as per thefollowing log-linear equation:
ln ln ln ln lnq z a z z g z PctD
c t c ct c ct c c′ ′ ′ ′( ) = − ( ) − ( ) − ( ) + −( )σ σ τ σ σ 1 ˆttz c c ctb z Y+ ′ln ( ) ,
(4)
where P̂ctz, the ideal price index for commodity z in country c is defined as:
ˆ ( ( )) .P a g zctz t ct ct cc
= ⎡⎣⎢
⎤⎦⎥′
−
′
−∑ τ σ σ1
1
1 (5)
The transport costs for international trade are assumed to be in the ‘iceberg’ form;that is, g zct c( )′ units must be shipped from country c� for 1 unit to arrive in countryc.
If we denote country c in Equation (4) as ‘country 1’(say both ISLFTA countriestogether), the demand function for ‘country 1’ for commodity z from country c�(non-ISLFTA country) becomes:
16 Ad-valorem tariffs are taxes that are levied as a fraction of the value of the imported products (e.g.India’s 15-percent tariff on imported t-shirts).17 On some products, the duties are imposed as specific tariffs (or duties). Specific duties are leviedas a fixed charge for each unit of products imported (e.g. $2.5 per kg of yarn or $2.5 per piece of shirt)and we have to convert them to ad-valorem equivalents following the NAMA methodology.
INDIA–SRI LANKA FREE TRADE AGREEMENT 169
© 2012 The AuthorAsian Economic Journal © 2012 East Asian Economic Association and Blackwell Publishing Pty Ltd
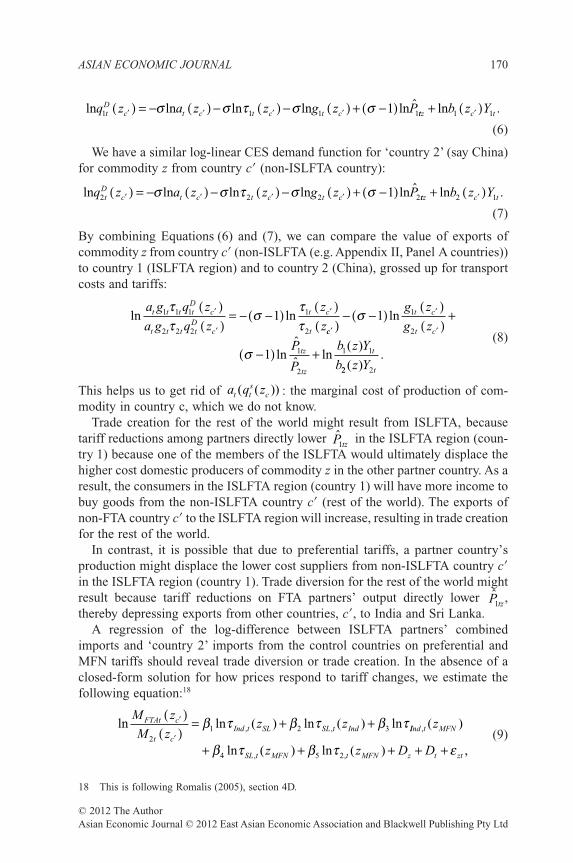
ln ln ln ln lnq z a z z g z PtD
c t c t c t c1 1 1 11′ ′ ′ ′( ) = − ( ) − ( ) − ( ) + −( )σ σ τ σ σ ˆttz c tb z Y+ ( )′ln 1 1 .
(6)
We have a similar log-linear CES demand function for ‘country 2’ (say China)for commodity z from country c� (non-ISLFTA country):
ln ln ln ln lnq z a z z g z PtD
c t c t c t c2 2 2 21′ ′ ′ ′( ) = − ( ) − ( ) − ( ) + −( )σ σ τ σ σ ˆttz c tb z Y+ ( )′ln 2 1 .
(7)
By combining Equations (6) and (7), we can compare the value of exports ofcommodity z from country c� (non-ISLFTA (e.g. Appendix II, Panel A countries))to country 1 (ISLFTA region) and to country 2 (China), grossed up for transportcosts and tariffs:
ln lna g q z
a g q z
z
zt t t t
Dc
t t t tD
c
t c
t
1 1 1
2 2 2
1
2
1ττ
σττ
′
′
′
′
( )( )
= − −( ) ( )cc
t c
t c
tz
tz
t
g z
g z
P
P
b z Y
b
( )− −( ) ( )
( )+
−( ) +
′
′
σ
σ
1
1
1
2
1
2
1 1
ln
ln lnˆ
ˆ( )
22 2( ).
z Y t
(8)
This helps us to get rid of a q zt ts
c( ( )) : the marginal cost of production of com-modity in country c, which we do not know.
Trade creation for the rest of the world might result from ISLFTA, becausetariff reductions among partners directly lower P̂ tz1
in the ISLFTA region (coun-try 1) because one of the members of the ISLFTA would ultimately displace thehigher cost domestic producers of commodity z in the other partner country. As aresult, the consumers in the ISLFTA region (country 1) will have more income tobuy goods from the non-ISLFTA country c� (rest of the world). The exports ofnon-FTA country c� to the ISLFTA region will increase, resulting in trade creationfor the rest of the world.
In contrast, it is possible that due to preferential tariffs, a partner country’sproduction might displace the lower cost suppliers from non-ISLFTA country c�in the ISLFTA region (country 1). Trade diversion for the rest of the world mightresult because tariff reductions on FTA partners’ output directly lower P̂ tz1
,thereby depressing exports from other countries, c�, to India and Sri Lanka.
A regression of the log-difference between ISLFTA partners’ combinedimports and ‘country 2’ imports from the control countries on preferential andMFN tariffs should reveal trade diversion or trade creation. In the absence of aclosed-form solution for how prices respond to tariff changes, we estimate thefollowing equation:18
ln ln ( ) ln ( ) ln, ,
M z
M zz zFTAt c
t cInd t SL SL t Ind
′
′
( )( )
= + +2
1 2 3β τ β τ β τ IInd t MFN
SL t MFN t MFN z t zt
z
z z D D
,
, ,
( )
ln ( ) ln ( ) ,+ + + + +β τ β τ ε4 5 2
(9)
18 This is following Romalis (2005), section 4D.
ASIAN ECONOMIC JOURNAL 170
© 2012 The AuthorAsian Economic Journal © 2012 East Asian Economic Association and Blackwell Publishing Pty Ltd
where M zFTAt c( )′ is the ISLFTA (combined India and Sri Lanka) imports ofcommodity z from the control countries, c�, measured on a CIF (cost insuranceand freight) basis and M zt c2 ( )′ is the ‘country 2’ imports of commodity z fromthe control countries, c�, measured similarly. The explanatory variables are pref-erential and MFN tariffs. For example, tInd,t(zSL) is India’s tariff on product zimported from Sri Lanka plus one, and tInd,t(zMFN) is India’s MFN tariff on productz plus one. The above equation, compared to Equation (8), helps us to get rid ofP̂ctz: the ideal price index for commodity z in country c. We also assume that
relative transport costs, lng z
g zt c
t c
1
2
′
′
( )( )
, and relative expenditures, ln( )
( )
b z Y
b z Yt
t
1 1
2 2
, are
captured by full sets of product (Dz) and year (Dt) fixed effects and a disturbanceterm (ezt) that is independent of the tariffs and fixed effects. The sum of thecoefficients on the preferential tariffs (b1 and b2) might reveal the rise (or fall) inexports from the control countries, c�, to the ISLFTA region relative to ‘country2’ that results from a 1-percent reduction in intra-ISLFTA tariffs. If the sum of b1and b2 is negative (positive), we will know that trade from non-ISLFTA membercountries is created (or diverted) as a result of ISLFTA.
VI. Data, Sources and Characteristics
We focus in our study on the period 1996 to 2006 (i.e. that is, 5 years before ISLFTAand 6 years after ISLFTA) using six-digit HS 1996 classification data. Basically, weuse two types of data: applied tariff data and trade data.19 The major sources of datafor this study are the World Bank’s World Integrated Trade Solution (WITS)database and the Global Trade Information (GTI) Services Global Trade Atlas(GTA).20 WITS further provides access to three other important sources of data:TRAINS (by UNCTAD), COMTRADE (by UNSD) and IDB (by WTO). As wehave used a very rich dataset for our regression analysis, for transparency purposes,it would be useful to discuss the challenges we faced and how we tackled them.
VI.1 Tariff data
The preferred order of use of tariff data source is: TRAINS, IDB and nationalgovernments.21
19 Actual tariffs or imports duties are applied by WTO member countries on their imports, asopposed to tariff rates that are bound or committed.20 GTI Services are leading suppliers of international merchandise trade data.21 There are two reasons for using the data sources in this order. First, we need all tariff data on anad-valorem basis not on a specific duty basis. Our key countries have specific duties on some of thetariff lines (e.g. India, 271 HS lines for 2000 to 2006; China, 27 lines in 2001 and 23 lines in 2005;and Sri Lanka, 29 in 1998 and 64 lines in 2004). Using TRAINS under WITS provides an automaticconversion of these specific duties to ad-valorem equivalents using WTO NAMA methodology.Second, in case the national tariffs are recorded on HS eight-digit basis, TRAINS under WITS alsoaverages the tariffs to the corresponding HS six-digits for all the tariff lines. Our second preference isfor the IDB under WITS. It again converts the HS eight-digit tariffs to average tariffs at HS six-digit
INDIA–SRI LANKA FREE TRADE AGREEMENT 171
© 2012 The AuthorAsian Economic Journal © 2012 East Asian Economic Association and Blackwell Publishing Pty Ltd
Tariff data for India
Tariff data for India was collected from three sources: from IDB for years 1996,2000 and 2002; from TRAINS for years 1997, 1999, 2001, 2004 and 2005; andfrom the Indian Government for years 2003 and 2006. There are four major issueswith Indian tariff data. First, we do not have data for the year 1998, for which we usethe 1997 data as a proxy. Second, the data for the years 1996 to 2001 is based on HS1996 classification22 and for the years 2002 to 2006 the data is based on HS 2002classification.23 As we are working with HS 1996, we use concordance tables fromWITS to convert the product-wise tariff data from HS 2002 to HS 1996 for the years2002, 2003, 2004, 2005 and 2006. Third, we convert specific duties on 271 textilesand clothing products to ad-valorem equivalents for the years 2000 to 2006. For theyears 2001, 2004 and 2005, we source tariff data from TRAINS. The WITSprovides an automatic conversion of these specific duties to ad-valorem equivalentsusing WTO Non-agricultural market access (NAMA) methodology.24 For the years2000, 2002, 2003 and 2006 (i.e. when we do not have data from TRAINS), wecannot obtain such ad-valorem equivalents through the WITS. Hence, for the years2000 and 2002 (when we source data from IDB) and for the years 2003 and 2006(when we use Indian Government data), we use the ad-valorem equivalents ofspecific duties from the nearest year,25 available from TRAINS. Finally, there areonly a few HS lines where the data is missing in a particular year. We use the appliedtariff rate on nearest HS line from the same year to handle this issue.
Tariff data for Sri Lanka
Tariff data for Sri Lanka was collected from two sources: IDB for years 1998 and2001 (for preferential tariff alone) and 2003; and TRAINS for years 1997, 2000,2001 (for MFN tariff alone), 2004, 2005 and 2006. Again, there are four major
level, but the IDB does not provide an automatic conversion of specific duties to the ad-valoremequivalents as provided by the TRAINS database. Our last preference is for the Government tariff data,as these are not available electronically and are mostly HS eight-digit level. We have to manuallycalculate the averages for the corresponding HS eight-digit tariff and put the data in electronic formbefore our analysis.22 HS 1996 classification has 5113 products on six-digit basis.23 HS 2002 classification has 5224 products on six-digit basis24 The World Bank’s World Integrated Trade Solution provides four different ways of conversion ofspecific duties to ad-valorem equivalents (AVE): UNCTAD Method 1, Method 2, the WTO Agricul-ture Method and the WTO NAMA method. As most of our trade is of non-agricultural products, weprefer to choose the WTO NAMA method. Choosing other methodologies may not have any effect onour results and conclusions.25 In 2000, the Indian Government introduced specific duties for 271 products of the Textile andClothing sector as ‘x % or Rs y per unit, whichever is higher’. It was observed that all most all thead-valorem equivalents of the specific components of tariffs are higher than the correspondingad-valorem duties, so, effectively, the specific duties are the applied rates of import duties. India didnot change the specific duty components for these 271 products even though the government loweredthe ad-valorem components for these product lines for the period 2000– 2006. That is why the use ofad-valorem equivalents of specific duties from the nearest year is perfectly justified.
ASIAN ECONOMIC JOURNAL 172
© 2012 The AuthorAsian Economic Journal © 2012 East Asian Economic Association and Blackwell Publishing Pty Ltd
issues with Sri Lankan tariff data. First, we do not have data for the years 1996, 1999and 2002. We take tariffs of the nearest available year as proxies for the missingyears.26 Second, Sri Lanka’s applied tariff rates for the year 1997 are in HS1988/1992;27 for 1998, 2000 and 2001 data is in HS 1996 and for 2003, 2004, 2005and 2006 the data is in HS 2002 classification. We again use WITS concordancetables to convert the data28 to HS 1996 classification. The third issue is that ofspecific duties on different products in different years. For example, Sri Lanka hasspecific duties on 29 tariff lines in 1998 and on 64 lines in 2004. For conversion toad-valorem equivalents, we use the data of the nearest available year fromTRAINS.The fourth issue is the missing data on HS lines within a year. This issue is handledby using the applied tariff rates from the nearest HS line from the same year.
Tariff data for ‘country 2’
Due to China’s entry into the WTO in 2001, its tariff data is easily available. Tariffdata for China was collected from two sources: TRAINS for years 1996, 1997,1998, 1999, 2000, 2001, 2003, 2004, 2005 and 2006; and IDB for the year 2002.The WITS concordance table was used to convert the data from HS 2002 (for theyears 2002, 2003, 2004, 2005 and 2006) to HS 1996 classification. Otherwise,China’s data for the years 1996 to 2001 is available from HS 1996. Similarly, thetariff data for the USA, the EU15, Indonesia, Australia, Switzerland and Malaysiais also collected from TRAINS and IDB through WITS. The issues of missingdata, concordance of HS classifications and specific duties are handled in thesame manner as described above for India’s and Sri Lanka’s tariff data.
6.2 Trade data29
To run the regression for Equation (9), we need imports by ISLFTA region(‘country 1’) from control countries, c�, (HS 1996 at six-digit level) and imports byChina (‘country 2’) from control countries, c�, for the period 1996 to 2006. Weobtain import data for India and China (country 2) from COMTRADE for all theyears, as well as for the USA, the EU15, Indonesia, Australia, Switzerland andMalaysia.
A caveat needs to be mentioned for Sri Lanka’s import data. The import datafor Sri Lanka is available only for the years 1998 (from IDB), 1999, 2001, 2002,
26 For the year 1996, we take tariffs from 1997; for the year 1999, we use 2000 tariffs and for theyear 2002, we use the 2003 data. There is not much difference between applied tariffs in 2001 and2003, so the use of 2003 data for the year 2002 seems justified.27 HS 1988/1992 classification includes 5020 six-digit products.28 We observe that for 76 products of HS 1998/1992 classification, we do not have correspondingproducts under HS 1996 classification. All these products numbers were used before 1995. Hence, wedrop them from our analysis as we are concentrating only on data from 1996 to 2006.29 Trade data is relatively easily available for all the countries on COMTRADE. It understood thatcompared to the tariff data, the trade data is unimportant for the purposes of WTO tariff negotiations.Due to negotiation sensitivities, it is possible that some countries do not want to share full tariff data.
INDIA–SRI LANKA FREE TRADE AGREEMENT 173
© 2012 The AuthorAsian Economic Journal © 2012 East Asian Economic Association and Blackwell Publishing Pty Ltd
2003, 2004 and 2005 (from COMTRADE). For the years 1996, 1997, 2000 and2006, we need to use alternative sources of data. We use import data for the years2000 and 2006 for Appendix II, Panel A.30 Due to data constraints for Sri Lankafor 1996 and 1997,31 we decided to use mirror data for exports from controlcountries, c�, to Sri Lanka for these 2 years as imports by Sri Lanka from controlcountries to obtain the complete dataset for the study period.32
VII. Estimation of Results and Discussion
Finally, we have seven different panels. Each panel is highly balanced, with T(11 years) observations for each of the N individuals (over 5000 products). Toestimate the parameters of Equation (9), we choose both the fixed effects and therandom effects model.33 These two models allow for the heterogeneity acrosspanel units and across time. We consider these two alternatives in the Hausmantest framework, fitting both models and comparing their common coefficientestimates. As we might expect from the different point estimates generated by therandom effects estimator, the Hausman test’s null hypothesis that the randomeffects estimator is consistent is soundly rejected.34 The individual effects doappear to be correlated with the regressors; hence, our results are based on thefixed effects model.
A summary of the results obtained using the fixed effects model for the sevenpanels is given in Table 1. Interpretation of these results will essentially provide
30 The GTA has data for the years starting from 1998.31 For Appendix Panel B, C, D and E control countries, we use mirror data on imports by Sri Lankafor years 1996, 1997, 2000 and 2006 due to unavailability of Sri Lanka’s import data in COMTRADE.32 There may be a difference of 5–6 percent between the actual imports recorded by Sri Lanka (datanot available) and the mirror data of imports by Sri Lanka from control countries (data available). Thisdifference is due the fact that in COMTRADE, the imports are recorded CIF (cost insurance andfreight), while the exports are recorded FOB (free on board). Finally, we use the combined imports byIndia (import data available for the period under study) and Sri Lanka (import data available for1998–2006 and mirror data for 1996–1997) from control countries, c′. As India is a relatively largetrading partner in the ISLFTA region, when we merge the two sets of import data to obtain thecombined imports by ISLFTA partners, the difference due to CIF and FOB values for 1996 and 1997in Sri Lankan data is further diluted.33 We do not use the pooled OLS method to estimate our model, yit = xitb + ui + nt + eit, as it woulddisregard the nature of the panel data and assume b = bj"j,t,t. This model would be highly restrictiveand can have heteroskedasticity across panel units or serial correlation within panel units. We maychoose the between estimators (BE), fixed effects (FE) or the random effects (RE) model to estimatethe panel coefficients of our model. In the BE, the group means of y are regressed on the group meansof x in a regression of N observations. This estimator also ignores all the time variations in y, and whenui are correlated with any of the regressors in the model, the zero-conditional-mean assumption doesnot hold and the between estimator produces inconsistent results. Finally, we are left with the FE andRE models that allow for the heterogeneity across panel units and across time. If ui are uncorrelatedwith the regressors, then we can use the RE, but if ui are correlated with the regressors, then we usethe FE model.34 b = consistent under H0 and Ha; B = inconsistent under Ha, efficient under H0; Test: H0: differencein coefficients not systematic. We obtain values of c2 (5) greater than 37.42 (0.000) for all sevenpanels. Hence, the product-level individual effects do appear to be correlated with the regressors.
ASIAN ECONOMIC JOURNAL 174
© 2012 The AuthorAsian Economic Journal © 2012 East Asian Economic Association and Blackwell Publishing Pty Ltd
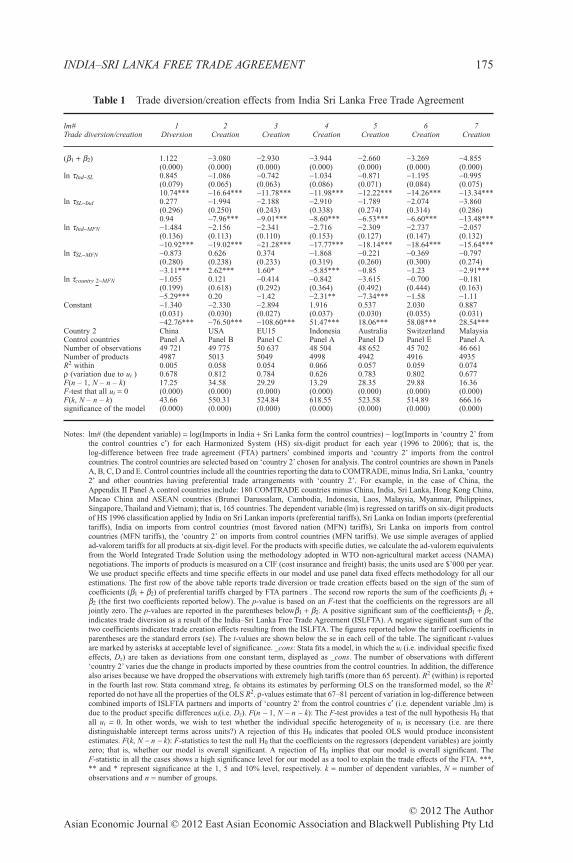
Table 1 Trade diversion/creation effects from India Sri Lanka Free Trade Agreement
lm# 1 2 3 4 5 6 7Trade diversion/creation Diversion Creation Creation Creation Creation Creation Creation
(b1 + b2) 1.122 -3.080 -2.930 -3.944 -2.660 -3.269 -4.855(0.000) (0.000) (0.000) (0.000) (0.000) (0.000) (0.000)
ln tInd-SL 0.845 -1.086 -0.742 -1.034 -0.871 -1.195 -0.995(0.079) (0.065) (0.063) (0.086) (0.071) (0.084) (0.075)10.74*** -16.64*** -11.78*** -11.98*** -12.22*** -14.26*** -13.34***
ln tSL-Ind 0.277 -1.994 -2.188 -2.910 -1.789 -2.074 -3.860(0.296) (0.250) (0.243) (0.338) (0.274) (0.314) (0.286)0.94 -7.96*** -9.01*** -8.60*** -6.53*** -6.60*** -13.48***
ln tInd-MFN -1.484 -2.156 -2.341 -2.716 -2.309 -2.737 -2.057(0.136) (0.113) (0.110) (0.153) (0.127) (0.147) (0.132)-10.92*** -19.02*** -21.28*** -17.77*** -18.14*** -18.64*** -15.64***
ln tSL-MFN -0.873 0.626 0.374 -1.868 -0.221 -0.369 -0.797(0.280) (0.238) (0.233) (0.319) (0.260) (0.300) (0.274)-3.11*** 2.62*** 1.60* -5.85*** -0.85 -1.23 -2.91***
ln tcountry 2-MFN -1.055 0.121 -0.414 -0.842 -3.615 -0.700 -0.181(0.199) (0.618) (0.292) (0.364) (0.492) (0.444) (0.163)-5.29*** 0.20 -1.42 -2.31** -7.34*** -1.58 -1.11
Constant -1.340 -2.330 -2.894 1.916 0.537 2.030 0.887(0.031) (0.030) (0.027) (0.037) (0.030) (0.035) (0.031)-42.76*** -76.50*** -108.60*** 51.47*** 18.06*** 58.08*** 28.54***
Country 2 China USA EU15 Indonesia Australia Switzerland MalaysiaControl countries Panel A Panel B Panel C Panel A Panel D Panel E Panel ANumber of observations 49 721 49 775 50 637 48 504 48 652 45 702 46 661Number of products 4987 5013 5049 4998 4942 4916 4935R2 within 0.005 0.058 0.054 0.066 0.057 0.059 0.074r (variation due to ui ) 0.678 0.812 0.784 0.626 0.783 0.802 0.677F(n – 1, N – n – k) 17.25 34.58 29.29 13.29 28.35 29.88 16.36F-test that all ui = 0 (0.000) (0.000) (0.000) (0.000) (0.000) (0.000) (0.000)F(k, N – n – k) 43.66 550.31 524.84 618.55 523.58 514.89 666.16significance of the model (0.000) (0.000) (0.000) (0.000) (0.000) (0.000) (0.000)
Notes: lm# (the dependent variable) = log(Imports in India + Sri Lanka form the control countries) – log(Imports in ‘country 2’ fromthe control countries c′) for each Harmonized System (HS) six-digit product for each year (1996 to 2006); that is, thelog-difference between free trade agreement (FTA) partners’ combined imports and ‘country 2’ imports from the controlcountries. The control countries are selected based on ‘country 2’ chosen for analysis. The control countries are shown in PanelsA, B, C, D and E. Control countries include all the countries reporting the data to COMTRADE, minus India, Sri Lanka, ‘country2’ and other countries having preferential trade arrangements with ‘country 2’. For example, in the case of China, theAppendix II Panel A control countries include: 180 COMTRADE countries minus China, India, Sri Lanka, Hong Kong China,Macao China and ASEAN countries (Brunei Darussalam, Cambodia, Indonesia, Laos, Malaysia, Myanmar, Philippines,Singapore, Thailand and Vietnam); that is, 165 countries. The dependent variable (lm) is regressed on tariffs on six-digit productsof HS 1996 classification applied by India on Sri Lankan imports (preferential tariffs), Sri Lanka on Indian imports (preferentialtariffs), India on imports from control countries (most favored nation (MFN) tariffs), Sri Lanka on imports from controlcountries (MFN tariffs), the ‘country 2’ on imports from control countries (MFN tariffs). We use simple averages of appliedad-valorem tariffs for all products at six-digit level. For the products with specific duties, we calculate the ad-valorem equivalentsfrom the World Integrated Trade Solution using the methodology adopted in WTO non-agricultural market access (NAMA)negotiations. The imports of products is measured on a CIF (cost insurance and freight) basis; the units used are $’000 per year.We use product specific effects and time specific effects in our model and use panel data fixed effects methodology for all ourestimations. The first row of the above table reports trade diversion or trade creation effects based on the sign of the sum ofcoefficients (b1 + b2) of preferential tariffs charged by FTA partners . The second row reports the sum of the coefficients b1 +b2 (the first two coefficients reported below). The p-value is based on an F-test that the coefficients on the regressors are alljointly zero. The p-values are reported in the parentheses belowb1 + b2. A positive significant sum of the coefficientsb1 + b2,indicates trade diversion as a result of the India–Sri Lanka Free Trade Agreement (ISLFTA). A negative significant sum of thetwo coefficients indicates trade creation effects resulting from the ISLFTA. The figures reported below the tariff coefficients inparentheses are the standard errors (se). The t-values are shown below the se in each cell of the table. The significant t-valuesare marked by asterisks at acceptable level of significance. _cons: Stata fits a model, in which the ui (i.e. individual specific fixedeffects, Dz) are taken as deviations from one constant term, displayed as _cons. The number of observations with different‘country 2’ varies due the change in products imported by these countries from the control countries. In addition, the differencealso arises because we have dropped the observations with extremely high tariffs (more than 65 percent). R2 (within) is reportedin the fourth last row. Stata command xtreg, fe obtains its estimates by performing OLS on the transformed model, so the R2
reported do not have all the properties of the OLS R2. r-values estimate that 67–81 percent of variation in log-difference betweencombined imports of ISLFTA partners and imports of ‘country 2’ from the control countries c′ (i.e. dependent variable ,lm) isdue to the product specific differences ui(i.e. Dz). F(n - 1, N - n - k): The F-test provides a test of the null hypothesis H0 thatall ui = 0. In other words, we wish to test whether the individual specific heterogeneity of ui is necessary (i.e. are theredistinguishable intercept terms across units?) A rejection of this H0 indicates that pooled OLS would produce inconsistentestimates. F(k, N - n - k): F-statistics to test the null H0 that the coefficients on the regressors (dependent variables) are jointlyzero; that is, whether our model is overall significant. A rejection of H0 implies that our model is overall significant. TheF-statistic in all the cases shows a high significance level for our model as a tool to explain the trade effects of the FTA. ***,** and * represent significance at the 1, 5 and 10% level, respectively. k = number of dependent variables, N = number ofobservations and n = number of groups.
INDIA–SRI LANKA FREE TRADE AGREEMENT 175
© 2012 The AuthorAsian Economic Journal © 2012 East Asian Economic Association and Blackwell Publishing Pty Ltd
the evidence as to whether ISLFTA have been trade diverting (or trade creating).For interpreting the results, we refer to the log-difference of combined imports ofISLFTA partners and imports of ‘country 2’ from the control countries, c′, givenby Equation (9).
Column 1 of Table 1 provides the estimates of coefficients when we use China asour ‘country 2’. The results show that the sum of the coefficients on the preferentialtariffs (b1 and b2) is positive, suggesting that ISLFTA is trade diverting fornon-ISLFTA members (control countries c�). It shows that a 1-percent reduction inISLFTA preferential tariffs will cause a 1.12-percent reduction in imports by theISLFTA countries from control countries, c�, relative to imports by China fromthe same control countries. All coefficients except b2 are highly significant. Thereduction in tariffs by India for Sri Lankan products is a major contributor tocreation of more trade from Sri Lanka at the expense of control countries, c�. TheMFN-applied average tariff by India in 2006 is 20.79 percent, while its tariff on SriLankan products is only 4.25 percent (Figure 2). However, there is not muchdifference between Sri Lanka’s MFN (11.82 percent in 2006) and preferentialapplied tariffs (9.08 percent in 2006) (Figure 2). This, along with the fact that Indiais a major importer of control country c� products, explains the significance of b1and the non-significance of b2. The other coefficients (i.e. b3, b4 and b5) are ofexpected (negative) sign and are highly significant. A reduction in MFN tariffs bythe ISLFTA countries would increase the exports to this region from the controlcountries, c�. Similarly, if country 2 (China) reduces its MFN tariff, the exportsfrom control countries, c�, to country 2 will increase.
In the second part of our analysis, we substitute the USA, the EU-15, Indonesia,Australia, Switzerland and Malaysia, respectively, as ‘country 2’, thereby formingsix more panels. The control countries, c�, also change to countries listed inAppendix II, Panels B, C, A, D, E and A, respectively. The regression results forthese panels are reported in columns 2–7 (Table 1). The sum of coefficients b1and b2 is negative in all six cases. For example, in column 2, when ‘country 2’ isthe USA, the sum of b1 and b2 equals -3.080. This shows that as per estimates ofour model, when the ISLFTA countries reduce preferential tariffs by 1 percent,this results in an increase of 3 percent in exports to the ISLFTA partners fromPanel B control countries, c�, compared to exports from the same control coun-tries to the USA. Once again, coefficients b3 and b4 are of expected (negative)sign and highly significant, showing that a 1- percent reduction in MFN tariffs bythe ISLFTA countries would increase the exports from control countries, c�, tothis region by approximately 4 percent compared to exports to the USA from thesame countries. b5, in this case, is insignificant. All the coefficients in the next fivepanels in Table 1 (except b5 in case of the EU15, Switzerland and Malaysia as‘country2’ and b4 in the case of Australia and Switzerland as ‘country 2’) arestrongly significant and can be interpreted similarly. Overall, we estimate that a1-percent reduction in ISLFTA partners’ preferential tariffs results in an increaseof 2.6–4.9 percent in exports from control countries, c�, to ISLFTA memberscompared to the exports from control countries, c�, to ‘country 2’.
ASIAN ECONOMIC JOURNAL 176
© 2012 The AuthorAsian Economic Journal © 2012 East Asian Economic Association and Blackwell Publishing Pty Ltd
As most of the coefficients of our model, including the r and F-test statistics,establish the significance of our model,35 we conclude that our model does areasonably good job of assessing the trade effects of ISLFTA.
One issue that requires explanation is the difference in the trade effects in panel 1(trade diversion) and the six other panels (trade creation) of Table 1. Two reasonscan be given to explain this difference. First, in panel 1, ‘country 2’ (China) is thelargest exporter to ISLFTA partners (first to India and third largest to Sri Lanka, in2006). When we select the control countries, c′, with China as ‘country 2’, we haveto exclude China from the list of control countries, c′.This affects our results by wayof exclusion of almost 16 percent of exports to ISLFTA partners in 2006. Second,we also have to exclude some other countries (e.g. Hong Kong, Malaysia, Taiwan,Indonesia and Thailand) with preferential relations with China from the list ofcontrol countries, c�.These countries are among the top 10 exporters to the ISLFTAregion.These countries together with China constitute almost 30 percent of exportsto ISLFTA countries in 2006. This produces biased estimates to our model byexcluding a large percentage of imports by ISLFTA partners. In contrast, when sixother countries are substituted as ‘country 2’, we have to exclude only 3– 10 percentof total imports by ISLFTA region for estimations of Equation (9). Moreover, wefind consistent and strongly significant results for our model from columns 2 to 7in Table 1. Therefore, we tend to give more weight to the results obtained frompanels having the USA, EU15, Indonesia, Australia, Switzerland and Malaysia as‘country 2’. The results show that a 1-percent reduction in preferential tariffsamong ISLFTA partners will increase exports from control countries c� to ISLFTApartners by 2.6–4.9 percent as compared to the exports from control countries c� to‘country 2’ .
VIII. Conclusion
In the present paper, we have shown that ISLFTA has a slight trade creation effecton non-ISLFTA countries. The consumers in India and Sri Lanka are able toobtain some products from the most competitive suppliers within the region, withthe result they are able to consume more goods with the same income. It appearsthat this has a trade creation effect for the non-members. We have also presentedevidence that the ISLFTA is one of the few south–south agreements, that workseffectively. The success of ISLFTA suggests that if the concerns of the smallereconomy are taken into account and they are given more favorable treatment, thendifferences in size among FTA partners do not matter. Immediately after theAgreement’s implementation, there was an increase in trade flows, which can beattributed to increased preferential access and the ‘border effect’.
India is the major market in the South Asian Free Trade Agreement (SAFTA)region. India gives greater preferential treatment to Sri Lanka under ISLFTA thanto other South Asian partners under SAFTA. ISLFTA gives Sri Lanka two major
35 The r, F-test, F-statistic and R2 have similar interpretations for all seven panels; we discuss thesein detail in the note below Table 1.
INDIA–SRI LANKA FREE TRADE AGREEMENT 177
© 2012 The AuthorAsian Economic Journal © 2012 East Asian Economic Association and Blackwell Publishing Pty Ltd
advantages in the Indian market. First, the ISLFTA has the advantage of being theearliest FTA in this region. Sri Lanka obtained duty free access to the Indianmarket in 2003 (apart from those products falling within the negative list). Similarduty free treatment under SAFTA will be forthcoming only in 2013. Thus, thereis a clear ‘early mover’ advantage for Sri Lanka under the bilateral agreement.Second, the negative list that Sri Lanka faces under ISLFTA is only half the sizeof the negative list under SAFTA.
In future research, it would be interesting to assess the impact of ISLFTA onnon-member South Asian countries. This will depend on the importance of Indianand Sri Lankan markets for the excluded countries. Similarly, it would be inter-esting to perform sector-specific analyses.
Appendix I
India–Sri Lanka Free Trade Agreement: Commitment of MemberCountries in Brief 36
Mutual phased tariff concessions on 5112 products on six-digits (HS1996) havebeen agreed. An eight year time-table was specified for phasing out tariffs on alltariff lines, except the products on negative list of each country.
India’s commitment
1 Duty free access to 1351 products upon entry into force from March 2000.2 Duty concession of 25 percent on 528 products in HS Chapters 51–56, 58–60
and 63.3 Margin of preference of 50 percent on the remaining products of 2799 increased
to 100 percent in two stages in March 2003.4 Duty concession of 50 percent on 233 tariff products of readymade garments and
5 tariff products of tea. This concession is under a tariff rate quota (TRQ) of 15million kg of tea and of 8 million pieces of garments.37
5 Negative list of 429 products from rubber, paper, plastic, coconuts, alcoholicbeverages and textile sectors.
Sri Lanka’s commitment
1 Duty free access to 319 products upon entry into force in March 2000.2 Margin of preference of 50 percent on 839 products deepened to 70, 90 and
100 percent at the end of 2001, 2002 and 2003, respectively.
36 For complete details, the interested reader is referred to Sri Lanka’s Department of Commercewebsite: http://www.doc.gov.lk/web/indusrilanka_freetrade.php.37 A tariff rate quota is a quantity that can be imported at a certain duty. Any quantity above thatamount is subject to a higher tariff.
ASIAN ECONOMIC JOURNAL 178
© 2012 The AuthorAsian Economic Journal © 2012 East Asian Economic Association and Blackwell Publishing Pty Ltd

3 For 2724 products, the tariff was brought down to: 35 percent by March 2003;70 percent by March 2006; and 100 percent by March 2008.
4 Negative list of 1180 products from agriculture, automobile, electrical machin-ery, aluminum, copper, iron and steel, rubber, paper and plastic.
Rules of origin
1 The domestic value addition should be 35 percent; if the raw material/inputs aresourced from one member by the other, the value addition is reduced to25 percent within the overall limit of 35 percent.
2 Inputs to undergo substantial transformation at the four-digit level of thecustoms Harmonized System classification.
3 A list of operations, such as simple packing, cutting and assembly, have beendefined that do not qualify for preferential market access.
Appendix II
Control countries
Country 2 Panel List of control countries Remarks
China Panel A The 180 COMTRADE countries minus China, India, Sri Lanka,minus Hong Kong China, Macao China, and ASEAN countries(Brunei Darussalam, Cambodia, Indonesia, Laos, Malaysia,Myanmar, Philippines, Singapore, Thailand and Vietnam)
165 countries with no substantialchange in preferential traderelations with China
USA Panel B The 180 COMTRADE countries minus the USA, India, Sri Lanka,minus Australia, Canada, Chile, Israel, Jordan, Mexico andSingapore
170 Countries with no substantialchange in preferential traderelations with the USA
EU-15 Panel C The 180 COMTRADE countries minus EU-15, India, Sri Lanka,minus Algeria, Andorra, Chile, Croatia, Egypt, Faroe Island,Iceland, Israel, Jordan, Lebanon, Mexico, Morocco, Norway,South Africa, Syrian Arab Republic, Switzerland, Tunisia andTurkey
144 countries with no substantialchange in preferential traderelations with the EU-15
Indonesia Panel A The 180 COMTRADE countries minus China, India, Sri Lanka,minus Hong Kong China, Macao China, and ASEAN countries(Brunei Darussalam, Cambodia, Indonesia, Laos, Malaysia,Myanmar, Philippines, Singapore, Thailand and Vietnam)
165 Countries with no substantialchange in preferential traderelations with Indonesia
Australia Panel D The 180 COMTRADE countries minus Australia, India, Sri Lanka,minus New Zealand, Singapore, Thailand and the USA
173 Countries with no substantialchange in preferential traderelations with Australia
Switzerland Panel E The 180 COMTRADE countries minus Switzerland, India, SriLanka, minus EU-15 (Austria, Belgium, Denmark, Finland,France, Germany, Greece, Ireland, Italy, Luxembourg, theNetherlands, Portugal, Spain, Sweden and the UK), Iceland,Liechtenstein, Norway (EFTA countries) and Faroe Islands
159 Countries with no substantialchange in preferential traderelations with Switzerland
Malaysia Panel A The 180 COMTRADE countries minus China, India, Sri Lanka,minus Hong Kong China, Macao China, and ASEAN countries(Brunei Darussalam, Cambodia, Indonesia, Laos, Malaysia,Myanmar, Philippines, Singapore, Thailand and Vietnam).
165 countries with no substantialchange in preferential traderelations with Malaysia
Note: The above table provides the list of control countries in brief. For transparency, the complete list can be obtained on request bysending an email to me: [email protected].
INDIA–SRI LANKA FREE TRADE AGREEMENT 179
© 2012 The AuthorAsian Economic Journal © 2012 East Asian Economic Association and Blackwell Publishing Pty Ltd
References
Baldwin, R., 2006, Multilateralising regionalism: Spaghetti bowls as building blocs on the path toglobal free trade. The World Economy, 29, pp. 1451–518.
Bhagwati, J and A. O. Krueger,1995, The dangerous drift to preferential trade agreements. AEI PressWashington, DC.
Fukao, K., T. Okuba and R. M. Stern, 2003, An econometric analysis of trade diversion under NAFTA.North American Journal of Economics and Finance, 14, pp. 3–24.
Gould D., 1998, Has NAFTA changed North American trade? Federal Reserve Bank of DallasEconomic Review, First Quarter, pp. 12–22.
Holmes, T., 2005, What drives regional trade agreements that work? HEI Working Paper No: 07/2005.The Graduate Institute of International and Development Studies, Geneva.
JSG, 2003, India–Sri Lanka Comprehensive Economic Partnership Agreement, Joint Study Group,October 2003, Governments of India and Sri Lanka.
Kelegama, S. and Mukherji, I. N., 2007, India–Sri Lanka bilateral free trade agreement: Six yearsperformance and beyond. RIS DP# 119, February 2007. Research and Information System forDeveloping Countries, New Delhi.
Krueger A., 2000, NAFTA’s effects: A preliminary assessment. World Economy, 23, pp.761–75.Romalis J., 2005, NAFTA’s and CUSFTA’s impact on international trade. NBER WP11059. NBER,
Cambridge, MA.Soloaga, I. and A. L. Winters, 2001, Regionalism in the nineties: What effect on trade? North
American Journal of Economics and Finance, 12, pp. 1–29.USITC, 2003, Chapter 6: The impact of NAFTA preferences on U.S.–Mexican trade: A sectoral
approach. The Impact of Trade Agreements, United States International Trade Commission,Washington, DC.
ASIAN ECONOMIC JOURNAL 180
© 2012 The AuthorAsian Economic Journal © 2012 East Asian Economic Association and Blackwell Publishing Pty Ltd