Embed Size (px)
Citation preview
DOCUMENT RESUME
ED 280 863 TM 870 190
AUTHOR Athanasou, James A.TITLE An Outline of the Development of the Vocational
Interest Survey pnd Preliminary Technical Data.Information Paper. [Draft].
INSTITUTION New South Wales Dept. of Industrial Relations andEmployment, Darlinghurst (Australia). Human ResourcesDiv.
REPORT NO ISBN-0-7305-2116PUB DATE Dec 86NOTE 30p.; For related documents, see TM 870 191-193.PUB TYPE Reports - Research/Technical (143)
EDRS PRICE MF01/PCO2 Plus Postage.DESCRIPTORS Careers; Construct Validity; Correlation; Foreign
Countries; High Schools; *Interest Inventories; ItemAnalysis; Measurement Techniques; Occupations;*Questionnaires; Rating Scales; Research Design;Surveys; *Test Construction; Test Reliability;*Vocational Interests
IDENTIFIERS Australia (New South Wales); Holland VocationalPreference Inventory; *Vocational Interest Survey
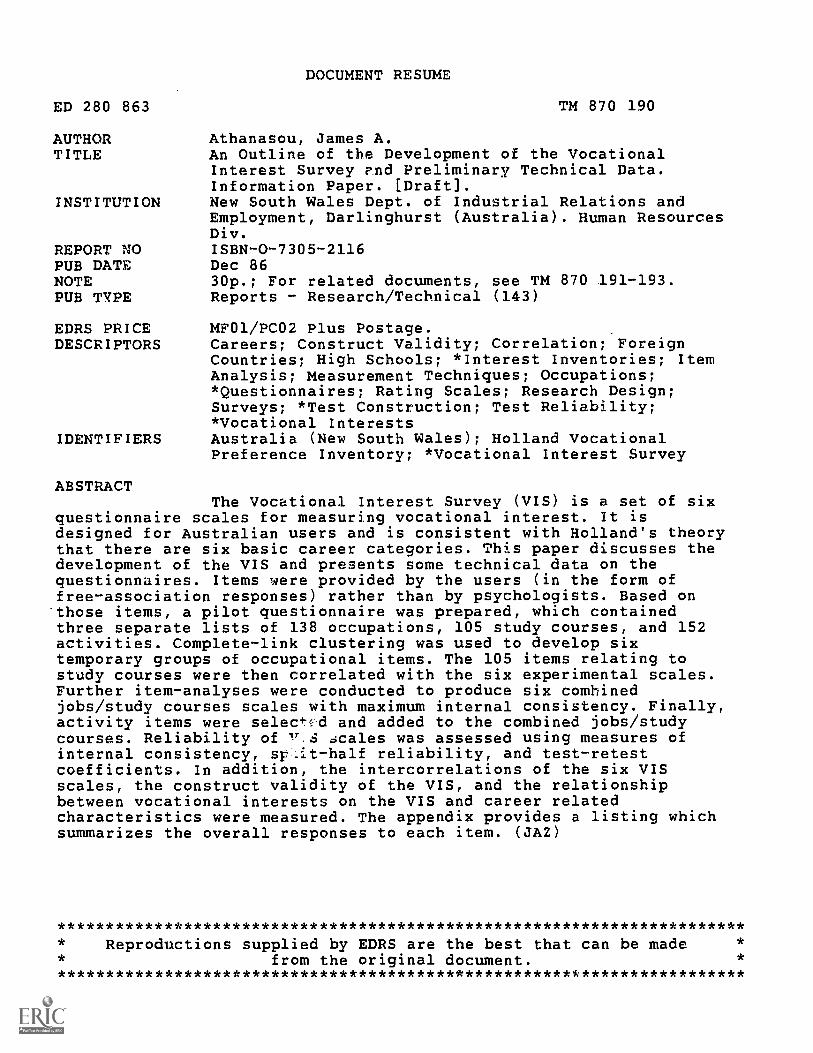
ABSTRACTThe Vocational Interest Survey (VIS) is a set of six
questionnaire scales for measuring vocational interest. It isdesigned for Australian users and is consistent with Holland's theorythat there are six basic career categories. This paper discusses thedevelopment of the VIS and presents some technical data on thequestionnaires. Items were provided by the users (in the form offree-association responses) rather than by psychologists. Based onthose items, a pilot questionnaire was prepared, which containedthree separate lists of 138 occupations, 105 study courses, and 152activities. Complete-link clustering was used to develop sixtemporary groups of occupational items. The 105 items relating tostudy courses were then correlated with the six experimental scales.Further item-analyses were conducted to produce six combinedjobs/study courses scales with maximum internal consistency. Finally,activity items were select'd and added to the combined jobs/studycourses. Reliability of v.S cales was assessed using measures ofinternal consistency, sp_it-half reliability, and test-retestcoefficients. In addition, the intercorrelations of the six VISscales, the construct validity of the VIS, and the relationshipbetween vocational interests on the VIS and career relatedcharacteristics were measured. The appendix provides a listing whichsummarizes the overall responses to each item. (JAZ)
***********************************************************************Reproductions supplied by EDRS are the best that can be made
from the original document.***********************************************************************

INFORMATION PAPER
AN OUTLINE OF THE DEVELOPMENT OF THE VOCATIONAL
INTEREST SURVEY AND PRELIMINARY TECHNICAL DATA
James A. Athanasou
U.S. DEPARTMENT OP EDUCATIONOffice of Educatbnal Research and Improvement
EDUCATIONAL RESOURCES INFGRMATIONCENTER (ERIC)
Is document has been reproduced asreceived from the person or organizationoriginating
0 Minor changes have been made to improvereproduction quahty
Points of view or opinions stated in this docu .ment do not necessarily represent officialOERI position or poficy
"PERMISSION. TO REPRODUCE THISMATERIAL I-1,tk BEEN GRANTED BY
in 4 (Y1*._
TO THE EDUCATIONAL RESOURCESINFORMATION CENTER (ERIC)."
TRAINING 8. POLICY BRANCH
HUMAN RESOURCES DIVISION
NSW DEPARTMENT OF INDUSTRIAL RELATIONS 8. EMPLOYMENT

This report is a draft for inter-office circulation.
Comments and criticisms are solicited but this should
not be cited as a reference without the permission of
the author.
AN OUTLINE OF THE DEVELOPMENT OF THE VOCATIONAL
INTEREST SURVEY AND PRELIMINARY TECHNICAL DATA
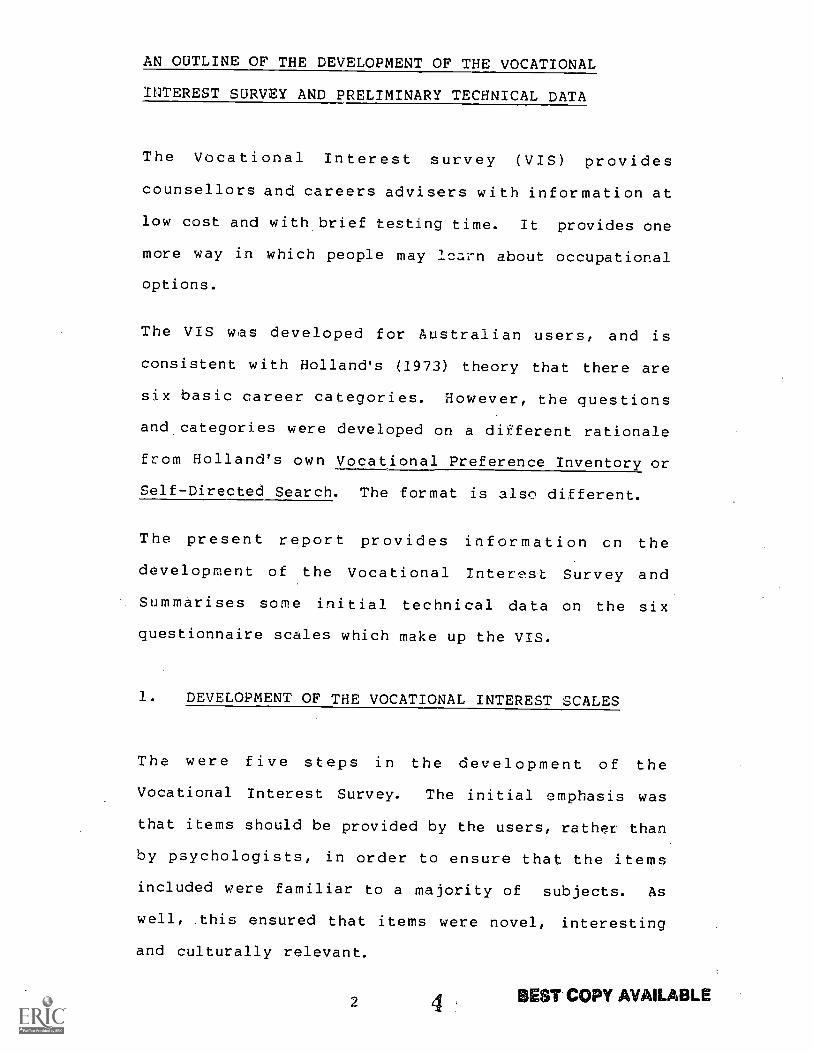
The Vocational Interest survey (VIS) provides
counsellors and careers advisers with information at
low cost and with brief testing time. It provides one
more way in which people may learn about occupational
options.
The VIS was developed for Australian users, and is
consistent with Holland's (1973) theory that there are
six basic career categories. However, the questions
and categories were developed on a different rationale
from Holland's own Vocational Preference Inventory or
Self-Directed Search. The format is also different.
The present report provides information en the
development of the Vocational Interest Survey and
Summarises some initial technical data on the six
questionnaire scales which make up the VIS.
1. DEVELOPMENT OF THE VOCATIONAL INTEREST SCALES
The were five steps in the development of the
Vocational Interest Survey. The initial emphasis was
that items should be provided by the users, rather than
by psychologists, in order to ensure that the items
included were familiar to a majority of subjects. As
well, this ensured that items were novel, interesting
and culturally relevant.
2 BEST COPY AVAILABLE

High school subjects (N=148) were asked in a written
free-association task to list as many jobs as they
could remember in one minute. The rationale for this
procedure was that subjects should be able to recognise
items which they had recalled from memory and which
they had committed to writing. Simialr free-
association tasks in relation to leisure, activities
and study courses were also administered to the same
subjects, who produced 714 jobs, 999 courses and 1006
activities. Some examples of these responses are
provided below:
EXAMPLES OF FREE-ASSOCIATION RESPONSES
Female 15 years Male 15 years
(A) JOBS
Air hostess Accountant
Air steward Ambulance driver
Mechanic Chief
Travel Agent Cock
Bank Teller Plumber
Typist Builder
Teacher Bricklayer
Shop assistant Policeman
Housewife Solicitor
Navy Officer Mechanic
Secretary
Lawyer
(B) STUDY COURSES
Maths Law
English Teaching
Science Cooking
Geography New Methods
History. Books - fiction
non - fiction
Law
Police work
Botanist
Marine biologist
Bird watcher
5
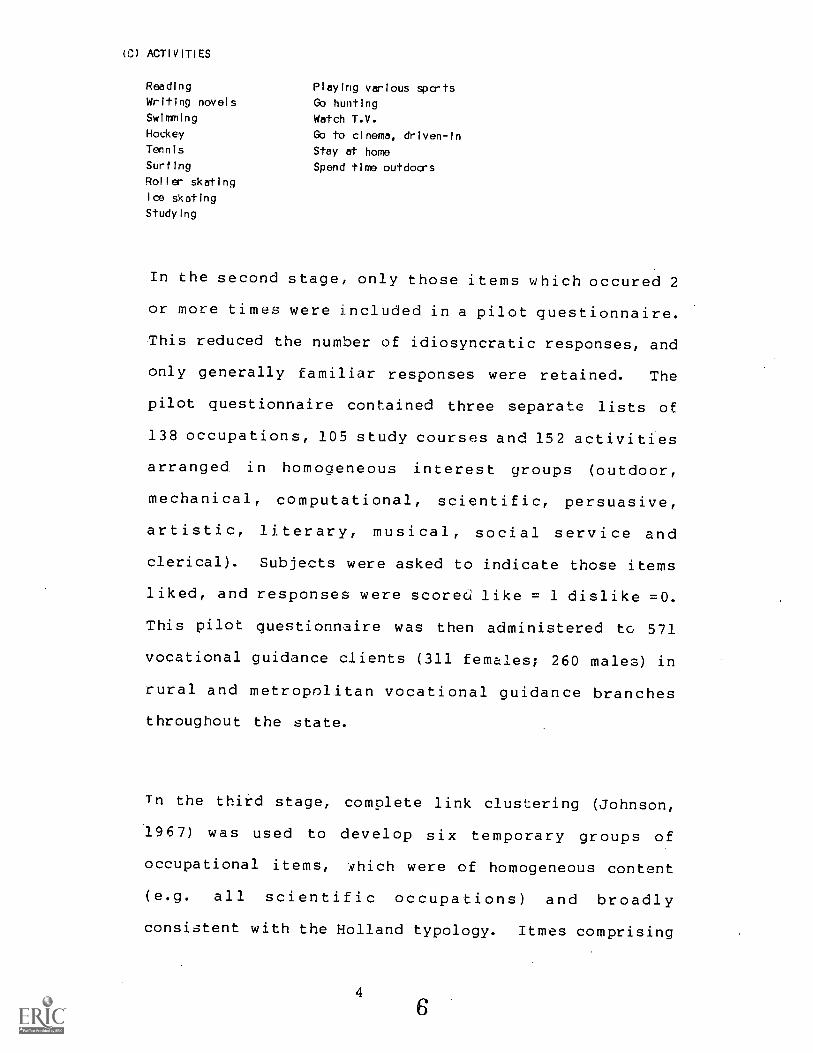
(C) ACTIVITIES
Reading Playing various spertsWriting novel s Go huntingSwimming Watch T.V.Hockey Go to cinema, driven-InTennis Stay at homeSurf Ing Spend time outdocrsRol I cr skatingIce skatingStudy ling
In the second stage, only those items which occured 2
or more times were included in a pilot questionnaire.
This reduced the number of idiosyncratic responses, and
only generally familiar responses were retained. The
pilot questionnaire contained three separate lists of
138 occupations, 105 study courses and 152 activities
arranged in homooeneous interest groups (outdoor,
mechanical, computational, scientific, persuasive,
artistic, literary, musical, social service and
clerical). Subjects were asked to indicate those items
liked, and responses were scored like = 1 dislike =0.
This pilot questionnaire was then administered to 571
vocational guidance clients (311 females; 260 males) in
rural and metropolitan vocational guidance branches
throughout the state.
Tn the third stage, complete link clustering (Johnson,
1967) was used to develop six temporary groups of
occupational items, which were of homogeneous content
(e.g. all scientific occupations) and broadly
consistent with the Holland typology. Itmes comprising
4

each scale were then selected to correlate higher with
their total score, than any other scale. Five
subsequent item-analyses correlated each item ith the
scale totals, until such time as the six experimental
scales had maximal internal-consistency. Statistical
and technical details of those scales have been
reported previously (Athanasou, 1982).
In the fourth stage, the 105 items relating to study
courses were correlated with the six experimental
scales. Further item-analyses were conducted along the
same lines as above to produce six combined jobs/study
courses scales with maximal internal consistency. The
final stage involved adding and selecting from the 152
activity items to the combined jobs/study - courses.
The final number of items, mean scale scores standard
deviations and item correlations are listed in Table 1.
The appendix provides a listing which summarises the
overall response rate to each item.
The uneven number of items in each scale may deserve
some comment as it departs from established practice.
To a very large extent it reflects the.uneven
distribution of occupations and activity preferences in
the workforce (i.e. the large number of non-
professional, semi-skilled and trades). For example, a
random sample of 250 occupations listed in the
Australian Standard Classification of Occupations
(ASCO) showed that some 58% of first letter codes were
5 7
Realistic or Practical (Athanasou, 1984). Furthermore,
there are relatively few opportunities for practising
enterprising activities in school environments (Funder et
al. 1983). Results of a study by Funder et al. (1983),
suggest that in Australia, different kinds of vocational
interest show different developmental trends.
8
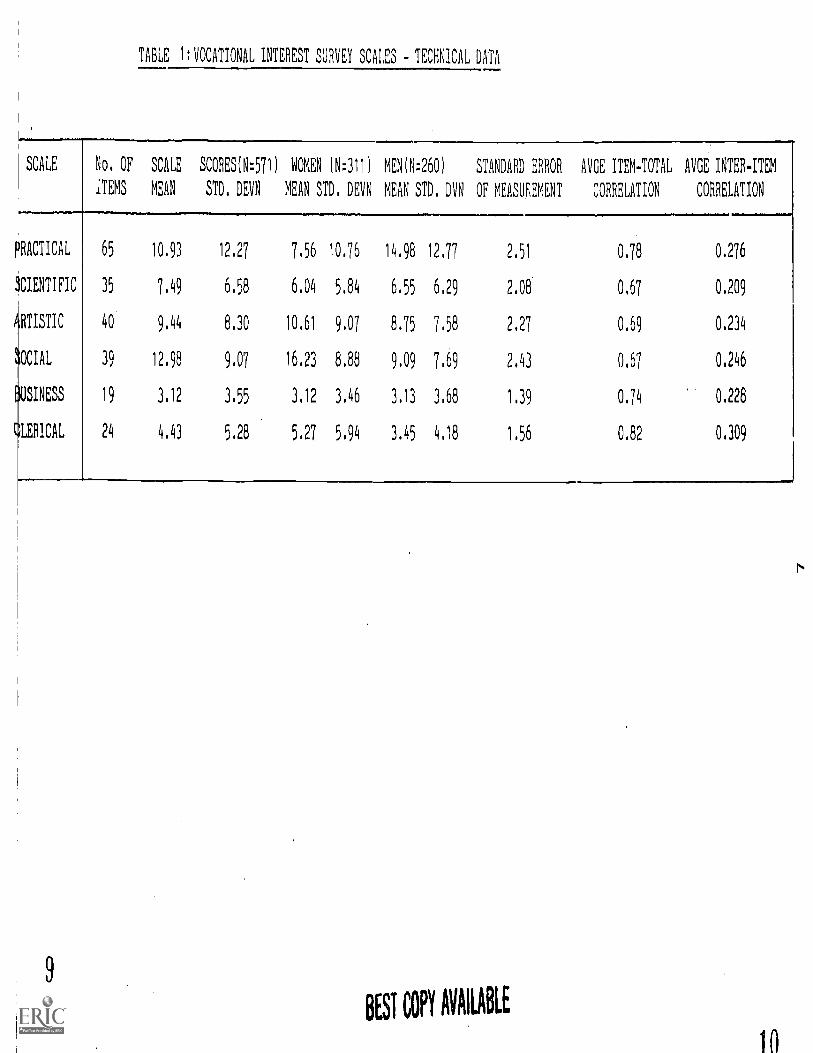
TABLE 1:V3CA1IONAL INTEREST SURVEY SCALES - TECHNICAL DATA
SCALE No, OF SCALE SCORES(N:571) WOMEN (N:311) MENIN:2601 STANDARD ERROR AVE ITEM-TOTAL AVd INTER-ITEM
ITEMS MEAN STD. DEVN MEAN STD. DEVN MEAN STD. DVN OF MEASUEEMENT CORRELATION CORRELATION
PRACTICAL
3C1ENTIFIC
RTISTIC
OCIAL
S1NESS
LERICAL
65 10.93 12.27
35 7.49 6.58
40 9,44 8.30
39 12.98 9.07
19 3,12 3,55
24 4.43 5.28
7.56
6.04
10.61
16.23
3.12
5.27
10.76 14.98 12.77 2.51 0.78 0.276
5.84 6.55 6.29 2.08 0,67 0.209
9.07 8.75 7.58 2.27 0.69 0.234
6.88 9.09 7.69 2,43 0.67 0.246
3.46 3.13 3.68 1.39 0.74 0,228
5.94 3.45 4.18 1.56 0.82 0.309
BEST COPY AVAILABLE
10

Some items in the VIS appear in more than one section
(i.e. jobs, courses, activities) of a category and this
may lead to the impression that there is considerable
overlap in items. However, it seems to be the cese
that jobs, courses and activities do not constitute a
single domain (Holland, 1973). Correlations oetween
these items in the three sections are generally low,
and some examples are provided below:
Job Course Activity item-Total Proportion
Correlationanswering "like"
A. Hairdresser-Job .17 .25 .686 :254
Hairdressing-course .34 .542 .271
HairdressIng-activity .808 .454
B. Carpenter-Job .28 .17 .906 .201
Carpenter-course .27 .832 .228
Carpenter-activity .713 .075
C. Builder-Job .23 .53 .999 .161
Builder-course .35 .789 .186
Builder-activity .956 .105D. Computer programmer-Job .19 .32 .691 .299
Computer operator-Job .22 .30 .682 .273
Computers-course .16 .942 .180
Working computers-activity .479 .247
Thus, it is argued that there are different perceptions
of the "same" . 3m when it is listed as a job, a course
of study or an activity. Finally, no item was included
in more than one scale.

2. PRELIMINARY TECHNICAL DATA
The preliminary tech:lical data provided in this paper
relate to the reliability and consistency of each of
the six interest categories or scales of the VIS.
Additional data is outlined on the relationships among
the six interest categories, and between the VIS and
other variables such as ability or personality
Reliability
Reliability of the VIS scales was assessed using
measures of internal consistency, split-half
reliability and test-retest coefficients. Thus, both
the stability and consistency of vocational interest
responses were examined.
Coeffir-ient of Internal Consistency
The intermal consistency estimates of reliability based
on the Kuder-Richardson 20 formula are shown in Table
2. Essentially, these measures indicate the eegree to
which the items in each scale are measuring che same
thing. Results for the original test-development
sample indicate thac the contents of each scale are
relatively homogeneous (0.84 to 0.95). Separate data
was collected on 1420 high school students and the
internal consistency reliability estimates for each
scale were as follows: 0.92, Practical; 0.84,
912


Scientific; 0.89, Artistic; 0.91, Social; 0.83,
Business 0.84, Clerical.
Spilt-half Split-half reliability coefficients from
the original sample (N=571) range from 0.86 to 0.96.
Test-Retest The stability of the scales is indicated
by the correlation between test scores and scores on
retest after a time lapse. For interests, this is an
important measure, since the likes and dislikes of
adolescents for particular items may vary in the short-
term. Data on 96 high school students (44 female and
52 male) tested one-week apart showed the following
test-retest coefficients, which range from 0.72 to
0.91:-
Scale Test Retest Coefficient (N=96)
Practical 0.81
Scientific 0.83
Artistic 0.84
Social 0.91
Business 0.72
Clerical 0.83
Coefficients of internal consistency, split-half and
test-retest stability, together with the Hoyt's
analysis of variance index indicate that the VIS scales
have extremely high reliability. In part, these high
10
13

reilabilities are due to the large number of items per
scale, the methods of item selection and scale
construction procedures.
TABLE 2: RELIABILITY OF VIS SCALES
Scale Kuder-Richardson 20 Rulon Split-Half Hoyts Analysis
Reliability Reliability of Variance
Practical 0.95 0.96 0.98
Scientific 0.90 0.92 1.00
Artistic 0.92 0.94 1.00
Social 0.92 0.94 0.99
Business 0.84 0.86 0.95
Clerical 0.91 0.87 0.W
Scale Relationships
The intercorrelations of the six VIS scales are
presented in Table 3. Generally, the hexagonal
arrangement of interests proposed by Holland was
confirmed. The mean correlation for adjacent scales
(RI, IA, AS, SE, EC, CR) was 0.37, for alternate scales
on the hexagon (RA, IS, AE, SC, ER, CI) it was 0.31,
and for opposite scales on the hexagon (RS, IE, AC) it
was 0.21. These results are in accordance with earlier
findings, that the relationships between the categories
are inversely proportional to the size of the
correlations between them. However, it was also
11
14

observed that the data are not in the perfect hexagonal
order and this point was noted by Holland: "At best,
the hexagonal resulting from real world data are
misshapen polygons, but this arrangement is superior to
the use of unrelated or unordered categories, (1974,
43).
TABLE 3: CORRELATION MATRIX-UPPER TRAINGULAR ELEMENTS (N.2459)*
PRACT SCI ART SOC BUS CLER
Practical
Scientific
Artistic
Business
Clerical
- 233*
-
101
514
-137
441
590
-
223
467
410
351
-
067
296
310
414
514
Mean
Stand. Dev.
11.4
10.3
8.1
5.9
10.2
7.7
12.7
8.9
5.5
4.1
6.0
5.0
p.
Principal components analysis with rotation to the
varimax criterion (Kaiser, 1958) produced results
comparable with earlier studies, namely, a general
factor probably related to method and a bipolar Things
(practical) VS People (Social) component (cf Athanasou
et al 1981). Loading for components with eigen values
> 1.0 are listed in Table 4.
1 5
12
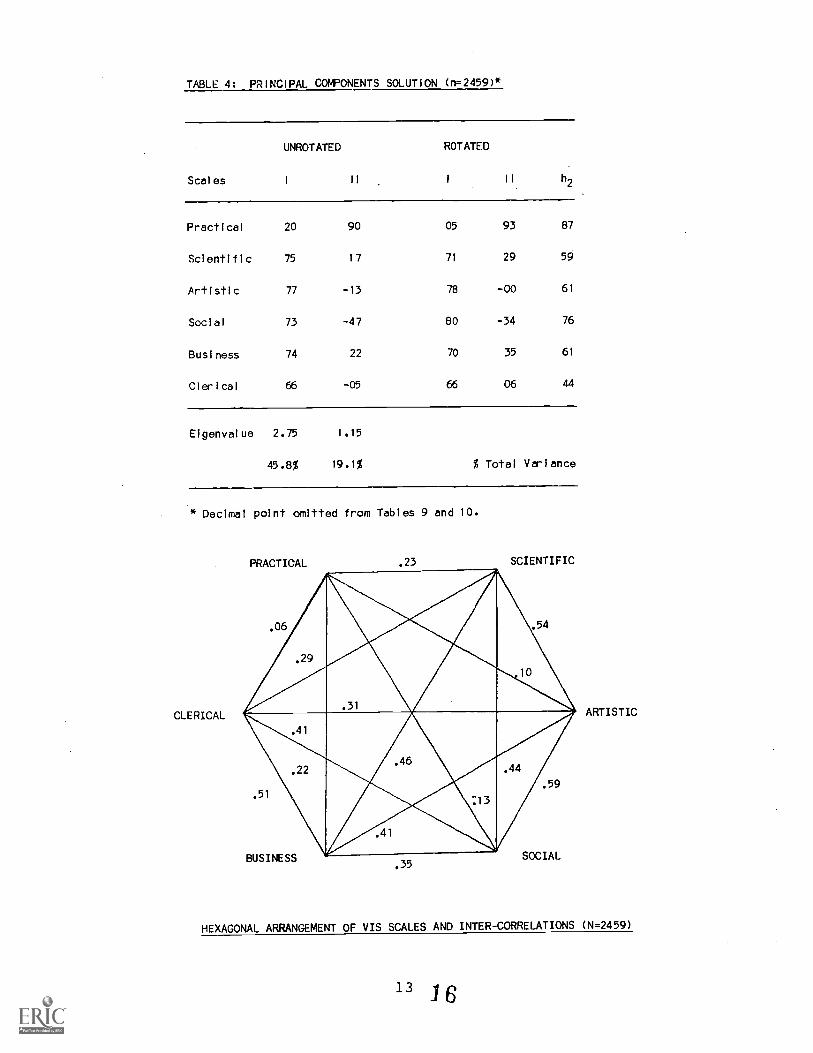
TABLE 4: PRINCIPAL COMPONENTS SOLUTION (n=2459)*
Scales
UNROTATED
I II
Practical 20 90
Scientific 75 1 7
Artistic 77 -13
Social 73 -47
Business 74 22
Clerical 66 -05
Eigenvalue 2.75 1.15
45.8% 19.1%
ROTATED
h2
05 93 87
71 29 59
78 -00 61
80 -34 76
70 35 61
66 06 44
% Total Variance
* Decimal point omitted from Tables 9 and 10.
CLERICAL
PRACTICAL .23 SCIENTIFIC
.29
.411114111ilt 1111116..
'4A41.06 .54
.51
,17 :
BUSINESS SOCIAL.35
HEXAGONAL ARRANGEMENT OF VIS SCALES AND INTER-CORRELATIONS (N=2459)
131 6
ARTISTIC

Complete-link clustering using the hierachica 1
procedure ot Johnston (1967) produced a partial match
to the Holland (1973) model, in terms of the ordering
of interest categories. The independence of all scales
especially the Practical sc:,le was also confirmed by
these results.
PRACT. ART. SOC. SCI. BUS. CLER.
Complete-link clusters of VIS Scales.
Correlation with other measures of Holland's types
Correlations between the Occupations section in each
scale of the VIS and six scores from the Occupations
section of the Self-Directed Search were available from
a pilot study of guidance clients(n=79). In all six
instances correlations between the related Self-
Directed Search and VIS scales (i.e. Practical with
Realistic; Scientific with Investigative: Artistic with
Artistic; Social with Social; Busi.ness with
Enterprising; Clerical with Conventional) were highest
14 1 7

(see Table 3). Some perspective on these results was
provided by correlations between Holland's Vocational
Preference Inventory and the Self-Directed Search, also
developed by Holland. The median correlation was 0.43
for males and 0.55 for females (Holland, 1979). For
the six UNIACT (Lamb & Prediger, 1981) and VPI scales,
the median was 0.46 for males and 0.52 for females.
For the VIS, the median correlation was 0.64 and
indicated the close relationship in format and style of
these two measure of Holland types.
Other measures of interests, ability, and personality
Additional data relevant to the construct validity of
the VIS are provided in this section. an understanding
of what the VIS scales are measuring and the pertinence
of these scales is gained by examining their
relationships to cognitive measures, personality
ratings, and vocational constructs.
Correlations with self-estimates of Kuder interests
from the Kuder Interest Survey - KIS (Athanasou, 1980)
are shown in Table 5 the KIS was administered the same
time as the pilot questionnaire to 571 guidance
clients. Both inventories were designed to measure
basic interests, and the highest correlations for
related scales support the expected results.
1 815
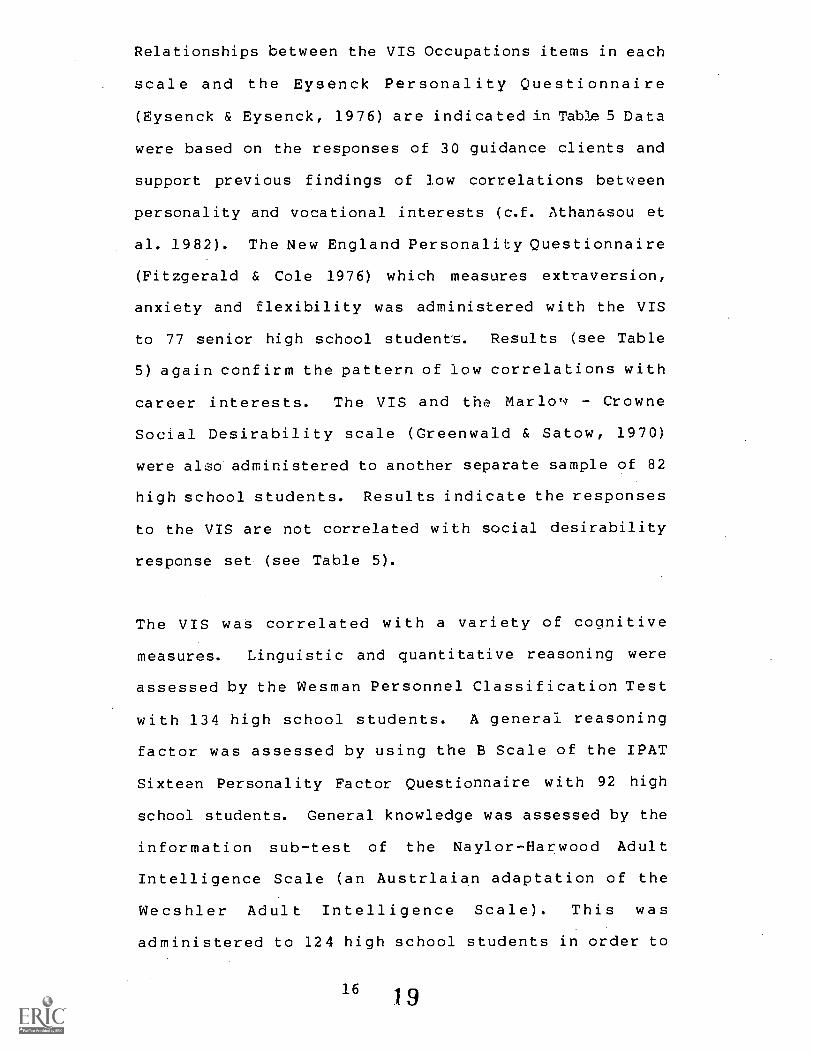
Relationships between the VIS Occupations items in each
scale and the Eysenck Personality Questionnaire
(Eysenck & Eysenck, 1976) are indicated in nabie 5 Data
were based on the responses of 30 guidance clients and
support previous findings of low correlations between
personality and vocational interests (c.f. Athanasou et
al. 1982). The New England Personality Questionnaire
(Fitzgerald & Cole 1976) which measures extraversion,
anxiety and flexibility was administered with the VIS
to 77 senior high school students. Results (see Table
5) again confirm the pattern of low correlations with
career interests. The VIS and the Marlow - Crowne
Social Desirability scale (Greenwald & Satow, 1970)
were also administered to another separate sample of 82
high school students. Results indicate the responses
to the VIS are not correlated with social desirability
response set (see Table 5).
The VIS was correlated with a variety of cognitive
measures. Linguistic and quantitative reasoning were
assessed by the Wesman Personnel Classification Test
with 134 high school students. A general reasoning
factor was assessed by using the B Scale of the IPAT
Sixteen Personality Factor Questionnaire with 92 high
school students. General knowledge was assessed by the
information sub-test of the Naylor-Harwood Adult
Intelligence Scale (an Austrlaian adaptation of the
Wecshler Adult Intelligence Scale). This was
administered to 124 high school students in order to
16 1

measure an aspect of verbal IQ and breadth of
interests. Results indicated low correlations between
interests and abilities (Table 5). The highest
correlation of 0.35 was between the NHAIS Information
and Scientific interests.
Correlations with vocational characteristics
Tables 5 also provides an outline of the relationship
between vocational interests on the VIS and career-related
characteristics. These results were based on separate
studies of high school students. The total score on the
Job Knowledge Survey (Loesch, 1978) was not significantly
relatea ( o< = 0.05) to any of the six VIS scales. The
level of career decidedness was assessed by the Career
Decision Scale (Holland & Holland, 1977). Again, this
variable was relatively independent from interests. When
subjects were divided into decided or undecided based on
the Occupations Alternative Questionnaire (Slaney, 1980)
it was apparent that being decided or undecided about a
career was not significantly correlated with career
interests. The extent of career exploration was assessed
using a checklist - Finding out facts about jobs
(Athanasou, 1986). Except for the Practical and Clerical
scales, there was a significant (p( 0.05) positive
correlation between the extent of career exploration and
the level of some career interests.
17 2 0
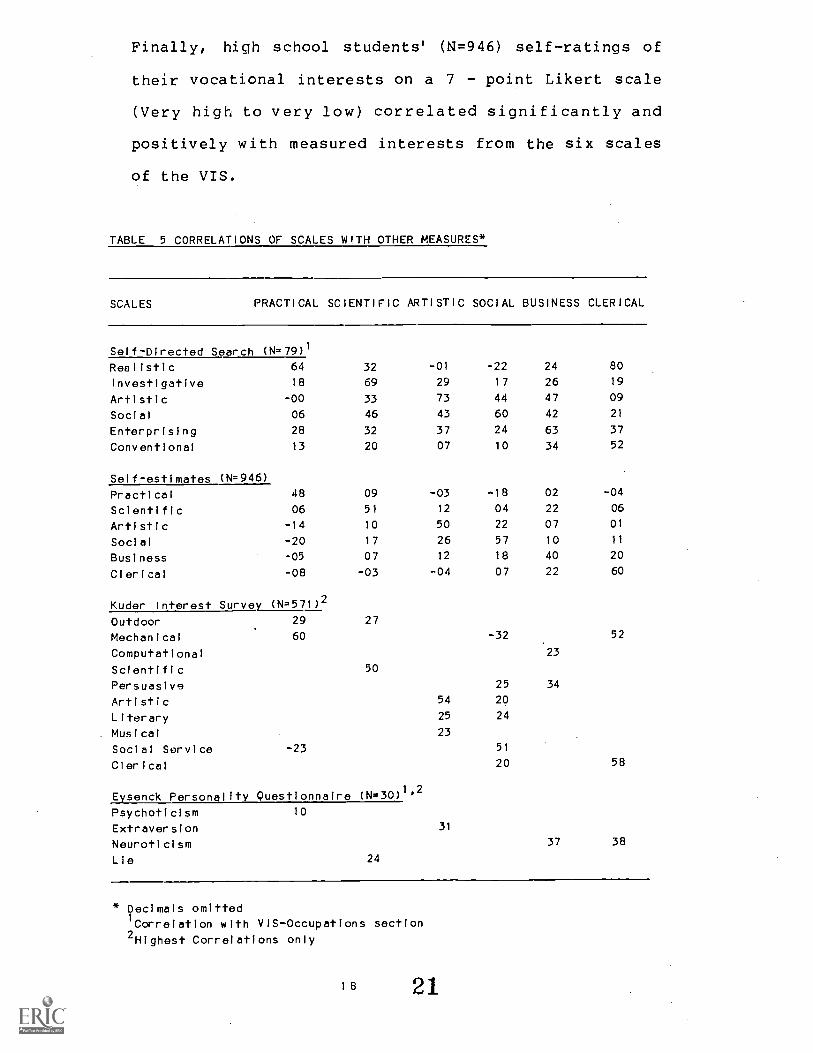
Finally, high school students' (N=946) self-ratings of
their vocational interests on a 7 - point Likert scale
(Very high to very low) correlated significantly and
positively with measured interests from the six scales
of the VIS.
TABLE 5 CORRELATIONS OF SCALES WITH OTHER MEASURES*
SCALES PRACTICAL SCIENTIFIC ARTISTIC SOCIAL BUSINESS CLERICAL
Self-Directed Search (N=79) 1
Realistic 64 32 -01 -22 24 80
Investigative 18 69 29 17 26 19
Artistic -00 33 73 44 47 09
Social 06 46 43 60 42 21
Enterprising 28 32 37 24 63 37
Conventional 13 20 07 10 34 52
Self-estimates (N=946)
Practical 48 09 -03 -18 02 -04
Scientific 06 51 12 04 22 06
Artistic -14 10 50 22 07 01
Social -20 17 26 57 10 11
Business -05 07 12 18 40 20
Clerical -08 -03 -04 07 22 60
Kuder Interest Survey (N=571) 2
Outdoor 29 27
Mechanical 60 -32 52
Computational 23
Scientific 50
Persuasive 25 34
Artistic 54 20
Literary 25 24
Musical 23
Social Service -23 51
Clerical 20 58
Eysenck Personality Questionnaire (N=30)1°2
Psychoticism 10
Extraversion 31
Neuroticism 37 38
Lie 24
* Decimals omitted1 Correlation with VIS-Occupations section2 Highest Correlations only
1 8 21
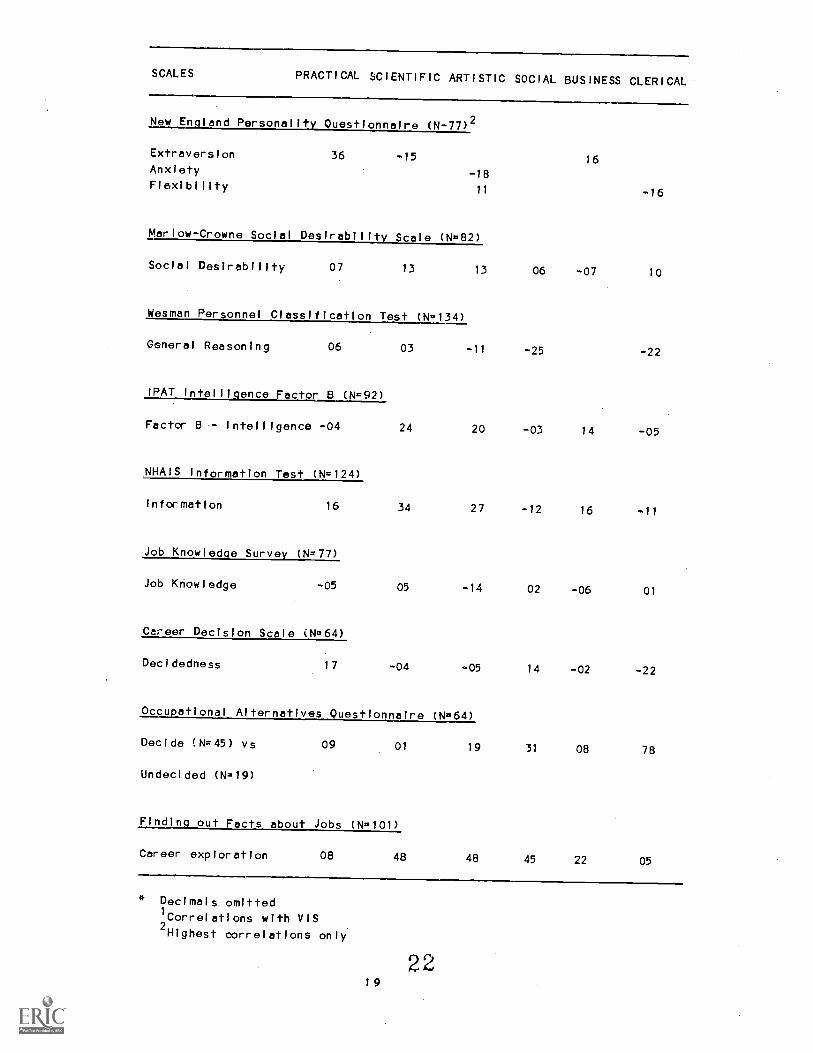
SCALES PRACTICAL SCIENTIFIC ARTISTIC SOCIAL BUSINESS CLERICAL
New England Personality_ Questionnaire (N-77)2
16Extraversion 36 -15Anxiety -18Flexibility
11 -16
Marlow-Crowne Social Desirability Scale (N2382)
Social Desirability 07 13 13 06 -07 10
Wesman Personnel Classification Test (Nw134)
General Reasoning 06 03 -11 -25 -22
IPAT Intelligence Factor B (N=92)
Factor B Intelligence -04 24 20 -03 14 -05
NHAIS Information Test (N=124)
Information 16 34 27 -12 16 -11
Job Knowledge Survey (N=77)
Job Knowledge -05 05 -14 02 -06 01
Career Decision Scale (N=64)
Decidedness 17 -04 -05 14 -02 -22
Occupational Alternatives Questionnaire (N=64)
Decide (N=45) vs 09 01 19 31 08 78
Undecided (N=19)
Finding out Facts about Jobs (N=101)
Career exploration 08 48 48 45 22 05
* Decimals omitted1
Correlations with VIS2Highest correlations only
1 9
22
References
Athanasou, J. A. (1980)
Kuder Interest Survey: Manual (Reasearch
Edition), Sydney. N.S.W. Division of Vocational
Guidance Services.
Athanasou, J. A., O'Gorman, J. & Meyer, E. (1981)
Factorial validity of the vocational interest
scales of the Holland Vocational Preference and
Psychological Measurement, 41, 523-527.
Athanasou, J. A. (1981)
High School students preference for and sense of
understanding of the Holland vocational interest
categories. Research Report, N.S.W. Department of
Industrial Relations.
Athanasou, J. A. (1982)
Vocational Interest Survey - Si* scales for the
measurement of Holland's vocational typology.
Research Report. Sydney: N.S.W. Department of
Industrial Relations. ISBN-0-7241-4174-5.
Athanasou, J. A. (1984)
Distribution of job characteristics from random
sample of 100 occupations from ASCO. NSW
Department of Industrial Relations.
2023

Athanasou, J. A. (1986)
A behavioural checklist of career exploration
activities for use in vocational guidance and
research: preliminary study. Behaviour Change,
3(1), 48-52.
Eysenck, H. H. & Eysenck, S.B.G. (1976)
Psychoticism as a dimension of personality. Lond.:
Hodder & Stoughton.
Fitzgerald, D. & Cole, B. (1976)
A personality model for the analysis of teaching.
Final research report to the Commission on Advanced
Education.
Funder, K. A., Taylor, K. F. & Kelso, G. I. (1983)
Developmental trends in adolescent vocational
interests. Paper presented at 18th Annual
Conference, Australian PsIychological Society,
University of Sydney.
Greenwald H. J. & Satow, Y. (1970)
A short social desirability scale. Psychological
Reports, 27, 131-135.
Holland, J. L. (1973)
Making vocational choices: A theory of careers,
Englewood Cliffs, N. J. : Prentice-Hall.
21 24
Holland, J. L. & Holland, J. E. (1977)
Vocational indecision: More evidence and speculation.
Journal of Counseling Psychology, 1977, 24(5), 404-
414.
Holland, J. L. (1979)
Professional manual, 1979 edition. The Self-Directed
Search, Palo Alto, Calif. : Consulting Psychologists
Press.
Johnson, S. C. (1967)
Hierarchical clustering schemes, Psychometrika, 32,
241-254.
Kaiser, H. F. (1958)
The varimax criterion for analytic rotation in factor
analysis, Psychometrika, 23, 187-200.
Lamb, P. R. & Prediger, D. J. (1981)
Technical report for the Unisex Edition of the ACT
Interest Inventory (UNIACT), Iowa, American College
Testing Program.
Loesch, L. C. (1978)
Manual for the Job Knowledge Survey, gainsville:
University of Florida (mimeograhp).
Wesman, A. G. (1965)
Wesman Personnel Clasification Test. Manual New
York: The Psychological Corporation.
22 25
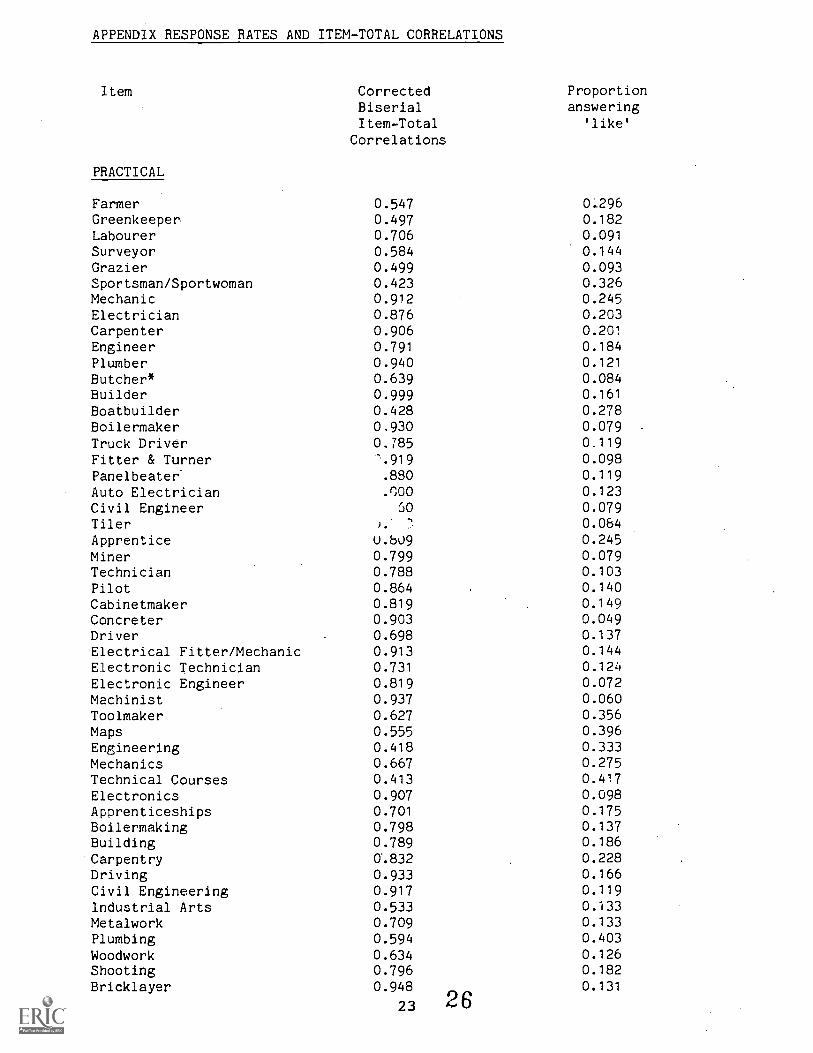
APPENDIX RESPONSE RATES AND ITEM-TOTAL CORRELATIONS
Item
PRACTICAL
CorrectedBiserialItem-Total
Correlations
Farmer 0.547Greenkeeper 0.497Labourer 0.706Surveyor 0.584Grazier 0.499Sportsman/Sportwoman 0.423Mechanic 0.912Electrician 0.876Carpenter 0.906Engineer 0.791
Plumber 0.940Butcher* 0.639Builder 0.999
Boatbuilder 0.428Boilermaker 0.930Truck Driver 0.785Fitter & Turner '.919
Panelbeater' .880
Auto Electrician .000
Civil Engineer 50
Tiler ).
Apprentice U.809Miner 0.799Technician 0.788Pilot 0.864Cabinetmaker 0.819Concreter 0.903Driver 0.698Electrical Fitter/Mechanic 0.913Electronic Technician 0.731
Electronic Engineer 0.819Machinist 0.937Toolmaker 0.627Maps 0.555Engineering 0.418Mechanics 0.687Technical Courses 0.413Electronics 0.907Apprenticeships 0.701Boilermaking 0.798Building 0.789Carpentry 0.832Driving 0.933Civil Engineering 0.917Industrial Arts 0.533Metalwork 0.709Plumbing 0.594
Woodwork 0.634Shooting 0.796Bricklayer 0.948
23
Proportionanswering
'like'
0..296
0.1820.091
0.1440.0930.3260.2450.2030.201
0.1840.1210.0840.161
0.2780.0790.1190.0980.1190.1230.0790.0840.2450.0790.1030.1400.1490.0490.1370.1440.1240.0720.0600.3560.3960.3330.2750.4170.0980.1750.1370.1860.2280.1660.1190.1330.1330.4030.1260.1820.131
26

ItemCorrectedBiserialItem-Total
Correlations
Proprortionanswering
'like'
Playing Football 0.872, 0.212Fighting 0.671 0.166Car racing 0.712 0.201Driving 0.769 0.264Laying bricks 0.869 0.208Operating machines 0.948 0.061Constructing 0.986 0.133Repairing 0.874 0.182Fixing cars 0.583 0.245Doing carpentry 0.713 0.075Doing metalwork 0.558 0.109Moving lawns1.000 0.103Building0.956 0.105Riding motor-bikes 0.762 0.219
SCIENTIFIC
Marine Engineer 0.583 0.119Doctor0.639 0.205Dentist0.616 0.273Veterinarian 0.608 0.273Scientist 0.844 0.165Pharmacist 0.481 0.180Physicist 0.692 0.084Zoologist 0.680 0.243Geologist 0.808 0.114'
Orthodontist 0.545 0.049Surgeon 0.737 0.149Physiotherapist 0.449 0.112Animals 0.482 0.515Agriculture 0.415 0.482Wildlife 0.512 0.229Environment 0.556 0.333Nature 0.477 0.329Science 0.493 0.222Chemistry 0.566 0.471Medicine 0.694 0.349Biology 0.699 0.263Physics 0.626 0.243Dentistry 0.754 0.238Geology 0.686 0.166Evolution 0.734 0.156Fossils 0.733 0.275Veterinary 0.586 0.140Zoology 0.535 0.088Psychology 0.794 0.117Sociology 0.693 0.172Bushwalking 0.734 0.135Experimenting 0.705 0.212Thinking 0.717 0.228Comprehending 0.538 0.194Solving problems 0.503 0.126
2724

Item
ARTISTIC
CorrectedBiserialItem-TotalCorrelation
Proportionanswering
'like'
Painter 0.654 0.196
Architect 0.514 0.231
Artist 0.944 0.256
Interior Decorator 0.764 0.308
Fashion Designer 0.713 0.233
Florist 0.491 0.079
Jeweller 0.580 0.161
Photographer 0.611 0.370
Designer 0.885 0.205
Signwriter 0.665 0.235
Tracer 0.677 0.067
Actor/Actress 0.642 0.270
Journalist 0.539 0.224
Writer 0.595 0.142
Musician 0.435 0.187
Dancer 0.557 0.203
Flowers 0.519 0.273
Crafts 0.608 0.114
Art 0.440 0.615
Architecture 0.725 0.417
Painting 0.777 0.320
Art History 0.857 0.277
Acting 0.802 0.326
Poetry 0.906 0.254
Cultures 0.922 0.165
Doing handcrafts 0.760 0.266
Rug making 0.656 0.280
Joking 0.518 0.468
Drawing 0.502 0.243
Painting 0.541 0.284
Designing 0.481 0.261
Sketching 0.458 0.117
Creating 0.574 0.191
Sculpting 0.927 0.277
Doing pottery 0.605 0.184
Acting 0.819 0.210
Photography 0.678 0.102
Writing 0.693 0.222
Going to theatre/plays 0.633 0.112
Singing 0.576 0.100
SOCIAL
Hairdresser 0.686 0.254
Teacher 0.604 0.303
Nurse 0.714 0.173
Social Worker 0.669 0.317
Vocational Guidance Officer 0.487 0.142
Child Care Assistant 0.702 0.270
Pre-school teacher 0.726 0.259
Nurse's aide 0.634 0.116
Occupational Therapist 0.444 0.079
Cooking 0.552 0.243
25 28
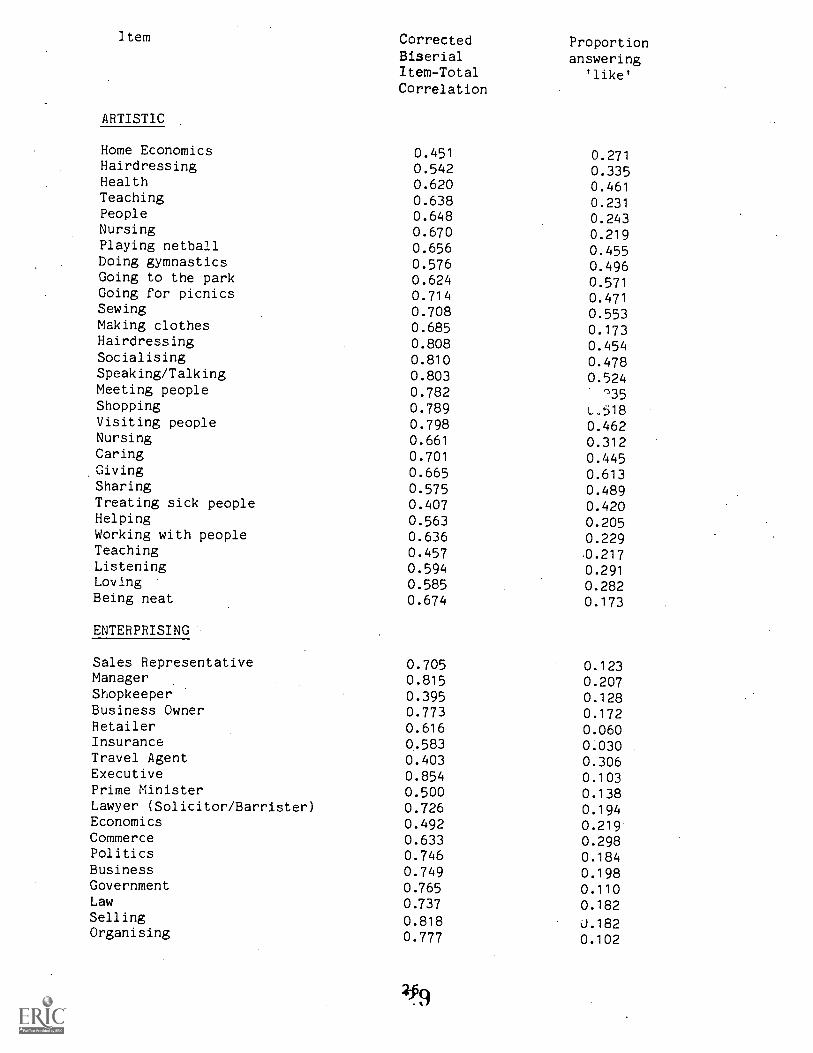
Item
ARTISTIC
CorrectedBiserialItem-TotalCorrelation
Proportionanswering
'like'
Home Economics 0.451 0.271Hairdressing 0.542 0.335Health 0.620 0.461Teaching 0.638 0.231People 0.648 0.243Nursing 0.670 0.219Playing netball 0.656 0.455Doing gymnastics 0.576 0.496Going to the park 0.624 0.571Going for picnics 0.714 0.471Sewing 0.708 0.553Making clothes 0.685 0.173Hairdressing 0.808 0.454Socialising 0.810 0.478Speaking/Talking 0.803 0.524Meeting people 0.782 '35Shopping 0.789 L..518Visiting people 0.798 0.462Nursing 0.661 0.312Caring 0.701 0.445Giving 0.665 0.613Sharing 0.575 0.489Treating sick people 0.407 0.420Helping 0.563 0.205Working with people 0.636 0.229Teaching 0.457 0.217Listening 0.594 0.291Loving 0.585 0.282Being neat 0.674 0.173
ENTERPRISING
Sales Representative 0.705 0.123Manager 0.815 0.207Shopkeeper 0.395 0.128Business Owner 0.773 0.172Retailer 0.616 0.060Insurance 0.583 0.030Travel Agent 0.403 0.306Executive 0.854 0.103Prime Minister 0.500 0.138Lawyer (Solicitor/Barrister) 0.726 0.194Economics 0.492 0.219Commerce 0.633 0.298Politics 0.746 0.184Business 0.749 0.198Government 0.765 0.110Law 0.737 0.182Selling 0.818 0.182Organising 0.777 0.102
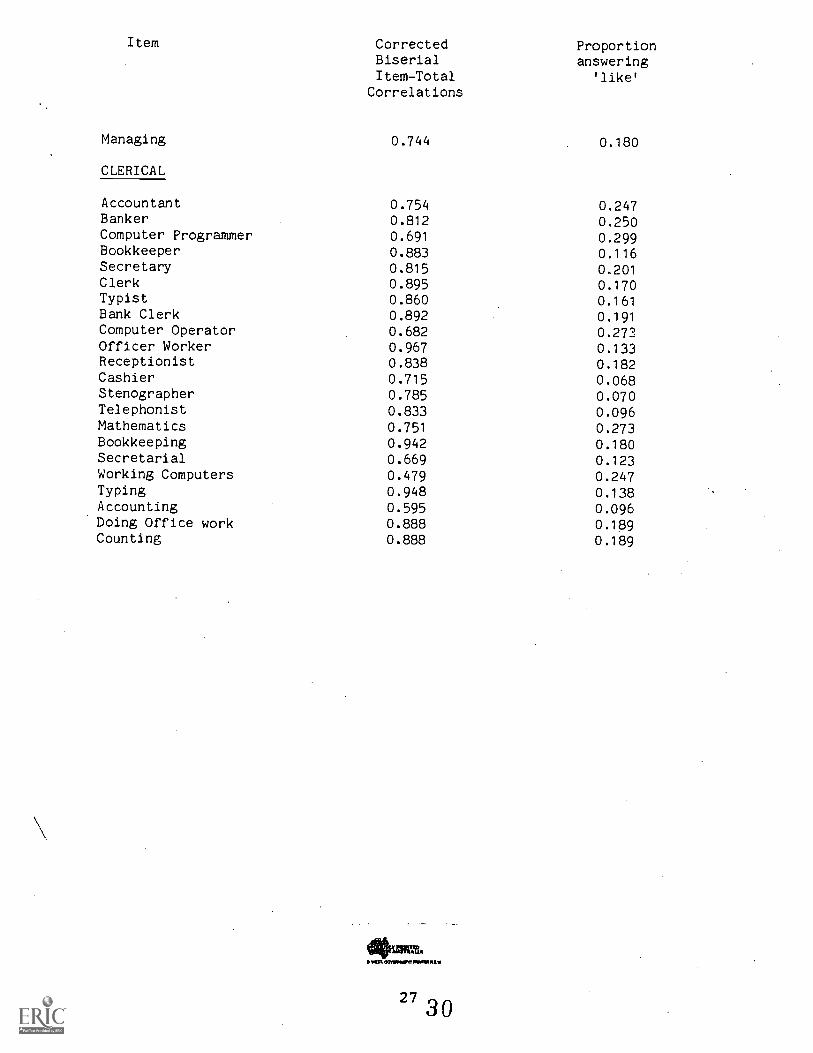
Item CorrectedBiserialItem-Total
Correlations
Proportionanswering
'like'
Managing 0.744 0.180
CLERICAL
Accountant 0.754 0.247Banker 0.812 0.250Computer Programmer 0.691 0.299Bookkeeper 0.883 0.116Secretary 0.815 0201.
Clerk 0.895 0.170Typist 0.860 0.161Bank Clerk 0.892 0.191Computer Operator 0.682 0.273Officer Worker 0.967 0.133Receptionist 0.838 0.182Cashier 0.715 0.068Stenographer 0.785 0.070Telephonist 0.833 0.096Mathematics 0.751 0.273Bookkeeping 0.942 0.180Secretarial 0.669 0.123Working Computers 0.479 0.247Typing 0.948 0.138Accounting 0.595 0.096Doing Office work 0.888 0.189Counting 0.888 0.189