Embed Size (px)
Citation preview

ED 136 664
AUTHORTITLE
INSTITUTION
PUB DATENOTE
AVAILABLE FROM
DOCUMENT RESUME
HE 008 712
Donny, William F.Postgraduation Activities: All Degree levels inPennsylvania 1975.Pennsylvania State Dept. of Education, Harrisburg.Bureau of Information Systems.Sep 7685p.; Not available in hard copy due to marginallegibility of original document.Bureau of Information Systems, Pennsylvania-Department of Education, Box 911, Harrisburg,Pennsylvania 17126
BDRS PRICE MF-$0.83 Plus Postage. HC Not Available from EDRS.DESCRIPTORS *College Graduates; *College Majors; Degrees
(Titles); *Employment Patterns; EmploymentQualifications; Employment Statistics; *EmploymentTrends; Graduate Surveys; Higher Education;Migration; *Occupations; Private Colleges;*Specialization; State Colleges; State Surveys; StateUniversities; Tables (Data)
IDENTIFIERS *Pennsylvania
ABSTRACTThis neport reflects postgraduation activities of
college students who graduated in Pennsylvania in 1975. While thereport does not attempt to say what the relationship between highereducation and postgraduation occupations should be, it does clarifywhat many of these relationships actually are by indicating thedemand for and supply of graduates in various fields of study,various degree levels and by institutional control. Data are includedon employment status by major discipline and general aegree field,relatedness of employment to major field, and out-migmtion.(Author/USE)
***********************************************************************Documents acquired by ERIC include many informal unpublished *
* materials not available from other sources. ERIC makes every effori *,* to obtain the best copy available. Nevertheless, items of marginal ** reproducibility are often encountered and this affects the quality ** of the microfiche and hardcopy reproductions ERIC makes available ** via the ERIC Document Reproduction Service (EDRS). EDRS is not* responsible for the quality of the original document. Reproductions ** supplied by EDRS are the best that can be made from the original.***********************************************************************

POSTGRADUAT1ONACTIVITIES:
ALL DEGREELEVELS IIN
PENNSYLVANIA(\s)
1975c\k, U.S. DEPARTMENT OF HEALTH.
EDUCATION & WELFARENATIONAL INSTITUTE OF
4EDUCATION
Pennsylvania Department of Education 1976
THIS DOCUMENT HAS BEEN ,REPRO-DUCED EXACTLY AS RECEIVED FROM
THE PERSON OR ORGANIZATION ORIGrN.AT1NG IT POINTS OF VIEW OR OPINIONS
STATED DO NOT NECESSARILY REPRE-
SENT OFFICIAL NATIONALINSTITUTE OF
EDUCATION POSITION OR POLICY
2

POSTGRADUATIONACTIVITIES:
ALL DEGREELEVELS IN
PENNSYLVANIA1975
Prepared byWilliam F. Donny
Research AssociateDivision of Research
Bureau of Information SystemsPennsylvania Department of Education
September 1976
3

Commonwealth of PennsylvaniaMilton J. Shapp, Governor
Department of EducationJohn C. Pittenger, Secretary
Bureau of Information SystemsSeon H. Cho, Director
Division of ResearchRobert B. Hayes, Director
Pennsylvania Department of EducationBox 911
Harrisburg, PA 17126
4

TABLE OF CONTENTS
Page No.
SUMMARY -viii
Purpose viii
Procedures viii.
'Results viii
INTRODUCTION 1
PROCEDURES 1
Objectives 1
Methodology 1
Questionnaire Response Pattern 2
Validity of the Sample 3
Types and Location of Tables 3
Employment Statua,Means, Relatedness Means 3
RESULTS 5
Employment Status for Bachelor's Degree Graduates 5
Employment Status for Master's Degree Graduates 7
Employment Status for Doctor's Degree Recipients 11
Employment Status for First-Professional Degree Graduates 11
Employment Status for Associate Degree Graduates 15
Classification of Major Disciplines by Relative Standing 18
DISCUSSION 20
APPENDICES 26

LIST OF TABLES
Table No. Page No.
1
2
Employment Status by Major Field for BaccalaureateDegree Recipients for All Institutions in Pennsyl-vania, 1975
A Comparison of Employment Status and RelatednessMeans for Baccalaureate Graduates From All Cate-gories of Institutions in Pennsylvania, 1974 and1975
3 Percentage of Out-Migration of Employed.Bachelor's
Degree Graduates According to Major Discipline
4 Employment Status by Major-Discipline for Master'sDegree Recipients for All Institutions in Pennsyl-vania, 1975
5 Employment Status Means and Relatedness Means byMajor Discipline for Master's Degree Graduates inPennsylvania, 1975
6 Percentage of Out-Migration of Employed Master's 10
Degree Graduates According to Major Discipline
4
6
8
10
7 Employment Status by Major Discipline for Doctoral 12
Degree Recipients for All Institutions in Pennsyl-vania, 1975
Employment Status Means and Relatedness Means by 13
Major Discipline for Doctor's Degree Graduates inPennsylvania, 1975
9 Percentage of Out-Migration of Employed DoctoralGraduates According to Major Discipline
10 Employment Status by Major Discipline for First-Professional Degree Recipients for All Institu-tionS in Pennsylvania, 1975
fNll Employment Status Means and Relatedness Means byMajor Discipline for the First-Professional Degree
Graduates
12 Percentage of Out-Migration of Employed First-Professional Degree Graduates According to Major
Discipline
13 Employment Status by Major Discipline for AssociateDegree Recipients for All Institutions in Pennsyl-
vania, 1975
14 Employment Status Means and Relatedness Means byMajor Discipline for Associate Degree Graduates in
Pennsylvania, 1975
iv
6
13
14
15
15
16
17

LIST OF TABLES(continued)
Table No. Page No.
14a Percentage of Out-Migration of Employed Associate 17Degree Graduates According to Major Discipline
15 Classification of Major Disciplines by Relative 19Standing (Ranking) in Employment Status, Employ-ment Relatedness and Proportion of Those Contin-uing Graduate or Post-Doctoral Studies
16 Employment Status by Degree Level and Institutional 22
Sector
17.0 Number of Returns Received from Four Degree Levels 27of Graduates Compared With the Number of Graduatet-for Institutions Cooperating in the Study by MajorDiscipline, 1975
17.1 Number of Returns Received from Four-Degree Levelsof Graduates Compared With the Number of Graduatesfor All Institutions by Major Discipline, 1975
17.2 Number of Returns Received from Graduates at FourDegree Levels as Compared With the Number ofGraduates for Cooperating Institutions Within In-stitutional Categories in Pennsylvania, 1975
17.3 Number of Returns Received from Graduates at FourDegree Levels as Compared With the Number of Grad-uates for All Institutions Within InstitutionalCategories in Pennsylvania, 1975
17.4 Number of Returns Received for Associate DegreeGraduates Compared With the Number of Graduates forCooperating Institutions and All Institutions byMajor Discipline, 1975
28
29
17.5 Number of Returns Received for Associate Degree Grad-uates Compared With the Number of Graduates forCooperating Institutions and All Institutions byInstitutional Category, 1975
18.0 Employment Status by Major Discipline forBaccalaureate Degree Recipients for State-OwnedInstitutions in Pennsylvania, 1975
18.1 Employment Status by Major Discipline forBaccalaureate.Degree Recipients for State-RelatedInstitutions in Pennsylvania, 1975
18.2 Employment Status by Major Discipline forBaccalaureate Degree Recipients for State-AidedInstitutions in Pennsylvania, 1975
7
30
30
31
32
33

LIST OF TABLES(continued)
Table No. Page No.
18.3 Employment Status by Major Discipline for Bacca-laureate Degree Recipients for Private Institu-tions in Pennsylvania, 1975
19.0 Employment Status by Major Discipline for Master'sDegree Recipients for State-Owned Institutions inPennsylvania, 1975
19.1 Employment Status by Major Discipline for Master'sDegree Recipients for State-Related Institutions inPennsylvania, 1975
19.2 Employment Status by Major Discipline for Master'sDegree Recipients for State-Aided Institutions inPennsylvania, 1975
19.3 Employment Status by Major Disciipline for Master'sDegree Recipients for Private Institutions inPennsylvania, 1975
20.0 Employment Status by Major Discipline and Institu-tional Sector for Doctoral Degree Recipients inPennsylvania, 1975
21.0 Employment Status by Major Discipline for AssociateDegree Recipients for Community Colleges inPennsylvania, 1975
21.1 .Employment Status by Major Discipline for AssociateDegree Recipients for Proprietary Institutions inPennsylvania, 1975
21.2 Employment Status by Major Discipline for AssociateDegree Recipients for Four-Year Colleges andUniversities
22.0 Employment Status by Degree Field for BaccalaureateDegree Recipients for All Institutions in Pennsylvania,1975
22.1 Employment Status by Degree Field for BaccalaureateDegree Recipients for State-Owned Institutions inPennsylvania, 1975
22.2 Employment Status by Degree Field for BaccalaureateDegree Recipients for State-Related Institutions inPennsylvania, 1975
22.3 Employment Status by Degree Field for BaccalaureateDegree Recipients for State-Aided Institutions inPennsylvania, 1975
vi
34
35
36
37
38
39
40
41
42
43
48
51
54
LIST OF TABLES(continued)
Table No. Page No.
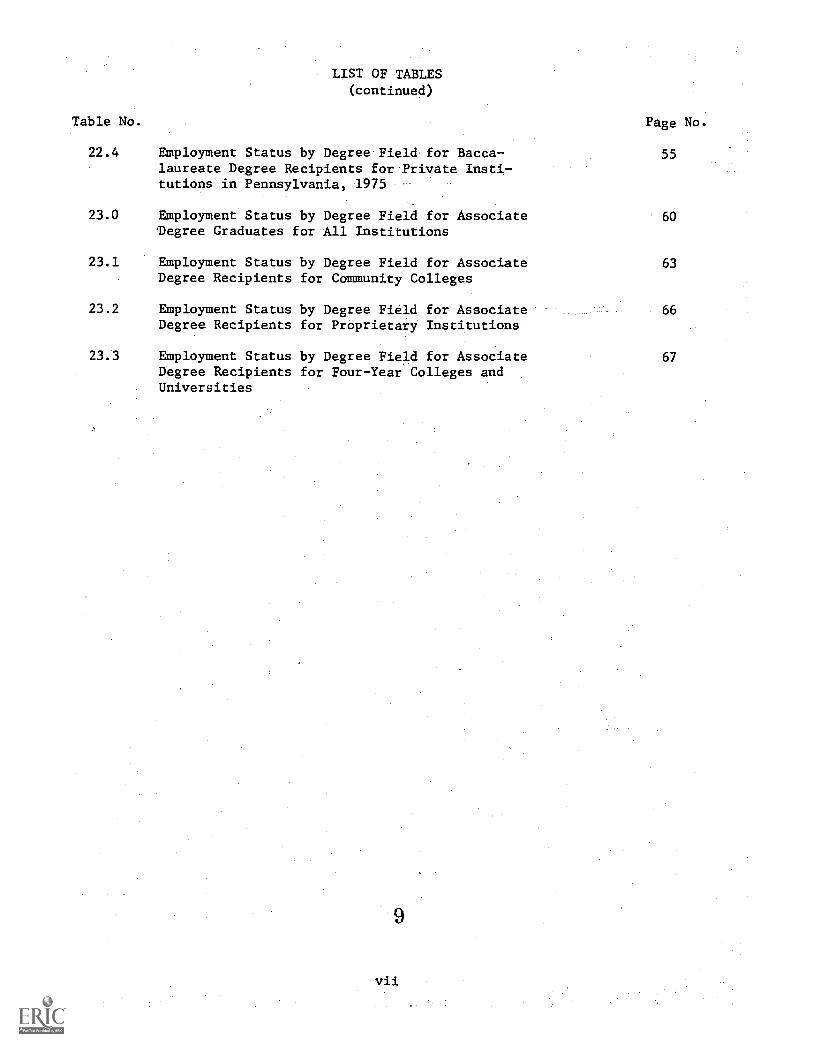
22.4 Employment Status by Degree Field for Bacca-laureate Degree Recipients for Private Insti-tutions in Pennsylvania, 1975
55
23.0 Employment Status by Degree Field for Associate 60Degree Graduates for All Institutions
23.1 Employment Status by Degree Field for Associate 63Degree Recipients for Community Colleges
23.2 Employment Status by Degree Field for Associate 66Degree Recipients for Proprietary Institutions
23.3 Employment Status by Degree Field for Associate 67Degree Recipients for Four-Year Colleges andUniversities
vii

SUMMARY
Purpose
, -This study, examining the employment status of graduates of all higher edu-
cation degree levels in Pennsylvania in 1975, seeks to answer such questions as:
...How many graduates were employed? Unemployed?Pursuing advanced degrees?
...Of those employed, how many held jobs outsidePennsylvania?
...How many graduates held jobs for which they hadprepared?
...What was the relative degree of employment successfor graduates of each major discipline?
...What were the differences in postgraduation acti-vities according to the type of institution?
' Procedures
Cooperation by appropriate officials of 117 higher education institutionsproduced usable data for 36,026 graduates of all degree levels. ibese graduatesrepresented 40 per cent of all higher education graduates in Pennsylvania in 1975and 66 per cent of the graduates of the institutions cooperating in 'the study.
Results
Some findings related to the above questions are as follows:
DegreeLevel
Percentage of Graduates Of Those Employed
EmployedNot
Employed
PursuingAdvancedDegree
PercentageOutside
Pa.
PercentageEmployed in
Field Prepared
Associate 61.8 8.2 30.0 9.9 86.9Bachelor's 61.0 23.8 15.2 24.6 73.6Master's 85.3 6.6 8.1 20.7 87.6Doctor's 92.2 5.8 2.0 48.3 91.9First Professional 94.3 3.8 1.9 41.4 95.3
As to the degree of employment success, the results of the study indicate arelatively strong demand for bachelor's degree graduates in agriculture and naturalresources, engineering, architecture, communications, health professions, theologyand computer and information sciences.
A weaker job market faced-bachelor's degree graduates of such major disci-plines as social studies, education, fine and applied arts, psychology and inter-disciplinary studies. Associate degree graduates had a considerably higher per centpursuing an advanced degree and a much lower proportion unemployed than baccalaureatedegree graduates.
At the more advanced degree levels the employment picture was increasinglyfavorable.
10
viii

INTRODUCTION
This report, reflecting postgraduation activities of college graduates inPennsylvania in 1975, is the third in a series; .the previous two presented informa-tion about only baccalaureate degree recipients in Pennsylvania for 1972 and 1974.Authorized by the Office of Higher Education., Pennsylvania Department of Education,this research is designed to supply information to students, counselors, placementdirectors, educational planners and other decision makers.
The extent to which higher education should be occupationally oriented hasbeen a topic of considerable interest in recent years. While the report does not
attempt to say what the relationship between higher education and postgraduationoccupations should be, it does clarify what many of these relationships actually areby indicating the demand for and supply of graduates in various fields of study andat various levels of degrees.
PROCEDURE§
Objectives
Answers to these questions were sought: What proportion of graduates for
each degree field and degree level was (1) employed in their field of preparation,
(2) employed in another field, (3) employed outside Pennsylvania, (4) unemployed,or (5) pursuing advanced degrees? What is the employment status (employment overunemployment) of graduates for each field of study and degree level? What differ-
ences are there in these postgraduation activities by institutional type, such as
state-owned, state-related, private state-aided and private?
Methodology
Those graduated between December 1974 and August 1975 from all higher educa-
tion degree programs in Pennsylvania were the target population of this study. Data
collection instruments were sent in the early summer of 1975 to the appropriate
contact person on each campus who had been previously certified by the institution's
president to cooperate in this study. The information was collected from institutions
rather than from individual graduates, as in 1974, and the survey items were reduced
from 18 to six to lessen the workload for all concerned.,
By the December 1975 due date, institutional contact officers, upally career
services directors, from 117 institutions had returned to Harrisburg completed forms
containing information on 36,026 graduates at all degree levels. These graduates
represented 40 per cent of the 90,153 higher education graduates in Pennsylvania for
the 1974-75 academic year, and 66 per cent of the 54,902 graduates of the institutions
that cooperated in the study.
Eighty per cent of Pennsylvania's higher education institutions cooperated by
supplying postgraduation information at one or more degree levels. The reason given
by institutions, both large and small, for not cooperating in the study was a lack
of time, money, personnel or priorities. However, that other institutions are finding
the past results useful is shown by their current keen interest in acquiring and using
this type of information.'"
The survey instrument was designed in the Division of Research, PennsylvaniaDepartment of Education, to collect information to meet the objectives of the study,
11

i.e., to discover the rate, location and relatedness of employment and the proportionof graduates pursuing advanced degrees. The contact person at each institution wasresponsible for deciding whether graduates were employed in their fields of prepara-tion.
The period of time allotted for collecting this information from the insti-tutions and their graduates ranged from their graduation dates to as much as sixmonths later, according to the follow-up procedures established at each institution.Thus, the findings reflect employment status relatively soon after graduation.
Questionnaire Response Pattern
Two sets of detailed summaries of graduates' response patterns by majordiscipline and institutional categories are provided for each degree level in theappendix. One set (Tables 17.0 and 17.2) gives the proportion of respondents onthe basis of total'number of graduates at cooperating institutions. The other set(Tables 17.1 and 17.3) gives the proportion of respondents based on the total numberof graduates in all Pennsylvania institutions. Similar response data for associatedegree graduates are found in Tables 17.4 and 17.5 in the appendix. The proportionsshown are somewhat lower in the tables where all graduates in Pennsylvania were con-sidered, due to nonparticipation in the study by some institutions.
A comparison of the overall response pattern data for baccalaureate degreegraduates for 1974 and 1975 follows:
A Comparison of Responses Based on Graduatesof CoOperating Baccalaureate Institutions
Number ofCooperating
Year of BaccalaureateStudy Institutions
Number ofGraduates atCooperating
Institutions
Number ofUsableReturns Per Cent
1974 86 54,228 25,176 46.41975 71 34,054 22,619 66.4
A Comparison of Responses Based on Graduatesof All Baccalaureate Institutions
Number of Number ofAll Graduates
Year of Baccalaureate At AllStudy Institutions Institutions
Number ofUsableReturns Per Cent
1974 102 57,275 25,176 44.0
1975 105 55,689 22,619 40.6
In the above comparisons of the sample populations, the slightly lowernumber of institutions cooperating in the 1975 study at the baccalaureate level re-flects the new survey technique adopted in 1975; this technique required moreclerical assistance at each cooperating institution, causing, perhaps, some decreasein returns, especially from the larger institutions.
12

Validity of the Sample
While no follow-up of nonrespondents was made this year to assess the adequacyof the sampling, this was done in two previous studies. In those studies no signi-ficant differences between respondents' and nonrespondents' postgraduation employmentactivities were found.
Types and Location of Tables
The chief results for this study are in the five basic "employment status"tables in the body of the text; supplementary employment status and degree fieldtables are in the appendix. The tables in the text are organized so that post-graduation data for all responding baccalaureate degree recipients appear in thefirst employment status table; data from all master's level graduates appear in thesecond employment status table, followed by similar tables for the doctoral, firstprofessional and associate degree graduates.
Tables in the appendix supplement those in the text. For instance, the 18.0series of employment status tables in the appendix breaks down the baccalaureatedata not only by major discipline but also by such institutional categories as state-owned, state-related, state-aided and private. Similarly arranged series of employ-ment status tables in the appendix supplement those in the text for the master's(19.0), doctor's (20.0) and associate degree recipients (21.0).
The da', in all the tables mentioned above are given by total numbers andpercentage of graduates for each major discipline. However, two final sets of tables(22.0 and 23.0) in the appendix give more detailed supplementary employment statusresults by the number of baccalaureate and associate graduates in each of the degreefields, which are subcategories of the major disciplines. These two sets of degree-field tables summarize the information in the form in which it was received, includ-ing the "all others" category. In most instances, the "all others"-category repre-sents the difference between the number of respondents and the total number ofgraduates. Since the respondents apparently often obtained the "all others" figurein this way, it was considered as not meaningful and was deleted in all tables otherthan the last two degree-field tables in the appendix.
Table 1 illustrates the basic table format in this report. It shows how
22,619 baccalaureate graduates in 23 major disciplines responded to six employmentoptions confronting them upon graduation. These options were selected as crucialpostgraduation employment indicators; the major disciplines are the widely usedstandard categories of the Higher Education General Information Survey (REGIS) system.
Table 1 indicates that of the 22,619 baccalaureate graduates, 61.0 per centwere employed, 23.8 per cent not employed at the time of the survey and 15.2 per
cent pursuing advanced degrees. These outcomes may be compared with the 1974 surveyresults, which showed 64.4 per cent of baccalaureate graduates were in full-timeemployment, 10.1 per cent employed part time, 15.1 per cent seeking employment and10.2 pursuing advanced degrees. (The 1974 data were recalculated to conform to the1975 research design by deleting the relatively low proportion of 1974 graduates inthe categories of "military service" and "not seeking employment.")
Employment Status MeansRelatedness Means
As a way to facilitate comparison with the 1974 postbaccalaureate study, aweighted mean was used once again to rank the degree of graduates' employment aswell as the degree to which their employment is related to their major discipline..
This was done by assigning a.weight of "3" to.those in full employment, which is thetotal of the "employed in field prepared" and "employed in other field" columns of
3
13

Table 1
Employment Status by Major Field for Baccalaureate Degree Recipients forAll Institutions ln Pennsylvania 1925
Employed in Employed inField Prepared Other Field Pursuing
Total In Outsido In Outside AdvancedMajor Discipline Reported Pa. Pa. Pa. Pa. Degree Unemployed
Agriculture and Natural 143 62 11 14 5 16 15Resources (43.3) (21.7) (9.8) (3.5) (11.2) (10.5)
Architecture and Fnviron- 63 20 13 A 2 15 9mental Design (31.7) (20.6) (6.3) (3.2) (23.8) (14.3)
Area Studies 30 3 1 2 5 13 6(10.0) (3.3) (6.7) (16.7) (43.3) (20.0)
Biological Scionces 952 189 70 71 44 395 183(19.8) (7.4) (7.5) (4.6) (41.5) (19.2)
Business and 2.836 1,325 396 236 55 222 60294nagement (46.7) (14.0) (8.3) (1.9) (7.8) (21.2)
Communications 267 80 49 70 16 16 36
(30.0) (18.3) (26.2) (6.0) (6.0) (13.5)
Computer and Informa- 48 19 2 5 16tion Sciences (53.3) (21.1) (2.2) (5.6) (17.8)
Education 8,809 3,408 941 1.093 163 544 2,660(38.7) (10.7) (12.4) (1.9) (6.1) (30.2)
Engineering 777 305 249 9 13 120 81
(39.3) (32.0) (1.2) (1.7) (15.4) (10.4)
Fine and Applied Arts 732 175 101 98 37 114 207(23.9) (13.8) (13.4) (5.0) (15.6) (28.3)
Foreign Languages 379 61 33 77 32 95 81(16.1) (8.7) (20.3) (8.4) (25.1) (21.4)
Health Professions 859 474 131 20 4 123 107(55.2) (15.2) (2.3) (0.5) (14.3) (12.5)
Home Economics 181 75 22 19 11 20 34(41.4) (12.2) (10.6) (6.1) (11.0) (18.8)
Law 49 5 1 42 1
(10.2) (2.0) (85.7) (2.0)
Letters 983 171 74 266 187(17.4) (7.5) (200.;) (8!T) (27.1) (19.0)
Library Science 101 36 17 19 1 7 21
(35.6) (16.8) (18.8) (1.0) (6.9) (20.8)
Mathematics 486 157 60 56 28 105 80(32.3) (12.3) (11.5) (5.8) (21.6) (16.5)
Physical Sciences 547 103 67 35 22 266 54(18.8) (12.2) (6.4) (4.0) (48.6) (9.9)
Psychology 1,114 239 63 189 45 299 279(21.5). (5.7) (17.0) (4.0) (26.8) (25.0)
public Affairs and 353 130 39 51 7 33 93
Services (36.8) (11.0) (14.4) (2.0) (9.3) (26.3)
Social Sciences 2,416 409 153 488 215 595 556
(16.9) (6.3) (20.2) (8.9) (24.6) (23.0)
Theology 195 46 42 16 9 77 5
(23.6) (21.5) (8.2) (4.6) (39.5) (2.6)
Interdisciplinary 257 51 11 48 16 58 73
Studies (19.8) (4.3) (18.7) (6.2) (22.6) (28.4)
GRAND TOTAL 22.619 7,572 2,582 2,822 811 3.446 5,386(33.5) (11.4) (12.5) (3.6) (15.2) (23.8)
14
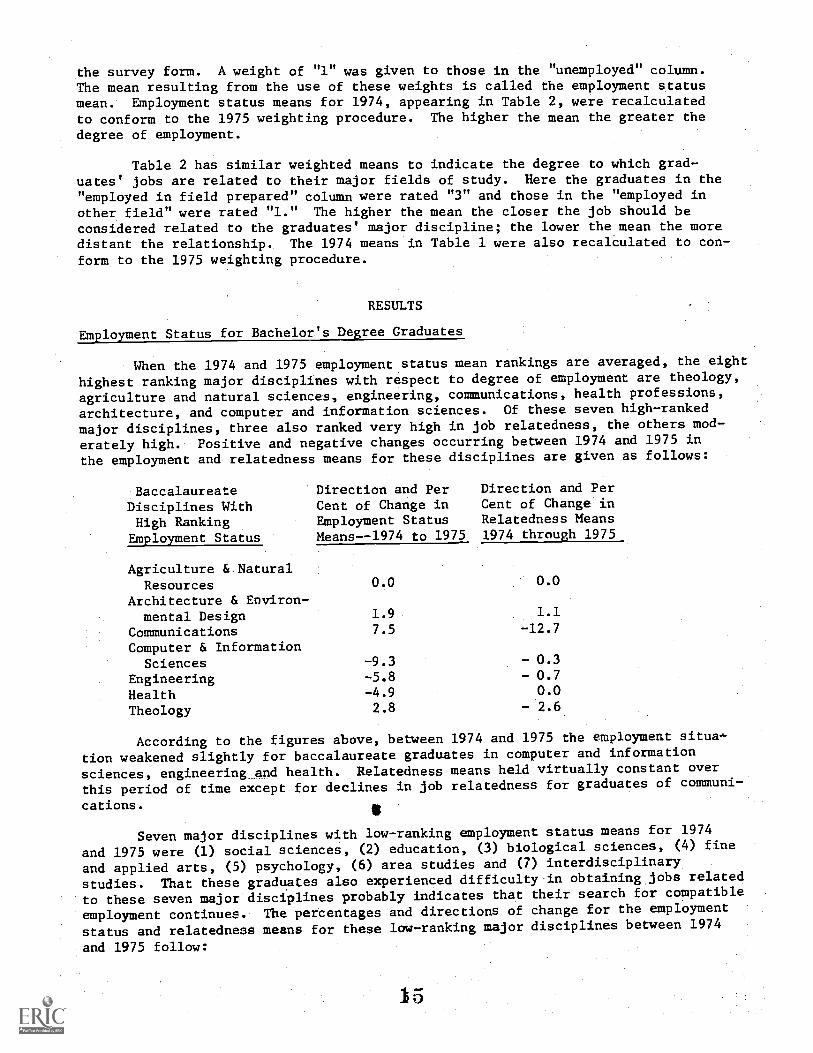
the survey form. A weight of "1" was given to those in the "unemployed" column.The mean resulting from the use of these weights is called the employment statusmean. Employment status means for 1974, appearing in Table 2, were recalculatedto conform to the 1975 weighting procedure. The higher the mean the greater the
degree of employment.
Table 2 has similar weighted means to indicate the degree to which grad-uates' jobs are related to their major fields of study. Here the graduates in the"employed in field prepared" column were rated "3" and those in the "employed inother field" were rated "1." The higher the mean the closer the job should beconsidered related to the graduates' major discipline; the lower the mean the moredistant the relationship. The 1974 means in Table 1 were also recalculated to con-form to the 1975 weighting procedure.
RESULTS
Employment Status for Bachelor's Degree Graduates
When the 1974 and 1975 employment status mean rankings are averaged, the eight
highest ranking major disciplines with respect to degree of employment are theology,
agriculture and natural sciences, engineering, communications, health professions,
architecture, and computer and information sciences. Of these seven high-ranked
major disciplines, three also ranked very high in job relatedness, the others mod-
erately high. Positive and negative changes occurring between 1974 and 1975 in
the employment and relatedness means for these disciplines are given as follows:
BaccalaureateDisciplines WithHigh RankingEmployment Status
Direction and PerCent of Change inEmployment StatusMeans--1974 to 1975
Direction and PerCent of Change inRelatedness Means1974 through 1975
Agriculture & NaturalResources 0.0 0.0
Architecture & Environ-mental Design 1.9 1.1
Communications 7.5 -12.7
Computer & InformationSciences -9.3 - 0.3
Engineering -5.8 - 0.7
Health -4.9 0.0
Theology 2.8 - 2.6
According to the figures above, between 1974 and 1975 the employment situa--
tion weakened slightly for baccalaureate graduates in computer and information
sciences, engineering and health. Relatedness means held virtually constant over
this period of time except for declines in job relatedness for graduates of communi-
cations.
Seven major disciplines with low-ranking employment status means for 1974
and 1975 were (1) social sciences, (2) education, (3) biological sciences, (4) fine
and applied arts, (5) psychology, (6) area studies and (7) interdisciplinary
studies. That these graduates also experienced difficulty in obtaining jobs related
to these seven major disciplines probably indicates that their search for compatible
employment continues. The percentages and directions of change for the employment
status and relatedness means for these low-ranking major disciplines between 1974
and 1975 follow:
15
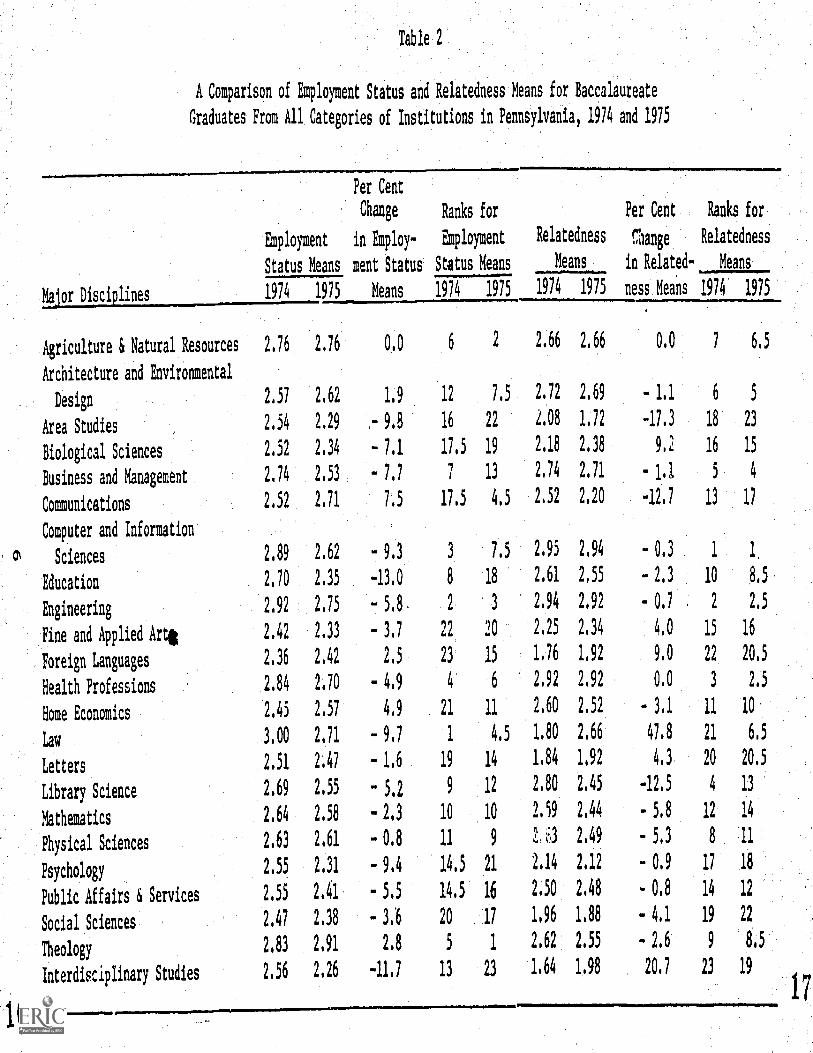
Table 2
A Comparison of Employment Status and Relatedness Means for Baccalaureate
Graduates Prom All Categories of Institutions in Pennsylvania, 1974 and 1975
16
Major Disciplines
Agriculture & Natural Resources
Architecture and Environmental
Design
Area Studies
Biological Sciences
Business and Management
Communications
Computer and Information
Sciences
Education
Engineering
Fine and Applied Arts
Foreign 'Languages
Health Professions
Home Economics
Law
Letters
Library Science
Mathematics
Physical Sciences
Psychology
Public Affairs & Services
Social Sciences
Theology
Interdisciplinary Studies
Per Cent
Change Ranks for
Relatedness
Means
1974 1975
2.76 2.76 0.0 6 2 2,66 2.66 0.0 7 6.5
Employment in 'Employ- Employment
Status Means ment Status Status Means
1974 1975 Means 1974 '1975
Per Cent Ranks for
nange, Relatedness
in Related- Means
ness Means 1974 1975
2,57 2.62 1,9 12 7.5 2.72 2.69 - 1.1 6 5
2.54 2.29 ,- 9.8 16 22 2,08 1.72 -17.3 18 23
2.52 2.34 - 7.1 17.5 19 2.18 2.38 9.2 16 15
2,74 2.53 - 7,7 7 13 2.74 2.71 - 1.1 5 4
2.52 2.71 7.5 17.5 4.5 2.52 2.20 -12.7 13 17
2.89 2.62 - 9.3 3 7,5 2.95 2.94 - 0.3 1 1
2.70 2,35 -13.0 8 18 2.61 2.55 - 2.3 10 8.5
2.92 2.75 - 5.8 2 3 2.94 2.92 - 0.7 2 2.5
2.42 2.33 - 3,7 22 20 2.25 2.34 4.0 15 16
2.36 2.42 2.5 23 15 1,76 1.92 9.0 22 20.5
2.84 2,70 - 4.9 4 6 2.92 2.92 0,0 3 2,5
2,45 2,57 4,9 21 11 2.60 2.52 - 3.1 11 10
3,00 2.71 - 9.7 1 4.5 1.80 2.66 47.8 21 6.5
2.51 2.47 - 1,6 19 14 1.84 1,92 4.3 20 20.5
2,69 2.55 - 5,2 9 12 2.80 2.45 -12.5 4 13
2.64 2.58 - 2.3 10 10 2.59 2.44 - 5.8 12 14
2.63 2.61 - 0.8 11 9 1 ;1 2.49 - 5 3 8 11
2.55 2.31 - 9.4 14.5 21 2.14 2.12 - 0.9 17 18
2.55 2.41 - 5.5 14.5 16 2.50 2.48 - 0.8 14 12
2,47 2.38 - 3,6 20 17 1.96 1.88 - 4 1 19 22
2.83 2 91 2.8 5 1 2.62 2.55 - 2.6 9 8 5
2.56 2,26 -11.7 13 23 1.64 1 98 20,7 23 19

BaccalaureateDisciplines WithLow RankingEmployment Status
Area StudiesBiological SciencesEducationFine and Applied ArtsInterdisciplinary StudiesPsychologySocial Studies
Direction and PerCent of Change inEmployment StatusMeans--1974-1975
9.8- 7.1-13.0- 3.7-11.7- 9.4- 3.6
Direction and PerCent of Change inRelatedness Means
1974-1975
- 17.3
9.2- 2.3
4.020.7
- 0.9- 4.1
The above list shows that the degree of employment declined between 1974 and1975 in all seven of the low-ranking major disciplines. There were similar declinesin job relatedness for graduates in four of the major disciplines; however, jobrelatedness improved for graduates in biological sciences, fine and applied arts,and interdisciplinary studies.
Considerable analysis might well be made to identify the variables which hinderor help baccalaureate graduates make successful transitions from their education inthese seven disciplines to worthy employment in occupations related to these fieldsof study. Unfortunately, the data now available do not permit such an analysis.
Table 3 compares the proportions of baccalaureate graduates who were employedoutside Pennsylvania in 1974 and 1975. The seven "high employment" disciplinesmentioned above also appear in Table 3 among the disciplines with moderate to highproportions of graduates employed in other states. However, Table 3 indicatesreductions in the proportion of graduates employed outside Pennsylvania between 1974and 1975 for the disciplines of agriculture, architecture, health and computer andinformation sciences. Disciplines showing increasing proportions of graduatesemployed outside Pennsylvania over this period were communications, engineering andtheology. These out-migration rates should enable manpower studies to define thesupply to Pennsylvania more accurately. The supply of teachers to Pennsylvania in1975, for example, was 16,508, of whom about 14,000 remained in the state.
Employment Status for Master's Degree Graduates
The employment status of 2,823 master's degree graduates, classed under 21major disciplines, appears in Table 4, which shows 85.3 per cent employed, 6.6 un-employed and 8.1 pursuing advanced degrees. Comparable baccalaureate employmentstatus results (see Table 1) are 61.0 per cent employed, 23.8 per cent unemployedand 15.2 per cent seeking advanced degrees. Employment status of master's degreegraduates is significantly better than that of baccalaureate degree graduates.
The reader should use care in generalizing from Table 5, where employmentstatus means and relatedness means are ranked, due to the relatively small number ofgraduates in some major disciplines. This is especially true of the seven highest-ranked major disciplines according to employment status, since there were very fewsuch graduates represented in Table 5. Six of seven of these apparently high-rankingdisciplines are accompanied by relatedness means which rank, by contrast, very low,suggesting a possible struggle for employment by graduates in these disciplines.
Graduates in physical sciences and mathematics are seen in Table 5 as havingrather low employment status means coupled with high relatedness means. This canbe taken as an indication that these graduates tend to hold out for employment re-lated to their fields of study. Graduates of psychology and fine and applied arts
7
18

Table 3
Percentage of Out-Migration of Employed Bachelor'sDegree Graduates According to Major Discipline
Major Discipline
Per Cent EmployedOutside Pennsylvania
Per Cent of Changefor Those Employed
Outside Pennsylvania1974 1975
Law - 16.7Education 19.3 19.7 2.1Public Affairs and Services 19.5 20.3 4.1Interdisciplinary Studies 22.6 21.4 - 5.3Home Economics 22.7 26.0 14.5Communications 22.8 30.2 32.5Business and Management 24.1 22.4 - 7.1Library Science 24.9 24.7 - 0.8'Psychology 27.1 20.1 -25.8Biological Sciences 28.3 30.5 7.8Health Professions 29.4 21.5 .26.9Social Sciences 29.6 29.1 - 1.7Mathematics 31.6 29.2 - 7.6Letters 31.9 29.1 - 8.8Fine and Applied Arts 34.1 33.6 - 1.5FOreign Languages 34.5 32.0 - 7.2Computer and Information Sciences 37.0 27.5 -25.7Engineering 39.5 45.5 15.2Physical Sciences 39.7 39.2 1.3Area Studies 40.0 54.5 36.3Architecture & Environmental Design 41.9 38.5 - 8.1Agriculture & Natural Resources 42.4 32.1 -24.3Theology 43.6 45.1 3.4
19
8

Table 4
Employment Statua by Major Discipline for Master's Degree Recipients forAll Institutions in Pennsylvania, 1975
Maior Discipline
Agriculture and NaturalResources
Architecture and Environ-mental Design
Area Studies
Biological Sciences
Business andManagement
Communications
Computer and Informa-tion Sciences
Eduction
Engineering
Fine and Applied Arts
Foreign Languages
Health Professions
Hume Economics
Law
Letters
Library Science
Mathematics
Physical Sciences
Psychology
Public Affairs andServices
Social Sciences
Theology.
InterdisciplinaryStudies
GRAND TOTAL
Employed in Employed inField Prepared Other Field Pursuing
Total In Outside In Outside AdvancedReported Pa. Pa. Pa. Pa. Degree Unemployed
1 1
(100.0)
3 1 1 1
(33.3) (33.3) (33.3)
45 21 4 5
(46.7) (8.9) (11.1)11
(24.4)4
(8.9)
288 139 96 11 7 12 23(48.3) (33.3) (3.0) (2.4) (4.2) (8.0)
38 25 6
(65.8) (15.8)
1 3 3(2.6) (7.9) (7.9)
8 3 3 1 1
(37.5) (37.5) (12.5) (12.5)
1,856 1,254 213 170 27 77 115(67.6) (11.5) (9.1) (1.5) (4.1) (6.2)
90 26 27 28 9(28.9) (30.0) (31.1) (10.0)
54 23 11 4 3 5 8(42.6) (20.3) (7.4) (5.6) (9.3) (14.8)
9 7 1 1
(77.8) (11.1) (11.1)
49 21 19
(42.9) (38.8)
1 1
(100.0)
1
(2.0)
76 36 7 9 4(47.4) (9.2) (11.8) (5.3)
3 5
(6.1) (10.2)
18 2
(23.7) (2.6)
22 16 3 3 -(72.7) (13.6) (13.6)
30 10 3 14 3
(33.3) (10.0) (46.7) (10.0)
50 15 9 1 21 4
(30.0) (18.0) (2.0) (42.0) (8.0)
71 22 2 11 5 24 7
(31.0) (2.8) (15.5) (7.0) (33.8) (9.9)
69 22 35 5 2 2 3
(31.9) (50.7) (7.2) (2.9) (2.9) (4.3)
118 60 12 26 5 11 4
(50.8) (10.2) (22.0) (4.2) (9.3) (3.4)
10 4 3 1 2
(40.0) (30.0) (10.0) (20.0)
5 3 1 1 -(60.0) (20.0) (20.0)
2,893 1,708 455 250 56 234 190(59.0) (15.7) (8.6) (1.9) (8.1) (6.6)
2 0

Table,5,
Employiment Status Means and Relatednes6 Means by MajorDiscipline for MeSter's Degree Graduates in Pennsylvania,. 1975
Major Discipline
EmploymentStatusMean
Relatedness:Status
Mean
EmploymentStatusRank
RelatednessRank
Area Studies 3.00 2.00 4 20Computer and Information
Sciences 3.00 2.71 4 12Interdisciplinary Studies 3.00 2.60 4 15Law 3.00 3.00 4 2
Library Science 3.00 2.73 4 11Theology 3.00 2.75 4 10Foreign Languages 3.00 2.56 4 16Letters 2.93 2.54 8.5 17Social Sciences 2.93 2.40 8.5 18Public Affairs 2.90 2.78 10 8Education 2.87 2.76 11 9
Communications 2.83 2.94 12.5 5
Business & Management 2.83 2.86 12.5 7
Health Professions 2.78 2.95 14 4Biological Sciences 2.76 2.67 15 13Physical Sciences 2.72 2.92 16 6
Engineering 2.71 3.00 17 2
Psychology 2.70 2.20 18 19Fine and Applied Arts 2.67 2.66 19 14Mathematics 2.63 3.00 20 2
Table 6
Percentage of Out-Migration of EmployedMaster's Degree Graduates According to Major Discipline
Major DisciplinePer Cent Employed
Outside Pa.Rank
Law 00.0 1
Foreign Language 11.1 2
Biological Science 13.3 3
Library Science 13.6 4
Education 14.4 5
Social Sciences 16.5 6
Psychology 17.5 7
Communications 18.8 8
Letters 19.6 9
Interdisciplinary Studies 20.0 10
Mathematics 23.1 11Fine & Applied Arts 34.1 12
Theology 37.5 13Physical Sciences 40.0 14Business & Management 40.7 15
Computer and Information Sciences 42.9 16
Health Professions 46.3 17
Engineering 50.9 18
Public Affairs and Services 57.8 19
Area Studies 100.0 20
21-10

are doub,l.y disadvantaged, since they have a moderately low-degree of employmentand low'job relatedness.
Table 6 lists in rank order the proportion of responding master's degreegraduates employed outside Pennsylvania in 1975. When this table is related to theprevious one ranking employment status,there appears to be no discernible relation-ship between the two tables.
Employment Status for Doctor's Degree Recipients
The employment status outcomes given in Table 7 for 256 doctoral degreerecipients for 12 major disciplines show 92.2 per cent of the respondents wereemployed, 5.9 per cent were unemployed and 5.0 per cent were pursuing advanceddegrees during the 1975 survey. Comparable figures for master's degree recipients-were 85.3 per cent employed, 6.6 per cent unemployed and 8.1 per cent pursuingadvanced degrees. This is another indication of the rising employment status anddecreasing pursuit of advanced degrees for graduates at each succeedingly higher.degree level.
For the major disciplines in Table 8, there i8 a rather high correspondencebetween the employment status means and the relatedness means. Thus, at thedoctoral level this relationship is even more evident than at the master's level.(Again, don't over-generalize from limited data from only 256 doctoral graduates.)
In Table 9, the percentage of out-migration for employment beyond Pennsylvaniaseems high compared with the percentages for baccalaureate and master's degree grad-uates. Part of this "migration" may simply be the return to out-of-state locationsby those who studied in Pennsylvania, but part may also be doctoral graduates respond-ing to a national market. Their increased education apparently gives them greaterjob mobility and employability.
Employment Status for First-Professional Degree Graduates
The employment status of the 2,576 first-professional degree recipients in-cluded under Table 10 is that 94.3 per cent were reported employed, 3.8 per centunemployed and 1.9 per cent pursuing advanced or specialized study. Comparable
figures for doctoral degree graduates were 92.2 per cent employed, 5.9 per centunemployed and 5.0 per cent in pursuit of advanced degrees. These comparisonsillustrate the trend that for graduates at each succeeding level above the bacca-laureate degree to have corresponding increases in the proportions of those employedand decreases in those seeking employment and pursuing advanced degrees.
Table 11 also illustrates the general trend that rising degree levels ofgraduates are accompanied by rising employment status means in association with highrelatedness means.
Finally, in Table 12 there is a similar pattern of more first-professionaldegree graduates being employed outside Pennsylvania than baccalaureate or master'sdegree recipients. In fact, the remarkable number of such professional personnelleaving Pennsylvania for work in other states may raise the question of whetherPennsylvania is profitting enough from its educational offerings. In other words,
is Pennsylvania experiencing a brain drain to states with greater prospects ofemployment?
22

Table 7
Employment Status by Major Discipline for Doctoral Degree Recipientsfor All Institutions in Pennsylvania, 1975
Maior DisciplineTotal
Reported
Employed inField Prepared
Employed inOther Field Pursuing
AdvancedDegree Unemployed
In
Pa.
OutsidePa.
In
Pa.
OutsidePa.
Agriculture and NaturalResources
Architecture and Environ-mental Design
Area Studies
Biological Sciences 7 4 1 - 2
(57.1) (14.3) (28.6)I,
Businesg and 14 3 11 -
Management (21.4) (78.6)
Communications - - -
Computer and informa- 7 2 5
tion Sciences (28.6) (71.4)
Education 105 53 36 7 7 2
(50.4) (34.3) (6.7) (6.7) (1.9)
Engineering 33 11 16 6
(33.3) (48.5) (18.:)
Fine and Applied Arts
Foreign Languages 1 1
(100.0)
Health Professions -
Home Economics
Law
,1,2,.
Letters ,
Library Science
19 13
(68.4)
3
(15.8)
_
2
(10.5)
-
-
-
1
(5.2)
Mathematics 9 2 5 - 2
(22.2) (55.6)(22.2)
Physical Sciences 27 6 15 1 1 4
(22.2) (55.6) (3.7) (3.7) (14. 8)
Psychology 23 11 8 1 2 1
(47.8) (34.8) (4.3) (8.7) (4.3)
Public Affairs and 6 4 2
Servicea (66.7) (33.3)
Social Sciences 5 2 3
(40.0) (60.0)
Theology
Interdisciplinary -
Studies
GRAND TOTAL 256 111
(43.4)
106(41.4)
11
(4.3)
8
(3.1)5
(2.0)
15
(5.9)

Table 8
Employment Status Means and Relatedness Means by MajorDiscipline for Doctor's Degree Graduates in Pennsylvania, 1975
Major Discipline
EmploymentStatusMean
Relatedness-.Status
Mean
EmploymentStatusRank
RelatednesSRank
Biological Sciences 3.00 3.00 4 4.5Business and Management 3.00 3.00 4 4.5Computer & Information
Sciences 3.00 3.00 4 4.5Foreign Languages 3.00 3.00 4 4.5Letters 3.00 2.78 4 11Public Affairs & Services 3.00 3.00 4 4.5Social Sciences 3.00 3.00 4 4.5Education 2.96 2.73 8 12Psychology 2.90 2.90 9 9Physical Sciences 2.70 2.83 10 10Engineering 2.64 3.00 11 4.5Mathematics 2.56 3.00 12 4.5
Table 9
Percentage of Out-Migration of EmployedDoctoral Graduates According to Major Discipline
Major Discipline
Per CentEmployed
Outside Pa.Rank
(Low to High)
Letters 16.7 1Biological Science --'- 20.0 2Public Affairs and Services 33.3 3Psychology 40.0 4Education 41.7 5Engineering 59.3 6Social Sciences 60.0 7Physical Sciences 69.6 8Computer and Information Sciences 71.4 9.5Mathematics 71.4 9.5Business and Management 78.6 11Foreign Languages 100.0 12
2 4
13

25
Employment Status by Major Discipline for First-Professional Degree Recipients for
All Institutions in Pennsylvania, 1975
Employed Employed in
Field Prepared Other Field, Pursuing
Total In Outside In Outside Advanced
m22jijsiTjir_Lze.arle_L_IPa..Lt, Pa. Degree Unemployment
Dentistry,(D.D.S. or 216 80 104 2 1 22 7
M.D. degree) (37.0) (48.1) ( 0.9) 0.5) (10 2) ( 3.2)
Medicine, (M.D. degree) 962 456 493 12 1
(47.4) (51.2) ( 1 2) (0)
Optometry (0.D. degree) 80 46 30 1 2 1
(57 5) (37.5) ( 1,2) ( 2 5) ( 1.2)
Osteopathic medicine 155 63 92
(D.O. degree) (40.6) (59.4)
Podiatry (Pod.D. or D.P.) 50 23 18 - 9
or podiatric medicine (46.0) (36.0) (18.0)
(D.P.M.) including chiropody
IM1
No
Law, general (LL.B. or 1,113 675 237 80 20 13 88
M. degree) (60.6) (21.3) ( 7 2) ( 1.8) ( 1.2) ( 7,9)
GRAND TOTAL 2,576 1,343 974 82 31 49
(52.1) (37.8) ( 3,2) ( 1.2) ( 1.9)
97
( 3.8)

Table 11
Employment Status Means and Relatedness Meansby Ma or Discipline for the First-Professional Degree Graduates
MajorDiscipline
EmploymentStatus
RelatednessMean
EmploymentRank
RelatednessRank
Osteopathy 3.00 3.00 1.5 1.5Podiatry 3.00 2.64 1.5 6
Medicine (M.D.) 3.00 3.00 1.5 1.5Optometry 2.97 2.97 4 2.5Dentistry 2.93 2.97 5 2.5
Law 2.84 2.80 6 5.0
Table 12
Percentage of Out-Migration of Employed First-
Professional Degree Graduates According to Major Discipline
Per CentMajor Employed
Discipline Outside Pa.Rank
(Low to High)
Law 25.4 1
Optometry 40.3 2Medicine (M.D.) 51.9 3
Podiatry 54.4 4
Dentistry 56.1 5Osteopathy 59.4 6
Employment Status for Associate Degree Graduates
Table 13 makes it possible for one to ascertain clearly the employment statusof the 7,682 recipients of the two-year associate degrees. For instance, 61.8 percent of these graduates.are reported as employed, 8.2 per cent unemployed and 30.0per cent pursuing advanced degrees. Comparable figures for baccalaureate graduatesare 61.0 per cent employed, 23.8 per cent unemployed and 15.2 per cent pursuingadvanced degrees.
It can be seen in Table 14 that the employment status mean is high for artsand sciences graduates at the associate degree level, but, as might be expected,the job relateness means for graduates in this academic area rank the lowest.This inverse relationship suggests a commendable drive toward employment on the partof these graduates, who apparently overcome any reluctance to take "unrelated" work.This table has a contrasting feature: a high ranking employment status mean and ahigh relatedness mean in the case of graduates in the health services and the para-medical technologies.
It would seem from Table 14 figures that graduates with associate degrees indata processing technologies may be confidently waiting jobs related to their fieldof study, since the table indicates a moderately low employment status mean and asomewhat higher relatedness mean for these disciplines.
15
2 7
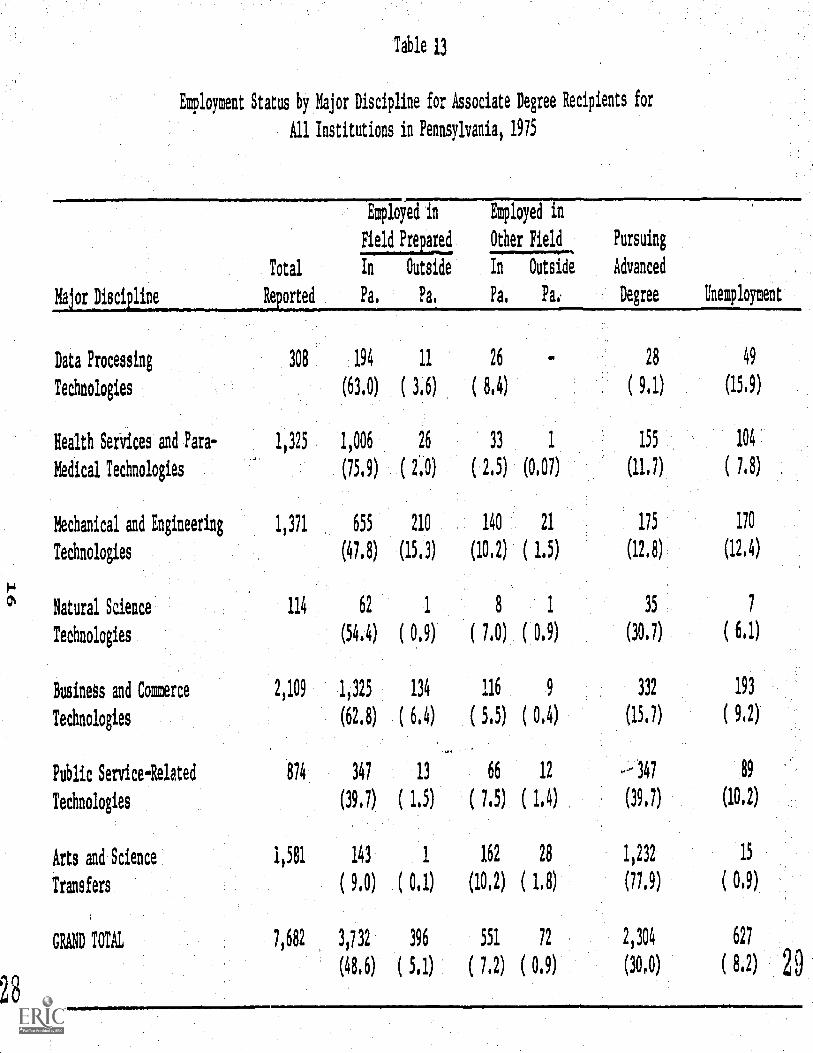
Table 13
Employment Status by Major Discipline for Associate Degree Recipients for
All Institutions in Pennsylvania, 1975
Major Discipline
Data Processing
Technologies
Health Services and Para-
Medical Technologies
Mechanical and Engineering
Technologies
Natural Science
Technologies
Business and Commerce
Technologies
Public Service-Related
Technologies
Arts and Science
Transfers
GRAND TOTAL
28
Total
Reported
1,325
1,371
114
2 109
874
1 581
7,682
Employed in Employed in
lyld Prepaled Other Field Pursuing
In Outside In Outside Advanced
Pa, Pa, Pa, Pai Degree Unemployment
308 194 11 26
(610) ( 3.6) ( 8.4)
1,006 26
(75.9) ( 2.0)
655 210
(47.8) (15.3)
ay 28 49
( 9.1)(15.9)
33 1 155 104
( 2.5) (0,07) (11.7) ( 7.8)
140 21 175 170
(10,2) ( 1.5) (12.8)
62 1 8 1 35
(12.4)
7
(54.4) ( 0.9) ( 7,0) ( 0.9) (30.7) ( 6.1)
1,325 134 116 9 332 193
(62.8) ( 6.4) ( 5.5) ( 0.4) (15.7) ( 9,2)
347 13
(39.7) ( 1.5)
66 12 347 89
( 7.5) ( 1.4) (39,7) (10.2)
143 1 162 28 1,232 15
( 8.0) ( 0.1) (10,2) ( 1,8) (77,9) ( 0.9)
3,732 396
(48,6) ( 5 1)
551 72
( 7,2) ( 0.9)
2,304 627
( 8.2) 29
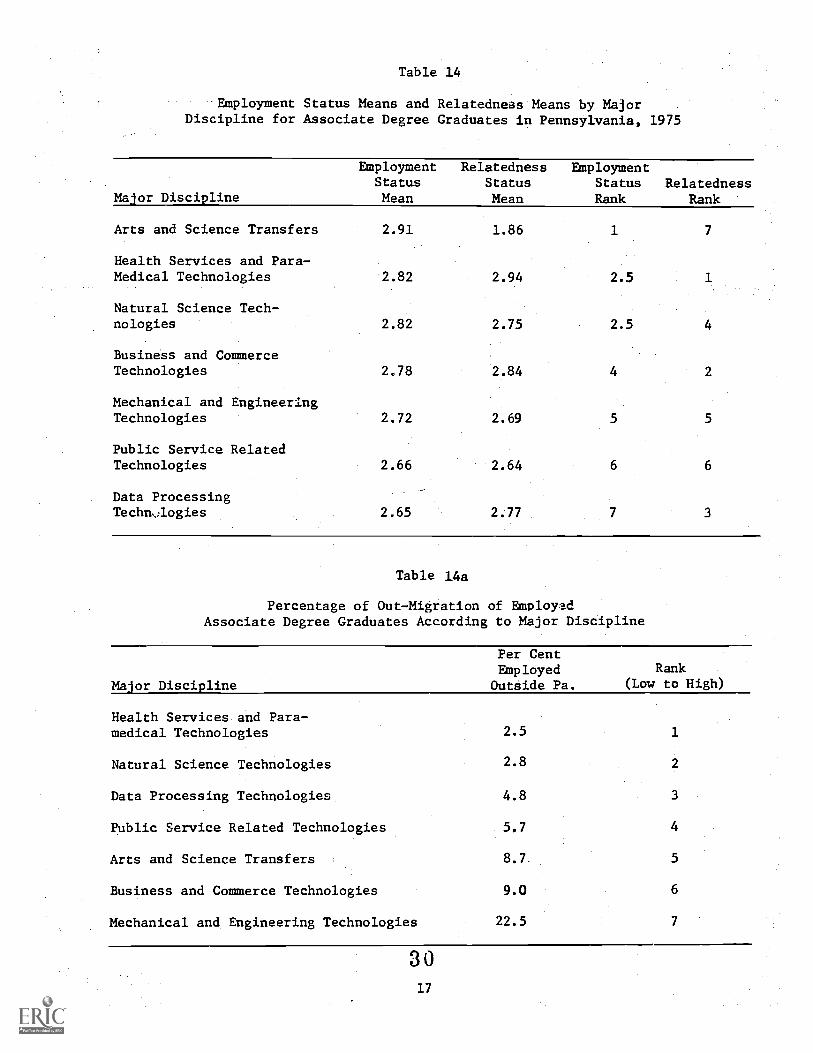
Table 14
Employment Status Means and Relatedneas Means by MajorDiscipline for Associate Degree Graduates in Pennsylvania, 1975
Major Discipline
EmploymentStatusMean
RelatednessStatusMean
EmploymentStatusRank
RelatednessRank
Arts and Science Transfers 2.91 1.86 1 7
Health Services and Para-Medical Technologies 2.82 2.94 2.5
Natural Science Tech-nologies 2.82 2.75 2.5 4
Business and CommerceTechnologies 2.78 2.84 4
Mechanical and EngineeringTechnologies 2.72 2.69 5 5
Public Service RelatedTechnologies 2.66 2.64 6 6
Data ProcessingTechn,logies 2.65 2.77 7 3
Table 14a
Percentage of Out-Migration of EmployedAssociate Degree Graduates According to Major Discipline
Major Discipline
Per CentEmployed
Outside Pa.
Rank(Low to High)
Health Services and Para-medical Technologies 2.5 1
Natural Science Technologies 2.8
Data Processing Technologies 4.8 3
Public Service Related Technologies 5.7
Arts and Science Transfers 8.7 5
Business and Commerce Technologies 9.0 6
Mechanical and Engineering Technologies 22.5 7
3 017

Tablel4a shows that associate degree graduates are less likely than otherdegree-level graduates to leave Pennsylvania for employment. Associate degreegraduates in mechanical and engineering technologies were exceptions to this rule.
Classification of Major Disciplines by Relative Standing
Table 15 attempts to summarize the data from the preceding tables in termsof whether a given discipline ranked "high" or 'low" in relation to all thedisciplines and with regard to three major variables (1) the employment statusmean, (2) the employment relatedness mean and (3) the percentage of graduates con-tinuing their education on an advanced level.
For the employment status and relatedness means, "high" is construed as ator above the median rank for the major disciplines represented for a given degreelevel, such as associate, bachelor's, master's, doctor's or first professional."Low" was construed to mean those falling below the median ranking.
It should be carefully noted, therefore, that "low" in Table 16 does notnecessarily indicate a large amount of unemployment or a great difficulty in obtain-ing employment related to the discipline in which the degree was taken. It means,
rather, that the graduates in this "low" discipline were relatively less successfulin obtaining employment, or employment related to their degree field, than thegraduates of those disciplines designated as "high." -
In the case of the percentage of graduates moving on to advanced studies(graduate school, post-doctoral work, etc.), the disciplines at or above the medianpercentage were designated as having a high tendency to go on for advanced studies,and those designated as "low," or below the median, were seen as being relativelyless likely to do so, although in a given discipline a "low" rating may reflectsubstantial advanced study.
In the case of the doctoral or first professional, any amount of post-doctoral work was categorized as "high," since the typical pattern is not of ad-vanced study (other than medical internship, etc., which was not included here).Actually, only a few disciplines had any amount of such studies at the post-doctoral
level.
The purpose of Table 15 is to alert the reader to possible patterns ortrends that may exist, or be developing, with regard to a given discipline when itis compared to other disciplines. Some caution is required in reading this table,since it must be remembered that, for example, first-professional degree graduatesin dentistry and law may not have taken their licensing or bar examinations withinthe time frame of this study, and the supposed low employment status of thesedisciplines may be, therefore, somewhat spurious.
Only a careful examination of the detailed data from the preceding tablesand a knowledge of the disciplines in question will permit one to make a usefulassessment of the patterns implicit in the data shown in Table 15.
Table 15 is composed of eight sections, each of which is based on a distinct
(or different) combination of the three variables emphasized in preceding tables:employment status means, employment relatedness means and the proportion of graduates
of each major discipline pursuing advanced study. For example, in Section I are
listed the "high related employment or advanced study" major disciplines (for each
degree level) whose graduates ranked high in the three variables mentioned. To be
more specific, graduates of the major disciplines listed in Section I enjoyed rela-
tively high levels of employment in jobs which related to their major discipline.
31.18

Table 15
Classification of Major Disciplines by Relative Standing (Ranking) in Employment Status,Employment Relatedness and Proportion of Those Continuing Graduate or Post-Doctoral Studiesa
Associate Degree Level Bachelor's Degree Level
I. High-Related Employment or Advanced Studies
Natural Science Tech.Business 6 Commerce Tech.
ArchitectureLawPhysical SciencesTheology
II. High-Related Employment,Terminal Degree
Health Services andParamedical Tech.
Master's Degree Level
Theology
First-ProfessionalDoctor's Degree Level Degree Level
Biological Sciences Medicine (M.D.)Optometry
Agriculture 6 Natural Education Business 6.Management Osteopathic MedicineResources Library Sciences Computer 6 Information
Computer 6 Informatinn Public Affairs SciencesSciences Foreign Languages
Engineering Public AffairsHealth Professions Social SciencesHome Economics
High, but Enrelated Employment or Advanced Studies
Arts and Sciences MathematicS Area Studies Lettere NoneComputer 6 Information
SciencesLettersSocial Sciences
IV. High, but Unrelated Employment--Terminal Degree
None Communications Foreign Languages Education PodiatryLibrary Science Interdisciplinary Studies
V. Low, but Highly Related Employment or Advanced Studies
None None Engineering None DentistryMathematicsPhysical Sciences
VI. Low, but Highly Relatek Employmenz--Terminal Degree
Data ProcessingTechnologies
Business 6 Management Business 6 Management EngineeringEducation Communications MathematicsPublic Affairs and Health ProfessionsSezvices
VII. Low and Unrelated Employment or Advanced Studies
Public Services RelatedTechnologies
None
Area Studies Architecture Psychology LawBiological Sciences Biological SciencesForeign Languages Fine 6 Applied ArtsLetters PsychologyPsychologySocial SciencesInterdisciplinaryStudies
VIII. Low and UnrelaPed Employment--Terminal Degree
Mechanical & Engineering Fine 6 Applied ArtsTechnologies
None Phyaical Sciences None
allese findings are relative and represent patterns or trends only. For example, the graduates in the physical sciences found employmentless often than others at the doctoral level, but had a high level of employment, nevertheless. The categories of high or low are basedon the median rank. Any mean at or above the median was considered as high, except in the case of doctoral degree recipients going on tofurther graduate work. Here any amount of post-doctoral advanced study was categorized as "high."
19
3 2

Also, a relatively high percentage of the graduates in these major disciplines wenton to graduate school.
In contrast, the graduates of the major disciplines listed in Section VI("low, but highly related employment--terminal degree") when compared with others,have lower levels of employment, but tend to take jobs related to their majordiscipline. Relatively few graduates in these major disciplines in Section VIcontinue to pursue advanced degrees, making this degree, in essence, terminal.
The reader may want to look at a discipline of interest, determine its patternand then examine the preceding tables to obtain a picture of how favorable thepattern is in terms of the basis data. Two questions might be asked: Does thepattern suggest a trend? Or is the pattern due to the nature of the discipline?
sector.Table 16 indicates employment status by degree level and institutional
DISCUSSION
Baccalaureate graduates of the private state-aided instutions enjoyed higherlevels of employment than graduates of any other institutional category in Pennsyl-vania in 1975. Graduates of the state-related institutions had the next highestemployment level, followed by graduates of the private and state-owned institutions.The relatively low level of employment (or high unemployment level) for graduatesof the state-owned institutions is due to the rapidly declining employment market fornew teachers and to surveying too early--placement activity peaks later each year,say placement officers at state-owned institutions.
The employment situation for graduates at other degree levels ranges from"satisfactory" for associate degree graduates to "good" for those with master's,doctor's and first-professional degrees. This tends to refute the idea that largenumbers of holders of advanced degrees are unemployed or underemployed. In fact,the percentage of unemployment declines at each higher degree level above thebaccalaureate.
Graduates of the following major disciplines possessed the highest levels ofemployment: theology, agriculture and natural resources, engineering, communications,law, health, architecture, and computer and information sciences.
Graduates of major disciplines ranking low in employment are social studies,education, biological sciences, fine and applied arts, psychology, area studies andinterdisciplinary studies. Counselors in high schools and colleges should informstudents about fields with either a weak employment demand or an oversupply of grad-uates.
Generally corroborating the findings of this study are two news releases fromthe College Placement Council, Bethlehem, Pennsylvania--one in December 1975, theother in June 1976. These releases describe a slump in employment for graduates ofthe 1974-75 academic year. The council's forecast for 1974-75 was for a four percent decrease in college graduate hirings over the 1973-74 level. "But the situationworsened as the recruiting season progressed and employers wound up hiring 18 percent fewer college graduates than in 1973-74....Last June the class of 1975 hit theskimpiest job market in more than a decade," the report said.
However, for the coming year (1975-76), the council expects hiring to be up,especially in the categories of engineering, accounting, business administration,
20
33

..computer science and sales. Employment for teachers will continue to be a problem,according to the council's forecast. There will be somewhat better prospects,.though,..for employment of,teachers of mathematicsmusic,. science and-special-edudation. Hiring_fDr women and blacks is also predicted to. increase.
3 4
21

Table 16
Employment Status by Degree Level and Institutional Sector
Degree Levels and In-stitutional Sectors
TotalReported
Employed inField Prepared
Employed inOther Field Pursuing
AdvancedDegree
Unem-ployed
In
Pa.Outside
Pa.
In
Pa.Outside
Pa.
Bachelor's Degree
9,888 3,471 917 1,360 176 716 3,247State-Owned(35.1) ( 9.3) (13.8) ( 1.8) ( 7.2) (32.8)
State-Related 1,412 563 87 373 55 208 126(39.9) ( 6.2) (26.4) ( 3.9) (14.7) ( 8.9)
State-Aided 334 174 76 33 6 32 13(52.1) (22.7) ( 9.9) ( 1.8) ( 9.6) ( 3.9)
Private 10,985 3,363 1,502 1,056 574 2,490 2,000(30.6) (13.7) ( 9.6) ( 5.2) (22.7) (18.2)
Subtotal 22,619 7,572 2,582 2,822 811 3,446 5,386(33.5) (11.4) (12.5) ( 3.6) (15.2) (23.8)
Master's Degree
1,179 891 138 36 10 24 80State-Owned(75.6) (11.7) ( 3.1) ( 0.8) ( 2.0) ( 6.8)
State-Related 630 386 85 70 15 49 25(61.3) (13.5) (11.1) ( 2.4) ( 7.8) ( 3.9)
State-Aided 42 15 9 14 4
(35.7) (21.4) - - (33.3) ( 9.5)Private 1,042 416 223 144 31 147 81
(39.9) (21.4) (13.8) ( 3.0) (14.1) ( 7.8)Subtotal 2,893 1,708 455 250 56 234 190
(59.0) (15.7) ( 8.6) ( 1.9) ( 8.1) ( 6.6)Doctor's Degree
1 1 - - - - -State-Owned(100.0)
State-Related 134 64 46 8 7 5 4
(47.8) (34.3) ( 6.0) ( 5.2) ( 3.7) ( 3.0)State-Aided 7 6 1
(85.7) (14.3) - - _ -Private 114 40 59 3 1 - 11
(35.1) (51.8) ( 2.6) ( 0.9) ( 9.6)Subtetal 256 111 106 11 8 5 15
(43.4) (41.4) ( 4.3) ( 3.1) ( 2.0) ( 5.9)First Professional Degree
1,035 549 344 44 17 31 50State-Related
(53.0) (33.2) ( 4.3) ( 1.6) ( 3.0) ( 4.8)State-Aided 1,189 555 588 2 11 17 16
(46.7) (49.5) (10.2) ( 0.9) ( 1.4) ( 1.3)Private 352 239 42 36 3 1 31
(67.9) (11.9) (10.2) ( 0.9) ( 0.2) ( 8.8)Subtotal 2,576 1,343 974 82 31 49 97
(52.1) (37.8) ( 3.2) ( 1.2) ( 1.9) ( 3.8)Associate Degree
5,131 2,200 68 388 48 2,076 351Community Colleges(42.9) ( 1.3) ( 7.6) ( 0.9) (40.5) ( 6.8)
Proprietary Inst. 1,993 1,217 308 132 17 82 237(61.1) (15.5) ( 6.6) ( 0.9) ( 4.1) (11.9)
Four-Year Colleges 558 315 20 31 7 146 39& Universities (56.5) ( 3.6) ( 5.5) ( 1.3) (26.2) ( 7.0)Subtotal 7,682 3,732 396 551 72 2,304 627
(48.6) ( 5.1) ( 7.2) ( 0.9) (30.0) ( 8.2)
GRAND TOTAL 36,026 14,466 4,513 3,716 978 6,038 6,315(40.2) (12.5) (10.3) ( 2.7) (16.8) (17.5)
35
22

By using data from Table 16 and from the studies completed for bachelor'sdegree graduates in 1972 and 1974, one might make the following comparisons byinstitutional category:
Percentage of Bachelor'sInstitutional Graduates EmployedCategory 1972 1974 1975 .
State-Owned 69.9 80.3 59.9State-Related 51.0 75.7 76.3State-Aided 66.3 63.9 8.6.5
Private 55.6 68.6 59.1Total 60.5 74.7 61.0
Percentage of Bachelor'sInstitutional Graduates Not EmployedCategory 1972 1974 1975
..
State-Owned 23.8 15.3 32.8State-Related 37.2 13.8 8.9State-Aided 13.9 13.9 3.9Private 18.1 16.1 18.2Total 23.3 15.1 23.8
InstitutionalCategory
Percentage of Bachelor'sGraduates Pursuing Advanced Degrees
1972 1974 1975
State-Owned 6.2 4.3 7.2State-Related 11.7 10.6 14.7State-Aided 19.7 22.2 9.6Private 26.3 15.3 22.7Total 16.1 10.2 15.2
Of Those Employed, PercentageInstitutional Outside Pa,,Category 1972 1974 1975
State-Owned 18.1 18.0 18.4
State-Related 28.8 23.8 13.2State-Aided 38.7 39.3 28.4
Private 36.9 34.0 32.0Total 28.0 25.2 24.6
InstitutionalCategory
Of Those Employed, PercentageEmployed in Field Prepared1972 1974 -1975
State-Owned 84.3 65.7 74.1
State-Related 89.1 70.7 60.3State-Aided 89.1 75.7 86.5Private 57.6 63.9 74.9
Total 75.5 66.9 73.6
3623

From Table 16 data, the tc)1100,ng cok
tional category can be made:Parisons b degree level and institu-
Institutional Epercent4
Categorye of
Graduates MploYed
boctorie First Prof.
State-OwnedState-RelatedState-AidedPrivate
Total
InstitutionalCategory
State-OwnedState-RelatedState-AidedPrivateTotal
InstitutionalCategory
State-OwnedState-RelatedState-AidedPrivateTotal
InstitutionalCategory
State-OwnedState-RelatedState-AidedPrivateTotal
InstitutionalCategory
59-976.386.5
59.1
61.0
percent
91.288.357.178.1
85.3
Graduates Not Em 10 ed111: of
8 octor's tirst Prof.
100.093.3
100.090.4
92.1
92.297.290.9
94.3
32.88.93.9
18.223 3
6.8
3.9
9.57.
8
6.6
/NA
3.0
9.6
5.9
4.81.3
8.8
3.8
tes'UrStlin
Advanced De rees
g helor r's4-loctor's First Prof.
7.214.79,6
22.!
15.4
33.314,1
3.7 3.01.40.2
8.1 2.0 1.9
se Eh,
g helo= 'sbnctor's First Prof.
4
13.24
32.0
24.6
13.818,0
37.531-320.7
a/.
42.4
14.358.348.3
37.851.814.141.3
o5P--%.yejj..22.1.tage in Field Prepared42t:Ell!rie
b octorFirst Prof.'s
State-Owned 74-1State-Related 60.3State-Aided 86-5Private 74.9Total 73.6
24
95.7,
84.1
100.°-78.587,6
100.088.0
100.096.1
91.9
93.698.987.8
95.3

The following comparisons related to associate degree recipients of .theseveral institutional categories can be made from Table 16 data:
Percentage of Graduates Of Those EmployedPursuing 'Percentage Percentage
Institutional Not Advanced Outside Employed inCategory Employed Employed Degree Pa. Field Prepared
Community Colleges 52.7 6.8 40.5 4.3 44.2Proprietary Inst. 84.0 11.9 4.1 19.4 76.5Four-Year Colleges
& Universities 66.8 7.0 26.2 7.2 60.0Total 61.8 8.2 30.0 6.1 53.7
38
25

APPENDICES
The tables in the appendix supplement those in the text. The 17.0 table
series gives the survey response data for graduates of each major discipline
degree level and type of institution. Table series 18.0 through 23.3 give
employment status data for graduates of each major discipline, degree level and
institutional type. Employment status information is also given by degree field
for associate and baccalaureate degree graduates.
, ..
ag

Table 17.0
Number of Returns Received from Four Degree,Levels of Graduates Compared With:the Humber--,of Graduates for Institutions Cooperating in the Study by4lAjor Discipline, 1975a
Malor Discipline
All Degrees Bachelor'sNo. ofGrads.
No. ofReturns
No. ofGrads.
No. ofReturns
Agriculture and 155 143 155 143
Natural Resources (92.2)- (92.2)
Architecture and 45 64 39 63
Environmental Design (100.0) (100.0)
Area Studies 58 33 53 30(56.9) (56.6)
Biological 1,882 1,004 1,659 952Sciences (53.3) (57.4)
Business and 4,886 3,138 4,315 2,836Management (64.2) (65.7)
Communications 580 305 478 267
(52.6) (55.9).... ..... _.-
Computer and Informs- 132 105 .99 - 90
tion Sciences (79.5) (90.9)
Education 13,812 10,770 9,535 8,809(78.0) (92.4)
Engineering 1,107 900 914 777(81.3) (85.0)
Fine and Applied 1,525 786 1,359 732Arts (51.5) (53.9)
Foreign Language 929 389 879 379(41.9) (43.1)
Health Professions 3,344 2,371 1,442 859
(70.9) - (59.6)
Home Economics 287 181 287 181(63.1) (63.1)
Law 1,008 1,163 8 49
(100.0) (100.0)
Letters 2,612 1,078 2,187 983
(41.3) (44.9)
Library Science 287 123 226 101
(42.9) (44.7)
Mathematics 1,075 525 956 486
(48.8) (50.8)
Physical Sciences 1,215 624 953 547
(51.4) (57.4)
Psychology 1,935 1,208 1,783 1,114(62.4) (62.5)
Public Affairs 819 328 671 253
and Services (40.0) (37.7)
Social Sciences 5,435 2,539 5,008 2,416(46.7) (48.2)
Theology 446 185 347 175
(41.5) (50.4)
Interdisciplinary 729 262 701 257
Studies (35.9) (36.7)
GRAND TOTAL 44,303 28,344 34,054 22,619
(64.0)
Master's "Doctoral First Prof.No. ofGrads.
No. ofReturns
No. ofGrads.
No. of No. of No. ofReturns Grads. Returns
6 1
(16.7)
5 3
(60.0)
166 45 57 7
(27.1) (12.3)
361 288 10 14
(51.3) (100.0)
102 38 -
(37.3)__
26 8 7 7
4,124
(30.8) (100.0)
1,856(45.0)
153 105(66.6)
149 90 44 33
(60.4) (75.0)
160 54 6 -
(33.8)
49 9
(18.4)
1
(100.0)
120 49 1 1,781 1,463
(40.8) (82.1)
1
(100.0)
383 76 42 19
(19.8) (45.2)
61 22
(36.1)
102 30 17 9
(29.4) (52.9)
204 50 58 27
(24.5) (46.6)
115 71 37 23
(61.7) (62.2)
133 69 15 6
(51.9) (40.0)
400 118 27 5
(29.5) (18.5)
99 10
(10.1)
22 5
(22.7)
1,000 1,113
(100.0)
6,987 2,893 481 256 2,781 2,576
(66.4) (41.4) (53.2) (92.6)
uIn several instances where the "number of returns" exceeds the"number of graduates," this is due to theslightly different data collecting periods (and methods) used by the two sources of data comprising these tables.For instance, the "number of returns" represents graduates 'between December, 1974 and August, 1975 who responded tothe survey. The "number of graduates" data were Collected for those graduating between July 1, 1974, and June 31,1975, as published in: Degrees and Other Formal Awards Conferred la Pennsylvania Institutions of Higher Education,1974-75, Division of Educational Statistics, Bureau of Information Systems, Pennsylvania Department of Education,Harrisburg, 1976.
27

Table 17.1
Number of Returns Received from Four-Degree Levels of Graduates ComparedWith the NuMber of GraduatesforAll Institutions by Major Discipline, 1975
Major Discipline
All Degrees Bachelor s Master s Doctoral First Prof.
No.Grads.
No. ofReturns
No. ofGrads.
No. ofReturns
No. ofGrads.
No. of .
ReturnsNo. ofGrads.
No. ofReturns
No. ofGrads.
No. ofReturns
Agriculturn and 629 143 . 574 143 45 10
Natural Resource (22.7) (24.9)
Architecture and 424 64 196 63 232 1 6
Environmental Design (15.1) (33.9) ( 0.4)
Area Studie4 230 33 173 30 46 3 11
(14.3) (17.3) ( 6.5)
Biological Sciences 3,712 1,004 3,235 952 304 45 173 7
(27.0) (29.4) (14.8) ( 4.0)
business and 9,485 3,138 7,633 2,836 1,795 288 57 14
nanagecent (33.1) (37.2) (16.0) (24.6)
Communications 931 305 784 267 143 38 6
(32.7) (34.1) (26.6)
Computer and Informa- 372 105 262 90 87 8 23 7
tion Sciences (28.2) (34.4) ( 9.2) (30.4)
Education 18,547 10,770 11,537 8,809 6,540 1,856 470 105
(58.1) (76.4) (28.4) (22.3)
Engineering 3,708 900 2,782 777 762 90 164 33
(24.3) (24.1) (11.8) (21.2)
Fine and Applied 2,138 786 1,814 732 299 54 25
Arts (36.8) (40.4) (18.1)
Foreign Languages 1,555 389 1,305 379 218 9 32 1
(25.0) (29.0) ( 4.1) (3.1)
Health Profesmion 5,072 2,371 2,824 859 444 49 23 1,781 1.463
(46.7) (30.4) (11.0) (82.1)
Home Economics 862 181 796 181 50 16
(21.0) (22.7)
Law 1,236 1,163 17 49 7 1 1,212 1,113
(94.1) (100.0) (14.3) (91.8)
Letters 4,342 1,078 3,534 983 670 76 138 19
(24.8) (27.8) (11.3) (13.8)
Library Science 726 123 226 101 490 22 10
(16.9) (44.7) ( 4.5)
Mathematics 1,743 525 1,481 486 232 30 30 9
(30.1) (32.8) (12.9) (30.0)
Physical Sciences 2,379 624 1,751 547 410 50 218 27
(26.2) (31.2) (12.2) (12.4)
Psychology 3,321 1,208 3,015 1,114 210 71 96 23
(36.4) (36.5) (33.8) (24.0)
Public Affairsand Services 2,390 328 1,610 353 723 69 57 6
(13.7) (15.7) ( 9.5) (10.5)
Sncial Sciences 9,512 2,539 8,455 2,416 884 118 173 5
(26.7) (28.6) (13.3) (2.9)
Theology 921 185 409 195 152 10 26 334
(20.1) (42.8) ( 6.6)
Interdisciplinary 1,379 262 1,286 257 84 5 9
Studies (19.0) (20.0) ( 6.0)
GRAND TOTAL 75,616 28,344 55,689 22,619 14,827 2,893 1,773 256 3,327 2,576
(37.5) (40.6) (19.5) (14.4) (77.4)
41
28

Table 17.2
Number of Returns Received from Graduates at Four Degree Levels as Compared With the Number of
Graduates for Cooperating Institutions Within Institutional Categories in Pennsylvania, 1975
Institutional
Cate ories
All Degrees Bachelor's Master's
No. of No. of
Grads. Returns
No. of No. of
Grads. Returns
No, of No. of
Grads. Returns
State-Owned 17,379 11,068 14,204 9,888 3,171 1,179
(63.7) (69,6) (37,2)
State-Related 6,116 3,210 3,386 1,412 1,368 630
(52.5) (41.7) (46.1)
State-Aided 2,573 1,573 1,023 334 50 42
(6111) (32.6) (84.0)
Private Colleges & 18 235 12,493 15,441 10,985 2,398 1,042
Universities (68.5) (71.1) (43,5)
GRAND TOTAL 44,303 28,344 34,054 22,619 6,987 2,893
(64.0) (66,4) (41.4)
Doctoral First Prof.
No. of No. of No. of No. of
Grads. Returns Grads, Returns
4 1
(25.0)
251 134 1 111 1,034
(53.4) (93.1)
20 7 1,480 1,190
(35.0) (80.4)
206 114 190 352
(55.3) (100.0)
481 256 2,781 2,576
(53.2) (92.6)
Table 17,3
Number of Returns Received from Graduates at Four Degree Levels as Compared With the Number of
Graduates for All Iastitutions Within Institutional Cateoeries in Pennsylvania, 1975
Institutional
Cate ories
_AILDIEEts_Bachelor's Master's Doctoral First Prof.
No. of No. uf No. of No, of No. of No, of No. of No. of No. of No, of
Grads. Returns Grads, Returns Grads, Returns Grads. Returns Grads. Returns
State-Owned 17,783 11,068 14 204 9,888 3,575 1,179 4 1
(62.2) (69.6) (33.0) (25.0)
State-Related 22,072 3,210 14,966 1,412 40918 630 1,077 134 1,111 1,034
(14.5) ( 9.4) (12.8) (12.4) (93.1)
State-Aided 8,307 1,573 4,300 334 2,120 42 407 7 1,480 1,190
(18.9) ( 7,8) ( 2.0) ( 1,7) (80.4)
Private Colleges, Univ. 27,454 12,493 22,219 10,985 4,214 1,042 285 114 736 352
& Theological Sem. (45.5) (49.4) (24.7) (40.0) (47.8)
GRAND TOTAL 75,616 28,344 55,689 22,619 14,827 2,893 1,773 256 3,327 2,576
(37.5) (40.6) (19.5) (14.4) (77.4)

Table 17.4
Number of Returns Received for Associate Degree Graduates Compared With the Number ofGraduates for Cooperating Institutions and All Institutions by Major Discipline, 1975
MajorDiqripline
Number ofAssociateDegrees
Awarded byCooperatingInstitutions
TotalNumber ofAssociateDegreesAwardedin Pa.
Per Centof
Returns byNumber Graduates ofof Cooperating
Returns Institutions
Per Centof
Returnsof Grad-uates ofAll Insts.
Data ProcessingTechnologies 472 585 308 65.3 52.6
Health Services & Para-medical Technologies 1,523 1,754 1,325 87.0 75.5
Mechanical & EngineeringTechnologies 1,808 2,637 1,371 75.8 52.0
Natural ScienceTechnologies 168 396 114 67.9 28.8
Business and CommerceTechnologies 3,006 4,152 2,109 70.2 50.8
Public Service RelatedTechnologies 1,026 1,207 874 85.9 72.4
Arts and ScienceTransfers 2,596 3,811 1,581 60.9 41.5
GRAND TOTAL 10,599 14,542 7,682 72.5 52.8
Table 17.5
Number of Returns Received for Associate Degree Graduates Compared With the Number ofGraduates for Cooperating Institutions and All Institutions by Institutional Category, 1975
Number of Total Per Cent Per CentAssociate Number of of ofDegrees Associate Returns by Returns
Awarded by Degrees Number Graduates of of Grad-Institutional Cooperating' Awarded of Cooperating uates ofCategory Institutions in Pa. Returns Institutions All Insts.
Community Colleges 6,954 7,554 5,131 73.7 67.9Colleges and'Universities 1,311 2,977 558 42.6 18.7Private Jr. Colleges 1,189PrOprietary Instiutions 2,334 2,822 1,993 85.4 70.6
GRAND TOTAL 10,599 14,542 7,682 72.5 52.8
4430

Table 18.0
Employment Status by Major Discipline for Baccalaureate Degree Recipientsfor State-Owned Institutions in Pennsylvania. 1975
Major DiscinlineTotal
Reported
Employed InField Prepared
Employed InOther Field Pursuing
AdvancedDegree Unemployed
In
Pa.
OutsidePa.
In
Pa.Outside
Pa.
Agriculture and NaturalResources
Architecture and Environ-mental Design
Area Studies
21
20
4
(19.0)
6
(30.0)
2
(9.5)
4
(20.0)
5
(23.8)
3
(15.0)
2
(9.5)
2
(10.0)
(38.1)
5
(25.0)
Biological Sciences 150 42 14 21 32 41(28.0) (9.3) (14.0) (21.3) (27.3)
Business and 638 304 68 51 8 28 179Management (47.6) (10.6) (8.0) (1.3) (4.4) (28.1)
Communications 32 10 6 5 2 9(31.2) (18.8) (15.6) (6.3) (28.1)
Computer and Informa- 38 20 7 1 1 9tion Sciences (52.0 (18.4) (2.6) (2.6) (23.7)
Education 6.632 2.461 648 880 67 347 2.229(37.1) (9.8) (13.3) (1.0) (5.2) (33.6)
Engineering
Fine and Applied Arts 138 21 3 11 4 5 94(15.2) (2.2) (8.0) (2.9) (3.6) (68.1)
Foreign Languages 93 8 3 28 6 17 31(8.6) (3.2) (30.1) (6.5) (18.3) (33.3)
Health Professions 124 89 5 12 1 4 13(71.8) (4.0) (9.7) (0.8) (3.2) (10.5)
Home Economics 103 45 15 13 2 9. 19(43.7) (14.6) (12.6) (1.9) (8.8) (18.4)
Law
Letters 190 55 4 40 6 28 57(28.9) (2.1) (21.0) (3.2) (14.7) (30.0)
Library Science 91 34 17 19 5 20(35.0 (17.9) (20.0) (5.3) (21.0)
Mathematics 189 49 24 29 15 21 51(25.9) (12.7) (15.3) (7.9) (11.1) (27.0)
Physical Sciences 160 43 23 16 6 46 26(26.9) (14.3) (10.0) (3.7) (28.8) (16.3)
Psychology 329 70 9 60 12 51 127(21.3) (2.7) (18.2) (3.6) (15.5) (38.6)
Public Affairs and 143 43 16 18 2 4 60Services (30.1) (11.2) (12.6) (1.4) (2.8) (41.9)
Social Science's 702 147 44 143 42 99 227(20.9) (6.3) (20.4) (6.0) (14.1) (32.3)
Theology
Interdisciplinary 91 21 5 5 5 13 42Studies (23.1) (5.5) (5.5) (5.5) (14.3) (48.1)
GRAND TOTAL 9.868 3,472 917 1.360 176 716 3.247(35.1) (9.3) (13.8) (1.8) (7.2) (32.8)
4 5
31

Table 18.1
Employment Status by Major Discipline for Baccalaureate Degree Recipients forState-Related Institutions in Pennsylvania, 1975
Employed in Employed inPrepared Other Field PursuingOutside In Outside Advanced
Pa. Pa. Pa. Degree UnemployedMajor DisciplineTotal.
Rerorted
FicldInPa.
Agriculture and NaturalResources
Architecture and Environ-mental Design
Area Studies 4 2
(50.0)
Biological Sciences 27 6
(22.2)
Business and 224 125Management (55.8)
Communications 89 27
(30.3)
Computer and Informa- 11 9
tion Sciences (81.8)
Education 380 234(61.6)
Engineering 39 22
(56.4)
Fine and Applied Arts 70 25
(35.7)
Foreign Languages 20 2
(10.0)
Health Professions 4 4
(100.0)
Home Economics
Law 4 2
(50.0)
Letters 67 8
(11.9)
Library Science
Mathematics 13 5
(38.5)
Physical Sciences 19 7
(36.8)
Psychology 104 30
(28.8)
Public Affairs and 57 22
Services (38.6)
Social Sciences 204 28
(13.2)
Theology
Interdisciplinary 76 5
Studies (6.6)
GRAND TOTAL 1,412 563
2
(50.0)
7 2 10 2
(25.9) (7.4) (37.3) (7.4)
23 39 8 11 18(10.3) (17.4) (3.6) (4.9) (8.0)
15 28 5 4 10(16.9) (31.5) (5.6) (4.5) (11.2)
1 - 1
(9.1) (9.1)
24 72 8 11 31
(6.3) (18.9) (2.1) (2.9) (8.2)
10 3 - 3 1
(25.6) (7.7) (7.7) (2.6)
3 15 5 14 8
(4.3) (21.4) (7.1) (20.0) (11.4)
1 9 1 6 1(5.0) (45.0) (5.0) (30.0) (5.0)
2
(50.0)
1 36 3 6 13
(1.5) (53.7) (4.5) (9.0) (19.4)
- - 1.
1 5 1 1
(7.7) (38.4) (7.7) (7.7)
2 1 9
(10.5) (5.3) (47.4)
2 35 5 26 6
(1.9) (33.7) (4.8) (25.0) (5.8)
1 14 12 8
(1.7) (24.6) (21.1) (14.0)
2 78 14
(1.0) (38.2) (6.9)60
(29.4)
2 30 4 30(2.6) (39.5) (5.3) (39.5)
87 373 55
(39.9) (6.2) (26.4) (3.9)
22(10.8)
5(6.6)
208 126(14.7) (8.9)
4 6
32
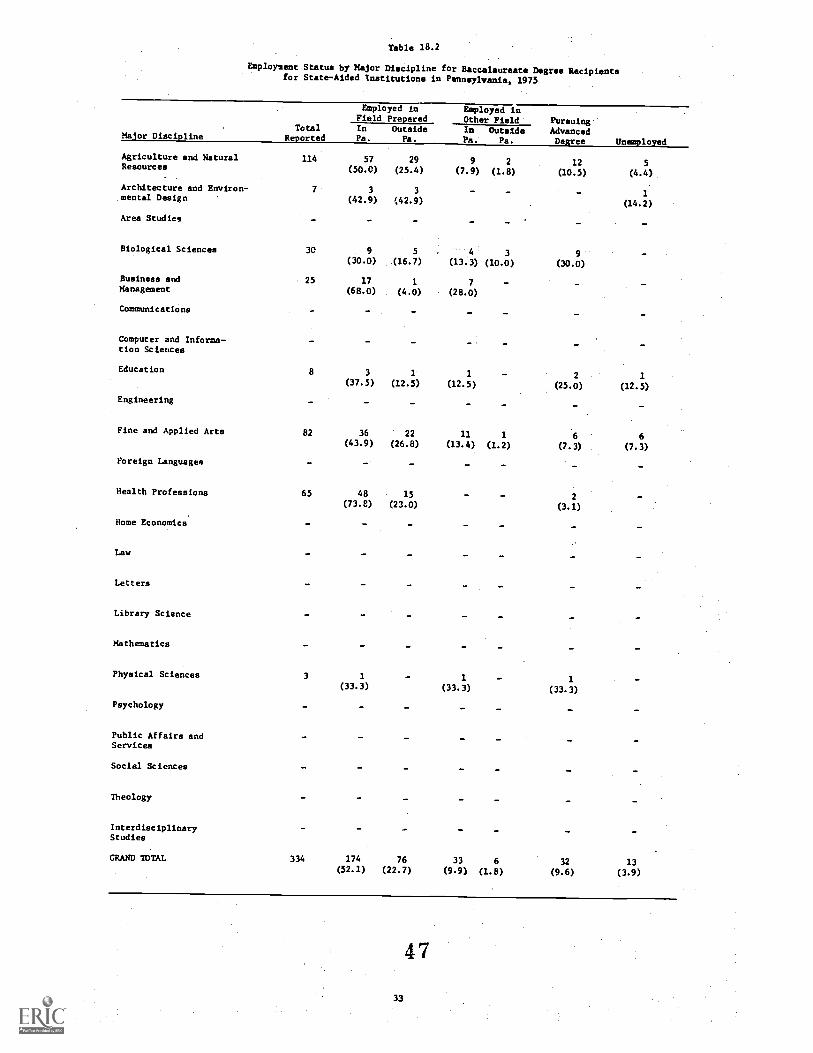
Table 18.2
Employment Status by Major Discipline for Baccalaureate Degree Recipientsfor State-Aided Institutions in Pannsyrvania, 1975
Maior DisciplineTotal
Reported
Employed inField Prepared
Employed inOther Field Pursuing
AdvancedDegree Unemployed
InPa.
OutsidePa.
In OutsidePa. Pa.
Agriculture and Natural 114 57 29 9 2 12 5Resources (50.0) (25.4) (7.9) (1.8) (10.5) (4.4)
Architecture and Environ- 7 3 3 1mental Design (42.9) (42.9) (14.2)
Area Studies
Biological Sciences 30 9 5 4 3 9(30.0) (16.7) (13.3) (10.0) (30.0)
Business and 25 17 1 7Management (68.0) (4.0) (28.0)
Communications
Computer and Informa-tion Sciences
Education 8 3 1 1 2 1(37.5) (12.5) (12.5) (25.0) (12.5)
Engineering - -
Fine and Applied Arts 82 36 22 11 1 6 6(43.9) (26.8) (13.4) (1.2) (7.3) (7.3)
Foreign Languages -
Health Professions 65 48 15 - - 2(73.8) (23.0) (3.1)
Home Economics' - - -Law- - - -
Letters
Library Science - -
Mathematics --
Physical Sciences 3 1 1 1(33.3) (33.3) (33.3)
Psychology -
Public Affairs andServices
Social Sciences
Theology a
InterdisciplinaryStudies
GRAND TOTAL 334 174 76 33 6 32 13(52.1) (22.7) (9.9) (1.8) (9.6) (3.9)
47
33

Table 18.3
Employment Status by Hajor Discipline for Baccalaureate Degree Recipients forPrivate Institutions in Pennsylvania, 1975
Halos DisciplineTotal
Repurted
Employed inField Prepared
Employed inOther Field Pursuing
AdvancedDegree Unemployed
In
Pa.
OutsidePa.
InPa.
OutsidePa.
Agriculture and Natural 8 1 3 2 2Resources (12.5) (37.5) (25.0) (25.0)
Architecture and Environ- 36 11 6 1 2 13 3mental Design (30.5) (16.7) (2.8) (5.6) (36.1) (8.3)
Area Studies 26 1 1 2 5 11 6(3.8) (3.8) (7.7) (19.2) (42.3) (23.1)
Biological Sciences 745 132 51 39 39 344 140(17.7) (6.8) (5.2) (5.2) (46.2) (18.8)
Business and 1,949 879 304 139 39 183 405Management (45.1) (15.6) (7.1) (2.0) (9.4) (20.8)
Ccmounications 146 43 28 37 11 10 17(29.5) (19.2) (25.3) (7.5) (6.8) (11.6)
Computer and Informa- 41 19 12 3 7tion Sciences (46.3) (29.3) (7.3) (17.1)
Education 1,789 710 268 140 88 184 399(39.7) (15.0) (7.8) (4.9) (10.3) (22.3)
Engineering 738 283 239 6 13 117 80(38.3) (32.4) (0.8) (1.8) (15.9) (10.8)
Fine and Applied Arts 442 93 73 61 27 89 99(21.0) (16.5) (13.8) (6.1) (20.1) (22.4)
Foreign Languages 266 51 29 40 25 72 49(19.2) (10.9) (15.0) (9.4) (27.1) (18.4)
Health Professions 666 333 111 8 3 117 94(50.0) (16.6) (1.2) (0.5) (17.6) (14,1)
Home Economics 78 30 7 6 9 11 15(38.5) (9.0) (7.7) (11.5) (14.1) (19.2)
Law 45 3 - 1 40 1(6.7) (2.2) (88.9) (2.2)
Letters 726 108 69 129 71 232 117(14.9) (9.5) (17.8) (9.8) (31.9) (16.1)
Library Science 6 2 - 1 2 1(33.3) (16.7) (33.3) (16.7)
Mathematics 284 103 35 22 13 83 28(36.3) (12.3) (7.7) (4.6) (29.2) (9.9)
Physical Sciences 365 52 42 17 16 210 28(14.2) (11.5) (4.7) (4.4) (57.5) (27)
Psychology 681 139 52 94 28 222 146(20.4) (7.6) (13.8) (4.1) (32.6) (21.4)
Public Affairs and 153 55 22 19 5 17 25Services (42.5) (14.4) (12.4) (3.3) (11.1) (16.3)
Social Sciences 1,510 234 107 267 159 436 307(15.5) (7.1) (17.7) (10.5) (28.9) (20.3)
Theology 195 46 42 16 9 77 5(23.6) (21.5) (8.2) (4.6) (39.5) (2.6)
Interdisciplinary 90 25 4 13 7 15 26Studies (27.8) (4.4) (14.4) (7.8) (16.7) (28.9)
GRAND TOTAL 10,985 3,363 1,502 1,056 574 2,490 2,000(30.6) (13.7) (9.6) (5.2) (22.7) (18.2)
4834

Table 19.0
Employment Status by Major Discipline for Master's Degree Recipients forState-Owned Institutions in Pennsylvania, 1975
Major Discipline
Employed in Employed inField Prepared Other Field Pursuing
Total In Outside In Outside AdvancedReported Pa. Pa. Pa. Pa. Degree Unemployed
Agriculture and NaturalResources
Architecture and Environ-mental Design
Area Studies
Biological Sciences 16 9 2 2 2 1(56.2) (12.5) (12.5) (12.5) (6.3)
Business and 31 15 4 1 2 9Management (48.4) (12.9) (3.2) (6.5) (29.0)
Communications 31 21 6 1 3(67.7) (19.4) (1.2) (9.7)
Computer and Informa-tion Sciences
Education 981 776 100 27 9 10 59(79.1) (10.2) (2.8) (0.9) (1.0) (6.0)
Engineering -
Fine and Applied Arts 3 3
(100.0)
Foreign Languages 2 2
(100.0)
Health Professions - -
Home Economics - -
Law -
Letters 14 11 2 - 1(78.6) (14.3) (7.1)
Library Science 15 12 3
(80.0) (20.0)
Mathematics 5 4 1
(80.0) (20.0)
Physical Sciences 10 7 2 1(70.0) (20.0) (10.0)
Psychology 5 1 - - 4(20.0) (80.0)
Public Affairs and 25 3 19 - 2 1Services (12.0) (76.0) (8.0) (4.0)
Social Sciences 39 26 4 3 4 2(66.7) (10.2) (7.7) (10.3) (5.1)
Theology - -
Interdisciplinary 2 1 - 1Studies (50.0) (50.0)
GRAND TOTAL 1,179 891 138 36 10 24 so(75.6) (11.7) (3.1) (0.8) (2.0) (6.8)
4 9
35

Table 19.1
Employment States by Major Discipline for Master's Degree Recipients forState-Related Institutions in Pennsylvania. 1975
Employed in Employed InField Prepared Other Field Pursuing
Outside* In Outside AdvancedPa. Pa. Pa. Degree UnemployedMajor Discipline
TotalReported
In
Pa.
Agriculture and NaturalResources
Architecture and Environ-mental Design
Area Studies
Biological Sciences 11 6
(54.5)
Business and 43 22Management (51.2)
Communications 5 2
(40.0)
Computer and Informa- 3 1
tion Sciences (33.3)
Education 361 261
(72.3)
Engineerinr -
Fine and Applied Arts 30 10
(33.3)
Foreign Languages 5 5
(100.0)
Health Professions 20 9
(45.0)
Home Economics -
Law 1 1
(100.0)
Letters 39 19
(48.7)
Library Science
Mathematics 5 3
(60.0)
Physical Sciences 9 3
(33.3)
Psychology 24 10(41.5)
Public Affairs and 34 19
Services (55.9)
Social Sciences 37 13
(35.1)
Theology -
Interdisciplinary 3 2
Studies (66.7)
GRAND TOTAL 630 386
1 1 3
(9.1) (9.1) (27.3)
11 6 2 2
(25.6) (14.0) (4.5) (4.6)
1 2
(20.0) (40.0)
1 1
(33.3) (33.3)
37 33 5 16 9
(10.2) (9.1) (1.4) (4.4) (2.5)
- -
8 2 2 8
(26.6) (6.7) (6.7) (26.7)
- -
8 1 2
(40.0) (5.0) (10.0)
-
- -
2 5 2 8 2
(5.1) (15.4) (5.1) (20.5) (5.1)
-
2
(40.0)
4 2
(44.4) (22.2)
6 1 6 1
(25.0) (4.2) (25.0) (4.2)
6 5 2 2(17.5) (14.7) (5.9) (5.9)
7 8 1 7 1
(18.9) (21.6) (2.7) (18.9) (2.7)
1
(33.3)
85 70 15 49 25(61.3) (13.5) (11.1) (2.4) (7.8) (3.9)
5 036

Ma or Disci line
Table 19.2
..m Statue k piecipli" o os
Penney
Hmeter a oearee Recipients fortmploYme'state-AleF t011°'mcions lu loan"' 1975
fored lima°
loyed inCsP
To10_12:10LtIsl
tal Fie Outaidtrted In Pa.ite
Pa.
Employed in
Other Field/12 Outside AZ:n:11
Pa. De eePa lo edAgriculture and glitaralResources
Architecture and Esvir04.mental Design
Area Studies
Biological Sciences
Business andManagement
Comunications
Computer aed Informa-tion Sciences
Education
Engineering
Fine and Applied irts
Foreign Language
Health Profession°
Home Economics
Law
Letters
Library Science
Mathematics
Physical Sciences
Psycholdgy
Public Affairs andServices
Social Sciences
Theology
InterdisciplinaryStudies
GRAND TOTAL
10
2
2.5
15
Al
4
(40.0)
(50.0
5
(33.3)
(23_53)
15(3s7)
1(10.0)
6(40.0)
2
(13.3)
9
(21.4)
4
(40.0)
1(50.0)
2
(13.3)
7
(46.7)
14
(33.3)
1(10.0)
2
(13.3)
1(6.7)
4
(9.5)
51
37

Table 19.3
Employment Status by Major Discipline for Mister's Degree Recipients forPrivate Institutions in Pennsylvania, 1975
Employed in Employed inField Prepared Other Field Pursuing
Outside In Outside AdvancedPa. Pa. Pa. Degree UnemployedMilor DisCipline
TotalReported
InPa.
Agriculture and NaturalResources
Architecture and Environ-mental Design
1
Area Studies 3
Biological Sciences 8 2
(25.0)
Business and 214 102
Management (47.7)
Communications 2 2
(100.0)
Computer and Informa- 5 2
tion Sciences (40.0)
Education 512 216
(42.2)
Engineering 90 26
(28.9)
Fine and Applied Arts 21 10
(47.6)
Foreign Languages 2
Health Professions 14 7
?-unomica
Law
(50.0)
-
Letters 23 6
(26.1)
Library Science 7 4
(57.1)
Mathematics 20 3
(15.0)
Physical Sciences 31 5
(16.1)
Psychology 27 6
(22.2)
Public Affairs and 10
Services
Social Sciences 42 21
(50.0)
Theology 10 4
(40.0)
InterdisciplinaryStudies
GRAND TOTAL 1,042 416
-
1
(100.0)
1 1 1
(33.3) (33.3) (33.3)
81
(37.9)
3
(60.0)
76
(14.8) (21.5) (2.5) (9.8) (9.2)
27 - 28 9
(30.0) (31.1) (10.0)
3 2 1 5(14.3) (9.5) (4.8) (23.8)
- 1 1
(50.0) (50.0)
5 1 1
(35.7) (7.1) (7.1)
- -
-
2
(25.0)
5 4
2
(25.0)
8
2
(25.0)
14(2.3) (1.9) (3.7) (6.5)
110 13 50 47
3 3 2 9
(13.0) (13.0) (8.7) (39.1)
3 - -(42.9)
2 12 3
(10.0) (60.0) (15.0)
5 1 17 3
(16.1) (2.2) (54.8) (9.7)
5 4 11 1
(18.5) (14.8) (40.7) (3.7)
10 -
(100.0)
1 15 4 1
(2.4) (35.7) (9.5) (2.4)
3 1 2
(30.0) (10.0) (20.0)
223 144 31 147 81(39.9) (21.4) (13.8) (3.0) (14.1) (7.8)
5 2

Table 20.0
EmplOyment Status by Major Discipline and Instiiutional Sectorfor Doctoral Degree Recipientsin Pennsylvania, 1975
Employed in Employed in
Field Prepared Other Field . Pursuing
Total In Outside pa Outside Advanced
Major Discipline Reported Pa. Pa. Pa. Pa. Degree Unemployed
STATE-OWNED
Education
Subtotal
STATE-RELATED
1
1
1
(100.0)
1
(100.0)
-
Biological 5 2 1 2
Sciences (40.0) (20.0) (40.0)
Education 87 43 30 7 6 1
(49.4) (34.5) ( 8.0) ( 6.9) ( 1.1)
Foreign 1 1
Languages (100.0)
Letters 14 9 3 1 1
(64.3) (21.4 ( 7.1) ( 7.1)
Mathematics 2 2
(100.0)
Physical 9 2 4 1 2
Sciences (22.2) (44.4) (11.1) (22.2)
Psychology 9 4 2 2 1
(44.4) (22.2) (22.2) . (11.1)
Public Affairs 2 2
and Services (100.0)
Social 5 2 3
Sciences (40.0) (60.0)
Subtotal 134 64 46 8 7 5 4
(47.8) (34.3) ( 6.0) ( 5.2) ( 3.7) ( 3.0)
STATE-AIDED
Biological 2 2
Sciences (100.0)
Psychology 5 4 1
(80.0) (20.0)
Subtotal 7 6 1
(85.7) (14.3)
PRIVATE
Business and 14 3 11
Management (21.4) (78.6)
aomputer and Informa- 7 2 5
tion Sciences (28.6) (71.4)
Education 17 9 6 1 1 .
(52.9) (35.3) ( 5.9) (5.9)
Engineering 33 11 16 - 6
(33.3) (48.5) (18.2)
Letters 5 4 1
(60.0) (20.0)
Mathematics 7 2 3 2
(28.6) (42.8) (28.6)
Physical 18 4 11 1 2
Sciences (22.2) (61.1) ( 5.6) (11.1)
Psychology 3 5 1 -(33.3) (55.6) (11.1)
Public Affairs 4 2 2and Services (50.0) (50.0
Subtotal 114 . 40 59 3 1 11(35.1) (51.8) ( 2.6) ( 0.9) ( 9'.6)

51
Table 21.0
Employment Status by Major Discipline,for Associate Degree Recipients for
Community Colleges in Pennsylvania, 1975
Ma or Disci line
Data Processing
Technologies
Health Services and Para-
Medical Technologies
Mechanical and Engineering
Technologies
Natural Science
Technologies
Business and Commerce
Technologies
Public Service-Related
Technologies
Arts and Science
Transfers
GRAND TOTAL
Employed in Employe4 in
Field Prepared Other Field Pursuing
Total In Outside In Outside Advanced
Re orted Pa. Pa. Pa. Pt. Degree UneRloyment,
134 81 -
(60.4)
1,117 849 19
(76.0) (1.7)
509 276 14
(54.2) (2.8)
86 43 1
(50.0) (1.2)
951 508 21
(53.4) (2.2)
802 301 13
(37.5) (1.6)
1,532 142
(9.3)
5 131 2,200 68
(42.9) (1.3)
16 22 15
(11.9) (16.4) (11.2)
33 1 116 99
(3,0) (0.8) (10.4) (8.8)
53 4 114 48
(10.4) (0.1) (22.4) (9.4)
4 1 31 6
(4.7) (1.2) (36.0) (6.9)
71 8 259 84
(7.5) (0.8) (27.2) (8.8)
55 10 338 85
(6.9) (1.2) (42.1) (10.6)
156 24 1,196 14
(10.2) (1.6) (78.0) (0.9)
388 48 2,076 351
(7.6) (0.9) (40.5) (6.8) 55

Employment Status by Major Discipline for Associate Degree Recipients for
Proprietary Institutions in Pennsylvania, 1975
Majorliscipline
Total
Reported
Employed in
Field Prepared
In
Pa.
Outside
Pa.
Data Processing 172 112 11
Technologies (65.1) (6.4)
Health Services and Para- 53 51 1
Medical Technologies (96.2) (1.9)
Mechanical and Engineering 793 365 193
Technologies (46.0) (24.3)
Natural Science
Technologies
Business and Commerce 950 667 103
Technologies (70.2) (10.8)
Public service-Related 25 22
Technologies (88.0)
Arts and Science
Transfers
GRAND TOTAL 1,993 1,217 308
(61.1) (15.5)
Enloyed in
Other Field Pursuing
In Outside Advanced
Pa. Pa. Degree Unemployment
10
(5.8)
82 17
(10.3) (2.1)
40
(4.2)
Mb
5H
34
(2.9) (19.8)
(1.9)
20 116
(2.5) (14.6)
56
(5.9)
OP
84
(8.8)
3
(13,0)
132 17 82 237
(6.6) (0.9) (4.1) (11.9)
56 57

Table 21.2
Employment Status by Major Discipline for Associate Degree Recipients for
Four-Year Colleges and Universities, 1975
Employed in Employed in
_LLipreilni_ Other Field Pursuing
Total In Outside In Outside Advanced
Major Discipline Reported Pa. Pa. Pa. Pa, Dgree Unemployment
-
5
(3,2)
6
(8.7)
1
(3.5)
Data Processing
Technologies
Health Services and Para-
Medical Technologies
2
155
1
(50.0)
106
(68.4)
-
6
(3.9)
-
-
-
-
1
(50,0)
38
(24.5)
Mechanical and Engineering 69 14 3 5 - 41
Technologies (20.3) (4.3) (7.3) (59.4)
Natural Science 28 19 - 4 - 4
Technologies (67.9) (14.3) (14.3)
Business and Commerce 208 150 10 5 1 17
Technologies (72.1) (4.8) (2.4) (0.5) (8.2)
Public Service-Related 47 24 - 11 2 9
Technologies (51,1) (23.4) (4.3) (19.1)
Arts and Science 49 1 1 6 4 36
Transfers ( 2.0) (2.0) ,(12.2) (8.2) (73.5)
GRAND TOTAL 558 315 20 31 7 146
25
(12.0)
39
(56.4) (3.6) (5,5) (1.3) (26.2) (7.0)
58

Table 22.0
Employment Status by Degree Field for Baccalaureate DegreeRecipients for All Institutions in Pennsylvania, 1975
HEGIS Degree FieldTotal
Reoorted
Employed inField Prepared
Employed inOther Field Pursuing
AdvancedDegree
16
Unemployed
15
AllOthers
20
InPa.
OutsidePa.
In_Pa-
14
-
OutsidePa.
5
1
AGRICULTURE AND163
1
62 31
-
NATURAL RESOURCES Total
Agriculture, generalAgronomy (14eld ctops, andssc,rallr03) 24 15 1 3
Animal acieuce (husbandry) 26 8 4 2 4 1
Dairy ...cienee (husbandry') 16 6 ..5 7 2
Hcrticulture (fruit andvegetable production) 21 8 6 1 - 1 1 4
Ornamental horticulture(floriculture, nursery sci.) 36 18 9 4 - 2 1 2
Food science and technology 11 3 4 2 - - - 2
Natural resources management 27 4 2 5 1 4 10 1
Range management 1 - - - 1 - - -
ARCHITECTURE AND ENVIRON-92
23
20
6
13
5
4
3
2 15
1
9
4
29
4
min DESIGN Total
Environmental design, generalArchitecture 37 10 6 - 2 10 2 7
Interior design 4 1 - 1 1 1 -city, community, and regionalplanning 16 3 1 2 1
Other (Environmental studies) 12 1 1 1 9
AREA STUDIES Total 37
1
3
- -
2
-
13
1
6
-Asian studies, generalEast Asian studies 4 - - - 1 - 3
Russian and Slavic studies 8 - - 1 5 2
American studies 23 2 1 1 4 7 1 7
Other (French area) 1 1 - - -
BIOLOGICAL SCIENCE Total 1,241
1,206
189
182
70
69
71
70
44
44
395
379
183
179
289
283Biology, generalBotany, general 1 - 1 - - - -Bacteriology 3 - - - 1 1 1
Zoologyeneral 2 - - 2 - -Physiology, human and animal 1 - 1 -Microbiology 1 - - - - 1
Anatomy 1 - - - 1
Histology 1 1
Biochemistry 16 5 - 7 2 2
Molecular biology 1 .- 1
Cell biology (cytology,cell physiology 1 - - - 1
Marine biology 2 - - 2
Neurnsciences 1 - - - 1
Other (Environmental) 4 1 1 1
BUSINESS AND3,50)
439
1,325
192
3%
27
236
22
55
8
222
27
602
45
664
118
MANAGEMENT Total
Business and commerce,geTeralAccoanting ..,. 1,334 563 197 85 15 66 214 194Businass statiWca 2 1 - 1 - - - -BenkADA and finance 91 24 23 9 2 9 12 12
Businse management anadyinistration 1,133 392 91 66 20 84 211 269
Mbr6eting and_purchasing 260 86 24 26 4 la 58 44
".ranoportation and publicutilities 13 11 - 2 -Insurance 14 7 4 2 1
International business 1
Secretarial studies (bacca-laureate 6 higher programs 17 8 3 - 1 4 1
Personnel management 1 - - 1 - -Labor 6 industrial relations 25 8 2 5 1 8 1
Business economics 158 30 21 16 3 16 48 24
Other (Finance) 12 3 3 4 1 1 - -
6 043
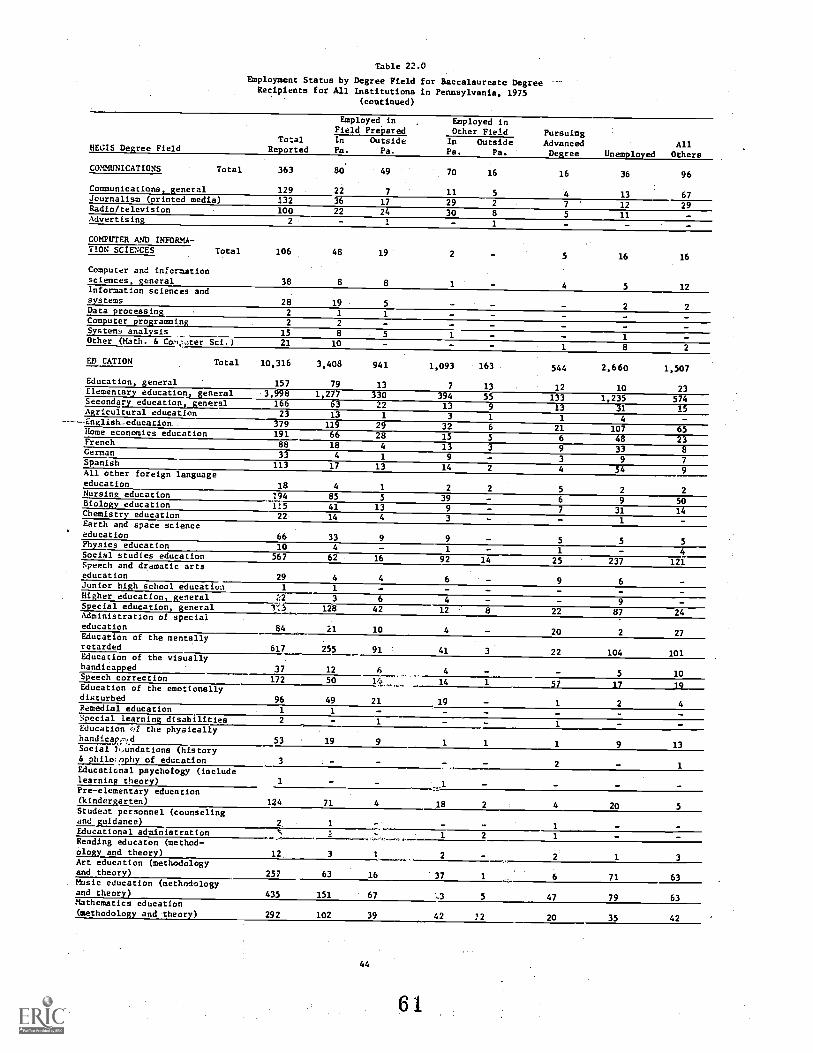
Table 22.0
Employment Status by Degree Field for Baccalaureate DegreeRecipients for All Institutions in Pennsylvania, 1975
(continued)
REGIS Degree Field
COMMUNICATIONS Total
Communications, generalJournalism (printed media)Radio/televisionAdvertising
COMPUTER AND INFORMA-TION SCIENCES Total
Computer and informationsciences, generalinformation sciences andsystemsData processingComputer programmingSystems analysisOther (Math. 6 Comj.ater Sci.)
ElDi CATION Total
Education, generalElementary education, generalSecondary education, generalAgricultural education
----English-educationHome economics educationFrenchGermanSpanish
All other foreign languageeducationNursing educationBiology educationChemistry educationEarth and space scienceeducationFhysics educationSocial studies educationSpeech and dramatic artseducationJunior high school educatioaHigher education, generalSpecial education, generalAdministration of specialeducationEducation of the mentallyretardedEducation of the visuallyhandicappedSpeech correctionEducation of the emotionallydisturbed
Remedial educationSpecial learning disabilitiesEducation of the physicallyhandicaprrd
Social 7,,undations (historyphilo.ophy of education
Educatitnal psychOlo gy (includelearninp tbeory)Pre-elementary education(kindergarten)Student personnel (counselingand guidance)
Educational administrationReading educaton (method-ology and theory)Art education (methodologyand theory)Music education (methodologyand theory)Mathematics education(methodology and theory)
TotalReported
Employed inField Prepared
Employed inOther Field Pursuing
AdvancedDegree Unemployed
AllOthers
In
Pa.
OutsidePa.
In
Pa.Outside
Pa.
363
129
80
22
49
7
70
11
16
5
16 36
13
96
67132 36 17 29 2 7 12 29100 22 24 30 8 5 11
2 - 1 - 1
106
38
48
8
19
8
2
4
16
5
16
12
28 19 5 2 22 1 12 2
15 8 5 1 121 10 1 8 2
10,316
157
3,408
79
941
13
1,093
7
163
13
544
12
2,660
10
1,507
233,998 1,277 330 394 55 133 1,235 574
166 63 22 13 9 13 31 1523 13 1 3 1 1 4 -
379 119 29 32 6 21 107 65191 66 28 15 5 6 48 2388 18 4 13 3 9 33 833 4 1 9 - 3 9 7
113 17 13 14 2 4 54 9
18 4 1 2 2 5 2 2194 85 5 39 6 9 50115 41 13 9 7 31 1422 14 4 3 - 1 -66 33 9 9 5 5 510 4 - 1 1 4
567 62 16 92 14 25 237 121
29 4 4 6 9 6
3 6 4 93'13. 128 42 12 8 22 87 24
84 21 10 4 20 27
617 255 91 41 22 104 101
37 12 4 5 10172 50 14 14 57 17 19
96 49 21 19 1 2 41 1
2 1 1
53 19 1 1 1 9 13
3 2 1
1
124 71 4
,.1
18 2 4 20 5
1
3 1 2
12 3 1 2 - 1 3
257 63 16 37 1 71 63
435 151 67 5 47 79 63
292 102 39 42 72 20 35 42
44
6 1
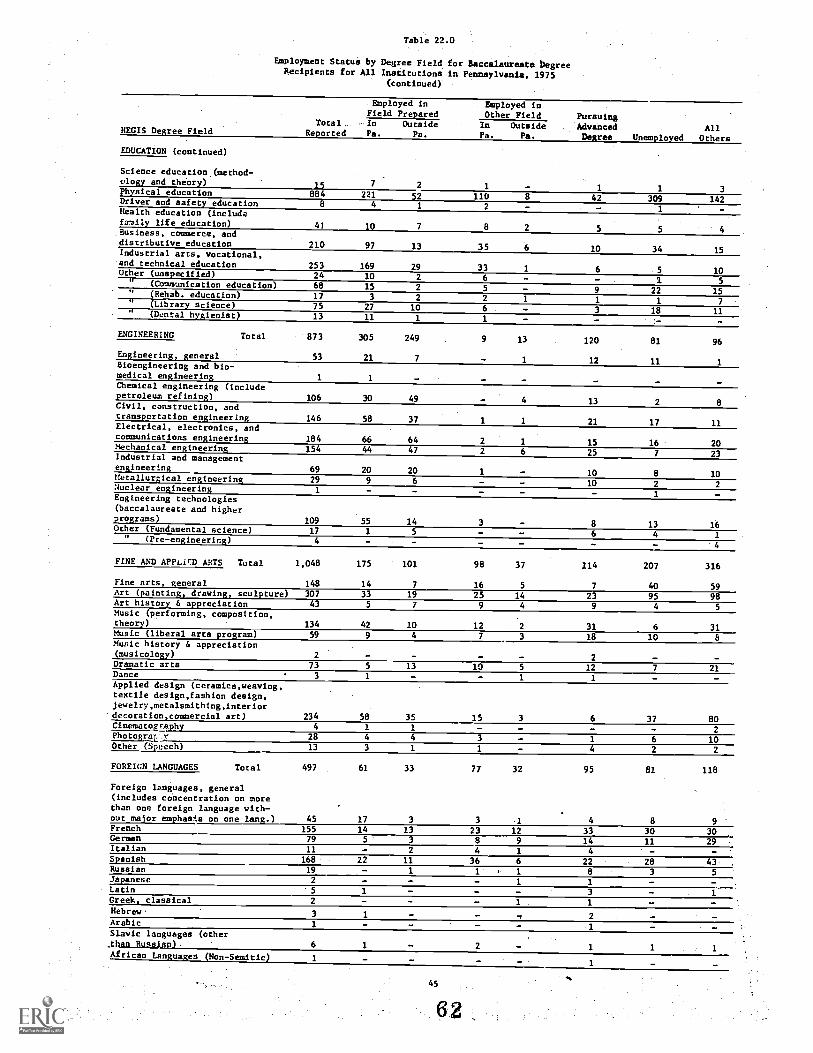
Table 22.0
Employment Status by Degree Field for Baccalaureate begreeRecipients for All Institutions in Pennsylvania. 1975
(continued)
Employed in Employed inField Prepared Other Field
, PursuingTotal_ - In Outside In Outside Advanced AllREGIS Degree Field Reported Pa. Pa. Pa. Pa. Degree Unemployed Others
EDUCATION (continued)
Science education (method-elogy and theory)physical educationDriver and safety educationHealth education (includefanaly life education)Business, commerce, anddistributive educationIndustrial arts, vocational,and technical educationOther (unspecified)
" (Communication education)" (Rehab. education)" (Library science)" (Dental hygienist)
ENGINEERING Total
Engineering, general
Bioengineering and bio-medical engineeringChemical engineering (includepetroleum refining)
Civil, construction, andtransportation engineeringElectrical, electronics, andcommunications engineeringMechanical engineeringIndustrial and managementengineeringMetallurgical engineeringNuclear engineeringEngineering technologies(baccalaureate and higherprograms)Other (Fundamental science)
" (Pre-engineering)
FINE AND APPLirD ARTS Total
Fine arts, generalArt (painting, drawing, sculpture)Art history 6 appreciationMusic (performing, composition,theory)
Music (liberal arts program)Music history 6 appreciation(musicology)Dramatic artsDanceApplied design (ceramics,weaving,textile design,fashion design,jewelry,metalsmithing,interior
'decoration,commercial art)CinematographyPhotogral,.r
Other (Speech)
FOREIGN LANGUAGES Total
Foreign languages, general(includes concentration on morethan one foreign language with-out major emphasis on one lang.)FrenchGermanItalianSpanishRussianIflpanese
LatinGreek, classicalHebrew.
ArabicSlavic languages (other_Chan Russian).
African Languages (Non-Semitic)
15
.
7 2 1 1 1 3884 221 52 110 a 42 309 142
a 4 1 2 - 1 -
4, 10 7 8 2 5 5 4
210 97 13 35 6 10 34 15
253 169 29 33 1 6 5 1024 10 2 6 - 1 568 15 2 5 - 9 22 1517 3 2 2 1 1 1 775 27 10 6 3 18 1113 11 1 1 - - :- -
873
53
305
21
249
7
9 13
1
120
12
81
11
96
1
1 1 - - -
106 30 49 - 4 13 2 8
146 58 37 1 1 21 17 11
184 66 64 2 1 15 16 20154 44 47 2 6 25 7 23
69 20 20 1 - 10 8 1029 9 6 - 10 2 21 - - - 1
109 55 14 3 - 8 13 1617 1 5 - 6 4 14 - - - - - 4
1,048
148
175
14
101
7
98
16
37
5
114
7
207
40
316
59307 33 19 25 14 23 95 9843 5 7 9 4 9 4 5
134 42 10 12 2 31 6 3159 9 4 7 3 18 10 8
2 - - - 2 -73 5 13 10 5 12 7 213 1 - - 1 1
234 58 35 15 3 6 37 BO4 1 1 - - - - 2
28 4 4 3 - 1 6 1013 3 1 1 4 2 2
497
45
155
61
17
14
33
3
13
77
3
23
32
1
12
95
4
33
81
a
30
118
9
3079 5 3 8 9 14 11 2911 - 2 4 1 4 - -
168 22 11 36 6 22 28 4319 - 1 1 . .1 a 3 52 - - 1 1 - -5 1 - 3 12 1 1
3 21 1
6 1 2 1 1 1
11

Table 22.0
Employment Status by Degree Field for'Baccalaureate DegreeRecipients for All Institutions in Pennsylvania, 1975
(continued)
HECIS Degree FieldTotal
Reported
Employed inField Prepared
Employed inOther Field Pursuing
AdvancedDegree Unemployed
AllOthers
InPa.
OutsidePa.
In
Pa.Outside
Pa.
HEALTH PROFESSIONS Total 1,069
1
474 131 20 4 123 107
1
213
Health professions, generalHospital and health careadministration 2 1 1Nursing (baccalaureate andhigher programs) 416 208 62 6 22 52 66Dentistry, D.D.S. or D.M.D.degree 6 6Medicine. M.D. degree 34 32 2Osteopathic medicine,B.O. degree 38 32Pharmacy 200 88 44 13 55Physical therapy 1 1
Dental hygiene (baccalaureateand higher programs)
3Public health 1 1Medical record librarianship 17 7 a 1 1Podiatry (Pod.D. or D.P.)or podiatric medicine (D.P.M.)
1Veterinary medicine (D.V.M.degree) 3 2 1Speech pathology & audiology 23 9 2 2 1Chiropractic 1 1Clinical social work (medicaland psychiatric and special-ized rehabilitation services) 15 9 1 2 3Medical laboratory techno-logies (baccalaureate andhigher programs) 182 114 15 1 6 6 39Dental. technologies(baccalaureate and higher2rograms) 3 1Other (Inhalation therapy and
Public school nursing) 120 35 2 10 27 44
HOME ECONOMICS Total 245
135
75
37
22
5
19
: 16
11
8
20
14
34
17
64
38Home economics, generalClothing and textiles 6 2 - 2 2Family relations and childdevelopment 1 1
Foods and nutrition (includedietetics1 81 34 3 1 5 11 18Institutional management andcafeteria management
2Other (unspecified) 14 2 4
LAW Total
Law, general
52
47
5
3
1 42
40 1
3
3other (unspecified) 5 2 1 2
LETTERS Total 1,300
757
171
123
74
37
205
111
80
42
266
112
187
131
317
201English, generalLiterature, English 172 11 4 22 14 34 17 70Comparative literature 4 3 1Classizs 15
1.
Lingoistics (include phonetics,semantics, and philology) 1
Speech, debate, and forensicscience (rhetoric and publiczddress) 51 4 1 14 1 14 9Creative writing 3 1 1Teaching of English as aforeign language 11 2 1 4 2 2Philoso2hy 103 6 2 25 7 41 14Religious studies (excludetheological professions) 177 23 2d 24 15 53 8 26'Other (Technical writing) 6 3 2 1
LIBRARY WIENCE Total
Library science, gpneral
119
118
36
35
17
17
19
19
1
7
21
21
18
18
Other (Unspecified) 1
46
6 3

,
Table 22.0
Employment Status by Degree Field for Baccalaureate DegreeRecipients for All Institutions in Pennsylvania, 1975
(continued)
HEGIS Degree FieldTotal
Reported
Employed inField Prepared
Employed inOther Field Pursuing
AdvancedDegree Unemployed
AllOthers
In
Pa.
OutsidePa.
In
Pa.
Outside.Pa.
MATHEMATICS Total 611 157 60 56 28 105 80 125
Mathematics, general 601 155 59 56 28 99 80 124Statistics, mathematicaland theoretical 1 - 1 - -Applied mathematics 5 2 1 - 1 - 1Other (unspecified) 4 - - 4 - -
PHYSICAL SCIENCES Total 645 103 67 35 22 266 54 98
Physical sciences, general a 1 1 - 3 1 2Physics, general (excludebiophysics) 134 18 15 8 6 62 8 17Chemistry, general (excludebiochemistry) 323 55 27 15 6 147 25 48Inorganic chemistry 3 3 -Pharmaceutical chemistry 2 - 2Atmospheric sciences andmeterologv 15 - 5 7 1 2Geology 79 11 12 2 6 19 8 21Earth sciences, general 53 11 6 5 3 13 8 7Other (Environmental Electronics) 28 7 2 4 1 10 1
PSYCHOLOGY Total 1,411 239 63 189 45 299 279 297
Psychology, general 1,364 228 59 184 43 279 277 294Experimental psychologyf.animal and human) 2 - 2Clinical psychology 4 - 4ZE:chology for counseling 16 5 1 10Social psychology 3 2 1Developmental psychology 1 - 1 -Other (unspecified) 21 6 4 4 2 1 1 3
PUBLIC AFFAIRSAND SERVICES Total 491 130 39 51 7 33 93 138
Public administration 9 1 1 - 7 -Parks and recreation mgt. 58 5 2 3 - 7 41Social work and helpingservices (Other thanclinical social work) 250 74 13 26 2 21 65 49Law enforcement & corrections(bacc. and higher programs) 155 46 15 22 4 1 19 48Other (unspecified) 19 4 8 - 4 2
SOCIAL SCIENCES Total 3,360 409 153 488 215 595 556 944
Social sciences, general 337 35 19 34 11 26 46 166Anthropology 122 17 3 17 a 29 12 36Archaeology 11 - - 1 1 6 - 3Economics 226 42 22 32 10 52 27 41History 659 57 25 120 59 123 108 167Geography 82 11 2 11 11 7 14 26Political science b govt. 793 61 30 112 57 204 118 211Sociology 859 125 40 120 51 120 173 230Criminology 197 53 7 23 5 13 45 51International relaLlons 19 2 1 3 - 1 7 5Urban studies 24 2 1 11 2 4 4Other (unspecified) 31 4 3 4 2 12 2 4
THEOLOGY Total 215 46 42 16 9 77 5 20
Theological professions, gen. 115 9 26 5 5 55 1 14Religious music 11 2 3 - 1 4 1 -Religious education 56 27 9 8 2 7 1 2Other (unspecified) 33 8 4 3 1 11 i 2 4
INTERDISCIPLINARYSTUDIES Total 311 51 11 48 16 58 73 54
General liberal arts 6 ac i. 139 24 2 38 9 27 ! 20 19Biological 6 physical sci. az 9 3 5 1 20 24 20Humanities and social sci. 66 13 2 2 4 7 29 9Other (unspecified) 24 5 4 3 2 4 - 6
47
6 4

Table 22.1
Employment Status by Degree Field for Daccalgure"e begreeReciplents for State-Owned Institutions in PermOiNtlia, 1975
HEGIS DB ree FieldTotal
Re orted
Eoployed inField Prepared Pursuing
AllOthers
In
Pa.OutsidePa. Pa.
Advancedf0 De ree Unem lo ed
AGRICULTURE AND
21 4 2 5 2 8
NATURAL RESOURCES
Natural*resources manage-ment (Conservation)
ARCHITECTURE AND ENVIRON-
39
13
6
3
4
2
3
3
2
3
,
1
MENTAL DESIG:: Total
Environmental design, generalCity. community, and regional?Leming 14 3 1 1Other (Environmental studies) 12 1 1
BIOLOGICAL SCIENCES Total 308
303
42
41
14
14
21
21
32 41
40
158
156Biology, general
136I2tLe.
11 1
2
BUSINESS & MANAGEMENT Total 922
71
304
24
68
1
51 28 179
1
284
44
Business and commerce,generalAccounting 338 133 41 13 7 68 74Banking and finance 2 1
Business management andadministration 402 115 20 95 130Marketing and purchasing 61 21 4 9 20Business economics 48 10 2 11 2 6 16
CaOINNICATIONS Total 84
73
10 6
4
5
4
2 9
1 6
52
49Communications eneralJournalism ( rinted media) 11
1 3 3
COMPUTER AND INFORMA-
43
8
20
2
1 9
3
TION SCIENCES Total
Computer and informationsciencesi_generalSystems anal sis 14 8Other (Math & Com uter Sci.) 21 10 8 2
EDUCATION Total 7,892
3 049
2,461
883
648
206
880
288
61 347 2,228 1,261
489Elementar education generalSecondargicadtmeneral 67 15 8 6 22 10Agricultural education 20 12 1 2 -,-$'-N----------i----$
3-
English education 233 72 11 24 -,..-%'-'-----------2-- .j,..---,__________4__,, 67 53
Home economics education 158 57 11 13 7l---------f-.-----P 47 ,.._.. 23French- 69 16 2 12
--
---1 ------"..--`=-----7.-----2-1----j.---7German 26 4 - 6 2 7
, Spanish 92 15 9 12,_:,,,-,,__,
3 44 9All other foreign languageeducation (Russian) 9 3 1 1 2Nursing education 192 84 4 39 6 9 50Biology education 105 35 10 9 30 14Chemistry educatior 16 9 4 3Earth & s ace science education 60 30 8 9 4 4 5itysics education 6 . 3 2Social studies education 462 47 10 81 195 110Speech and dramatic artseducation (communication) 19 2 3 6
S3
Special education, general 245 107 36 7 46 24Education of the mentally retarded 611 250 91 41 22 103 101Education of the visuallyhandicapped 37 12 6 4 5 10Speech correction 171 50 14 14 17 19Education of the emotionallydisturbed 96 49 21 19 2 4Education of the physicallyhandicapped 53 19 9 1 9 13Pre-elementary education(kindergarten) 36 14
1 15
48
6 5

Table 22.1
Employment Status by Degree Field for Baccalaureate DegreeRecipients for State-Owned Institutions in Pennsylvania,
1975(continued)
Employed in Employed inField Prepared Other Field Pursuing
Total In Outside In Outside Advanced AllHEGIS De ree Field Re arced Pa. Pa. Pa. Pa. De ree Unem lo ed OthersEDUCATION (contioPed)
Art education methodologyand theory)
Music education (methodologyand theory)Mathematics education(methodology and theory)Science education (method-ology and theory)Physical educationDriver and safety educationHealth education (includefamily life education)
Business, commerce, anddistributive educationIndustrial arts, vocational,and tezhnical educationOther (Communication)
" (Rel.ab. Education)" (Library Science)
Hygienist Ed.)
ENGINEERING
Other (Pre-engineering)
FINE AND APPLIED ARTS Total
Fine arcs, generalArt (painting, drawing,
:
sculptureMusic (performing, compo-sition, theory)Music (liberal arts program)Dramativ.. arts
Applied design (ceramics,weaving, textile design,fashion design, je,:welrY,
metalsmithing, interiordecoration, cot,ercial art)Other (Speech)
FOREIGN LANGUAGES Total
FrenchGermanSpanishRussian
Non-Russian Slavic language
HEALTH PROFESSIONS Total
Nursing (baccalaureate andhigher programs)Dental hygiene (baccalaureateand higher programs)Speech pathology & audiologyMedical laboratory technol-ogies (baccalaureate andhigher programs)Ocher (Inhalation Therapy)Ocher (FLiblic School Nursing
HOME ECONOMICS
Home economics, generalot ng an text es
Total
ramily relations and childdevelopmentFoods and nutrition (includedi,tetics)
institutional management aadc"feteria managementOther (child option)
189 50 13 34 - 5 32 55
242 89 38 18 2 16 54 25
217 76 29 39 3 12 30 28
12 5 2 - 1 1 3845 198 48 105 6 41 306 1418 4 1 2 - 1
18 3 2 4 4 2 3
145 62 7 30 6 6 24 10
211 130 29 31 1 6 4 1068 15 2 5 - 9 22 1517 3 2 2 1 1 1 775 27 10 6 - 3 18 1113 11 1 1 -
4
233
78
21
8
3 11
8
_
4
1
5
-
94
26
4
95
35
90 3 1 2 1 62 21
15 2 1 - 127
8
1
21
- 2
5
4
33 7 3 -4 18
2 - - -
153
37
8
2
3
1
28
9
6
2
17
3
31
10
60
1033 1 1 3 2 3 3 2077 5 1 16 2 9 17 275 - - - 2 - .: 31 - - 1 -,
16
11
89
3
5
2
12 1 4 13 .44
33
23 9 2 2 1 9
81 48 1 3 261931
14
152
83
6 1
154
60
45
15
15
1
13
10
2 9 19 , 51
28
1 1
67 27 7 3 5 10 15
6 3 1 214 4 2 4 4
49
66

Table 22.1
Employment Status by Degree Field for Baccalaureate DegreeRecipients for State-Owned Institutions in Pennsylvania, 1975
(continued)
HEG1S Degree FieldTotal
Reported
Employed inField Prepared
Employed inOther Field Pursuing
AdvancedDegree Unenployed
AllOthers
In
Pa.Outside
Pa.
In
Pa.
OutsidePa.
LETTERS Total 283 55 4 40 6 28 57 93
English, general 222 47 2 28 5 19 39 82Literature, English 15 4 - 1 3 7Speech. debate, and forensicscienca (rhetoric and publixaddress) 18 2 1 4 3 5Philosophy 28 2 1 7 1 3 6
-IERARY SCIENCE
Library s,_ian:a, general 113 '" 34 17 19 5 20 18
:EnAI:cs Total 270 49 24 29 15 21 51 81
Mathymacics, general 268 49 23 29 15 21 51 80Applied mathematics 2 - 1 - -
PHYSICAL SCIENCES Total 195 43 23 16 6 46 26 35
Physical sciences, general 5 1 - 2 2Ph:sics, general (excludebiophysics)
. 13 1 4 - 13 5 5Che,istry, general (excludebio,hemistrv 68
.5
18 6 4 2 17 10 11Geology 37 6 10 1 2 . 5 4 9Earth sciences. general 43 11 6 5 2 6 6 7Otier (Environmental) 9 2 - 2 - 3 1 1
PSYCD01061
Psychology, general 480 70 9 60 12 51 127 151
PUBLIC AFFAIRSAN) SERVICES Total 245 43 16 18 2 4 60 102
?ArL,:s .7J recreation
r.anagyment 58 5 2 3 - 7 41S,:cia: York and helpingerYi:es Other than:linical social work/ 128 27 4 8 1 3 42
43enforcement & corrections(Caccalaoreate and higherprJerams) 45 7 3 7 1 9 18-Dther (Safety management) 14 4 7 - - 1 2
SOCIAL SCIENCES Total 1,187 147 44 143 42 99 227 485
Social sciences, general 190 10 11 14 5 12 . 20 : 118Anthro,ology 66 15 3 6 3 8 9 22Economics 66 18 5 9 2 3 12 17Histor: 150 17 2 21 9 19 28 , 54Geography 77 11 2 8 10 7 13 26Political science andzovernment 221 28 9 27 3 27 "32 955,:cioloy 302 26 6 47 10 20 93 100Criminology 98 21 5 5 - 3 17 47International relations 3 - - 1 - - 2Urban stodles 14 1 1 5 - 3 4
INTERDISCIPLINARY STUDIES Total 124 21 5 5 5 13 42. 33
General liberal. arts 6 sciences 19 6 - - 7 6
BI:locical & physical sciences 66 8 3 2 1 8 24 20Humanities 6 social sciences 38 7 2 2 4 5 11 7.
Other Dental hvgiene) 1 1 _ - -
6 7
50

Table 22.2
Employment Stettis by Ngree F140.4 for Baccalaureate DegreeRecipients for State-Related Institutions Is Peassylvan1a 1975
HEGIS Oegree FieldTotal
Reported
Employed inField Prepared
Etp1oyed inOther Field Pursuing
AdvancedDegree Unemployed
All
Others
InPa.
OutsidePa.
InPa.
OutsidePa.
AREA STUDIES
8 2 2 4American studies
BIOLOGICAL SCIENCE.8
28 6 7 2 10 2 1biology, general
BUSINESS AND
226
7
125
1
23 39 8
2
11
2
18 2MANAGEMENT Total
Business and commerce,
atmulAccounting 102 65 9 12 1 8Business statistics 2 1 - 1Banking and finance 9 1 1 2 - 3Business management andadministration 59 37 6 10 3 1 2Marketing and purchasing 28 11 3 10 1 3Insurance 4 2 1 1 - -Labor and industrial relations 14 5 2 3 1 3Other (unspecified) 1 1 -
COMMUNICATIONS Total 89
40
27
16
15
3
28
13
5
1
4
2
10
5Journalism (printed media)Radio/television 49 11 12 15 4 2 5
COMFUTER AND INFORMA-
11
6
9
4
1
1
TION SCIENCES Total
Computer and informationsciences, generalInformation sciences andsystems 5 5
EDUCATION Total 390
150
234
78
24
8
72
36
a
3
11
5
31
19
10
1Elementary Education, generalSecondary education, general 28 13 5 6 1 1 2Special educati.n, general 2
1
1 - 1
1
-
-- -
. - -,Educational psychology (includelearning theory)Pre-elementary education(kindergarten) 79 49 4 12 2 3 5 4Student personnel (counselingand guidance 2 1 1Reading education (method-ology and theory) 1 1Art education (methodologyand theory) 3 2 - 1Music education (methodolgyand theory) 4 4
Mathematics education(methodology and theory) 9 r 1 ._ 1Science education (method-ology and theory) 3 2 1 - -Physical education 39 23 4 5 2 1 3 1Health education (includefamily life education) 6 2 3 - 1Business, commerce, anddistributive edtciation 16 10 2 a 1Industrial arts, vocational,and technical education 41 39 2Other, (unspecified) 6 3 - 1 1 1
68
51

Table 22.2
Employment Status by Degree Field for Baccalaureate DegreeRecipients for State-Related Institutions in Pennsylvania, 1975
(continued)
HEG1S Degree FieldTotal
Reported
Field PreparedEmployed inOther Field Pursuing
AdvancedDegree
.
UnemployedAll
Others
In
Pa.Outside
Pa.In
Pa.Outside
Pa.
EN(INEERING
39 22 10 3 3 1
EluAneering technologies(baccalaureate and higherprograms)
FINE AND APPLIED ARTS Total 71
19
25
4
3
1
15
4
5
3
14
4
a
2
1
1
Art (.paintln,4. drawing,sialturelArt nii:;r7 -at ip;recia-
8 2 4 2,:erfirniai, compo-
s.i'ion, 25 19 1 3 1 1libtrai arts program) 5 3 2
Music history and apprecia-tion (musicolagy) 1 - 1Dramatic arcs 13 2 1 3 2 2 3
FOREIGN LOGUAGES Total 21
3
2 1 9
1
1
1
6 1
1
1
FrenchGerman 1 1Italian' 6 1 3Spanish 6 1 3 1Russian 2Hebrew 3 1 2
HEALTH PROFESSIONS -Total'
Phvgical therapy 1 1Dental hygiene (baccaLaurcateand higher programs) 2 2Medical record librarianship
LAW Total
Law, general
1
4
1
1
2
1j1cher, (unsnecified) 3 1 2
:.47TERS Total 73
54
a
7
1 36
24
3
3
6
3
13
11 6English, generalSpeech, debate, and forensicscience (rhetoric and publicaddress) 10 1 6 2Philosophy s - - 4Religious studies (excludetheological professions) 3 1 2
MATHLMATICS
13 5 1 5 1 1Mathematics, general
PHYSICAL SCIENCES, Total 19
3
'' 7
1
2
- 1 -
9
1
Pbysics. general (excludebiophysics)aemistry, general (exclrdebiochemistry 13 6 2 5Geology 3 - 3
PSYCHOLOGY Total
f*sechologe, general
106
105
30
30
2
2
5
5
26
25
6
6
2
2Lxperimental psychology(animal and human) 1 1
6952
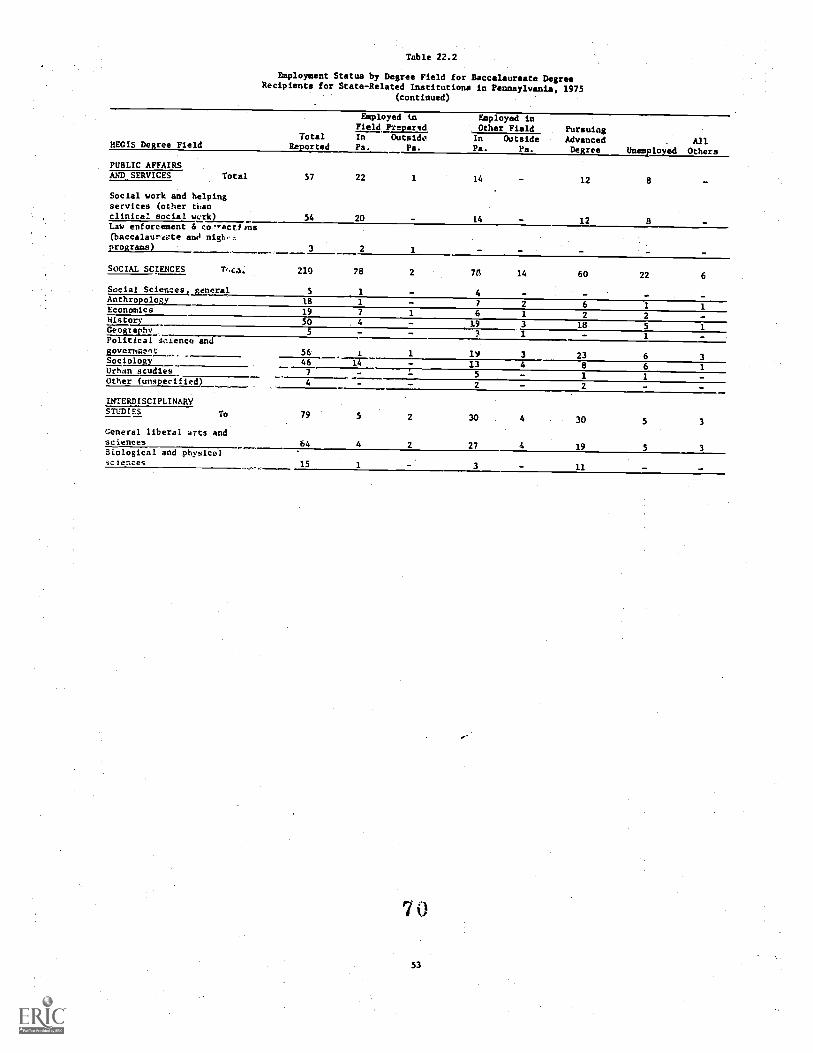
Table 22.2
Employment Status by Degree Field for Baccalaureate DegreeRecipients for StateRelated Institutions in Pennsylvania. 1975
(continued)
HMS Degree Field
PUBLIC AFFAIRSAND SERVICES Total
Social work and helpingservices (other thanclinica social wcrk)Law enforcement .5 co.-Yect,,na(baccalaureiae and nigh,:iprograms) *SOCIAL SCIENCES Tr,C4
Social Sciences,. generalAnthropologYEconomicsHistoryGeogtaphyPolitical acience and
Ci_ESt1111:2
SociologyUrban studiesOther (unspecified)
INTERDISCIPLINARYSTLDIES To
General liberal arts andsciencesBiological and physicolsciences
TotalReported
Employed tnField Prepared
Employed inOther Field Pursuiag
AdvancedDegree
,
UnemployedAll
Others
In
Pa.Outside
Pa.In
Pa.Outside
Pa.
57 22 1 14 12 a
54 20 14 12
3 1
210 78 2 78 14 60 22 6
418 1 7 2 1 119 7 1 6 1 2 250 4 19 3 18 5 15 3 1 1
56 1 1 19 3 23 6 346 14 13 4 a 67
,
5 1 14 2 2
79 5 2 30 4 30 5 3
4 2 27 4 19 5 3.64
Is 1 3 11
7 0
53

Table 22.3
Employment Status by Degree Field for Baccalaureate DegreeRecipients for State-Aided Institutions in Pennsylvania, 1975
REGIS Degree FieldTot41
Reported
Employed inField Prepared
Employed inOther Field Pursuing
Advancedraemploycd
AllOthers
:n
Pa.Outside
Pa.In
Pa.Outside
Pa.
AGRICULTURE AND
133
24
57
15
29
1
9
-
2
2
_Degree
12
3
5
-
19
3
NATURAL RESOURCES Total
Agronomy (field crops. andmica ,k2a.29_____
Animal scien:.e (husbardrv) 26 8 4 2 - 4 1 70airv science (hubandrvf 16 6 5 - 2 2 1Horticil,:ur,..(fruit andyb1 e production) 21 8 6 I - 1 1 4..Ornamental horticulture(floriculture, forsery. 3S 17 9 4 2 1 2Fond science and t.HinolfJ(i.r 11 3 4 2 - 2
ARCHITECTURE AND ENVIRON-
101 3
'!ENTAL DESIGN
Ets,ironmental design, general
BIO:DCICAI SCIENCES
39 9 5 4 3 9
AND
bu,ine:. management andadministrAtiQn 35 17 1 7 10
Reading ,duc.aion (mEthod-olo:!v 'and theory) 11 3 1 2 1 3
FINE AND APPLI;D
202
23
36
4
22
1
11 1
-
6 6
2
120
16
ARTS Total
Fine arzs, generalArt (painting, drawing,,,cullture 69 7 4 7 5 2 43Applied design (ceramics,weJving, textile design,fashion design, jewelry,metalsmithing, interiordecoration, commercial art) 84 18 13 2 - 1 1 49Cinematography 4 1 1 - 2Photography 17 4 3 2 - 8Other (unspecified) 5 2 1 2
HEALTH PROFESSIONS Total 76
56
.48
35
15
1,
2
2
11
8
Nursing 'baccalaureate andnrolrams)
Ne,!:eat laboratory techuo-fo4fes (baccalaureete andnigher nrograms) 20 13 4 3
.
FHTS.CAL SCIENCES
3 1goncial (*occludeochemi;:ro
7154

Table 22.4
Employment Status by Degree Field for Baccalaureate DegreeRecipients for Private Institutions in Pennsylvania, 1975
HECIS Degree FieldTotal
Reported
Employed inField Prepared
Employed inOther Field Pursuing
AdvancedDegree Unemployed
AllOthers
In
Pa.Outside
Pa,
In
Pa.Outside
Pa.
AGRICULTURE AND
Total 9 3 2 1NATURAL RESOURCES
Agriculture, generalOrnamental horticulture(floriculture, nursery sci.) 1 1
Natural resources manage-ment 6 2 2 1Range management
ARCHITECTURE AND ENVIRON-
Total 43
37
11
10
6
6
1 2
2
13
10
3
2
7MENTAL DESIGN
ArchitectureInterior design 4 1 1 1 1City, community, and regionalplanning 2 - 2
AREA STUDIES Total 29
5
'1
-
1 2 5
1
11
1
6
3
3
Asian studies, generalRussian and Slavic studies 8 1 5 2American studies 15 - 1 1 4 5 1 3Other (French area) '1. 1
BIOLOGICAL SCIENCES Total 866
836
132
126
51
50
39
38
39
39
344
329
140
137
121
117Biology, general
general 1 - 1 - - - -.Butany,
Bacteriology 3 1 1 1Zoology. general 2 - - 2Physiology, human and animal 1 - - 1Microbiology 1 - 1Anatomy 1 1Histology 1 1Biochemistry 13 4 6 1 2Molecular biolo - 1 - 1
.,-Cell biology (cytology,cell physiology) I. - - 1Neurosciences 1 - - 1Other (unspecified) 4 1 1 1 1
BUSINESS AND
Total 2,317
361
879
167
304
26
139
22
39
.
6
183
24
405
42
)68
74
MANAGEMENT
Business and commerce,generalAccounting 894 365 147 60 12 51 141 118Banking and finance 80 20 22 7 2 8 9 12Business management andadministration 637 223 64 24 13 70 114 129Marketing and purchasing 171 54 17 14 2 14 46 24Transportation and publicutilities 13 11 2Insurance 10 5 3 1 - - 1International business 1 - 1
Secretarial studies (bacca-laureate & higher programs 17 8 3 1 4 1Personnel management 1 - - - 1 -Labor 4 industrial relations 11 3 - 2 - 5 IBusiness economics 110 20 19 5 2 14 42 8Other (finance) 10 3 1 4 1 1 -Other (s.ale.$) 1 - 1 - -
COMFONICATIONS- .
Tothl 190
56
43
13
28
3
37
7
11
5
10
3
17
7
44 .
18Cenmunications, generalJournalism (printed media) 81 19 12 15 1 4 26Radio/television 51 11 12 15 4 3Advertising 2 - 1 - 1 _
7 2
55

Table 22.4
Employment Status by Degree Field for Baccalaureate DegreeRecipients for Private Institutions in Pennsylvania, 1975
(centiduee)
iihn.:ISDegree Field
CONRCTER AND INFORMA-TION SCIENCES
.
Computer and information!sc;ences, general1.formation sciences andsystemsData prucessiComputer pror:ammingSystems analysis
LDCCATION
Educacioni generalElementary education, generalSecondary education, generalAgricultural educationEnglish educationHome economics educationFrenchGermanSpanishAll other foreign languageeducation (Russian)Nursing educationBiology educationChemistry educationZirth and space scienceVducationPhysics educationSocial studies educationSpeech and dramatic artseducationJuotor high school educationHigher education, generalSpecial education, generalAdministration of .specialeducationEducation of the mentallyretardedSpeech correctionRemedial educativnSpecial learning disabilitiesSocial foundations (history
, 4 philosophy of educationRre-elementary education(kindergarten)Educational adranistrationArc education (methodologYand therv)Musk education (methodology:11' theory)
):athematica education(m..thadology and theory)Heilt education (includefamily life educatiOn)Business, cummerce, and
*distributive educationOtt.er (home cc. ed. & bus. ed.)
TotalReported
Employed.lnF",eld Pree!redIT,. OutsidePa. Pa.
Employed inOther Field Pursuing
A.)vanced.
Tw,ree UnemployedAil
Others
In
Pa.
OutsidePe.
52
24
19
2
12
-
3
3
7 . 11
23 14 5 2 22. 1 1
2 2 -1 1
2,023
157
710
79
268
13
140
7
88
13
184
12
400
10
233
23799 316 116 70 26 52 135 8471 35 9 1 6 8 7 53 1 - 1 - 1 -
146 47 18 8 4 17 40 1233 9 17 2 4 - 1 -19 2 2 1 2 2 107 - 1 3 1 2
21 2 4 2 2 1 10
9 1 1 1 2 3 1
2 1 1 -10 6 3 16 5 - - 1
6 3 1
4 1 1 - 2105 15 6 11 10 10 42 11
10 2 1 4 i1 1 - - -
22 3 6 4 976 20 6 4 1 4 41
84 21 10 4 20 2 27
6 5 11 - 1
1 1 -2 1 - 1
3 - 2 1
9 85 1 1 2 1
65 11 3 3 1 1 39
189 58 29 5 I 31 25 38
66 19 9 3 9 8 5 13
17 5 5 1 2 1 -
49 2.5 4 2 4 9 5
19 7 2 5 1 4
7 3
56

Q,.0.
Table 22.4
Employment Status by Degree Field for Baccalaureate DegreeRecipients for Private Institutions in Pennsylvania, 1975
(continued)
TotalHEGIS Degree Field Reported
ENGINEERING Total 830
Engineering, general 53Bioengineering and bio-medical engineering 1
Chemical engineering (includepetroleum refining 106Civil, construction, andtransportation engineering 146Rlectrical, electronics .:talcommv!..-ations engineering 184Mechau...;e1 engineering 154Indus%..Aa1 and managementerv-.1eering 6914eta11urgical engineering 29Engineering_ mechanics (Nuclear Ener.) 1Engineering technologies(baccalaureate and higherprograms) 70Other (Fundamental aci. pre-
engineering) 17
FINE AND APPLIED ARTSARTS Total 542
Fine arts, general 47Art (painting, drawing,sculpture) 129Art history and apprecia-tion 35Music (performing, compo-Mitten, theory) 94Music (liberal arts program) 47Music history and apprecia-tion (musicology) 1
Dramatic arts 52Dance 3
Applied design -eramics,weaving, textile design,fashion design, jewelry,metalsmithing, interiordecoration, commercial art) 117Photogr.ohy 11Other (unspecified) 6
FOREIGN LANGUAGES Total 322
Foreign languages, general(includes concentration onmore than one foreignlanguage without majoremphasis on one language) 45French 115German 45Italian
, .5
Spanish 85Russian 12Japanese 2
Latin 5
Greek, classicalArabic
2
1
Slavic languages (otherthan Russian) 5
African languages (non-Semitic) 1
Employed inField Prepared
Employed inOther Field Pursuing
AdvancedDegree Unemployed
AllOthers
In
Pa.Outside
Pa.In
Pa.Cutside
Pa.
283
21
239
7
6 13
1
117
12
80
11
92
1
1
30 49 - 4 13 2 8
58 37 1 1 21 17 11
66 64 2 1 15 16 2044 47 2 6 25 7 23
20 20 1 10 8 109 6 - 10 2 2- - - 1
33 4 - 5 11 16
1 5 6 4 1
93
2
73
6
61
8
27
4
89
7
99
12
100
8
19 14 13 8 13 29 33
5 7 7 4 5 2 5
21 9 9 1 30 5 198 4 4 3 15 10 3
13 12 5 3 10 2 171 - 1 1 -
33 19 13 3 4 32 13- 1 1 1 6 21 1 1 - 2 1 -
51
17
29
3
40
a
25 72
4
49
8
57
9.12 12 13 9 30 19 20
4 2 4 7 11 8 91 1 1 2 -
16 10 17 4 12 11 15- 1 1 5 3 2
- 1 1 -1 - 3 1
1 1
1
1 1 1
1
7 4
57
;

Table 22.4
Employment Status by Degree Field for Baccalaureate DegreeRecipients for Private Institutions in Pennsylvania, 1975
(continued)
HECIS FieldTotal
Reported
821
1
Employed inFild Prepared
Employed inOther Field Pursuing
AdvancedDegree
117
Unemployed
94
1
All
Others
155
In
Pa.
333
OutsidePa.
111
In
Pa.
8
OutsidePa.
3
Degree
HEALIII PROFESSIONS Total
Heolrh professions. generalitai and health care
..L:ministration 2 1 1Neraing (baccalaureote and
'
higher_programs) 349 170 49 6 19 52 53Dentistry. D.D.S. or D.M.D.degree 6 6Medicine, M.D. degree 32 2Osteopathic medicine.D.u. degreu 38 6 32Pharmacy 200 88 44 13 55Public health 1 1Medical record librarianship 16 6 8 1 1Podiatry (Pod.D. oror pod7.3tric Medicine (D.P.M.) 1 1Veterinary medicine (D.V.M.
2Chiropractic 1
Clinical social work (medicaland psychiatric and special-ized rehabilitation services) 15 1 2 3Medical laboratory techno-logies (baccalaOreate andhigher. programs) 61
3
53
1
8
1
1 5
1
3 10Dental technologies(bacCalaureate and higherprograms)Other (unspecified) 71 6 2 1 27 35
some ECONOMICS Total 91
75
'30'
22
7
4
6
6
9
a
11
11
15
14
13
10iome' economics. geaeraiFoods and nutrition (includedietetics) 14 7 2 1 1 3Institutional management and.,Ifeteria management 2 1 1
LAW Total
Law, general
48
46
3
'2
40
40
1
1
3
3
other (paralegal) 2 1 1
LETTEkS Total 944
481157
108
h97
69
354
129
5921
71
3414
232
9031
117
81
10
218
11370
English...generalLiterarure, EnglishComparative literature 4 3 1
15 6 8 1Speech,- debate, and fore sicscience (rhetoric and publicaddress) 23 1 4 1 3 8 6
Creative writing 3 1 1
TeacrlIng of English as aforeign language 11 2 1 4 2
Philosophy 70 4 1 14 6 38Religious studies (excludetheological profession's) 174 23 27 22 15 53 8 26Other (technical writing) 6 3 2 1
LIBRARY SCIENCE Total
Library scienci2, general
6
5
1
2
1
1
1
2
2 1
Other (unspecified)
7 558
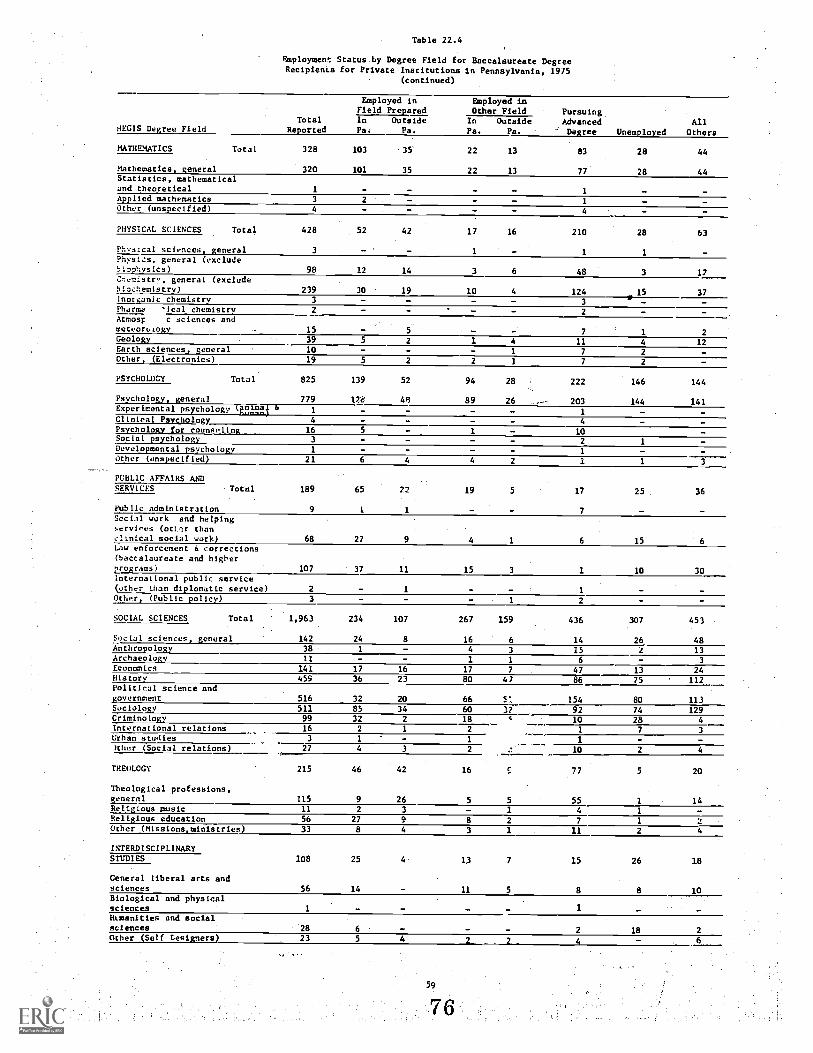
Table 22.4
Employment Status by Degree Field for Baccalaureate DegreeRecipienis for Private Inacitutions in Pennsylvania, 1915
(continued)
TotalHEGIS Degree Field Reported
MATHEMATICS Total 328
Mathematics, general 320Statistics, mathematicaland theoretical 1
Applied mathematics 3Other (unspecified) 4
PHYSICAL SCIENCES Total 428
Physical sciences, general 3
Phys12s, general (excludebiophysics) 98Chemistry, general (excludebiochemistry) 239notganic chemistry 3Pharma 'ical chemistry 2
Atmosr c sciences andmeteort.togy 15Geology 39Earth sciences, general 10Other, (Electronics) 19
PSYCHOLOGY Total 825
Psychology, general 779Experimental psychology 421fit 6 1
Clinical P5vch2logy 4
Psychology for counseling 16Social psychology 3
Developmental psychology 1
Other (unspecified) 21
PUBL1CAFFAIRS ANDSERVICES Total
. 189
Public administration 9Socitl work and helpingservices (otilr thanclinical social work) 68Law enforcement 4 corrections(baccalaureate and higherprograms) 107
International public service(other than diplomatic service) 2Other, (Public policy) 3
SOCIAL SCIENCES Total 1,963
Social sciences, general 142Anthropology 38Archaeologv 11Economtc 141History 459Political science andgovernment 516Sociology 511Criminology 99International relations 16Urhan studies 3
)ther (Social relations) 27
THEOLOGY 215
Theological professions,generril 115Religious music 11Religious education 56Other (Missionaoldnistries) 33
INTERDISCIPLINARYSTUDIES 108
General liberal arts andsciences 56
Biological and physicalsciences 1
Ntmanities and socialsciencesOther (Self Lesigners)
2823
Employed in Employed inField Prepared Other Field PursuingIn Outside In Outside Advanced AllPa. Pa. Pa. Pa. ' Degree Unemployed Others
103 35 22 13 83 28 44
101 35 22 13 77 28 44
1
2 1
- 4
52 42 17 16 210 28 63
- 1 1 1
12 14 3 6 48 3 11
30 19 10 4 124 15 37eI - 3 -
- 2
7 1 25 2 1 4 11 4 12- - - 1 7 2 -5 2 2 1 7 2
139 52 94 28 222 146 144
12i' 48 89 26 203 144 141... .. 1 -
- 4 -5 1 10 -
2 1
- - 1 -6 4 4 2 1 1 3
65 22 19 5 17 25 . 36
1 1 7 -
27 9 4 1 6 15 6
37 11 15 3 1 10 30
1 1 -, 1 2 -
234 107 267 159 436 307 451
24 8 16 6 14 26 481 4 3 15 2 13- - 1 1 6 - 3
17 16 17 7 47 13 2436 23 80 47 86 75 112
32 20 66 5l 154 80 11385 34 60 17 92 74 12932 2 18 e 10 28 4
2 1 2 I 7 31 - 1 1 - -4 3 2 10 2 4
46 42 16 S 77 5 20
9 26 5 5 55 1 142 3 - 1 4 1
27 9 8 2 7 1 28 4 3 1 11 2 4
25 4 13 7 15 26 18
14 11 5 8 8 10
1

Table 23.0
Employment Status by Degree Field for Associate Degree Graduates for All /nstitutions
Uri:1S Degree Field
DATA PROCESSING TFCV-NOLOC(FS Total
Data processing, tech-nologies, general
Keypunch operator and otherinput preparation technol-ogies
Computer programmertechnologiesComputer operatoT andperipheral equipmentoperation technologies
nFALTH SERVICES AND PAPA-ylnrcAL TumNoLocus Total
Hsalth serVices assistanttechnologies, generalDe,Ital assistant technologies
-Dental hygiene technologies
Medical or-biological labora-tory assistant technolovies
Radiologic technologies(X-rov, etc.)
rursing, P.N. (less than4-year program)
Nursing, practical (L.P.N.or I.V.N.--less than 4-year
Zrc_2fl.m)Occupational therapy
technologies
Surgical technologies
Medical record technologies
Medical assistant andmedical office assistanttechnologies
Inhalation therapytechnologies
Psychiatric technologies(include mental healthaide program,4
Physical therapy technologies
Other: Nuclear med. tech.
Medical secretary
MECHANICAL AND ENGINEERINGTECUNOLMIES Total
Mechanical and engineeringtechnologies, general
Aeronautical and aviationtechnologies
Engineering graphics (tooland machine drafting anddesign)
Architectural draftingtechnologies
Chemical technologies(include plastics)
Automotive technologies
TotalReported
Employed inField Prepared
Employed inOther Field Pursuing
AdvancedDegree
28
21
Unemployed
49
47
All
Others
43
21
In
Pa.
OutsidePa.
In
Pa.
OutsidePa.
351
280
144
153
11
11
26
25
27 16 1 1
31 16 1 2 12
11 1 1
1,505
23
1,006
5
26 .13
-
1 155 104
1
270
8
2q 16 1 3 2 3 4
46 , 44 1 1
75 47 2 11 12
8 8
611 197 7 11 48 29 121
441 Pi 7 In 63 35 33
24 17 - 2 4 1
11 2 1 1 2 5
42 lq 1 6 8 8
110 74 1 2 1 5 27
46 18 - f 5 17
43 25 1 1 2 - 14
26 18 6 1 1
47 11 1 3 30
11 10 1
1,547
47
655
22
210
-
140
5
21 175
9
170
4
176
7
209 11 118 13 14 15 7 31
40 24 - 6 3 5 2
187 05 2 13 - 32 24 21
13 3 1 1 1 5 1
20 13 7
7 7
60

Table 23.0
Employment Status by Degree Field for AssociateDegree Graduates for All Institutions
(continued)
HEMS Degree Field
MECHANICAL AND ENGINEERINGTECHNOLOGIES (coned)
Diesel technologies
Welding technologies
Civil technologies (sur-veying photogrammetry, etc.)
Electronics and machinetechnologies (televisionappliance, office machinerepair, etc.)
industrial technologies
Textile technologies
Mechanical technologies
Construction and buildingtechnologies (carpentry,electrical work, plumbing,sheetmetal, air condition-ing, heating, etc.)
Other: Engr. draft.
Tech. illust.
Toolmaking
Ind. super.
Struct. design
Power tech.
Other
NATURAL SCIENCETECHNOLOGIES Total
Natural science technol-ogies, generalAgriculture technologies(include horticulture)
Forestry and wildlife tech-nologies (include fisheries)
Food services technologies
Laboratory technologies,general
Other: (specify)
BUSINESS AND COMMERCETECHNOLOGIES ,Total
Business and commercetechnologies, general
Accounting technologies
Banking and financetechnologies
'-"Aeting, distribution,:chasing, business and
:Industrial managementtechnolo ies
Secretarial technologies(include office machinestraining)
Personal service technologies(stewardess, cosmetologist;etc.)
Photography technologies
Communications and broadcast-ing technologies (radio/television, newspapers)
Employed in Emp/oyed inField Prepared Other Field Pursuing
-Total In Outside In Outside Advanced All'Reported Pa. Pa. Pa. Pa. Degree Unemployed Others
83 56 10 1. 4 12
144 1
73 28 9 10 6 20
429 168 52 46 6 50 2330 9 1 3 171 1
44 24 4 4 8 1 3
263 124 14 38 34 29 244:. 3 2 - 4
6 1 3 - 24 6 2 - 1
43 43 - - -8 8 - -8 4 4
11 3 3 - 4 1
154
12
62 1 8 1 35
a
7
3
40
1
45 28 4 4 1
45 14 1 1 11 18
14 7 1 2 4
7 1 4 2
31 12 3 6 3
2,523
290
1,325
103
134
2
116
16
9
1
332
74
193
22
414
72
307 146 10 16 4 65 33 33
29 11 3 4 11
301 162 11 11 2 53 16 46
930 691 32 30 36 50 91
41 41
7 1 6
51 12 19 10
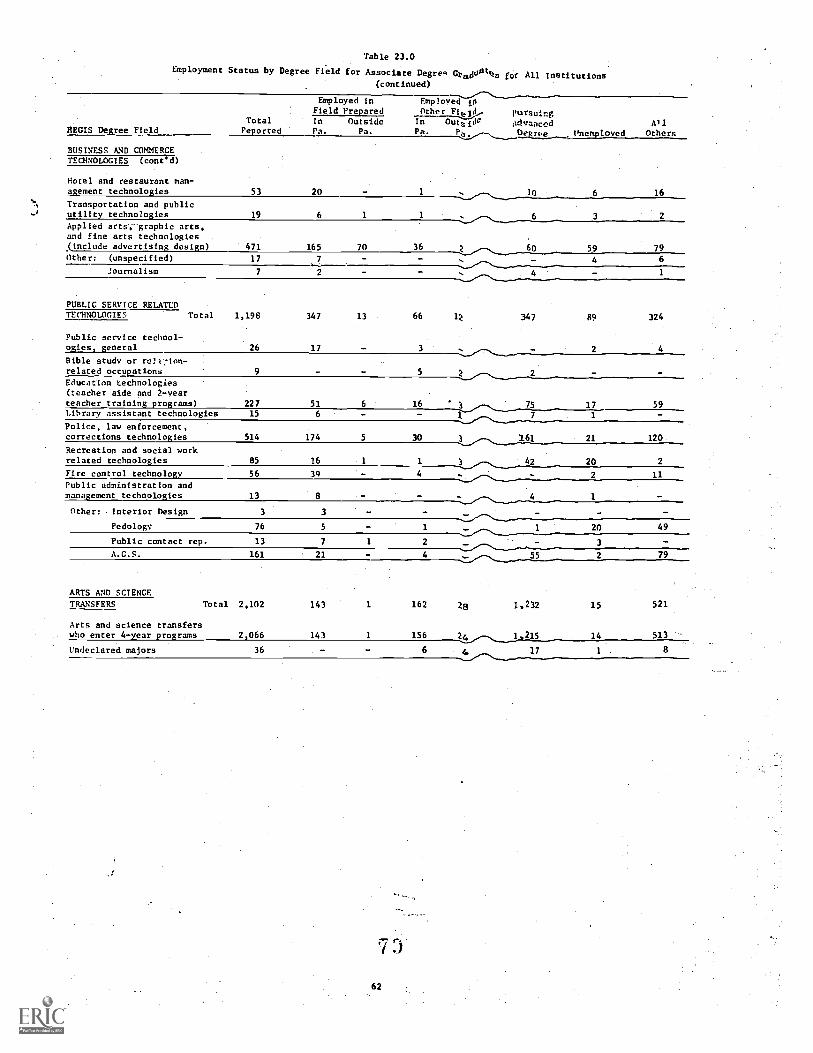
Table 23.0
Employment Status by Degree Field for AssociateDegree GoaddAts for All Institutions
(continued)
Employed in Employed 10Field Prepared OthS11.-Ettl% pursuing
Total In Outside in Outuido dvanced AllREGIS Degree Field reported Pa. Pa. Unemployed Others
BUSINESS AND COMMERCETECHNOLOGIES (cont'd)
Hotel and restaurant man-agement technologies 53 20 1
.-:..../-',.-__- 30 6 16
Transportation and publicutility technologies 19 6 1 1 :.........,...--..6 3Applied arts-,-graphic arts,and fine arts technologies(include adyertisin desi n) 471 165 70 36 59 79Other: (unspecified) 17 7 -
..L......-.......,60
4 6
Journalism 7 2-:-...------....._.....,-....._....______4 1
PUBLIC SERVICE RELATLDTECHNOLOGIES Total 1,198 347 13 66 1Z 347 89 324
Public service technol-ogies, general 26 17
,
2
Bible study or relu.lon-related occupations 9 5
-.=--/-------
-Education technologies(teacher aide and 2-yearteacher training programs)
.L.,....--.....,2
k..,..-....L.____ 75 17 59227 51 6 16Library assistant technologies 15 6 1 7 1
Police, law enforcement,correcttons 514 174 5 30
-...--/`-------
161 21 120
Recreation and social workrelated technologies 85 16 1 1 20 2
Fire control technology 56 39 4 2 11Public administration andmana ement technolo ies 13
Other: , Interior Design 3 3 -
Pedology 76 5 .1,_________:_..........,...... 1 20 49
Public contact rep. 13 7 1 2 3
A.G. S. 161 21 - 4 2 79
ARTS AND SCIENCE
2,102
2 066
143
143
1
1
162
156
28 1.232 15
14
521
513
TRANSFERS Total
Arts and science transferswho enter 4- ear programs
Undeclared majors 36 - 6
...e.._....-......_ei,215
4 17 1 . 8-......,------
62

Table 23.1
rmployment Status by Degree Field for Associate Degree Recipients for Community Colleges
HFGIS negree FieldTotalReported
Fmployqd inField Prepared
.Employed inOther Field Pursuing
AdvancedDegree Unemployed
AllOthers
InPa.
OutsidePa.
, In
Pa.
OutsidePa.
DATA PROCESSING159
128
81
64
16
16
22
19
15
14
25
15
TECHNOLOGIES Total
Data processing, tech-nologies, generalComputer programmertechnologies 24 11 3 1 9Computer operator andperipheral equipmentoperatifn t--lynnlogies 7 6 1
HEALTH EiVt 11 PARA-
1,381
23
849
5
19 33 1 116
9
: 99
1
264
8
1TDICAL TECIINc 'lIES Total
Health ser . 3ssistant
technologies, generalDental assistant technologies 29 16 1 3 2 3 4
Dental hygiene technologies 46 44 1
1'edica1 or biological laboratoryassistant technologies 61 44 1 3 3 In
Padiologic technologies(I-ray etc.) 8 8
Nursing, R.N. (legs than4-year program) 613 397 7 U. 48 29 121
Nursing, practical (L.P.N. orL.II.N.--less than 4-yearprogram) 307 194 3 In 33 34 33
Occupational therapytechnologies 24 17 2 4 1
.iurgical technologies 11 2 1 1 2 5
Medical record technologies 42 19 1 6 8 8
Medical assistant nnd medicaloffice assistant technologies 51 23 2 5 21Inhalation therapy technologies 40 14 6 3 17Psychiatric technologies 43 25 1 1 2
.14
Physical therapy technologies 26 18 6 1 1
Other: (unspec.fied) 13 3 30
Medical secretary 11 10 1
XECHANICAL AND RNGINEERING.
622
33
276
12
14 53
5
4 114 48
4
113TECHNOLOGIES Total
"echnnical and engineeringtechnologies, general
Aeronautical and aviationtechnologies 24 4 6 2 11 1
Engineering graphics (tooland machine drafting anddesign) 15 7
22 3 1
Architectural draftingtechnologies 87 28 5 - 29 6 19
Chemical technologies(include plastics) 13 1 1 1 5 1 1
Automotive technologies 20 13 7
Diesel technologies 26 22 4
Velding technologies 14 9
Civil technologies (survey-ing photogrammetrc, etc.) 73 28 9 20
8 0
63
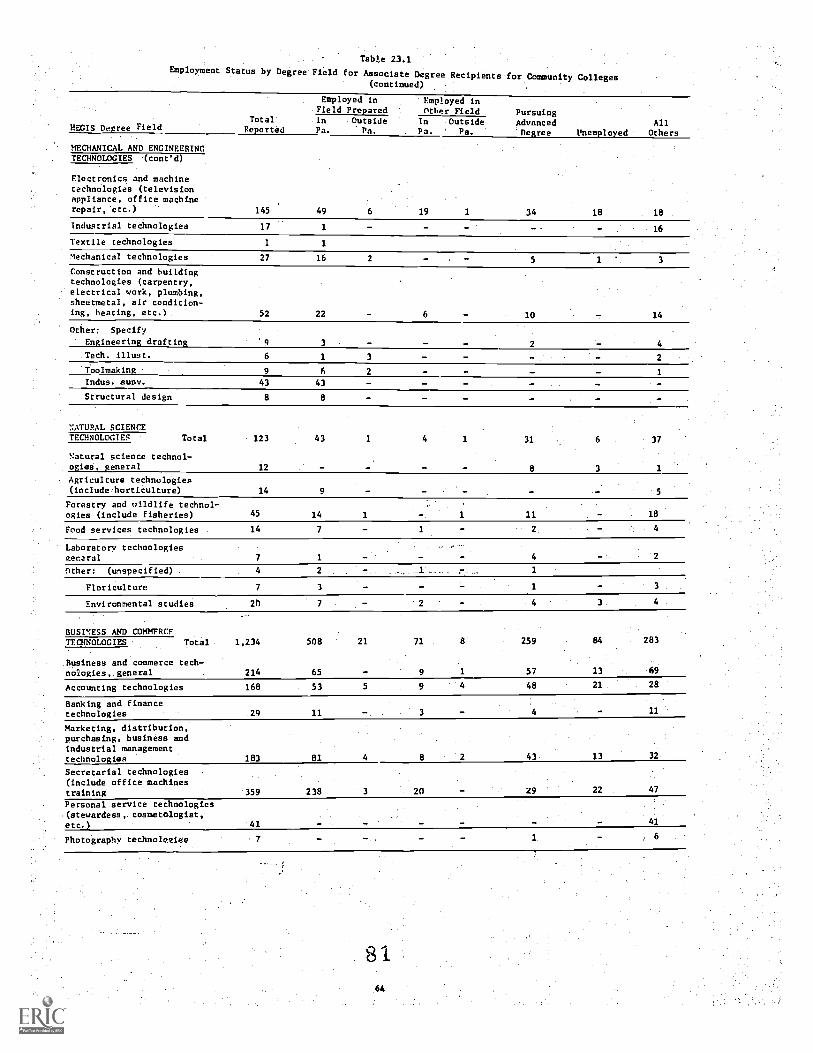
Table 23.1
Employment Status by Degree Field for Associate DegreeRecipients for Community Colleges
(continued)
REGIS Degree Field
MECHANICAL AND ENGINEERINGTECHNOLOGIES Iconed)
Electronics and machinetechnologies (televisionappliance, office machinerepair, etc.)
industrial technologies
Textile technologies
Mechanical technologies
Construction and buildingtechnologies (carpentry,electrical work, plumbing,sheetmetal, air condition-ing, heating, etc.)
Other: Specify
Engineering drafting
Tech. Must.
TOolmaking
Indus. Fumy.
Structural design
NATURAL SCIENCETECHNOLOGIES Total
Natural science technol-ogies, general
Agriculture technulogies(include horticulture)
Forestry and wildlife technol-ogies (include fisheries)
Food services technologies
Laboratory technologiesgenaral
Other: (unspecified)
Floriculture
Environmental studies
BUSINESS AND COMMFRCFTECHNOLOGIES Total
Business and commerce tech-nologies, general
Accounting technologies
Banking and financetechnologies
Marketing, distribution,purchasing, business andindustrial managementtechnologies
Secretarial technologies .
(include office machinestraining
Personal service technologies(stewardess, cosmetnlogist,etc.)
Photography technolegieo
Employed in Employed inField Prepared other Field Pursuing
Total In Outside In Outside Advanced Allreported Pa. Pa. Pa. ' Pa. Degree Unemployed Others
145 49 6 19 1 34
17 1 -
1 1
27 16 2 5
52 22 10
3 2
6 1 3
9 6 2
43 43
8 8
123
12
43 1 4 1 31
8
14 9
45 14 1 1 11
14 7 2
1 4
4 2 .1
7 3 1
2n
1,234
214
508
65
21 71
9
259
57
168 53 9 48
29 11
183 81 4 8 43
359 238 20 29
41
7 1
18 18
16
1 3
14
2
6 37
3 1
13
21
283
69
28
11
13 32
22 47
41
8164

Table 23.1
Employment Status by Degree Field-for Associate Degree Recipients for Community Colleges(continued)
HECIS Degree Field
BUSINESS AND COMMERCETECHNOLOGIES (coned)
Communications and broad-casting technologies(radio/television, newspapers
Hotel and restauramt manage-ment technologies
Transportation and publicutility technologies
Applied arts, graphic arts,and fine arts technologies(include advertising design)Other: (unspecified)
Journalism
PUBLIC SFPVICF-RELATEDTECiMLOGIES Total
Education technologies(teacher aide and 2-vearteacher training programs)
Library assistant tech-nologies
Police. law enforcement,corrections technologies
Recreation and social workrelated technologies
rire -control technology
Public ,Aministration andmanagement technologies
Other: PedoloRY
Public contact rep.
A.G.S.
ARTS AND SCIENCE
TPANSFERS
Arts and science trans-fers who enter 4-vearprograms
Employed in Employed:inField Prepared OrFer Field Pursuing
Total In Outside In Outside Advanced AllReported Pa. Pa. Pa. Pa. Degree Vneeployed Others
51 12 19 10
53 20 1 10 6 16
8 1 2
103 25 1 18 1 39 5 1411 1 - 4 6
7 2 - 4 1
1,118
227
301
51
13
6
55
16
10
3
338
75
85 316
59
15 6 - 1 7
.17
1
478 153 5 27 3 154 20 216
85 16 1 1 3 42 20 2
56 39 - 4 - 2 11
7 3 4
76 5 1 1 20 49
13 7 1 2 - 3 -
161 21 - 4 55 '2 79
2,040 141 156 24 1,196 14 sna
82
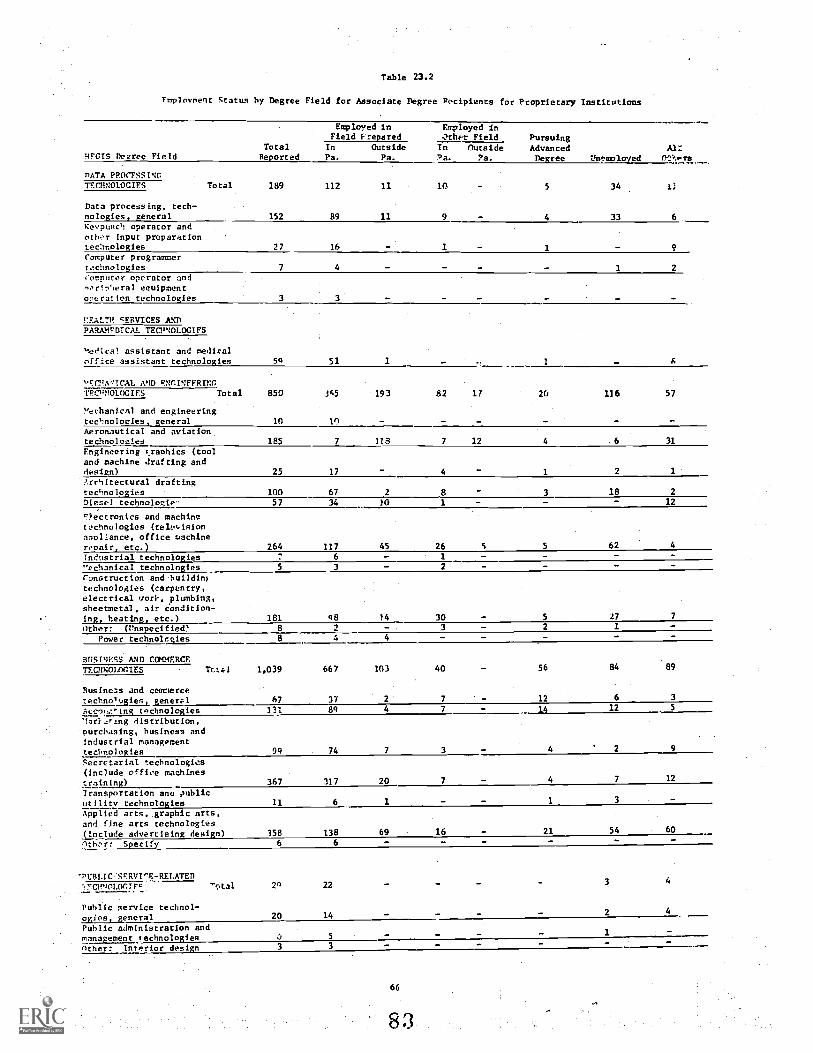
Table 23.2
Veployment Status by Degree Field for Associate Degree Recipients for Proprietary Institutions
MFGIS Degree Field
nATA PPOCESSINGTECHNOLOGIES
Data processing, tech-nologies, generalKeypunch operator andothr input preparationtechnologiesComputer programmertechnologiescomputer operator and-,er!sheral equipment
oneration technologies
Total
KEALTH sERITICES ANDPARAMFDTCAI TECPNOLOGIFS
!,%!Oical assistant and medical
office assistant technologies
vgC.PATCAL AND FNGINFFRINGTFCNNOLOGIES Total
Yechanical and engineeringtechnologies, generalAeronautical and aviationtechnoloesEngineering c,raphics (tooland machine drafting anddesign)Architectural draftingtechnologiesDiesel technologie-
r)ectronics and mschinetechnologies (teleuisionaaplance, office uachinerepair, etc.)Industrial technologies"echanical technologiesConstruction and huildinitechnologies (carpentry,electrical uork. plumbing,sheetmetal, air donlition-ing, heating, etc.)Other: Wnspecified
Power technolcgies
_BUSINESS AND COMMERCETECHNOLO(IES TrA.1.1
Business and commercetechno'Qgies, generelAcc.aing technologies'Iari.,ttng distribution,
purchasing, business andindustrial managementtechnologiesSecretarial technologies(include offiee machinestraining)Transportation ana publicutility technologiesApplied arts. graphic arts.and fine arts technologies/Include advertising design)nthr: Specify
-PuBLTC;scntrz-RELATED"7.C1PaCtI.00TFc.
Public service technol-ogies, general
Tetal
Public administration andmanagement technologiesother: Interior design
TotalReported
Employed inField Prepared
Employed inOther Field Pursuing
AdvancedDegree
5
4
Unemployed
14
33
Al:
1:
6
In
Pa.
OutsidePa.
In?a.
Outside?a.
189
152
112
89
11
11
10
9
27 16 1 1 9
7 4 1 2
3
50 51 1 1 6
850 345 193 82 17 26 116 57
10 10
185 7 1/8 7 12 4 6 31
25 17 4 1 2 1
100 67 2 8 3 18 2
57 34 10 I 12
264 117 45 26 S 5 62 4
7 6 - 1 - - -5 3 - 2 -
181 48 14 30 5 27
8 2 3 - 2 1 -
8 4 4 - -
1,039 667 103 40 56 84 89
67 37 2 7 12 6
131 84 4 7 14 12
99 74 7 3 4 2 9
367 317 20 7 - 4 7 12
11 6 1 - - 1 3
358 138 69 16 - 21 54 60
6 6 - - - -
20 22 3 4
20 14 2
51
3 3
66
83

Table 23,3
Employment Status by Degree Field for Associate Degree Recipients for Four-Year Colleges and Dnivel.ittts
YEGIS Degree Field
Employed in Employed inField Prrpared Other Field Pursuing
Total In Outside In Outside Advanced AllReported Pa. Pa. Pa. Pa. Degree Unemployed Others
DATA PROCESSIVGTFCFNOLOGIES
Computer programmertechnologier4
Total
Computer operator andperipheral equipmentoperation technologies
YEALTH SERVICES AsT PPU-'EDICAt. TECEN0104IES Total
Medical or biological labora-tory assistant technologies
Nursinc. practical (L.P.N.or L.Y. --less than 4-yearprograr
Inhalation therapytechnologies
other: Nuclear med. tech.
YECNA"ICAL A-n ENGINEERINGTECHNOLOGIES Total
mechanical and engineeringtechnologies, general
'lectronics and machinetechnologies (televisionappliance, office machinerepair, etc.)
Industrial technologies
Mechanical teLhaologies
Construction and buildingtechnologies (-arpentry.electrical vorh, plumbing,sheetmetal, air condition-ing, heating, etc.)
Other: (unspecified)
NATURAL SCIENCETECHNOLOGIES
Agriculture technologies(include horticulture)
3
2
1
1
1 1
1
1
155 106 38
14 3 1 8 2
134 99 4 30 1
6 4 2
1 1
75 14 5 41
4 3 1
20 2 1 1 11 4 1
6 2 3 1
12 5 2 2 3
30 4 2 19 2
3 1 2'
31 19 4 1
8 4
67

Table 23.3
Employment Status by Degree Field for Associate Degree Recipients for Four-Year Colleges and Universities(continued)
HECIS begree FieldTotal
reoorted
Employed inField Prepared
Employed inOther Field Pursuing
AdvancedDegree Unemployed
AllOthers
In
Pa.Outside
Pa.In
Pa.Outside
Pa.
BUSINESS AND COMMERCE250 150
1.
10
-
5
-
1
-
17
5
25
3
42TECHNOLOGIES Total
Business and commercetechnologie..;,.general
Accounting technologies 8 4 1 3
Marketing, distribution,purchasing business andindustrial managementtechnologies 19 7 6 1 5
Secretarial technologies(including office machinestraining) 204 136 9 3 3 21 32
Applied arts graphic arts,and fine arts technologies(include advertising design) 10 2 2 1 5.
PUBLIC SEMYICE-RELA:51
6
24
3
11 2 9 1TECHNOLOGIES Total
Public service technol-ogies, general
Bible study or religion-related occupations 9 5 2 2 -
Police, law enforcement.corrections technologids 36 21 3 7 1 4
ARTS AND SCIENCE
62 1 1 6 4 36
19
1 13
5
TRANSFERS Total
and science trans-fers whc enter 4-yearprograms
Other: Undeclared majors 3S. 6 4 17 1 8
6B