Embed Size (px)
Citation preview

CRANFIELD UNIVERSITY
R VAZ FERNANDES
AN ANALYSIS OF THE POTENTIAL BENEFITS TO AIRLINES OF
FLIGHT DATA MONITORING PROGRAMMES
SCHOOL OF ENGINEERING AIR TRANSPORT GROUP
MSc THESIS

CRANFIELD UNIVERSITY
SCHOOL OF ENGINEERING AIR TRANSPORT GROUP
MSc THESIS
Academic Year 2001-2002
R VAZ FERNANDES
An analysis of the potential benefits to airlines of flight data monitoring
programmes
Supervisor: I Stockman
September 2002
This thesis is submitted in partial fulfilment of the requirements for the degree of Master of Science
© Cranfield University 2002. All rights reserved. No part of this publication may be reproduced without the written permission of the copyright owner.

i
Abstract
A flight data monitoring (FDM) programme involves regularly downloading and
analysing data recorded from an airline’s operations. The primary purpose of this
analysis is to improve the safety of the airline’s operations by identifying and
rectifying adverse trends in the flight operations.
It is not mandatory for an airline to run an FDM programme, with the exception of
airlines in China and France. However, the number of carriers with such a programme
is increasing as more airlines recognise the safety benefits that can arise from
regularly monitoring flight data. It is likely that more countries will make FDM
programmes mandatory in the coming years.
As well as the safety benefits, there are a range of other benefits which an airline with
an FDM programme can enjoy. Some of these will reduce the costs incurred by the
airline and these cost savings are likely to be more than sufficient to cover the costs of
running the FDM programme.
This work describes the elements that make up an FDM programme, outlines what the
costs are to run such a programme and describes the range of benefits available. These
benefits are quantified with data taken from airlines that have established FDM
programmes.
It is likely that as airlines become more mature in the use of their FDM programmes
they will exploit more of these benefits and identify new ones, while at the same time
improving the safety of their operations.

AMDG
ii
Acknowledgements The author would like to thank the following individuals for providing help,
information and advice during the preparation of this thesis.
David Barry – bmi British Midland
Andrew Boardman – Air 2000
Peter Clapp – Spirent Systems
Steve Clark – Virgin Atlantic
Mark Collishaw - Spirent Systems
Anne Fabresse - Airbus
Regina Harris – UTRS
Jason Holt – Virgin Atlantic
Kyle Hultquist – Honeywell
Tamas Igloi – Teledyne Controls
Dobos István – Malev
Jez Last – Britannia Airways
Thomas Longridge – FAA
Jochen Mickel – Lufthansa
Jari Nisula – Airbus
Tom O'Kane - British Airways
Dick Parnall – Avionica
Thierry Pfeiffer – Sagem
Martin Pitt – Air 2000
Howard Posluns – Transport Canada
Helena Reidemar-Suther – Northwest Airlines
Artis Riekstins – Air Baltic
Andrew Sellick – QANTAS
Aleksander Sekirnik – Adria Airways
Flemming Skourup – Sunair
Eric Smith – Spirent Systems
Ian Stockman – Cranfield University
Cobus Toerien – SAA
Roger Whitefield – British Airways
Kjell Widarsson – Novair
Peter Wigens - Cathay Pacific
Yee-Keong Yau – Silkair

iii
Glossary ACMS Aircraft Condition Monitoring System AIB Accident Investigation Board ASR air safety report ACARS Aircraft Communications Addressing and Reporting System AIDS Aircraft Integrated Data Systems AIMS Aircraft Integrated Monitoring Systems AOA angle of attack BAA British Airports Authority BASIS British Airways Safety Information System CG centre of gravity CAADRP Civil Aircraft Airworthiness Data Recording Programme CAAC Civil Aviation Administration of China CAA Civil Aviation Authority CAP Civil Aviation Publication CFIT controlled flight into terrain DAU data acquisition unit DMU Data Management Unit DAR Digital AIDS Recorder DFDAU Digital FDAU DFDMU Digital FDMU EGT exhaust gas temperature FAA Federal Aviation Administration FDAMS Flight Data Acquisition & Management System FDAU Flight Data Acquisition Unit FDIU Flight Data Interface Unit FDMU Flight Data Management Unit FDM flight data monitoring FDR flight data recorders FOQA flight operational quality assurance FSF Flight Safety Foundation FCOC fuel-cooled oil cooler GAO General Accounting Office (United States) GAIN Global Aviation Information Network GBP Great Britain pounds GPWS ground proximity warning system HF high frequency ILS instrument landing system IDG integrated drive generator ICAO International Civil Aviation Organisation ILSC International Logistics Support Corporation ISASI International Society of Air Safety Investigators LOMS Line Operations Monitoring System

iv
MO magneto-optical MCTOM maximum certificated take-off mass OFDM operational flight data monitoring OQAR optical QAR PCMCIA Personal Computer Memory Card International Association QAR quick access recorders SRG Safety Regulation Group SVT single visit training SSFDR solid state FDR STAR standard arrival route SOP standard operating procedure STC supplemental type certificate USD United States dollars UTRS Universal Technical Resource Services, Inc. VHF very high frequency

v
List of contents 1 INTRODUCTION...................................................................................................................1
1.1 AIMS AND OBJECTIVES ......................................................................................................2 1.1.1 Aim..............................................................................................................................2 1.1.2 Objectives....................................................................................................................2
1.2 THESIS STRUCTURE ...........................................................................................................2 1.3 PREVIOUS STUDIES INTO FDM PROGRAMMES.....................................................................3
2 BACKGROUND......................................................................................................................6
2.1 OVERVIEW OF FDM ..........................................................................................................6 2.2 HISTORY OF FDM PROGRAMMES.......................................................................................6 2.3 ICAO POSITION ON FDM PROGRAMMES ..........................................................................10 2.4 REGULATORY POSITION ON FDM PROGRAMMES ..............................................................10 2.5 IMPLEMENTING AND RUNNING AN FDM PROGRAMME.......................................................13
3 EXPLANATION OF FDM....................................................................................................14
3.1 CAPTURING FLIGHT DATA ON AIRCRAFT ...........................................................................14 3.2 DOWNLOADING FLIGHT DATA FROM AIRCRAFT.................................................................19 3.3 TRANSFERRING FLIGHT DATA TO AN ANALYSIS CENTRE ....................................................20 3.4 REPLAYING FLIGHT DATA................................................................................................20 3.5 ANALYSING FLIGHT DATA ...............................................................................................22 3.6 PRACTICAL CONSIDERATIONS OF FDM PROGRAMMES ......................................................24 3.7 HARDWARE AND SOFTWARE REQUIREMENTS OF FDM PROGRAMMES................................25 3.8 MANPOWER REQUIREMENTS OF FDM PROGRAMMES ........................................................25 3.9 SUPPLIERS AND CUSTOMERS OF FDM PROGRAMS.............................................................26 3.10 FUTURE IMPROVEMENTS TO FDM PROGRAMMES .............................................................27
4 COSTS...................................................................................................................................29
4.1 OVERVIEW OF MAIN COST ITEMS......................................................................................29 4.2 CAPTURING FLIGHT DATA ON AIRCRAFT ...........................................................................30 4.3 DOWNLOADING FLIGHT DATA FROM AIRCRAFT.................................................................31 4.4 TRANSFERRING FLIGHT DATA TO AN ANALYSIS CENTRE ....................................................31 4.5 REPLAYING FLIGHT DATA................................................................................................32 4.6 ANALYSING FLIGHT DATA ...............................................................................................32 4.7 START-UP AND RECURRING COSTS ...................................................................................34
4.7.1 Start-up costs.............................................................................................................34 4.7.2 Recurring costs..........................................................................................................34
4.8 FAA ESTIMATE OF FDM COSTS.......................................................................................35 4.9 EFFECT OF AIRCRAFT SIZE AND FLEET SIZE ON FDM COSTS...............................................36
5 BENEFITS.............................................................................................................................37

vi
5.1 OVERVIEW......................................................................................................................37 5.2 MAIN BENEFITS...............................................................................................................37
5.2.1 Safety benefits............................................................................................................37 5.2.2 Cost benefits ..............................................................................................................38
5.3 SAFETY BENEFITS............................................................................................................39 5.3.1 Improved pilot training programmes ..........................................................................39 5.3.2 Improved operating procedures..................................................................................40 5.3.3 Improved safety in flight operations ...........................................................................41 5.3.4 More detailed investigation of ASRs ...........................................................................42
5.4 COST BENEFITS ...............................................................................................................43 5.4.1 Increased aircraft availability ....................................................................................43 5.4.2 Optimum fuel consumption.........................................................................................44 5.4.3 Avoiding unnecessary engine maintenance .................................................................44 5.4.4 Other maintenance activity.........................................................................................45 5.4.5 Warranty and liability claims .....................................................................................47 5.4.6 Reduced insurance premiums.....................................................................................47 5.4.7 Reduced ACARS messages .........................................................................................49 5.4.8 Adherence to noise-abatement procedures..................................................................49 5.4.9 Reduced number of FDR downloads...........................................................................49
5.5 FURTHER BENEFITS .........................................................................................................50 5.5.1 Improvements to infrastructure ..................................................................................50 5.5.2 Monitoring of franchisees ..........................................................................................50 5.5.3 Research....................................................................................................................50 5.5.4 Consultancy...............................................................................................................51
6 QUANTIFYING THE BENEFITS .......................................................................................52
6.1 OVERVIEW......................................................................................................................52 6.2 SAFETY BENEFITS............................................................................................................52
6.2.1 Cost of an accident ....................................................................................................52 6.2.2 Improved pilot training programmes ..........................................................................54
6.3 COST BENEFITS ...............................................................................................................55 6.3.1 Increased aircraft availability ....................................................................................55 6.3.2 Optimum fuel consumption.........................................................................................55 6.3.3 Avoiding unnecessary engine maintenance .................................................................56 6.3.4 Other maintenance activity.........................................................................................57
6.3.4.1 Savings from reduced brake wear................................................................................... 57 6.3.4.2 Savings from reduced hard landing inspections............................................................... 58
6.3.5 Reduced insurance premiums.....................................................................................58 6.3.6 Reduced ACARS messages .........................................................................................59 6.3.7 Adherence to noise-abatement procedures..................................................................60 6.3.8 Reduced FDR downloads ...........................................................................................60

vii
6.4 SUMMARY OF SAVINGS....................................................................................................60
7 CONCLUSIONS AND RECOMMENDATIONS.................................................................63
7.1 CONCLUSIONS.................................................................................................................63 7.1.1 General conclusions ..................................................................................................63 7.1.2 Costs .........................................................................................................................63 7.1.3 Benefits......................................................................................................................63
7.2 RECOMMENDATIONS .......................................................................................................64
8 REFERENCES......................................................................................................................65
APPENDIX A – AIRLINES WITH AN FDM PROGRAMME

viii
List of figures Figure 1 - Historical and forecast levels of air transport departures, accident rate and
total number of accidents. .................................................................................. 1
Figure 2 - British Airways hull losses by category between 1952 and 2002 ............... 7
Figure 3 - American Airlines hull losses by category between 1952 and 2002 ........... 7
Figure 4 - Graph showing the growth in airlines with FDM programmes. .................. 9
Figure 5 - Representation of a single data frame output from a DAU ....................... 15
Figure 6 - Picture of an OQAR ................................................................................ 17
Figure 7 - Number of QAR parameters recorded by fleet type at British Airways .... 17
Figure 8 - Overview of FDM programme ................................................................ 24
Figure 9 - Summary of the benefits of using wireless data transfer in an FDM
programme ...................................................................................................... 28
Figure 10 - Comparison of hull loss rates (shown as hull losses as % of total hulls
flying) between airlines with FDM programmes .............................................. 48
Figure 11 - Major Aviation Organisation with High Loss Experience ...................... 59
Figure 12 - Major Aviation Organisation with Minimal Loss Experience................. 59

ix
List of tables Table 1 - Comparison of main FDM hardware suppliers.......................................... 26
Table 2 - Comparison of main FDM software suppliers ........................................... 26
Table 3 - Typical costs of an FDM programme: part 1............................................. 31
Table 4 - Typical costs of an FDM programme: part 2............................................. 31
Table 5 - Typical costs of an FDM programme: part 3............................................. 32
Table 6 - Typical costs of an FDM programme: part 4............................................. 33
Table 7 – Comparison of first year costs versus recurring costs of an FDM programme
........................................................................................................................ 35
Table 8 – FAA estimated total annual costs by fleet size for an airline setting up an
FDM programme. ............................................................................................ 36
Table 9 - Estimated total annual savings by fleet size for an airline with an FDM
programme. ..................................................................................................... 61
Table 10 - KLM estimate of annual savings from its FDM programme.................... 61
Table 11 – Estimate annual savings from an FDM programme over five years. ....... 62
Table A-1 – List of airlines with an FDM programme sorted by start date ............. A-1
Table A-2 – Alphabetical listing of airlines with an FDM programme ................... A-3

Chapter 1 – Introduction
1
1 Introduction Air transport is viewed as a very safe mode of transport, with the accident rate, as
measured in terms of accidents per million departures, falling drastically in the last
forty years. However, the accident rate has remained flat in recent years whilst air
transport has continued to grow. As this traffic grows, the number of accidents will
also increase, unless the accident rate is reduced further. This is shown in Figure 1.
Figure 1 - Historical and forecast levels of air transport departures, accident rate
and total number of accidents.
Source: Schmidlin1
The aviation industry has realised that such an increase in the number of accidents is
not acceptable which means the accident rate needs to be reduced. The industry is
attempting to achieve this through pursuing several initiatives. One of these that has,
until recently, received little recognition and has not enjoyed widespread use is the
utilisation of flight data monitoring (FDM) programmes, also known as operational
flight data monitoring (OFDM) or flight operational quality assurance (FOQA).
1960 1965 1970 1975 1980 1985 1990 1995 2000 2005 2010 2015Year
0
5
10
15
20
25
30
35
40
45
50
Acc
iden
t Rat
eM
illio
n De
part
ures
Num
ber o
f Acc
iden
ts
Million Departures
Accident Rate
Number of Accidents
Airplanes in Service1996: 110602015: 23100

Chapter 1 – Introduction
2
FDM programmes allow operators to gain a deeper understanding of their flight
operations, through regularly analysing flight data from their aircraft. If such a
programme is coupled together with other safety systems, such as confidential human
factors reporting and incident reporting systems, it will help guide the aviation
industry towards its goal of improved safety.
The obvious safety-related benefits of FDM programmes are becoming more widely
recognised and more operators are starting to implement such programmes. However,
there are also other potential benefits which are less widely appreciated, except by
airlines which have had such programmes for many years. This thesis attempts to
address the lack of knowledge of FDM programmes in general and, in particular, the
scope of benefits that can arise from having such a programme.
1.1 Aims and objectives
1.1.1 Aim
The aim of the thesis is to describe FDM programmes and the range of potential
benefits to an airline making use of such a programme.
1.1.2 Objectives
The objectives of the thesis are as follows:
• Provide an understanding of what is involved in an FDM programme.
• Determine the costs of an FDM programme
• Describe the range of benefits available from an FDM programme
• Quantify the benefits of an FDM programme
1.2 Thesis structure
• Chapter 1 is an introduction to the thesis.
• Chapter 2 describes some background information on FDM programmes. This
includes a brief history of FDM, the position of the International Civil
Aviation Organisation (ICAO) and regulatory authorities on FDM as well as a
summary of how FDM programmes are typically run.

Chapter 1 – Introduction
3
• Chapter 3 describes in detail how an FDM programme works as well as what
the main requirements are in terms of hardware, software and manpower.
• Chapter 4 describes the costs associated with meeting the requirements
outlined in the previous chapter.
• Chapter 5 highlights some major benefits to an airline which has an
established FDM programme.
• Chapter 6 quantifies some of the benefits described in the previous chapter.
• Chapter 7 summarises the thesis and suggests areas for further study.
1.3 Previous studies into FDM programmes
In July 1995 the United States Federal Aviation Administration (FAA) initiated a two-
year (later increased to three years) programme known as DEMOPROJ. The aim of
this project was:
“…to facilitate the start-up of the FOQA initiative and to comprehensively assess the
cost-benefits and safety enhancement effectiveness of an implemented FOQA
program in which airlines voluntarily employ in-flight recorded data to routinely
monitor their flight operations.”2
DEMOPROJ was a USD 5.5 million project that involved four main United States
airlines: Alaska Airlines, Continental, United Airlines and US Airways. Universal
Technical Resource Services, Inc. (UTRS) was awarded the FAA contract to run
DEMOPROJ.
In 1997 the United States General Accounting Office (GAO) produced a report about
FDM programmes, primarily based on the work carried out under DEMOPROJ. This
GAO report in turn formed the basis of the Flight Safety Foundation’s (FSF) July-
September 1998 Flight Safety Digest magazine on “Aviation Safety: US Efforts to
Implement Flight Operational Quality Assurance Programs”.
Since then there have been several international conferences dealing with flight safety
issues, including a conference in Lisbon in 2001 focussed specifically on FDM within

Chapter 1 – Introduction
4
Europe. The Global Aviation Information Network (GAIN), an international coalition
of airlines, manufacturers, employee groups, governments and other aviation
organisations, has arranged five conferences since 1996 to discuss safety issues,
including FDM programmes. GAIN was formed to promote and facilitate the
voluntary collection and sharing of safety information among users in the
international aviation community in order to improve aviation safety.3 To this end
they have produced two documents which both include sections relating to FDM
programmes. These documents are a Guide to Methods and Tools for Airline Flight
Safety Analysis (Issue 1 December 2001) and a Flight Safety Operator’s Handbook
(Issue 2 December 2001).
The Safety Regulation Group (SRG) of the United Kingdom Civil Aviation Authority
(CAA) has produced a Best Practice Guide for Operational Flight Data Monitoring
(Draft Issue November 1999) and the CAA is currently working on a Civil Aviation
Publication (CAP) on this subject.
The Flight Operations Support Department of Airbus, in partnership with Air France’s
Flight Safety Department, Cathay Pacific’s Corporate Safety Department and the
service supplier company Aeroconseil, have produced a Flight Operations Monitoring
Handbook (Issue 3 February 2002). This is intended to serve as a guide to commercial
airline operators to establish and manage their own FDM programmes.
The International Society of Air Safety Investigators (ISASI) has also discussed FDM
programmes at some of its annual seminars and further articles have appeared in the
ICAO Journal.
It is thus apparent that many organisations are interested in FDM programmes and are
trying to issue guidelines on how to run them and share the information obtained from
them. However, there does not as yet appear to be a single source of information on
the subject or a detailed study of the potential benefits to be gained from such a
programme. Furthermore, most of the studies to date have looked predominantly at
the operational aspects of an FDM programme and few of them have highlighted the
benefits available to other departments of the airline. This thesis aims to address this
issue.

Chapter 2 – Background
5

Chapter 2 – Background
6
2 Background
2.1 Overview of FDM
Flight data monitoring is an activity carried out by an airline primarily as a means of
monitoring and improving the safety of its flight operations.
It involves regularly analysing flight data from every sector flown by every aircraft,
discovering and examining any irregularities in the operations and keeping track of
underlying trends in operational procedures and potentially dangerous events. If
necessary, feedback on significant issues is provided, typically to the flight training
department and sometimes to individual flight crew members.
In this way, FDM meets two key objectives. Firstly, it enables technical flaws, unsafe
practices or conditions outside desired operating procedures to be detected at an early
enough stage to prevent them leading to incidents or accidents.4 Secondly, it provides
an objective means of following-up on corrective actions, such as increased training
or altered standard operating procedures, to determine if they have been successful.5
Both of these ultimately contribute towards the safe operation of the airline.
2.2 History of FDM programmes
FDM programmes evolved from the use of flight data recorders (FDRs) which the
United States Civil Aeronautics Administration made mandatory equipment in 1958.
In the UK, the origins can be traced to the 1960s Civil Aircraft Airworthiness Data
Recording Programme (CAADRP). British Airways was one of the first airlines to
use data from FDRs in a monitoring programme, starting in 1962. In the late 1960s
Trans World Airways began monitoring certain parameters relating to approaches and
landings as their FDRs were removed from the aircraft for regular maintenance and
All Nippon Airways started a flight data analysis programme in 1974. At least eight
airlines have had voluntary FDM-type programmes in operation for more than 25
years6 and most of them recognise the important safety benefits they have provided to
the operation. This is demonstrated in Figure 2 which shows the number of hull
losses, broken down by category, at British Airways over the last fifty years.

Chapter 2 – Background
7
Figure 2 - British Airways hull losses by category between 1952 and 2002
Source: British Airways7
For comparison, Figure 3 shows the same information for American Airlines, which
does not have an FDM programme.
Figure 3 - American Airlines hull losses by category between 1952 and 2002
Source: compiled by the author from various accident databases
0
1
2
3
'52
'54
'56
'58
'60
'62
'64
'66
'68
'70
'72
'74
'76
'78
'80
'82
'84
'86
'88
'90
'92
'94
'96
'98
'00
'02
Year
Hul
l los
ses
Operations Training Violence Testing Non-ops
12 losses in 25 years 17 losses in 25 years
0
1
2
3'5
2'5
4'5
6'5
8'6
0'6
2'6
4'6
6'6
8'7
0'7
2'7
4'7
6'7
8'8
0'8
2'8
4'8
6'8
8'9
0'9
2'9
4'9
6'9
8'0
0'0
2
Year
Hul
l los
ses
Operations Training Violence Testing Non-ops
2 losses in 25 years 30 losses in 25 years

Chapter 2 – Background
8
Although some of the reduction in hull losses can be attributed to improvements in
aircraft technology and pilot training, the improved operations resulting from British
Airways’ FDM programme have also played a part.
When comparing British Airways and American Airlines hull losses it is important to
note that American Airlines has a fleet size more than twice that of British Airways
and conducts twice as many air transport movements per year. It is significant,
however, that in the last ten years, at least four of the hull losses have occurred during
the approach or landing phases of flight. It is during these phases of flight that FDM
programmes are acknowledged as being most beneficial in terms of improving
operating procedures and hence safety.
The benefits of an FDM programme were highlighted by the Accident Investigation
Board (AIB) which investigated the Gulf Air A320 accident to flight GF072 on 23
August 2000 near Bahrain International Airport. The final report stated that:
“Flight data analysis is a proven means to conduct regular safety analyses. Regular
analysis of the flight parameters recorded by flight recorders, such as the digital
AIDS1 recorder (DAR), enables the study of trends in a wide spectrum of safety
related areas of flight operations and maintenance practices. Such analysis provides
valuable information indicating individual and general trends (such as: deviations
from standard flight parameters, violations, etc.), that assists an airline in developing
and updating its safety related policies.
In summary, at the time of the accident, the flight data analysis system was not
functioning satisfactorily. Non-availability of flight data analysis deprived the airline
of a valuable safety analysis tool.”8
In its conclusions on the contributory factors to the accident the AIB noted the
following factors:
“3.2 (1)(a) The captain did not adhere to a number of standard operating procedures 1 Aircraft integrated data systems (AIDS)

Chapter 2 – Background
9
(SOPs); such as: significantly higher than standard aircraft speeds during the descent
and the first approach; not stabilising the approach on the correct approach path;
performing an orbit, a non-standard manoeuvre, close to the runway at low altitude;
not performing the correct go-around procedure;
3.2 (2)(a)(iii) The airline’s flight data analysis system was not functioning
satisfactorily, and the flight safety department had a number of deficiencies.”
Among the recommendations to the regulatory authority of Oman were that they
ensure that Gulf Air reviews and improves the functioning and utilisation of the A320
flight data analysis system, in accordance with the regulatory requirements
(recommendation B-01-6).
More airlines now recognise the benefits of an FDM programme and many operators
now have such a programme in place. Appendix A lists the airlines which are known
to have an FDM programme, together with the date when they first had software to
run the FDM programme. Figure 4 below shows this information graphically and it
can be seen that there has been a large increase in airlines implementing FDM
programmes in the last five years. This is partly due to the ICAO recommendation
(see section 2.3).
Figure 4 - Graph showing the growth in airlines with FDM programmes.
05
1015202530354045505560657075
1966
1968
1970
1972
1974
1976
1978
1980
1982
1984
1986
1988
1990
1992
1994
1996
1998
2000
2002
No.
ope
rato
rs
Source: compiled by the author

Chapter 2 – Background
10
2.3 ICAO position on FDM programmes
Historically, FDM programs have been entirely voluntary. However, this is changing,
as the safety benefits of FDM programmes become more widely recognised.
Amendment 26 to Annex 6 – Operation of Aircraft, Part 1 of the ICAO Convention
on Civil Aircraft states the following:9
3.6.2 From 1 January 2002, an operator of an aeroplane of a maximum certificated
take-off mass (MCTOM) in excess of 20 000kg should establish and maintain a flight
data analysis programme as part of its accident prevention and flight safety
programme.
3.6.3 From 1 January 2005, an operator of an aeroplane of a MCTOM in excess of
27 000kg shall establish and maintain a flight data analysis programme as part of its
accident prevention and flight safety programme.
3.6.4 A flight data analysis programme shall be non-punitive and contain adequate
safeguards to protect the source(s) of the data.
The use of an FDM programme will thus become mandatory in many countries over
the next few years. ICAO emphasises that the data should be used for flight safety
purposes only and that the data analysis should be non-punitive. However, due to the
wide variety of legal systems around the world each state should determine the most
appropriate method of protecting an FDM programme in their own country and
individual operators should establish internal safeguards to prevent abuse of their
FDM programmes.
2.4 Regulatory position on FDM programmes
An FDM programme provides obvious safety benefits and it also fits in well with a
pro-active safety management system, to provide assurance that safety levels are
being met or improved. Furthermore, now that it is a recommended practice, any

Chapter 2 – Background
11
operator without a fully functional programme in place could be seen as not making
“best endeavours” and hence culpable in the event of an incident or accident.10
The civil aviation authority in China was the first authority to mandate a flight quality
monitoring programme, in response to a number of accidents to Chinese carriers in
the early 1990s. Documents were issued in 1997 defining the technical requirements
for the programme and giving an outline of how the monitoring programme should be
run.11
The French civil aviation authority also issued an FDM requirement, which became
mandatory in 2000. This applies to aircraft with a MCTOM over 10 000kg or with
more than 19 seats and it is linked to JAR-OPS-1.037 which deals with accident
prevention and flight safety programmes.12
The UK CAA supports the ICAO recommendations and extends them to include
operators of aircraft under 27 000kg and helicopters. Data from British Airways’
FDM programme is made available to the CAA under a research contract and the
CAA uses this data in the following ways:13
• to continue improving FDM techniques.
• to give informed advice and guidance to operators.
• to give support for the UK’s Mandatory Occurrence Reporting Scheme.
• to assist the formulation of airworthiness and operational requirements.
The US FAA supports FDM programmes but does not plan to make them mandatory.
In its final rule on FDM programmes (known as FOQA programs in the United
States) the FAA stated:5
“This final rule does not require any operator to implement a FOQA program, nor
does it require any operator who desires to voluntarily implement such a program to
obtain FAA approval to do so, or to submit FOQA information from such an internal
program to the FAA.”

Chapter 2 – Background
12
The rule explains the protection that is available to airlines with FAA-approved FDM
programmes and how they can qualify for this protection:
“This rule codifies enforcement protection for FOQA programs. It states that except
for criminal or deliberate acts, the Administrator will not use an operator’s FOQA
data or aggregate FOQA data in an enforcement action against that operator or its
employees when such FOQA data or aggregate FOQA data is obtained from a FOQA
program that is approved by the Administrator.”
“However, in order to qualify for the enforcement protection afforded by this rule, the
rule provides that FAA initial and continuing approval of the proposed program
would be required, as well as the submission of aggregate FOQA information to the
FAA.”
The FAA sees benefits from an FDM programme because it provides information on
the national aviation system to allow the assessment of the safety and efficacy of the
operational use of the national airspace, it generates empirical data that can be used to
evaluate new programmes and it serves as a catalyst for voluntary information
exchanges.14
Airlines are not generally required to submit findings from their FDM programmes to
their relevant regulatory authority. The exception to this rule is in China where the
airlines are required to submit their monitoring results to the relevant government
department.11 However, other airlines such as British Airways, KLM and TAP Air
Portugal produce summary documents for their management and these documents are
also sent to their regulators. Lufthansa and Air France, on the other hand, do not
provide any FDM information to their respective regulators.15
From a regulatory point of view, only the Chinese CAA currently requires the
submission of FDM bulletins produced by airlines for communication of FDM issues.
However, the Swiss CAA requests a copy of FDM-related safety bulletins as part of
their auditing system and the French, Irish and UK CAA would like to receive
information regarding lessons learnt, rather than detailed data, from the FDM

Chapter 2 – Background
13
programme, in order to disseminate this to other operators. As noted above, the FAA
requires data submission from carriers with FAA-approved FDM programmes.
2.5 Implementing and running an FDM programme
Implementing and running an FDM programme requires an airline to have a system
and documented procedures in place to achieve the following:
• Continuously record up to several hundred flight parameters from aircraft
systems and sensors. This may entail equipping aircraft with specialised
recording devices known as quick access recorders (QARs).
• Physically transfer the QAR recording media to a suitable location for replay
and analysis.
• Transcribe the data recorded on the QAR media into a format which is suitable
for further analysis.
• Analyse the transcribed data to identify individual flights, establish phases of
flight (such as taxi, take-off, cruise, descent, approach, landing) and identify
abnormal events or departures from defined limits (known as exceedances).
• Generate reports and graphs to assist personnel in interpreting the results of
the analysis.
• Keep a record of previous events so that trends over time can be determined.
The details of an FDM programme will be described in depth in Chapter 3.

Chapter 3 – Explanation of FDM
14
3 Explanation of FDM
3.1 Capturing flight data on aircraft
Aircraft have several systems in them, such as propulsion, navigation, autopilot,
communication and flight control systems. These systems contain a vast amount of
information relating to the aircraft and its flight, for example throttle position, fuel
flow, engine temperature, compass heading, altitude, pitch angle, roll angle, airspeed,
elevator position and hundreds of others. These items of information are known as
parameters and most are presented to the flight crew in the cockpit.
The parameters all pass through the aircraft’s data acquisition unit (DAU) for
processing and formatting. This unit has a variety of proprietary names, depending on
the manufacturer, for instance Flight Data Interface Unit (FDIU), Data Management
Unit (DMU), Flight Data Management Unit (FDMU), Flight Data Acquisition Unit
(FDAU), Flight Data Acquisition & Management System (FDAMS), Digital FDMU
(DFDMU) and Digital FDAU (DFDAU).
Software in the DAU determines what parameters are captured, how many times per
second they are recorded and how all the parameters are put together into a data
frame. A single data frame consists of four seconds of encoded flight data. The data
frame is made up of four subframes, each one second long, and each subframe is
made up of a number of data words. A data word contains the binary value of the
aircraft parameter in question and there can be 64, 128, 256 or 512 words per
subframe.
The first data word in each subframe is a synchronisation word and it is a unique code
for each of the four subframes. Thus, each data frame begins with a specific
combination of four subframe synchronisation words. This specific combination is
repeated for every single data frame and it is used to identify where a new data frame
begins. In theory, all the data words in a particular subframe could record different
parameters, that is up to 512 different parameters per subframe. In practice, if a
parameter is sampled more than once a second it will appear more than once in each
subframe. Similarly, each of the four subframes can, in theory, record a completely

Chapter 3 – Explanation of FDM
15
different set of data words to each other. In practice, many parameters are sampled
once a second so they will appear in each subframe. Others, such as certain engine
parameters, are only sampled once every two seconds or even once every four
seconds. They will not, therefore, appear in every single data frame.
The layout of a data frame is shown diagrammatically in Figure 5 below.
Figure 5 - Representation of a single data frame output from a DAU
DATA FRAME Subframe 1 Subframe 2 Subframe 3 Subframe 4
Data Word 1st second 2nd second 3rd second 4th second
1 Sync Word 1 Sync Word 2 Sync Word 3 Sync Word 4
2 Heading Heading Heading Heading
3 Pitch Att Roll Att Pitch Att Roll Att
4 Vertical G Vertical G Vertical G Vertical G
12 Vertical G Vertical G Vertical G Vertical G
256 Fuel Flow
Engine #1
Fuel Flow
Engine #2
Fuel Flow
Engine #3
Fuel Flow
Engine #4
Source: Spirent Systems
This example shows that the following information:
• The first data word in each subframe contains a unique synchronisation word
• The second data word in each subframe contains the aircraft’s heading which
is sampled every second
• The third data word in the first and third subframes records the aircraft’s pitch
attitude whilst in the second and fourth subframes it records the aircraft’s roll
attitude. This indicates that pitch and roll attitude are sampled every two
seconds.
• The fourth and twelfth data words in each subframe record the aircraft’s
vertical acceleration. This indicates that vertical acceleration is sampled twice
every second.

Chapter 3 – Explanation of FDM
16
• The last data word, number 256 in this example, records the fuel flow to each
engine in turn. Thus, for this four-engined aircraft, the fuel flow to a particular
engine is sampled once every four seconds.
Once the DAU has processed and packaged the data into a frame, the frame is output
to the FDR. The data acquired by the DAU can also be output to a QAR. The QAR
can be configured to record far more parameters than the legal minimum required for
the FDR. Typically, the QAR is located in the cockpit or electronics bay of the
aircraft and the data frames are recorded on to a magneto-optical (MO) disk or
Personal Computer Memory Card International Association (PCMCIA) cards,
commonly known as PC cards. Early QARs recorded data on to tape cartridges and
although these are still in widespread use in the industry, new aircraft generally use
MO disks or PC cards as the recording medium. The recording media used by QARs
and the location of the QARs in the aircraft make it easier to access and remove the
flight data from the unit, hence the name quick access recorder.
However, it is not mandatory to have a QAR fitted to an aircraft. Early generation jet
aircraft such as Boeing 727, McDonnell-Douglas DC-9, Airbus A300 and aircraft
built through the 1990s are unlikely to be equipped with QARs, unless this was
specifically requested by the airline and supplied as part of the buyer-furnished
equipment. New aircraft delivered to airlines will typically be fitted with some kind of
QAR as part of the standard equipment.
Figure 6 shows an optical QAR (OQAR), so-called because it records data on to MO
disks.

Chapter 3 – Explanation of FDM
17
Figure 6 - Picture of an OQAR
Source: Penny and Giles16
Airlines can choose what parameters they want to be recorded on the QAR and this
can range from a few hundred parameters for early generation aircraft like the Boeing
757 to over a thousand parameters on new generation aircraft like the Boeing 777.
Figure 7 below gives an indication of the number of parameters that are recorded by
the QAR on different aircraft in British Airways’ fleet.
Figure 7 - Number of QAR parameters recorded by fleet type at British Airways
Source: British Airways7
0 500 1000 1500 2000 2500
Variables Discretes
B777-200
B747-400
B767-300
A320
B757-200
L1011
Concorde
B747-200
B737-200
DC10
BAC1-11
B777 data:
60,000 available
2,000 to QAR
700 to FDR
32cm
12cm
19cm
Mass < 7kg

Chapter 3 – Explanation of FDM
18
The data for an FDM programme can thus be captured either by an FDR or a QAR.
The principle advantage of using data captured on the FDR is that the recording
system is already required on all transport aircraft so there are no additional costs in
acquiring new hardware for this element of the FDM programme.
However, FDRs are not designed or located for frequent access and downloads of the
data. This would make it time-consuming to download the data regularly and could
also cause additional wear on the FDR requiring increased maintenance. (If it was a
solid state FDR (SSFDR) the data would be recorded on to integrated circuits rather
than tapes, making it easier to download, although access would still be difficult.)
Another factor is that FDRs are not currently required to record a large number of
parameters. The 1997 FAA flight recorder rule states that aircraft, seating 20 or more
passengers, which are manufactured after August 18 2002, must have FDRs which
record a minimum of 88 parameters, out of the thousands which are now available on
modern aircraft. Aircraft manufactured before this date have even lower minimum
limits.17
Finally, the most advanced FDRs can currently store only 25 hours of flight data
compared with up to 960 hours of data which can be stored on a QAR. Thus, using
the FDR for an FDM programme would necessitate far more frequent data downloads
with an associated increase in manpower costs.
For the reasons outlined above FDM programmes are usually run with QARs.
However, airlines may choose to use a combination of capturing data with FDRs or
QARs depending on the mix of aircraft they operate, the planned life of the aircraft
with the airline and the ownership of the aircraft.
The next stage in an FDM programme involves downloading the flight data recorded
on the aircraft so that it can be taken to a ground facility for analysis. This is discussed
in section 3.2.

Chapter 3 – Explanation of FDM
19
3.2 Downloading flight data from aircraft
In the majority of FDM programmes the flight data is downloaded from either the
FDR or the QAR.
If a QAR is used, downloading the data involves physically removing the recording
medium (tape, MO disk or PC card) from the QAR and replacing it with another one.
This can be done during a normal turnaround and takes around half a man-hour,
including collecting the new tape, disk or card from stores, replacing it on the aircraft
and completing the associated entry in the aircraft’s technical log.
If the data is downloaded from the FDR this will most probably be done while the
FDR is still on the aircraft. Alternatively, the FDR can be removed from the aircraft
and sent to a workshop where the data can be downloaded. However, due to the
limited data capacity on the FDR, data downloading will have to be carried out very
regularly. If the FDR is removed every time the data is to be downloaded, this will
necessitate frequent removals of the FDR which is undesirable from a reliability and
logistics point of view. Thus, it is better to download data directly from the FDR
whilst it is still on the aircraft. Whether the procedure is carried out on the aircraft or
in a workshop, it will require an interface unit which can be connected to that
particular type of FDR. This unit will typically download the data on to a PC card,
although with some download units it is possible to send the data electronically to the
analysis facility, without the need for PC cards.
One vendor supplies a unit to download FDR data directly on the aircraft. The unit
can only be used with one aircraft at a time so it may be necessary to have more than
one unit, depending on the size of the airline’s fleet and the frequency of downloads.
Alternatively, the vendor can supply a desktop interface for replaying FDRs in a
workshop environment. Once again, the total number needed would depend on the
total fleet size, the number of spare FDRs and the time that the FDR is available in the
workshop.
An alternative to downloading data from either the QAR or FDR is available on
aircraft with a newer type of DAU. This newer DAU has the facility to record flight

Chapter 3 – Explanation of FDM
20
data directly on to a PC card housed within the DAU, in addition to outputting data to
the FDR and a QAR if necessary. Thus data can be downloaded from the aircraft
simply by removing the PC card from the DAU, in a similar manner to the QAR.
The data downloads typically take place every three to twenty days.
3.3 Transferring flight data to an analysis centre
Most airlines will have a single facility where they replay the flight data from their
aircraft and perform further analyses on the data. The media that the data is recorded
on thus need to be sent from the aircraft’s location to the analysis centre. This is
usually achieved via secure internal company mail, due to the sensitive nature of the
data. In order to aid this process, data downloads are usually only performed when the
aircraft is at the airport closest to the analysis centre.
At Virgin Atlantic, staff from the airline’s headquarters have to visit every aircraft at
least once every week to update the documentation on the aircraft. Part of the duties
of these staff include collecting any MO disks which have been removed from the
aircraft and returning them to the analysis facility at the airline’s headquarters.
It is also possible to transfer data electronically from remote sites, for example line
stations or main hangars, to the analysis centre. In order to do this, though, the data
must be encrypted to protect it and the transmission line must be secure.
3.4 Replaying flight data
Once the raw data is at the analysis facility, usually on a QAR tape, MO disk or PC
card, it must be replayed to convert it from binary data into engineering units, for
example to change the binary number 000011101011 into the decimal number 235,
which might represent the aircraft’s indicated airspeed in knots. To perform this
conversion, it is necessary to know where each data frame begins on the recording
(this is identified by the combination of the four unique subframe synchronisation
codes, as described in section 3.1), how many words each frame contains, what

Chapter 3 – Explanation of FDM
21
parameters are recorded, what their sampling rate is and what conversions or
equations were used in recording the parameters.
This replay and conversion is carried out by software which must be purchased from a
vendor. The software is customised for each airline and has specific modules to deal
with each fleet in the airline, since different aircraft will have different data frame
layouts.
As part of this replaying process, the data is checked for errors or anomalies and bad
or inconsistent data is noted and filtered out. Once the raw data has been converted
into engineering units it is further analysed by the software as described in the next
section.
There are several companies which provide the replay software and the cost of the
software will depend largely on how much analysis the airline wishes to perform. The
airline may also have to invest in new computer hardware to run the software
efficiently, as well as storage facilities to archive the flight data.
Any new aircraft types introduced by the airline will have to be included in the FDM
programme which will mean buying in additional software modules to analyse the
data from their recorders. For these purposes, aircraft which are stretched or shortened
models of a basic airframe would be considered a different fleet type. Thus, the
Airbus A321 would require a different software module to the Airbus A320. Other
software modules can be purchased to perform analyses of engine data and aircraft
performance data.
When the analysis software is first bought, the FDM users will need to be trained in
its use. The level of training required depends on the sophistication of the software
being purchased but typical training courses run from three to ten days.
On top of this, there is usually an ongoing maintenance support contract in order to
rectify specific problems encountered by the airline, provide software upgrades to the
airline as they are issued and assist with any queries the customer may have.
Chapter 3 – Explanation of FDM
22
Typically, the annual maintenance and support fee is between 10% and 20% of the
price of the replay software.
3.5 Analysing flight data
Once the data is in engineering units it can be further analysed to determine if certain
parameters have exceeded pre-determined limits. Such exceedances are known as
events and examples include:
• high descent rate below an altitude of 400ft
• approach speed low below an altitude of 50ft
• unstick speed high
• maximum operating altitude exceedance
• late selection of flaps to landing configuration
• high normal acceleration on the ground (hard landing)
• engine over-temperature
• excessive bank angles
• deviation from glidepath
There can be over 100 such events defined by an airline and these must be checked
for every flight of every aircraft. Thus the only way to do this practically is through
using computer software which searches through specified parameters in the flight
data and checks if the limits have been exceeded. These limits can be specified by the
airline and changed when required.
Following this analysis, any events which have been identified by the software are
highlighted and stored for further analysis. The remaining data can be archived if the
airline needs it or else it is simply deleted from the QAR recording medium which can
then be used again on the aircraft. At some airlines the policy is to retain flight data
from the FDM programme, including that relating to individual events, for thirty
days.18

Chapter 3 – Explanation of FDM
23
The events detected by the software are presented to the FDM analyst who then has to
confirm that the events are genuine and not due to bad data or circumstances
particular to that flight. For instance, on certain approaches into New York, the
aircraft is deliberately flown with a certain deviation from the instrument landing
system (ILS) approach. This deviation is detected as an abnormal event because it can
be a precursor to a landing accident. However, if the analyst sees that such an event
has been detected on this particular New York approach then the event can be
discarded as invalid.
Any events which have been detected and validated by the FDM analyst are stored in
a database. If the event is serious, data from the analysis may be used to support an
internal investigation, possibly in conjunction with an air safety report (ASR) which
has already been raised for the event. The database of events can be used to monitor
trends, for instance, if a certain fleet of aircraft is experiencing a particular event, such
as a hard landing, more frequently than other fleets.
FDM analysts may also be required to produce periodical bulletins or reports for
various departments as well as investigating other ways to use the data in order to
maximise the benefit from the FDM programme. This manpower requirement is
usually the most significant on-going cost item in an FDM programme.
Finally, flight data can be used to recreate a flight on a computer, providing
visualisation of the cockpit instruments and three dimensional external views of the
aircraft’s flight. This is useful for training purposes and also in investigating serious
events or incidents.
The FDM process is summarised in Figure 8 below.

Chapter 3 – Explanation of FDM
24
Figure 8 - Overview of FDM programme
Source: Sagem19
3.6 Practical considerations of FDM programmes
In practice, an airline will typically have a small group of employees in its safety or
quality departments whose duties include running the FDM programme. The FDM
programme should be part of a broader safety management system within the airline.
The flight data, and particularly records of any abnormal events, are normally
considered sensitive in nature so the data is often de-identified. This means masking
any information which could lead to identification of the flight or its cockpit crew,
such as flight number, date, commander’s name, airport code and aircraft registration.
The flight data is considered confidential and access to it is limited. In case further
action needs to be taken against a pilot, such as extra training measures, there is
usually a pilot union representative involved with the FDM programme. The airline’s
pilot union will usually have a documented policy regarding the use of data obtained
from an FDM programme.

Chapter 3 – Explanation of FDM
25
Different personnel involved with the FDM programme will have different levels of
access to the flight data. The FDM programme manager will normally have full
access to all the data, including the identity of particular flights, and this person will
also be able to set privilege levels for other users. Other members may be allowed to
edit certain data or they may be restricted to only viewing de-identified data.
3.7 Hardware and software requirements of FDM
programmes
The following are the main hardware and software requirements for an FDM
programme:
• a data recorder on every aircraft in the fleet (either an FDR or QAR).
• sufficient QAR media to replace the ones being analysed or an interface unit
to download data directly from the FDR.
• a replaying device capable of replaying all the different types of QAR media.
This may be a separate device or a special drive on a standard computer.
• software to replay the QAR media or download the data from the FDR
• software to analyse the flight data and identify exceedances.
• computer storage space to archive data and maintain a database of events.
3.8 Manpower requirements of FDM programmes
The main requirements for manpower occur in:
• the removal of the recording media from the QAR and replacing them again;
or the downloading of data directly from the FDR on board the aircraft
• transporting the QAR media or stored FDR data to the analysis facility
• loading the QAR media for analysis or transferring the FDR data to the
analysis system
• analysing the final output from the software package to determine if events are
genuine and understanding the causes behind them. This analysis can be very
detailed, especially if further reports have to be written.
Chapter 3 – Explanation of FDM
26
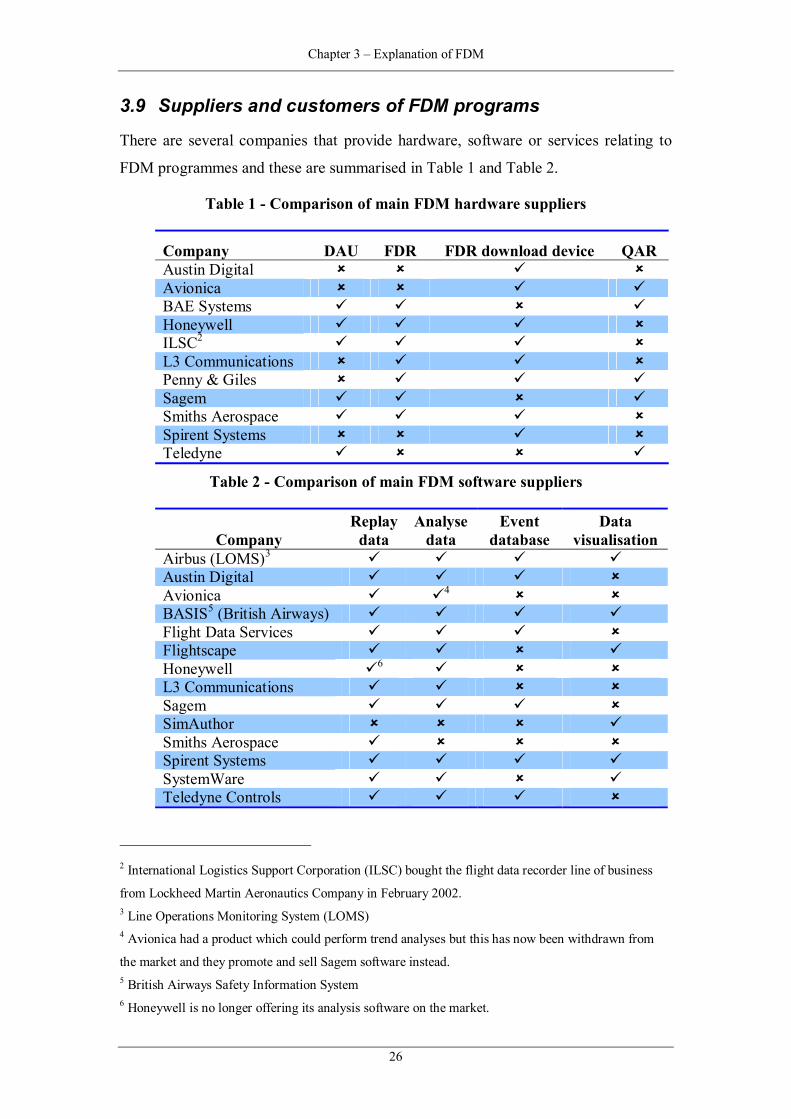
3.9 Suppliers and customers of FDM programs
There are several companies that provide hardware, software or services relating to
FDM programmes and these are summarised in Table 1 and Table 2.
Table 1 - Comparison of main FDM hardware suppliers
Company DAU FDR FDR download device QAR Austin Digital Avionica BAE Systems Honeywell ILSC2 L3 Communications Penny & Giles Sagem Smiths Aerospace Spirent Systems Teledyne
Table 2 - Comparison of main FDM software suppliers
Company Replay
data Analyse
data Event
database Data
visualisation Airbus (LOMS)3 Austin Digital Avionica 4 BASIS5 (British Airways) Flight Data Services Flightscape Honeywell 6 L3 Communications Sagem SimAuthor Smiths Aerospace Spirent Systems SystemWare Teledyne Controls
2 International Logistics Support Corporation (ILSC) bought the flight data recorder line of business
from Lockheed Martin Aeronautics Company in February 2002. 3 Line Operations Monitoring System (LOMS) 4 Avionica had a product which could perform trend analyses but this has now been withdrawn from
the market and they promote and sell Sagem software instead. 5 British Airways Safety Information System 6 Honeywell is no longer offering its analysis software on the market.

Chapter 3 – Explanation of FDM
27
3.10 Future improvements to FDM programmes
One of the difficulties in running an FDM programme efficiently is that large volumes
of data have to be recorded and transported from the aircraft to the analysis facility on
a regular basis. The use of QARs and tapes, MO disks or PC cards to achieve this is
costly and results in a logistics overhead to manage the process.
One FDM hardware manufacturer has developed a system which removes this
overhead. The system replaces the QAR with a more advanced version which is
capable of transmitting recorded flight data wirelessly. It uses existing cellular
networks for mobile telephones and transmits the data through an antenna built into
the QAR. This means that no modifications are required to the aircraft and no
receivers or fibre optic links need to be installed at airports. The data is then
transferred securely over the internet to the airline’s analysis facility.
The advantages of this system are that it eliminates the manpower, logistics and cost
overheads of manually removing recording media from QARs and transporting them
between the aircraft and the analysis centre. Data can be downloaded immediately
after every flight, rather than several days later, thus improving the effectiveness of
the FDM programme. Also, the risk of losing data due to faulty QARs or damaged
recording media is reduced. This is summarised in Figure 9 below.

Chapter 3 – Explanation of FDM
28
Figure 9 - Summary of the benefits of using wireless data transfer in an FDM
programme
Source: Penny and Giles Aerospace20
Next Generation Systems - Wireless
Analysis Facility
FDM
Improved safety
Improved efficiency,
reduced cost
Remove the manual overhead of retrieving flight data from the aircraft
Remove the manual overhead and logistics of storing and recycling large volumes of removable media
Reduce the operating costs of an FDM programme
Provide near real-time access to data for identification of short-term trends
Provide better access to flight data to better realise the engineering advantages to be obtained from an FDM programme

Chapter 4 – Costs
29
4 Costs
4.1 Overview of main cost items
The main components of cost in an FDM programme are the cost of the physical
equipment, such as QARs, recording media and computers for analysis, the cost of the
replay and analysis software, the cost of training and the cost of the manpower. The
implementation costs can be substantial, particularly for major international airlines
with large fleets.
Once the programme has been established, however, a major carrier is likely to find
that the manpower cost proves to be the most significant long-term item, as they will
typically need one full-time FDM analyst for every fifteen to twenty aircraft in the
fleet. Smaller regional airlines, on the other hand, may find that the ongoing
manpower costs are of similar magnitude to the cost of consumables, staff training
and software support.
An international European airline has estimated the breakdown of their on-going
FDM costs as follows:
a) Personnel - 80%
b) Software - 10%
c) Hardware - 5%
d) Administrative overhead - 5%
The costs of an FDM programme can broadly be considered in two categories:
1. the cost of the technology to capture and automatically analyse the flight data
2. the cost of the manpower needed to run the FDM programme
Clearly, the total cost of an FDM programme will also be affected by the number of
aircraft the airline operates and the mix of fleet types. The two components of cost
identified above are examined in detail in the following sections.

Chapter 4 – Costs
30
4.2 Capturing flight data on aircraft
In the majority of FDM programmes, data is captured with a QAR. If the aircraft in an
airline’s fleet are not already equipped with QARs then the installation of them will
entail the following costs:
• cost of purchasing the QARs
• aircraft downtime to install the QARs. This may be incorporated into existing
maintenance downtime but there will still be the additional man-hours
required to install the system.
• cost of spares and extra recording media (tapes, MO disks, PC cards).
A typical QAR would cost from USD 10 000 to USD 20 000, depending on the total
quantity being purchased and the configuration required. One QAR unit would be
required for each aircraft plus sufficient spares to cover unserviceability of the QARs.
The time and cost to install a QAR will vary depending on the generation of the
aircraft. Modern aircraft are manufactured with a slot in which a QAR can be fitted
and on these aircraft installation is simply a matter of slotting the QAR into the rack.
On older generation aircraft, however, it will be necessary to alter the wiring in the
aircraft and build in a rack for the QAR. Apart from the time for the physical
installation there is also the time required to design and certify the modifications. This
represents a significant cost, estimated at between USD 25 000 and 50 000.39
The approximate costs of the recording media used in QARs are as follows:
• MO disk - USD 5
• QAR tape - USD 20
• PC card - USD 350.
A large airline will require several hundred tapes, MO disks or PC cards to support its
fleet. Between five and ten tapes or disks per aircraft is usual, as this provides a buffer
in the system and allows for delays in the running of the FDM programme.

Chapter 4 – Costs
31
Typical costs for this part of an FDM programme are summarised in Table 3 below.
These are calculated for an airline which has twenty aircraft which have not been
delivered with QARs but which have been manufactured with the ability to fit them.
Two hundred MO disks are used to support the programme.
Table 3 - Typical costs of an FDM programme: part 1
Section Element of FDM Cost (USD)
4.2 Purchasing QARs 300 000
Installation of QARs 2 500 Purchasing MO disks 1 000
Total 303 500
4.3 Downloading flight data from aircraft
Assuming the flight data is captured on a QAR, downloading the data is simply a
matter of removing the recording media from the QAR and replacing it. This typically
takes half a man-hour. At one international British airline maintenance costs are
calculated at USD 65 per hour. Therefore, a typical cost for this part of an FDM
programme would be around USD 40 000, assuming the recording media are removed
every five to seven days and a fleet size of twenty aircraft. This is shown in Table 4.
Table 4 - Typical costs of an FDM programme: part 2
Section Element of FDM Cost (USD)
4.2 Purchasing QARs 300 000
Installation of QARs 2 500 Purchasing MO disks 1 000
4.3 Downloading data 40 000
Total 343 500
4.4 Transferring flight data to an analysis centre
It is assumed that this will be achieved as part of the normal maintenance or
operational activities that are in existence at the airline. Thus there will be no extra
cost incurred during this phase of the FDM programme.

Chapter 4 – Costs
32
4.5 Replaying flight data
The main elements of cost involved with the replaying of data are as follows:
• computer hardware
• replay software
• staff training
• support contract
Most FDM programmes can be run on standard computer hardware. A suitable
system can be purchased for under USD 3 000. The cost of the replay software can
range from USD 65 000 to 200 000 per licence, depending on the number of fleet
types, the level of analysis and the vendor. Training costs range between USD 500
and 1 200 per day, depending on the length of the overall training period. The support
contract is an annual fee and is typically 15% of the cost of the software. These costs
are summarised in Table 5 below.
Table 5 - Typical costs of an FDM programme: part 3
Section Element of FDM Cost (USD)
4.2 Purchasing QARs 300 000
Installation of QARs 2 500 Purchasing MO disks 1 000
4.3 Downloading data 40 000
4.5 Computer hardware 3 000 Replay software 150 000
Staff training 5 000
Support contract 22 500
Total 524 000
4.6 Analysing flight data
As an example of the manpower required during the analysis, at one British carrier
approximately 1 000 flights are analysed each month. On average, one event is
detected per flight (although in practice many flights will have no events and a few
flights will have several events.) The analyst must briefly validate each event to
determine if it is legitimate. An analyst can validate around three events a minute on
average, so the validation of all these events takes around 5.5 hours per month.

Chapter 4 – Costs
33
Once the events have been validated some of them will require more detailed
investigation. Approximately one in ten events will need to be studied in more detail
and such analysis would typically take around twenty minutes per event. This gives
rise to about 33 hours of analysis per month. Thus the event validation and detailed
analysis take 38.5 hours per month which is equivalent to one working week.
The replay of each MO disk takes about twenty minutes and this operator receives at
least one disk from each aircraft every week. Thus, there are around one hundred
disks to replay each month which takes around 33 hours, equivalent to approximately
another working week in terms of man-hours. In practice, other work can be carried
out whilst the disk is being replayed so there is some overlap.
Apart from this basic replay work, an analyst will also have to prepare news bulletins
on the findings from the FDM programme, arrange regular meetings with interested
parties and liaise with a number of other departments to obtain and share information.
That is why an airline with a fleet of over twenty aircraft will need at least one full-
time FDM analyst to run the programme. Such an analyst could expect to earn a
salary of at least USD 45 000. The total costs for setting up and running an FDM
programme for one year are summarised in Table 6.
Table 6 - Typical costs of an FDM programme: part 4
Section Element of FDM Cost (USD)
4.2 Purchasing QARs 300 000
Installation of QARs 2 500
Purchasing MO disks 1 000
4.3 Downloading data 40 000
4.5 Computer hardware 3 000
Replay software 150 000 Staff training 5 000
Support contract 22 500
4.6 FDM analyst salary 45 000
Total 569 000

Chapter 4 – Costs
34
4.7 Start-up and recurring costs
The estimated cost of USD 569 000 quoted above is made up of costs which are
incurred at the start of an FDM programme as well as costs that occur regularly
throughout the programme. It is therefore useful to consider the costs in the following
two categories: start-up cost and recurring costs.21
4.7.1 Start-up costs
These relate to one-time costs for initially setting up an FDM programme or
introducing new aircraft types into the programme. Such costs would include:
• cost of hardware to be installed on aircraft, such as QARs and any necessary
cables or mountings.
• cost of modifications to the aircraft. This will be incurred if an older
generation aircraft type is being fitted with a QAR and the airline is required
to seek a supplemental type certificate (STC) for the aircraft as a result of the
modification work required to fit a QAR.
• labour costs during installation of the equipment on the aircraft.
• loss of revenue due to the aircraft downtime during installation of the
equipment.
• cost of other hardware required for the FDM programme, such as a unit to
download data directly from FDRs, computer hardware to run the software for
replaying and analysing flight data.
• cost of the replay and analysis software, including specific software modules
for each aircraft type.
• initial training of FDM staff.
4.7.2 Recurring costs
These relate mainly to the manpower costs in running an FDM programme and
include:
• salaries for full time and part time FDM staff.
• additional training either for new FDM staff or for new software in the FDM
programme.

Chapter 4 – Costs
35
• engineering and maintenance costs associated with the FDM equipment, such
as inspections and overhauls of QARs and man-hours for downloading data or
removing FDRs or QAR recording media.
• logistics costs for transporting recording media, such as MO disks or PC cards,
securely to and from the analysis centre.
• cost of consumables such as the QAR recording media and office supplies in
the FDM department.
Table 7 is derived from Table 6 and shows a comparison between the start-up costs
and the significant recurring costs. The start-up costs include the one-off installation
and set-up costs as well as the recurring costs in the first year, and are called the first
year costs.
Table 7 – Comparison of first year costs versus recurring costs of an FDM
programme
Section Element of FDM First year costs (USD) Annual Cost (USD)
4.2 Purchasing QARs 300 000 -
Installation of QARs 2 500 -
Purchasing MO disks 1 000 -
4.3 Downloading data 40 000 40 000
4.5 Computer hardware 3 000 -
Replay software 150 000 -
Staff training 5 000 -
Support contract 22 500 22 500
4.6 FDM analyst salary 45 000 45 000
Total 569 000 107 500
4.8 FAA estimate of FDM costs
As part of their FDM demonstration project DEMOPROJ the FAA estimated the costs
to airlines in setting up an FDM programme. The estimate covered the cost of
equipping 15, 50 and 100 aircraft with QARs, the cost of purchasing a software
analysis system and the cost of salaries for FDM staff. The equipment costs were
based on the prices paid to vendors in the actual project and they were amortised over

Chapter 4 – Costs
36
five years in order to obtain annual estimates. The staff costs were based on costs
from one of the airlines which participated in DEMOPROJ.22 The results are
summarised in Table 8 below.
Table 8 – FAA estimated total annual costs by fleet size for an airline setting up
an FDM programme.
Fleet size (no. aircraft) 15 50 100
Equipment costs (USD) 98 500 259 000 492 000
Personnel costs (USD) 385 000 500 000 775 000
Total annual costs (USD) 483 500 759 000 1 267 000
The figures are from 1997 so they are somewhat lower than the calculation above.
However, they are of the same magnitude, although the cost breakdown is different.
This difference arises from spreading the initial set-up costs over five years and, it is
believed, from using higher staff salaries.
4.9 Effect of aircraft size and fleet size on FDM costs
From the above analysis it is apparent that the costs of setting up and running an FDM
programme are independent of the size of the aircraft. Thus, a regional airline
operating a fleet of twenty Fokker 50s will incur virtually the same costs as an
international airline with a fleet of twenty Boeing 747s. This is a disadvantage to the
regional airline as the costs become a more significant element of their revenue. For
the international airline, the costs are minimal, especially when compared to
expenditure in other areas such as in-flight entertainment.
As an airline grows, more flight data will be generated and it will be necessary to add
staff to the FDM programme in order to run it effectively. This could entail extra
training costs, possibly another licence for the replay and analysis software as well as
the salary of the new FDM analyst. In terms of hardware, more QARs and recording
media would need to be purchased, and possibly additional computer hardware.

Chapter 5 – Benefits
37
5 Benefits
5.1 Overview
The principal benefit of an FDM programme has traditionally been perceived as
improved safety in flight operations. However, other benefits arise from the additional
data available on aircraft and engine systems. This additional data allows the airlines
to optimise the operating characteristics of its aircraft, such as fuel consumption,
while avoiding unplanned costs such as unnecessary engine maintenance.
Transport Canada’s Transportation Development Centre identified some further
savings in the areas of maintenance, warranty claims, reduced insurance premiums
and increased aircraft availability as well as improved pilot training programmes and
operating procedures. 23
5.2 Main benefits
The benefits can be classified into two areas: safety benefits and cost benefits.
5.2.1 Safety benefits
Safety benefits arise from the increased level of knowledge an airline has of how its
aircraft are being operated. The detailed data available from an FDM programme
allows the airline to determine what its risks are in certain areas and to monitor these
risks over time. Once it knows where its main risks lie, it can train its pilots to handle
and minimise these risks, thereby improving its operations. The safety benefits can be
summarised as follows:
1. improved pilot training programmes
2. improved operating procedures.
3. improved safety in flight operations
4. more detailed investigation of ASRs
These improvements should result in the airline being less likely to have a potentially
fatal accident or incident. It should be noted that an FDM programme is particularly

Chapter 5 – Benefits
38
suited to avoiding certain types of accidents and incidents. These are ones which
occur during the take-off, approach and landing phases of a flight. Other types of
accidents or incidents, such as runway incursions, are unlikely to be influenced by an
FDM programme.
5.2.2 Cost benefits
Cost benefits arise when the data from an FDM programme is used to reduce a
particular cost incurred by the airline. Traditionally, the vast quantity of data available
on aircraft systems has lent itself to reducing costs in the engineering and
maintenance departments. However, as the use of FDM programmes has become
more sophisticated, cost benefits have been identified in other areas as well. The main
areas where cost benefits can be realised are listed below:
1. increased aircraft availability
2. optimum fuel consumption
3. avoiding unnecessary engine maintenance
4. other maintenance activity
5. warranty and liability claims
6. reduced insurance premiums
7. reduced Aircraft Communications Addressing and Reporting System
(ACARS) messages
8. avoiding noise fines
9. reduced number of FDR downloads
It is evident that some of these cost benefits are linked directly to the safety benefits.
For instance, if an airline’s pilots fly their aircraft closer to the standard operating
procedures (SOPs) they are less likely to have an accident or incident. The airline will
thus be safer and make fewer claims on its insurance company. This should then be
reflected in reduced insurance premiums.
There are some other, more general benefits that can arise from having an FDM
programme. These are as follows:
1. improvements to infrastructure

Chapter 5 – Benefits
39
2. monitoring of franchisees
3. research
4. consultancy
These areas of benefits will be discussed in more detail individually, giving examples
wherever appropriate.
5.3 Safety benefits
5.3.1 Improved pilot training programmes
Analysis of operational flight data may indicate that a particular event is occurring
regularly and appears to be related to how pilots have been trained to fly the aircraft.
In such cases, altering the training programme could reduce the number of events, and
this can be verified later by FDM data. Sometimes, only very minor changes are
necessary to the training programme.
As an example, a British operator found from its FDM programme that there was an
increase in flap placard speed (the maximum speed allowable with flaps extended)
exceedances by pilots converting from the Airbus A320 to the heavier Airbus A321.
This information was fed back to the newly converted pilots and immediately resulted
in a reduced number of incidents.26
By analysing the data from the entire airline’s operations, rather than just looking at
specific events, it may be possible to show that pilot performance is consistently
good. For instance, in looking at a particular parameter, such as rate of descent during
the approach, there may be a small standard deviation and the mean may remain
constant over time. As a result of this information it may be possible to justify
reducing the amount of recurrent training pilots receive each month. If this saves five
hours of training per pilot per month it is possible to calculate the annual savings
based on the average pilot’s salary and cost of simulator time.
In the United States, the FAA runs an Advanced Qualification Program (AQP) for
pilot training and checking. Within this there is a single visit training (SVT) concept

Chapter 5 – Benefits
40
which allows for better training of pilots in a single visit to a training facility every
twelve months. However, if an airline can show that its pilots’ performance on a
certain fleet type is very good the FAA may accept a proposal to extend the SVT
cycle from a twelve month cycle to a thirteen month cycle. This would result in a one
month reduction in training costs.34
5.3.2 Improved operating procedures
The benefit of FDM programmes in improving operating procedures is best illustrated
by a case study.24
The example relates to the standard take-off procedure for commercial aircraft. When
an aircraft is taking off it must reach a certain speed before the wings will be able to
generate enough lift to allow the aircraft to fly. At this rotation speed, called VR, the
nose of the aircraft is raised to a pitch attitude of around 12 to 15 degrees. The aircraft
then leaves the ground and gains altitude, whilst continuing to accelerate. During this
initial climb, there is a minimum safe climb-out speed, called V2. This is the speed
that the aircraft must maintain in order to achieve a sufficient climb rate should an
engine fail during take-off. A normal climb-out speed is between V2 + 15kt and V2 +
25kt. If the aircraft climbs-out at a speed below V2 and one of its engines fails the
aircraft is in danger of stalling or losing directional control, both of which can lead to
an accident.
In early 1992, a Boeing 767 belonging to an international airline took off from San
Francisco International Airport. During the initial climb, the speed decreased close to
V2 with the aircraft pitch attitude increasing to 24 degrees at an altitude of 2600ft. The
pitch attitude was then reduced by the pilot but the speed continued to decrease until it
reached a minimum of V2 – 25kt.
This was the most serious of a series of take-off speed regression events that were
regularly detected by the FDM programme since that airline introduced the Boeing
767 into service. To address this, pilots were alerted to the incidents and instructed to
limit the pitch attitude of the aircraft to 20 degrees. Over the next three years the
frequency of the incidents reduced but in early 1995, another Boeing 767 took off

Chapter 5 – Benefits
41
from San Francisco and experienced a similar speed regression, indicating the
problem had not been solved.
The airline’s Flight Analysis department subsequently studied all 80 Boeing 767 take-
offs over a nine day period in March 1995 from which they made the following
discoveries:
• 36 take-offs (45%) showed a speed regression greater than 10kt
• 8 take-offs (10%) showed a speed regression down to V2 (equivalent to an
approximately 20kt speed regression)
• all the regressions occurred with an aircraft pitch attitude of 17 to 19 degrees
These findings were discussed with pilots, who gave their observations from the
flights. From this discussion it was determined that the automatic flight director,
which showed pilots what pitch attitude to adopt during the climb-out, was placing
undue emphasis on aircraft pitch attitude at the expense of airspeed. Thus, pilots were
given new instructions to stop the rotation at 15 degrees, adjust the aircraft pitch to
maintain a suitable airspeed and to ignore the flight director until reaching an altitude
of 1500 ft.
At the end of June 1995, a new study of 100 take-offs was carried out. This revealed
that only one take-off (1%) had a significant speed regression to V2 + 3kt, with the
aircraft pitch maintained at 17 degrees.
By early 1996 the problem seemed to have been entirely eliminated. Of 1500 take-
offs analysed, only two (0.1%) experienced a climb-out speed less than V2 +10kt.
Thus the operating procedure during take-offs on the Boeing 767 fleet had improved
significantly since 1992.
5.3.3 Improved safety in flight operations
Better pilot training encourages pilots to follow the improved SOPs more closely.
The direct result of this is that the airline’s operations become safer. Many airlines
with FDM programmes have reported improvements in the operation of their aircraft,
particularly in the landing and approach phases of flight. These are the phases of
flight during which most accidents occur and by improving operational performance

Chapter 5 – Benefits
42
in this area the likelihood of an accident or incident is reduced. Examples of
improvements in these areas could include more stabilised approaches, better control
of sink rates and aircraft attitude on touchdown.
An example of improved safety in flight operations comes from British Airways.25 In
1991, they were experiencing many false ground proximity warning system (GPWS)
warnings. Analysis of 300 warnings revealed that only 13% were genuine. As a
result, the flight crew’s perception of the warning system was poor which meant that
only 40% of all the warnings received the correct response.
However, seven of the 39 genuine warnings received no response at all. This lack of
action could have resulted in a controlled flight into terrain (CFIT) type of accident.
Such a situation was a serious risk and therefore not acceptable. It was dealt with by
changing the policy regarding GPWS warnings, introducing GPWS simulator training
and helping the manufacturer to improve the warning system. Subsequent analysis of
120 warnings confirmed that they all received the correct response, thus proving that
the safety of the flight operations had been improved.
5.3.4 More detailed investigation of ASRs
An ASR is raised by a pilot whenever the pilot feels that the safety of a flight has been
compromised in some way. The ASR will give a brief explanation of the event but if
the airline wishes to examine the ASR in more detail it must gather extra data from
other sources. For ASRs of a technical nature, flight data can be used as part of the
investigation and, in such instances, an FDM programme will be also be helpful. Not
only will it allow data to be analysed from the flight in question but it will also allow
comparisons to be made with similar flights.
An example of this was an ASR that was raised by the pilot of an Airbus A340 at a
European airline. On the Airbus A340, fuel is stored in a trim tank in the tailplane at
the rear of the aircraft. As the fuel in the main wing tanks is burnt during cruise the
centre of gravity (CG) of the aircraft shifts backwards and fuel must occasionally be
transferred from the trim tank to the wing tanks, in order to keep the CG within limits.
This fuel transfer is carried out automatically by the flight management computer.

Chapter 5 – Benefits
43
During the incident reported, the pilot received a warning that the CG had exceeded
the rear limit and he had to manually transfer all the fuel out of the trim tank.
CG position is not a parameter that must be recorded by the FDR so during the
investigation of the ASR data had to be obtained from the QAR. Through the FDM
programme it was possible to analyse the particular flight and compare the profile of
the CG position on that flight with that of a normal flight. This information helped to
locate the source of the problem and it would have been much more difficult to do this
without the data from the FDM programme. As well as the safety benefit obtained
from investigating this ASR there was also a cost benefit because an improperly
balanced aircraft will burn more fuel.
5.4 Cost benefits
5.4.1 Increased aircraft availability
The increased aircraft availability can arise from the FDM programme reducing the
number of incidents which would render the aircraft unserviceable, such as a heavy
landing or tailstrike. It can also arise from the FDM programme preventing
unnecessary maintenance from being carried out by showing that an event was within
limits. Alternatively, it could detect a situation which requires maintenance but which
has not been picked up by the engineering department, such as an inspection of the
flaps if the flap placard speed has been exceeded. If this maintenance is not carried
out at a planned time it may result in the aircraft becoming unserviceable later on,
requiring unscheduled maintenance and disrupting the operating plan.
An example of an FDM programme preventing unnecessary maintenance is provided
by a British airline. On take-off from Gibraltar, the crew of a Boeing 737 saw an
engine over-temperature and decided to return. However, on the ground, analysis of
the flight data revealed that it was an extremely marginal excursion which was within
limits for the engine so the flight was able to continue. This avoided the total
cancellation of the flight and grounding of the aircraft until a spare engine could be
sourced.26
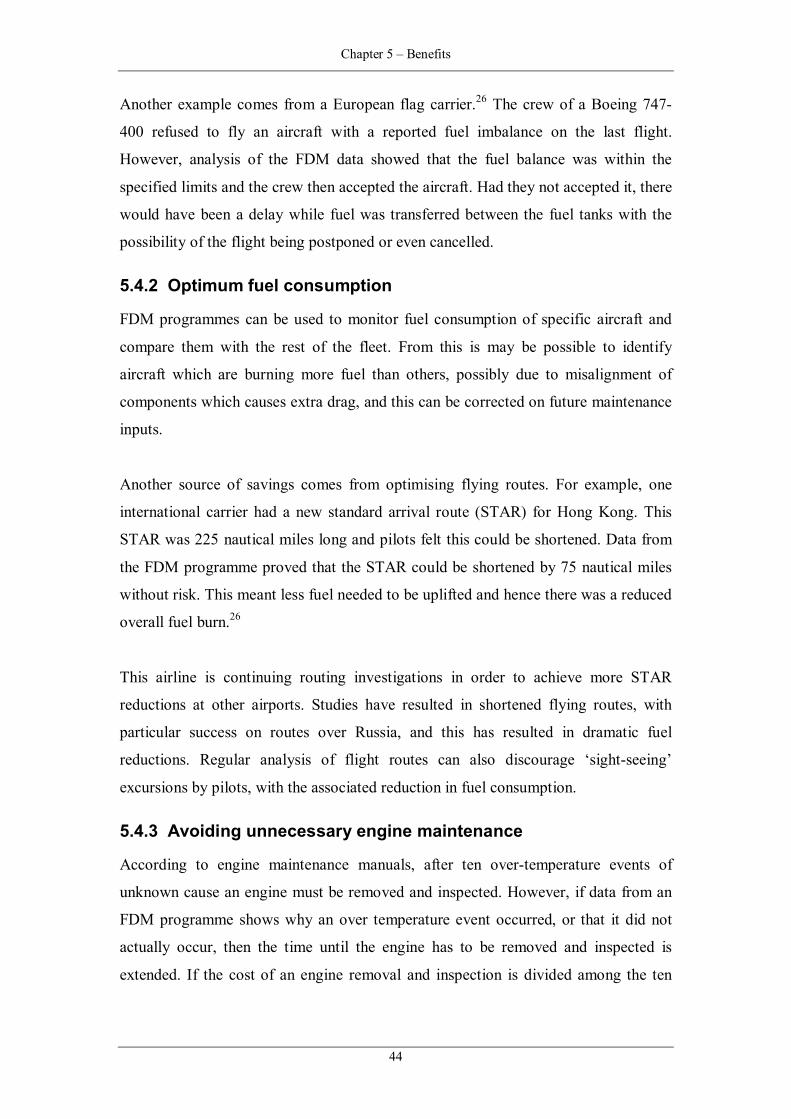
Chapter 5 – Benefits
44
Another example comes from a European flag carrier.26 The crew of a Boeing 747-
400 refused to fly an aircraft with a reported fuel imbalance on the last flight.
However, analysis of the FDM data showed that the fuel balance was within the
specified limits and the crew then accepted the aircraft. Had they not accepted it, there
would have been a delay while fuel was transferred between the fuel tanks with the
possibility of the flight being postponed or even cancelled.
5.4.2 Optimum fuel consumption
FDM programmes can be used to monitor fuel consumption of specific aircraft and
compare them with the rest of the fleet. From this is may be possible to identify
aircraft which are burning more fuel than others, possibly due to misalignment of
components which causes extra drag, and this can be corrected on future maintenance
inputs.
Another source of savings comes from optimising flying routes. For example, one
international carrier had a new standard arrival route (STAR) for Hong Kong. This
STAR was 225 nautical miles long and pilots felt this could be shortened. Data from
the FDM programme proved that the STAR could be shortened by 75 nautical miles
without risk. This meant less fuel needed to be uplifted and hence there was a reduced
overall fuel burn.26
This airline is continuing routing investigations in order to achieve more STAR
reductions at other airports. Studies have resulted in shortened flying routes, with
particular success on routes over Russia, and this has resulted in dramatic fuel
reductions. Regular analysis of flight routes can also discourage ‘sight-seeing’
excursions by pilots, with the associated reduction in fuel consumption.
5.4.3 Avoiding unnecessary engine maintenance
According to engine maintenance manuals, after ten over-temperature events of
unknown cause an engine must be removed and inspected. However, if data from an
FDM programme shows why an over temperature event occurred, or that it did not
actually occur, then the time until the engine has to be removed and inspected is
extended. If the cost of an engine removal and inspection is divided among the ten

Chapter 5 – Benefits
45
over-temperature events then the savings achieved from not counting one event can be
calculated.
As an example, a United States Boeing 737 operator experienced an engine over
temperature event. Data from the aircraft was sent to the engine manufacturer and the
detailed temperature profile was discussed. From this it was agreed that the engine
could be left on the wing, thus avoiding an early engine removal and overhaul.26
Another example is a British carrier which had a Boeing 747 with an intermittent
indication of very high engine vibrations in one of its engines. At first it was thought
to be an indication fault but on changing the indicator the problem persisted and an
unscheduled engine removal was planned to determine if the problem was in the
engine. However, the aircraft was due for heavy maintenance within a month and if it
could be shown that the problem was not serious, the engine could be left on the wing
until then. Data from the FDM programme was used to show that the magnitude of
the indicated engine vibrations was so large that the engine could not have physically
continued operating had the indications been correct. Thus, it was accepted that there
was no fault with the engine and an unscheduled removal was not necessary. During
the subsequent heavy maintenance work it was found that the wiring between the
engine and the vibration indicator was faulty and this was causing the erratic readings.
5.4.4 Other maintenance activity
There are many different areas where FDM programmes can be of benefit to aircraft
maintenance activities. Some examples will serve to highlight this.
In analysing the flight data from a particular Boeing 757, a British airline noticed a
rising oil quantity and dropping oil pressure in one of the engines. Line maintenance
personnel were sent to inspect the engine at the next turnaround. They noticed a smell
of fuel in the oil which led to them finding a split in the fuel-cooled oil cooler
(FCOC). Finding this split allowed it to be repaired before the engine was damaged,
which would have been a potentially expensive incident.26
If an airline monitors brake usage more closely through an FDM programme this can
lead to an increase in the number of cycles between brake removals and overhauls

Chapter 5 – Benefits
46
which results in reduced maintenance costs. An example of this was a United States
operator monitoring Boeing 737 brake wear at Charlotte Airport. Runway 31 at the
airport has a non-precision approach and it was noted that there were several aircraft
landing with high touchdown speeds, which therefore required more braking by the
pilots. In order to address this a procedure change was agreed with the air traffic
control which resulted in the pilots being able to better control their landing speed,
allowing them to land at slower speeds. As a result of this brake wear was reduced
significantly.26
In another example, a European flag carrier noticed that they were experiencing a
high number of failures of their Boeing 747-400 integrated drive generators (IDGs),
resulting in a high consumption of spares. The airline suspected a design error was
causing high oil temperatures and Boeing suspected this was due to a problem with
the cooler valves. FDM data was then used to isolate a design fault in the cooling
system which was subsequently rectified.26
Finally, it should be noted that, due to its nature, a maintenance benefit is also likely
to result in the benefit of increased aircraft availability as well as improving safety, as
shown by the following example. Data from one United States airline’s FDM
programme highlighted a slowing flap deployment time on a particular aircraft.26 Line
maintenance personnel were sent to inspect the flaps at the next turnaround and they
found early signs of a hydraulic leak which was then rectified. If the hydraulic leak
had not been fixed it is likely that the flap mechanism would not have been able to
function. Had this happened as the flaps were being set for take-off the aircraft would
not have been able to proceed and this could have led to a potentially expensive delay
or cancellation of a service. However, if the flap mechanism had malfunctioned
during a flight, when the flaps were being extended for landing, this could have
resulted in an asymmetric flap situation during flight or a landing being made at a
higher speed with the increased risk of a runway overrun. Both of these represent
significant hazards to the safe operation of the aircraft.

Chapter 5 – Benefits
47
5.4.5 Warranty and liability claims
The data from an FDM programme can be used to set a datum for measurement of
performance guarantees from equipment manufacturers. If it can be shown that the
actual performance is outside the specified levels then the airline is in a position to
claim compensation under the terms of the warranty.
Another example of how an airline can benefit from a warranty claim is given by a
European operator. They took delivery of a new Boeing 767 and it was noticed that
there was a consistent difference in the minimum manoeuvring speed indications on
the captain’s and first officer’s flight instruments. A large number of man-hours was
spent on troubleshooting this problem. FDM data pointed to something unusual with
the angle of attack (AOA) readings from the two sides of the aircraft and a physical
inspection revealed a wrongly shimmed AOA sensor. Boeing accepted a warranty
claim for the man-hours spent resolving this problem.26
It is also possible that an airline can save making payments to its customers who are
making warranty claims from the airline. For example, the cargo department of the
airline quoted in the previous paragraph receives many claims for losses of perishable
goods due to the aircraft’s hold temperature being too high or low. FDM data records
the hold temperature and has been used to show that the variations are within the
specifications, thus saving the claim pay-out.
An example where an airline can avoid a liability claim comes from an Asian
operator. They use the QAR to record whether the ‘Fasten Seat Belts’ sign is on or
off. This information can be useful if a passenger is making a claim for injuries
sustained during turbulence, because it can be proved whether the passenger should
have had his or her seat belt fastened at the time.
5.4.6 Reduced insurance premiums
Insurance companies may reduce premiums for airlines which have established FDM
programmes. This is due to the long-term benefits of having such programs, as
highlighted by British Airways who established a data analysis programme in the
1960s (see Chapter 2).

Chapter 5 – Benefits
48
Skandia Insurance has recently overlaid FAA data with that of non-US airlines. This
shows that airlines which have been using FDM programmes for seven to fourteen
years now have a lower accident rate than US airlines, the majority of which have had
no FDM programmes or else have not had a programme for more than five years.
Those airlines which have used FDM for more than 14 years have an accident rate
under half that experienced by the US carriers.25 This is shown in Figure 10 below.
Figure 10 - Comparison of hull loss rates (shown as hull losses as % of total hulls
flying) between airlines with FDM programmes
Source: Spirent Systems26
It may also be possible to prove statistically that the probability of an accident or
incident occurring has been reduced. This could be done through analysis of the
operational data for a whole fleet to show trends in the mean and standard deviation
of a particular parameter over time. The following quote shows that airline insurers
will consider the measures taken by an airline to reduce its risk:
“Underwriters are risk takers and the less risk they see, the readier they become to
accept an individual airline’s exposure at a competitive price. The more attractive the
airline’s insurance business the lower the price can be, as more and more underwriters
would like to accept this risk. By showing that the airline is proactive in safety matters
and works with the latest techniques to reduce claims on its policy, the airline will
gain in whatever market conditions that prevail during the renewal negotiations.27
0 %
0.1 %
0.2 %
0.3 %
0.4 %
1976- 1982 1983- 1989 1990- 1996
World average
First 6 FDM users
Middle 11 FDM users
Last 28 FDM users

Chapter 5 – Benefits
49
5.4.7 Reduced ACARS messages
ACARS is a very high frequency (VHF) air-to-ground data link that uses nearly 600
high frequency (HF) and VHF stations throughout the United States and overseas to
provide operational radio communications for the aircraft industry28
It was produced in the early 1980s to reduce the flight crew's work-load by using
computer technology to exchange many routine reports and messages between the
aircraft and its main base. The ground system is maintained by the company
Aeronautical Radio, Inc. (ARINC) and there is a charge for each message sent by
ACARS. Some of the information traditionally sent, such as engine exhaust gas
temperature (EGT) is recorded as part of the FDM programme so it may be possible
to access this data from the QAR instead of using ACARS. This results in a direct
reduction in the number of messages sent by ACARS and hence the cost of using
ACARS.
5.4.8 Adherence to noise-abatement procedures
Many airports have noise monitors in the areas around the airport to ensure the noise
level is within agreed limits. In order to achieve this, airlines are required to follow
certain noise-abatement procedures and fly certain tracks. If they deviate from these
procedures or tracks and generate unacceptable levels of noise they can be fined by
the airport authority. If an airport authority fines an airline for a noise infringement,
FDM data can be used to check the track of the flight in question and verify that the
airline is actually responsible for the infringement, rather than another airline.
Alternatively, procedures at a particular airport can be monitored to ensure they are
followed correctly so that there are no noise infringements and hence no fines.
5.4.9 Reduced number of FDR downloads
As mentioned in section 5.3.4 flight data can be used to support the investigation of
ASRs of a technical nature. However, if the airline does not have an FDM programme
it has to obtain this data from the FDR. There is thus an extra cost involved in terms
of the man-hours required to access the FDR and perform a download. With an FDM
programme in place, this data will automatically be downloaded and analysed and this
cost can be avoided.

Chapter 5 – Benefits
50
5.5 Further benefits
As well as the safety and cost benefits described above, there are other benefits which
can arise from an FDM programme that may be advantageous to an airline. Some of
these are discussed below.
5.5.1 Improvements to infrastructure
Some airlines use FDM data to measure the condition of a runway surface so that they
can advise the appropriate authorities when resurfacing needs to be carried out.
United Airlines, British Airways and KLM have all cited instances where they have
done this, and the following example is taken from one of them.26
Almaty (Alma-Ata) Airport in Kazakhstan was known to have a bad runway surface
and this mandated a higher frequency of landing gear inspections for aircraft
operating to this airport. The airline used their FDM data to pressure the airport
authority into resurfacing the runway. After this was done, the FDM data proved the
improvement in runway surface and with this information the gear inspection
restriction was quickly lifted. As well as improving the runway surface at the airport,
this had the additional direct benefit to the airline of reducing the number of landing
gear inspections required on the Boeing 767 fleet which were operated to the airport.
5.5.2 Monitoring of franchisees
A major airline may have several franchisees which operate under its name and brand.
As part of the franchise agreement, the franchisee will have to conduct its operations
in a safe manner and this will be monitored by the franchiser. This monitoring can be
performed more reliably if the franchisee has an FDM programme to which the
franchiser is given access.25
5.5.3 Research
Another area where benefits can arise from an FDM programme is in the area of
research projects. For example, US Airways and Alaska Airlines have been
submitting data from their FDM programmes to the FAA as part of the FAA’s
Structural Loads Program. This is part of an Aging Aircraft Airborne Data Monitoring

Chapter 5 – Benefits
51
Systems Program and it aims to collect data on the external loads experienced by the
airframe during operation. This will provide a database of information to continuously
update and validate the FAA’s certification standards regarding flight and landing
loads as well as providing information for design criteria of future aircraft.
Other examples of projects that have made use of data from FDM programmes
include the introduction of autoland capability on new aircraft types, analysis of
cosmic radiation at altitude and a study to improve runway utilisation by monitoring
the time aircraft spend on the runway under different wind conditions.
5.5.4 Consultancy
The final area where an airline can benefit from having an established FDM
programme is in consultancy work. This involves selling the expertise of the airline to
other, smaller operators who may not have the capacity to run a full FDM programme
on their own. QANTAS and Air Lib both provide FDM consultancy services to
airlines operating in their region. This is obviously a source of revenue to an airline
and it arises from the overall expertise gained in running an FDM programme, rather
than the detailed knowledge obtained from the programme.
Having described examples of how benefits can arise from FDM programmes, the
following chapter will quantify some of the savings from these benefits.

Chapter 6 – Quantifying the benefits
52
6 Quantifying the benefits
6.1 Overview
It is widely accepted that an FDM programme can provide airlines with many
benefits, as described in the previous chapter. However, benefits arising from
increased safety in flight operations, which is the primary advantage of an FDM
programme, have traditionally been difficult to quantify. This is because they rely on
proving that an event, which would have resulted in a cost to the airline, was
prevented from occurring as a direct result of information obtained from the FDM
programme.
At present, many carriers with new FDM programmes have found that tangible,
quantifiable and repeatable cost benefits due to FDM programmes are elusive. Most
of the benefits have been unforeseen, one-time benefits that are difficult to predict in
advance. However, airlines with greater experience of FDM programmes are more
sophisticated in their use of the flight data and they maintain that the initial capital
investment to set-up an FDM programme, and the ongoing running costs, are
recovered many times over. This is due to the cost benefits which were described in
the previous chapter, rather than the safety benefits.
The remainder of this chapter will attempt to quantify some of the benefits with data
obtained from several sources.
6.2 Safety benefits
Although it is difficult to prove that the absence of an accident or incident is directly
attributable to the existence of an FDM programme, it is fairly straightforward to
quantify what an accident or incident would cost.
6.2.1 Cost of an accident
Approximations of the direct cost of previous accidents can be obtained from various
sources, and some examples are listed below.

Chapter 6 – Quantifying the benefits
53
AMR, the parent company of American Airlines, set aside a USD 41 million
provision related to the December 20 1995 accident of an American Airlines Boeing
757 in Columbia. This was to cover the carrier's liability that was not covered by third
party insurers.29 In addition to that, the American Airlines Boeing 757 had been
insured for USD 34 million, according to insurance officials in London.30 So the
accident, which involved the complete loss of the aircraft and all on board during the
approach to landing, cost the airline at least USD 75 million.31
In another example, China Airlines has offered a total of more than USD 83 million in
compensation for the victims of the 25 May 2002 crash of one of their Boeing 747
aircraft. The aircraft was insured for USD 20 million.32
Aside from the direct cost of an accident, there is also the indirect cost which results
from the reduced level of bookings on the airline, as described below:
“A recent accident led to an initial drop of 40% of rider-ship, which stabilised at
around minus 19% six months after the event. On the route on which the accident
occurred, the load-factors were still down by 50% six months after event. According
to the airline’s economist, it took close to one year to get the traffic back to normal,
thereby turning the balance sheet of the airline upside down.”1
Attempting to quantify this loss is difficult. After the 12 November 2001 crash of an
American Airlines Airbus A300, some analysts estimated that the crash would cause a
revenue loss to American Airlines of USD 200 to 250 million.33
Apart from the cost of an accident, the cost of an incident can also be considered.
One example would be the cost of a tail strike, which was estimated by one study to
cost USD 500 000 in maintenance work and lost flying time.26
It is apparent from this analysis that if an FDM programme prevents a single major
accident it will have paid for itself many times over.

Chapter 6 – Quantifying the benefits
54
6.2.2 Improved pilot training programmes
The following example quantifies the benefit of the FAA accepting a proposal to
extend an airline’s SVT cycle from twelve months to thirteen months. The figures
and calculations are taken from an Alaska Airlines’ presentation.34
The total savings are quantified according to the following calculation:
[total number of pilots] ÷ 12 (months in a year) × [number of training days each pilot
receives] × [number of hours pilot is paid] × [pilot hourly wage] = total.
Add in [hours of simulator usage per crew] × [hourly simulator upkeep cost].
Example:
• 1100 total pilots.
• 1100 ÷ 12 = 90 pilots trained per month.
• Each pilot receives five days of recurrent training per month.
• 5 × 90 = 450 days of training per month.
• Each pilot receives four hours pay per day of training.
• 450 × 4 = 1 800 hours of paid training per month.
• Captain’s pay = USD 145 per hour; first officer’s pay = USD 95 per hour.
Assume an even split between captains and first officers so that of the 1 800
hours of paid training per month, 900 hours are paid at the captain’s rate and
900 hours are paid at the first officer’s rate.
• 900 × USD 145 = USD 130 500 per month for training of captains.
• 900 × USD 95 = USD 85 500 per month for training of first officers.
• USD 130 500 + USD 85 500 = USD 216 000 total training costs per month.
Add in simulator costs:
• Each crew, comprising two pilots, receives twelve hours in a simulator per
month.
• 90 ÷ 2 = 45 crews trained per month.
• Assume simulator time costs USD 160 per hour.
• 45 × 12 = 540 hours of simulator time per month.
• 540 × USD 160 = USD 86 400 total simulator training costs per month.
Grand total = USD 216 000 + USD 86 400 = USD 302 400 training costs per month.

Chapter 6 – Quantifying the benefits
55
6.3 Cost benefits
6.3.1 Increased aircraft availability
In the example described in the previous chapter, of crews accepting an aircraft with a
fuel imbalance due to FDM data showing that the imbalance was within limits, a
European airline estimated savings of USD 170 000 per year through reduced
delays.26
6.3.2 Optimum fuel consumption
Estimates of fuel savings vary widely and depend on the routes being considered and
the method used to quantify the savings. For example:
“One large carrier estimates that it saves USD 750 000 annually on one long-haul
international route, by identifying specific aircraft that have an exceptionally high
fuel-burn rate, thereby being in a position to adjust those aircraft’s airframes and/or
engines for greater efficiency.”35
In another study, it was stated that:
“A cost saving of USD13 000 for out of trim conditions was obtainable assuming one
in 100 Boeing 737 aircraft have a one degree sideslip and a utilization of 3 000 hours
per year. Fuel savings of USD 18 000 were achievable for 100 Boeing 737 aircraft
with a utilization of 3 000 hours per year.”31
The study by Alaska Airlines, quoted above, highlighted two ways to calculate the
fuel savings.
1. [Total fuel burn annually in gallons] × [price of fuel] × [expected fuel
savings] = total
2. [Total yearly hours on aircraft] × [reduction in fuel burn (documented or
assumed)] = [total fuel saved in lbs] ÷ 6.7 = [total fuel saved in gallons] ×
[fuel price] = total saved (per aircraft per year)

Chapter 6 – Quantifying the benefits
56
Example 1:
• Total fuel burn for year = 275 222 000lbs.
• 1% fuel savings expected.
• 275 222 000 ÷ 6.7 = 41 077 910 gallons.
• Price of fuel = USD 0.65 per gallon.
• 41 077 910 × USD 0.65 = USD 26 700 641 annual fuel cost.
• USD 26 700 641 × 1% = USD 267 006 fuel savings per year.
Example 2:
• Assume aircraft utilization is 3650 hours per year per aircraft.
• Assume average reduction in fuel burn of 300lbs per hour.
• 3650 × 300lbs = 1 095 000lbs fuel saved per year.
• 1 095 000 ÷ 6.7 = 163 433 gallons fuel saved per year.
• Price of fuel = USD 0.65 per gallon.
• 163 433 × USD 0.65 = USD106 231 fuel savings per aircraft per year.
6.3.3 Avoiding unnecessary engine maintenance
After the cost of the entire aircraft and systems (excluding engines), the engines are
the next most costly item of hardware on an aircraft. This in turn means the
maintenance of an engine is also costly so this is an area where FDM programmes can
have an immediate impact on reducing costs. One method of achieving this is by
increasing the amount of time the engine spends on the aircraft and reducing the
number of unscheduled removals.
One study estimates that the overall on-aircraft extension time may range from 10%
to 35% of the original time. It is also estimated that 1% savings in maintenance costs
are possible from reduced unscheduled engine removals.31 Such savings were
estimated to amount to USD 750 000 annually for a fleet of 50 aircraft. 26
The Alaska Airlines’ study34 quantified the savings as follows: [Engine removal
factor] × [average cost of engine removal] × [aircraft out of service cost] = total

Chapter 6 – Quantifying the benefits
57
Example:
• The cost of removing and inspecting an engine can run anywhere between
USD 70 000 and USD 300 000.
• The cost of not having that aircraft available for daily revenue = USD 30 000.
• From average figures, it can be assumed that, after the initial aircraft delivery,
when engine reliability is expected to be high, an airline can expect a savings
of one engine overhaul every seven years.
• 1 ÷ 7 = 0.14 engine removal factor (annual engine overhaul saving).
• Average engine overhaul cost = [USD 300 000 – USD 70 000] ÷ 2 =
USD 230 000 ÷ 2 = USD 115 000 + USD 70 000 = USD 185 000 average
engine removal cost.
• Assume two days to remove and install an engine.
• 2 days × USD 30 000 for aircraft out of revenue service = USD 60 000.
• Total cost = USD185 000 + USD 60 000 = USD 245 000
• Total savings = USD 245 000 × 0.14 = USD 34 300
Another study by The FLIGHT DATA Company (now known as Spirent Systems)
quantified savings on the UK Royal Air Force’s fleet of Lockheed Tristar aircraft or
GBP 24 per operating hour per engine.36 For a typical aircraft utilisation of 3 000 to
4 000 hours per year, this leads to a saving of around USD 300 000 annually for a
twin-jet aircraft.
6.3.4 Other maintenance activity
Two areas of savings will be considered: savings due to reduced brake wear and
savings from reduced numbers of hard landing inspections.
6.3.4.1 Savings from reduced brake wear
Various sources have estimated that brake changes can be reduced by 1% annually,
through a pilot awareness programme and monitoring brake usage.31,34 The method
used by Alaska Airlines to quantify this saving is as follows:
[Number of annual flights] ÷ [number of cycles before brake removal and overhaul] ×
[cost to overhaul brakes] × [percentage expected reduction in brake changes] = total

Chapter 6 – Quantifying the benefits
58
Example:
• Average number of flights per day = 430.
• 430 × 365 = 156 950 flights annually.
• Number of cycles (flights) between brake changes = 790.
• Cost to change and overhaul brakes = USD 5 000.
• 156 950 ÷ 790 = 198 brake changes annually.
• 198 × USD 5 000 = USD 990 000 annual cost of brake changes.
• USD 990 000 × 10% = USD 99 000 saving in brake changes.
Another study quoted the annual brake wear savings for a fleet of 50 aircraft to be
USD 180 000. 26
6.3.4.2 Savings from reduced hard landing inspections
If an aircraft experiences a touchdown where the vertical acceleration is above a
certain limit, the aircraft must have a hard landing inspection carried out on it to check
for any structural damage. By using data from the FDM programme hard-landing
inspections may be reduced by 10%.31 This has been estimated to result in savings of
USD 90 000 annually for a fleet of 50 aircraft. 26
6.3.5 Reduced insurance premiums
One study estimated that annual savings of USD 60 000 were possible for a fleet of 50
aircraft, as a result of reduced insurance premiums.26
The following figures compare the premiums and claims of two aviation
organisations, one with a high level of hull losses and one with a low level of losses.

Chapter 6 – Quantifying the benefits
59
Figure 11 - Major Aviation Organisation with High Loss Experience
0
20
40
60
80
100
USD
mill
ion
Premiums 10.4 12.6 12.6 11.6 11.5 11.03 13.7 18 32.5 84.5 80
Claims 5.4 2.11 2.11 2.54 17.8 3.01 7.8 5.77 362.35 30.67 36.07
1978 1979 1980 1981 1982 1983 1984 1985 1986 1987 1988
Figure 12 - Major Aviation Organisation with Minimal Loss Experience
0
20
40
60
80
100
USD
mill
ion
Premiums 12.02 5.75 5.75 6.05 7.05 5.37 5.84 8.25 15 23.8 18.36
Claims 0 0 0 0.8 0 0 0 0.15 0 0.24 1.5
1978 1979 1980 1981 1982 1983 1984 1985 1986 1987 1988
Source: Schmidlin1
If a carrier uses its FDM programme to reduce the number of hull losses it
experiences, and can prove this with data, it could be assumed that they will also be
able to benefit from reduced insurance premiums as illustrated by the example above.
6.3.6 Reduced ACARS messages
ACARS messages typically cost around USD 1 per message. The study quoted above
estimated that reduced ACARS traffic could lead to a saving of USD 70 000 annually
for a fleet of 50 aircraft. 26

Chapter 6 – Quantifying the benefits
60
6.3.7 Adherence to noise-abatement procedures
The British Airports Authority (BAA) charges fines of up to GBP 1 000 for each
breach of their noise regulations. From 1993 to 2000 they raised over GBP 1.25
million (approximately USD 250 000 annually) in noise fines at Heathrow airport
alone.37 These fines could be avoided if pilots followed the required departure
procedures.
6.3.8 Reduced FDR downloads
An FDR download typically costs around USD 800. One European airline receives
over 8 000 ASRs annually and if it is assumed that FDM data can be used for 10% of
these, instead of replaying the FDR, it amounts to a saving of USD 640 000 annually.
6.4 Summary of savings
As part of their FDM demonstration project DEMOPROJ the FAA estimated the
benefits to airlines in setting up an FDM programme. The estimates covered benefits
from fuel, engine maintenance and safety savings for a fleet of 15, 50 and 100
aircraft.38
Fuel and engine maintenance savings were estimated on the basis of discussions with
an airline participating in the demonstration project. Safety savings were estimated on
the basis of information from a European airline which had a long-term FDM
programme.
The estimates of the savings were based on an assumption of 3 000 flight hours per
aircraft per year. Fuel savings and engine savings figures were based on estimates of a
0.5% reduction in fuel consumption and a 1% reduction in engine maintenance costs.
The safety savings were based on a hypothetical 1% reduction in the annual costs
incurred from accidents. UTRS based the safety savings calculation on a loss rate of
two aircraft per million departures at a cost of USD 150 million for each loss. The
results are summarised in Table 9 below.

Chapter 6 – Quantifying the benefits
61
Table 9 - Estimated total annual savings by fleet size for an airline with an FDM
programme.
Fleet size (no. aircraft) 15 50 100
Fuel savings (USD) 145 800 486 000 972 000
Engine savings (USD) 300 000 1 000 000 2 000 000 Safety savings (USD) 49 500 165 000 330 000
Total annual savings (USD) 495 300 1 651 000 3 302 000
In 1999 a European airline also carried out a study into the savings it had experienced
from its FDM programme and found the results shown in Table 10.26
Table 10 – European airline’s estimate of annual savings from its FDM
programme.
Factor Approximate annual savings (USD)
Engines 4 500 000
Punctuality 1 200 000 Maintenance hours 1 700 000
Operations / fuel 100 000 Sending data by ACARS 100 000
Total savings 8 200 000
A further study by a consultancy company, in conjunction with a US carrier, looked at
the cost-benefits from an FDM programme over a five-year period. The results are
summarised in Table 11 below.

Chapter 6 – Quantifying the benefits
62
Table 11 – Estimate annual savings from an FDM programme over five years.
Item Year 1 Year 2 Year 3 Year 4 Year 5Reduced engine removals 125 000 500 000 500 000 500 000 500 000Engine on-wing extension 412 500 1 650 000 1 650 000 1 650 000 1 650 000Detection of out-of-trim conditions 3 141 12 563 12 563 12 563 12 563 Fuel savings 14 692 58 769 58 769 58 769 58 769Brake wear reduction 6 000 24 000 24 000 24 000 24 000 Insurance savings 0 0 1 250 5 000 5 000AQP SVT training savings 0 0 162 667 162 667 162 667
Total benefits 561 333 2 245 331 2 409 248 2 412 998 2 412 998Source: Cobert39

Chapter 7 – Conclusions and recommendations
63
7 Conclusions and recommendations FDM programmes are now becoming more widely used by airlines. This thesis has
explained what an FDM programme is, how it is run, what the main costs are and
where an airline can obtain benefits from such a programme. The main conclusions
and recommendations resulting from this study are detailed below.
7.1 Conclusions
These are considered in three areas: general conclusions, costs and benefits.
7.1.1 General conclusions
• FDM programmes are currently recommended practice by ICAO and they are
likely to be made mandatory in some countries over the next several years.
• The largest air transport industry, the US industry, does not intend to mandate
FDM programmes in the foreseeable future.
• The number of airlines running FDM programmes has increased dramatically
in the last five years.
• Airlines with new FDM programmes typically use them to improve the safety
of their operations but they do not exploit the full range of benefits,
particularly cost-benefits, which can arise from a well-managed FDM
programme.
7.1.2 Costs
• The initial start-up costs of an FDM programme are significant, particularly
for small regional airlines with a small fleet size.
• The annual running costs of an FDM programme are predominantly related to
manpower costs.
7.1.3 Benefits
• There are several benefits that can be obtained from running an FDM
programme. The most important benefit is the improved safety in the airline’s
operations.

Chapter 7 – Conclusions and recommendations
64
• If an FDM programme improves the airline’s operations such that a single
accident is avoided it will have paid for itself many times over.
• The cost-benefits of an FDM programme can save an airline several hundred
thousand dollars or more per year, which more than covers the annual running
costs of the programme.
• Most cost-benefits are difficult to predict in advance and are not repeatable.
However, the more experience the airline gains in identifying cost-benefits,
the greater will be its ability to realise future cost-benefits.
• Most airlines do not monitor or quantify the savings they obtain from their
FDM programmes.
7.2 Recommendations
This thesis has provided an overview of FDM programmes and examined the costs
and benefits associated with such a programme. There is scope for further study of
this topic, and the following areas are recommended for future work:
• Investigate how to make more effective use of the data currently collected.
This includes improved analysis and presentation of the data for safety
purposes.
• Study ways of reducing the costs of running an FDM programme. The use of
new technology, such as wireless data transfer, for instance, would help reduce
running costs.
• Look into altered procedures for running an FDM programme. Examples
would include optimising the number of sectors that the recording media
spend on the aircraft, in order to minimise the number of media removals
performed.
• Investigate the use of statistical sampling methods to reduce the volume of
data that must be analysed. For a large airline, it may be possible to note
trends from looking at data from forty aircraft, rather than sixty, for example.
This will have cost advantages for the airline.
• Perform a detailed study of actual cost-benefits achieved by an established
user of an FDM programme, including quantification of those benefits.

Chapter 8 – References
65
8 References 1. Schmidlin, Matthias. (2000). University of Manchester. Justifying Safety $: Some
thoughts on accident statistics and accident cost. Fourth GAIN World Conference,
Paris, France, 14-15 June 2000.
2. United States General Accounting Office. (1997). Report to Congressional
Requesters. Aviation Safety. Efforts to Implement Flight Operational Quality
Assurance Programs, p25. GAO/RCED-98-10.
3. Global Aviation Information Network. (2002). Overview of GAIN (WWW
document). http://www.gainweb.org (accessed 19 August 2002).
4. Flight Safety Foundation. (1998). Aviation safety: US efforts to implement flight
operational quality assurance programs. Flight Safety Digest, Vol. 17, No.7-9, p2.
5. Federal Aviation Administration. (2001). Flight operational quality assurance
program; final rule. 14 CFR Part 13 [Docket No. FAA-2000-7554; Amendment
No. 13-30]. Federal Register, Vol. 66, No. 211, p55042-55048.
6. Flight Safety Foundation. (1998). Aviation safety: US efforts to implement flight
operational quality assurance programs. Flight Safety Digest, Vol. 17, No.7-9,
p22.
7. Holtom, Mike. (1999). British Airways. British Airways' Flight Data Analysis
Programme, 1969-1999. International Symposium on Transportation Recorders,
Arlington, USA, 3-5 May 1999.
8. Accident Investigation Board. (2002). Accident Investigation Report, Gulf Air
Flight GF-072 (WWW document).
http://www.bahrainairport.com/GF072investigationreport.htm (accessed 7 August
2002).
9. Béland, Michel. (2001). ICAO. Proactive Uses to Enhance Flight Safety.
European Flight Data Conference, Lisbon, Portugal, 19-20 September 2001.
10. Flight Data Services Ltd. (2001). Description of OFDM (WWW document).
www.flightdataservices.com (accessed 22 January 2002).
11. Jinihen, Wang. (2002). CAAC Aviation Safety Office. Flight Quality Monitoring
of Civil Aviation of China. 1st Flight Operations Monitoring and Safety
Development Conference, Hong Kong, China, 12-13 March 2002.

Chapter 8 – References
66
12. DeHarvengt, Stéphane. (2001). DGAC. Historical review and perspectives for
French flight data monitoring. European Flight Data Conference, Lisbon,
Portugal, 19-20 September 2001.
13. Wright, David. (2001). CAA SRG. The UK regulatory approach to flight data
monitoring. European Flight Data Conference, Lisbon, Portugal, 19-20
September 2001.
14. Davis, Gary. (1999). FAA Flight Standards Service. Flight Operational Quality
Assurance. International Symposium on Transportation Recorders, Arlington,
USA, 3-5 May 1999.
15. Wright, David. (2001). CAA SRG. Overview of questions. European Flight Data
Conference, Lisbon, Portugal, 19-20 September 2001.
16. Penny and Giles. http://www.pgcontrols.com/dsp_product_info.cfm?productid=72
(accessed 22 May 2002).
17. Grossi, Dennis and Poole, Mike. (1999). NTSB and TSB Canada. Aviation
Recordings. International Symposium on Transportation Recorders, Arlington,
USA, 3-5 May 1999.
18. United States General Accounting Office. (1997). Report to Congressional
Requesters. Aviation Safety. Efforts to Implement Flight Operational Quality
Assurance Programs, p24. GAO/RCED-98-10.
19. Sagem. http://www.sfiminc.com/Products/FOGS/AGS.htm (accessed 3 September
2002).
20. Barr, Dave. (2001). Penny & Giles Aerospace. Aircraft Equipment and
Technology. European Flight Data Conference, Lisbon, Portugal, 19-20
September 2001.
21. CAA SRG. (1999). Best Practice Guide to Operational Flight Data Monitoring.
Draft Issue.
22. United States General Accounting Office. (1997). Report to Congressional
Requesters. Aviation Safety. Efforts to Implement Flight Operational Quality
Assurance Programs, p7-8. GAO/RCED-98-10.
23. Transport Canada Transportation Development Centre. Overview – Benefits
(WWW document). http://fdm.cbu.xwave.com/ov_benefits.html (accessed 22
May 2002).
24. Aeroconseil, Airbus, Air France, Cathay Pacific. (2002). Flight Operations
Monitoring Handbook, Issue 3, p40-41.

Chapter 8 – References
67
25. Holtom, Mike. (2000). Properly managed FOQA programme represents an
important safety tool for airlines. ICAO Journal, Vol. 55, No. 1, p7.
26. Clapp, Peter and Thomson, Christopher. (2000). Spirent Systems. What FOQA
can do for you. Military FOQA 2000.
27. Bannister, Jim. (Undated). Airline Insurance. An Introductory Guide (WWW
document). http://www.generali.com/library/airline/ (accessed 23 August 2002).
28. Universal Radio (2002). Introducing ACARS (WWW document). www.universal-
radio.com/catalog/decoders/acars.pdf (accessed August 21 2002).
29. Shifrin, Carole. (1996). Restructuring pummels AMR's 1995 Performance.
Aviation Week & Space Technology, Vol. 144, No. 4, p.32.
30. McKenna, James and Morrocco, John. (1996). Atlantic searched for crash clues.
Aviation Week & Space Technology, Vol. 144, No. 7, p.33.
31. Transport Canada Transportation Development Centre. Overview – Statistics
(WWW document). http://fdm.cbu.xwave.com/ov_stats.html (accessed 22 May
2002).
32. Air Transport Intelligence. 25 June 2002. CAL expected to up crash compensation
offer (WWW document) http://www.rati.com (accessed 26 June 2002).
33. Air Transport Intelligence. 20 November 2001. Tail fin led to AA587 disaster
(WWW document) http://www.rati.com (accessed 26 August 2002).
34. Clark, Terry. (1998). Alaska Airlines. Just a few anticipated cost benefits of
FOQA. Third GAIN World Conference, California, USA, 3-5 November 1998.
35. Flight Safety Foundation. (1998). Flight Safety Foundation Icarus Committee
cites advantages of FOQA for trend analysis knowledge building and decision
making. Flight Safety Digest, Vol. 17, No.7-9, p54.
36. White, Ed. (1993). The FLIGHT DATA Company. Report for the United
Kingdom Ministry of Defence. GRAF9 at RAF Brize Norton. A Summary of the
Benefits. Issue 4, p9.
37. BAA Heathrow. (2001). Noise Strategy 2000-2005, (WWW document).
http://www.baa.co.uk/pdf/lhr_noisestrategy.pdf (accessed 26 August 2002).
38. United States General Accounting Office. (1997). Report to Congressional
Requesters. Aviation Safety. Efforts to Implement Flight Operational Quality
Assurance Programs, p9. GAO/RCED-98-10.
39. Cobert, Harlan and Harris, Regina. UTRS. (2000). Justifying a FOQA Program.
FOQA 2000 Symposium, 29 March 2000.

Appendix A
A-1
Appendix A – Airlines with an FDM programme
Table A-1 – List of airlines with an FDM programme sorted by start date
Airline Start date Airline
Start date
1 British Airways 1966 41 TWA 1998 2 Air France 1974 42 Air China International 1999 3 All Nippon Airways 1974 43 Asiana Airlines 1999 4 Japan Airlines 1982 44 China Xinhua Airlines 1999 5 TAP Air Portugal 1985 45 Hainan Airlines 1999 6 Qantas 1989 46 Jet Express 1999 7 Air Canada 1990 47 Korean Air 1999 8 Adria Airways 1991 48 Thai Airways 1999 9 Air Liberte 1991 49 Virgin Atlantic 1999
10 Cathay Pacific Airways 1992 50 Air Hong Kong 2000 11 Britannia Airways 1993 51 America West Airlines 2000 12 Singapore Airlines 1993 52 Braathens ASA 2000 13 China Airlines 1994 53 KLM uk 2000 14 EVA Airways 1994 54 Maersk Air UK 2000 15 Canadian 1995 55 Mount Cook Airline 2000 16 Continental Airlines 1995 56 MyTravel Airways 2000 17 Meridian Airlines 1995 57 Northwest Airlines 2000 18 United Airlines 1995 58 Philippine Airlines 2000 19 US Airways 1995 59 TACA International Airlines 2000 20 Biman Bangladesh Airlines 1996 60 UPS Airlines 2000 21 China SouthWest Airlines 1996 61 Air 2000 2001 22 Gulf Air 1996 62 Alitalia Express 2001 23 Aero Lloyd 1997 63 British Regional Airlines 2001
24 British International Helicopters 1997 64 National Jet Italia 2001
25 Delta Air Transport 1997 65 Polar Air Cargo 2001 26 GB Airways 1997 66 Southwest airlines 2001 27 Lufthansa 1997 67 DHL 2002 28 Swissair 1997 68 European Aviation 2002 29 Turkmenistan Airlines 1997 69 Malev Hungarian Airlines 2002 30 Wideroe Flyveselskap 1997 70 Novair Nova Airlines 2002 31 Air Macau 1998 71 Silkair 2002 32 Alaska Airlines 1998 72 Aeris 33 British Midland 1998 73 Aeroflot 34 Cargolux 1998 74 Air Algerie 35 China Eastern Airlines 1998 75 Air Austral 36 Delta Air Lines 1998 76 Air Littoral 37 Dragonair 1998 77 Air Méditerranée 38 El Al Israel Airlines 1998 78 Air Tahiti 39 KLM 1998 79 Airlinair 40 Monarch Airlines 1998 80 Alitalia

Appendix A
A-2
Table A-1 – List of airlines with an FDM programme sorted by start date (continued)
Airline Start date Airline
Start date
81 Alpi Eagles 121 Thomas Cook Belgium 82 Ansett Airlines 122 Tunisair 83 Atlas Air 123 Xinjiang Airlines 84 Britair 124 Yunnan Airlines 85 CCM airlines 125 Zeijiang Airlines 86 China Northwest Airlines 87 China Southern Airlines 88 China United Airlines 89 Comair 90 Condor 91 Corsair 92 Deutsche BA 93 Egyptair 94 Emirates 95 Ethiopian Airlines 96 Euralair horizons 97 Europe airpost 98 Excel Airways 99 Futura
100 Garuda Indonesia 101 Iberia 102 Japan Air System 103 Jet Blue 104 JMC Airlines 105 Kuwait Airways 106 Maersk 107 Mandarin 108 Martinair 109 MEA 110 Regional Airlines 111 Royal Air Maroc 112 Royal Jordanian Airlines 113 SAA 114 Sabena 115 Saudia Arabian Airlines 116 Scandinavian Airlines System 117 Sichuan Airlines 118 Star Airlines 119 Sunexpress 120 TAM
Source: compiled by the author from various sources.

Appendix A
A-3
Table A-2 – Alphabetical listing of airlines with an FDM programme
Airline Start date Airline
Start date
1 British Airways 1966 41 China Northwest Airlines 2 Adria Airways 1991 42 China Southern Airlines 3 Aeris 43 China SouthWest Airlines 1996 4 Aero Lloyd 1997 44 China United Airlines 5 Aeroflot 45 China Xinhua Airlines 1999 6 Air 2000 2001 46 Comair 7 Air Algerie 47 Condor 8 Air Austral 48 Continental Airlines 1995 9 Air Canada 1990 49 Corsair
10 Air China International 1999 50 Delta Air Lines 1998 11 Air France 1974 51 Delta Air Transport 1997 12 Air Hong Kong 2000 52 Deutsche BA 13 Air Liberte 1991 53 DHL 2002 14 Air Littoral 54 Dragonair 1998 15 Air Macau 1998 55 Egyptair 16 Air Méditerranée 56 El Al Israel Airlines 1998 17 Air Tahiti 57 Emirates 18 Airlinair 58 Ethiopian Airlines 19 Alaska Airlines 1998 59 Euralair horizons 20 Alitalia 60 Europe airpost 21 Alitalia Express 2001 61 European Aviation 2002 22 All Nippon Airways 1974 62 EVA Airways 1994 23 Alpi Eagles 63 Excel Airways 24 America West Airlines 2000 64 Futura 25 Ansett Airlines 65 Garuda Indonesia 26 Asiana Airlines 1999 66 GB Airways 1997 27 Atlas Air 67 Gulf Air 1996 28 Biman Bangladesh Airlines 1996 68 Hainan Airlines 1999 29 Braathens ASA 2000 69 Iberia 30 Britair 70 Japan Air System, 31 Britannia Airways 1993 71 Japan Airlines 1982
32 British International Helicopters 1997 72 Jet Blue
33 British Midland 1998 73 Jet Express 1999 34 British Regional Airlines 2001 74 JMC Airlines 35 Canadian 1995 75 KLM 1998 36 Cargolux 1998 76 KLM uk 2000 37 Cathay Pacific Airways 1992 77 Korean Air 1999 38 CCM airlines 78 Kuwait Airways 39 China Airlines 1994 79 Lufthansa 1997 40 China Eastern Airlines 1998 80 Maersk

Appendix A
A-4
Table A-2 – Alphabetical listing of airlines with an FDM programme (continued)
Airline Start date Airline
Start date
81 Maersk Air UK 2000 121 Virgin Atlantic 1999 82 Malev Hungarian Airlines 2002 122 Wideroe Flyveselskap 1997 83 Mandarin 123 Xinjiang Airlines 84 Martinair 124 Yunnan Airlines 85 MEA 125 Zeijiang Airlines 86 Meridian Airlines 1995 87 Monarch Airlines 1998 88 Mount Cook Airline 2000 89 MyTravel Airways 2000 90 National Jet Italia 2001 91 Northwest Airlines 2000 92 Novair Nova Airlines 2002 93 Philippine Airlines 2000 94 Polar Air Cargo 2001 95 Qantas 1989 96 Regional Airlines 97 Royal Air Maroc 98 Royal Jordanian Airlines 99 SAA
100 Sabena 101 Saudia Arabian Airlines 102 Scandinavian Airlines System 103 Sichuan Airlines 104 Silkair 2002 105 Singapore Airlines 1993 106 Southwest airlines 2001 107 Star Airlines 108 Sunexpress 109 Swissair 1997 110 TACA International Airlines 2000 111 TAM 112 TAP Air Portugal 1985 113 Thai Airways 1999 114 Thomas Cook Belgium 115 Tunisair 116 Turkmenistan Airlines 1997 117 TWA 1998 118 United Airlines 1995 119 UPS Airlines 2000 120 US Airways 1995
Source: compiled by the author from various sources.