Embed Size (px)
Citation preview

“Enriching lives through effective and caring service.”
County of Los Angeles
County Progress Report2009-2010

�
Los Angeles County has the distinction of being one of the original twenty-seven California counties. It was formed in 1850,
the year California became the thirty-first state in the Union.
Originally, the County occupied a comparatively small area along the coast between Santa Barbara and San Diego, but within a year its boundaries were enlarged from 4,340 square miles to 34,520 square miles, an area sprawling east to the Colorado River.
During subsequent years, Los Angeles County slowly ebbed to its present size, the last major detachment occurring in 1889 with the creation of Orange County. In spite of the reductions in size, Los Angeles County remains one of the nation’s
largest counties with 4,084 square miles, an area some 800 square miles larger than the combined area of the states of Delaware and Rhode Island.
The jurisdiction of Los Angeles County includes the islands of San Clemente and Santa Catalina. It has a population of more than 10.4 million—more residents than any other county in the nation, exceeded by only seven states. Within its boundaries are 88 cities.
The governing body is the Board of Supervisors. The Board, created by the State Legislature in 1852, consists of five supervisors who are elected to four-year terms of office by voters within their respective districts. The Board functions as both the executive and legislative body of County government.
County of Los Angeles Government
To assist the Board of Supervisors, a chief executive officer with a staff experienced in management provides administrative supervision
to 37 departments and numerous committees, commissions and special districts of the County.
The current members of the Board of Supervisors are (left to right): Michael D. Antonovich, Fifth District; Don Knabe, Fourth District; Chair Gloria Molina, First District; Mark Ridley-Thomas, Second District; and Zev Yaroslavsky, Third District.
A Message from the Incoming Chair
As Chair of the Board of Supervisors, I would like to share with you the latest information about some of the key programs and services offered by the County of Los
Angeles and their impact on the lives of our residents. Although fiscal realities have required the County tighten its belt resulting in some service curtailments, it is important that we continue to identify intended outcomes and remain accountable to achieving the results we set forth to accomplish.
You will note throughout this publication references to the current economic climate and the necessary, inevitable changes made to our approach to programs and services. For example, with the current unemployment rate in this County exceeding 11 percent, our Child Support Services Department has begun modifying child support obligation amounts to be more in-line with a non-custodial parent’s ability to pay in this tough economy. Similarly, Consumer Affairs has responded to the foreclosure crisis by assisting with loan modifications to keep home owners in their homes. This has resulted in a 163 percent increase in homeowners keeping their home since the foreclosure crisis began, due to homeowner assistance by Consumer Affairs.
For the first time since the inception of this report, we have also included articles from each of the offices of the Board of Supervisors describing what’s happening in your community. Relevant information about expanding health clinics, opening the New MLK-Harbor Hospital, putting 10,000 people to work, changes in the foster care system, and an encouraging story about a single mother’s journey through a network of County services, collectively offer a comprehensive perspective on how County services change with the needs of our constituents.
It is with pleasure that I introduce you to the 6th Annual County Progress Report. It remains our goal to demonstrate accountability for taxpayer dollars and educate the public on the services that matter most. We hope that the information contained in this publication provides you with a greater understanding of how the County continually strives to improve services and make life better for all County residents.
Sincerely,
Gloria MolinaChair, County of Los Angeles Board of Supervisors
A Message from theIncoming Chair
A Message from theOutgoing Chair
Welcome to the 6th annual County Progress Report (CPR). Of all of the publications issued by the County, the County Progress Report is solely
focused on accountability and results. Since joining the Board of Supervisors, I have promoted efforts to develop quality data to substantiate progress made in achieving desired community results and outcomes. This was my objective in originally proposing the “County Report Card,” (as it was previously titled) in 2000. With unanimous approval by the Board, the first County Progress Report was issued in 2004. Since then, the CPR has been informing and educating constituents, clients and stakeholders about what outcomes the County is producing from key public services.
The Report reflects both the County’s achievements as well as its challenges, particularly in times of fiscal crisis. The Report notes that the County Fire Department has achieved an admirable 92 percent brush clearance compliance rate among residents; a critical factor in mitigating the severity of fires when they unavoidably occur. However, as you will see, challenges remain. Although we have made headway in developing partnerships and leveraging subsidies that have resulted in housing homeless youth with mental illness, the challenge to identify additional funding to create more stable housing units for these youth still exists.
I hope you find the County Progress Report informative and that it provides reassurance that, while challenges and opportunities for improvement always remain, the County of Los Angeles is improving the lives of its constituents in measurable and meaningful ways with the resources provided. Sincerely,
Don KnabeOutgoing Chair, County of Los Angeles Board of Supervisors
Gloria MolinaChair
First District
Don KnabeOutgoing Chairman
Fourth District
�

�
As the economy struggles to emerge from recession, people rely on the County’s health care and social services safety net more than
ever. That’s why the County’s Board of Supervisors, at the urging of Board Chair Gloria Molina, spent $44.8 million in one-time County health care funds specifically to build or expand clinics in regions that need them most.
The results for First District residents alone were striking. As a result of the Board’s action, East Los Angeles will receive $7.3 million for four new clinics and seven expanded clinics. The San Gabriel Valley will receive $12.2 million for six new clinics, one new school-based clinic, and eight expanded clinics. South Los Angeles will receive $15.4 million for four new clinics, six new school-based clinics, and 14 expanded clinics!
When Supervisor Molina first proposed spending new dollars to help County residents without health insurance, she and her staff were told this would be impossible in a time of budget crisis. But as Supervisor Molina herself said, “A budget crisis is exactly when we must take care of our most vulnerable residents — and it’s the reason why we resolved to make these health care funds a reality. California now has one of the highest unemployment rates in the nation. The health care dollars we’re allocating today will help people immediately and create a foundation for a stronger health care system in the County now and into the future.”
All affected clinics participate in the County’s public-private partnership, or “PPP” program — a critical component of the County’s public health care network. More than 130 clinics participate and, collectively, they receive $56 million annually
from the County to administer health care services. In Fiscal Year (FY) 2008-09, PPP clinics provided services to an estimated 208,225 patients during approximately 580,700 provider visits, according to the County’s Department of Health Services (DHS). As a result of the County’s most recent $44.8 million health care cash infusion, countless more patients will have been served by year’s end.
The allocation of these health care dollars actually marks the culmination of a three-year process — led by Supervisor Molina — to more effectively allocate the County’s scarce PPP health care funds to the areas of highest need. After identifying $44.8 million in extra funding back in the Fall of 2008, the Board directed the County’s Chief Executive Officer and DHS to convene a PPP Allocation Working Group specifically to study how the dollars could be spent in the most equitable fashion possible — and to make recommendations for doing so. The workgroup held four public meetings from November 19, 2008, through January 16, 2009, to obtain input from at least 18 health care stakeholders across the County. Supervisor Molina and her colleagues then used these recommendations to determine how specifically to spend the $44.8 million.
“These dollars will go a long way toward expanding services, particularly in the underfunded neighborhoods in Southeast Los Angeles, the San Gabriel Valley, and South Central Los Angeles,” Molina said. “We made every effort to outreach to new partners, and I think we should be proud of today’s outcome. We still have a long way to go to bring health care equity to the entire County — and we have an awful lot of work to do to make sure we can sustain these funds and this progress in the long term.”
$44.8 Million to Build and Expand L.A. County Health Clinics
What Is Happening In Your Community 1stDistrict

�
What Is Happening In Your Community
Martin Luther King, Jr. Harbor Hospital (MLK-Harbor Hospital) had undergone tremendous operational and management
difficulty, culminating in its closure in August 2007. Since that time, the County has been working on developing options to provide hospital services at the MLK site located in a high-need area of South Los Angeles. Upon Supervisor Mark Ridley-Thomas’ election to the Board of Supervisors in December 2008, he declared MLK Hospital to be his top priority. To this end, Supervisor Ridley-Thomas helped broker the deal to open the “New MLK Hospital” and worked to ensure approval of $322 million for new operating rooms, and to expand and modernize the emergency medical department at Harbor-UCLA Medical Center, also in the Second District
In the Spring of 2008, the County approached the University of California (UC) to assist in re-opening the once onerous facility under a common set of principles. These principles include: recognition that the new hospital will treat a high volume of Medi-Cal and uninsured patients; that it will be closely coordinated with the County’s existing network of specialty and primary care ambulatory clinics; that it will optimize public and private resources to fund care; and that it will operate independent of the County through a non-profit governing authority.
With support and involvement from Governor Arnold Schwarzenegger, the County and UC are moving forward on steps to form this new independent non-profit entity to open and operate the “New MLK Hospital” in South Los
Angeles. The new 120-bed hospital, scheduled to be completed in late 2012, will receive an estimated 30,000 annual visits and an additional 10,000 annual outpatient service visits, including follow-up care and outpatient surgeries. UC will enter into a contractual agreement with the new non-profit entity to establish quality assurance standards and training programs at the facility to ensure high-quality standards are established and maintained.
The “New MLK Hospital” services will be located in the new seismically compliant patient tower, which will include an emergency department. The County will make substantial capital investments to build out the patient tower and to construct a Multi-Service Ambulatory Care Center and ancillary services building for a laboratory, radiology, and other units. In addition, a comprehensive information technology program will be developed to manage patient care services.
The ongoing proposals and plans for “New MLK Hospital” must be reviewed and approved by the Board of Supervisors. County and UC officials will work with the Governor’s Office, California Health and Human Services Agency, and Centers for Medicare and Medicaid Services to secure the legislative, regulatory, and other programmatic support needed to execute, fund and implement this effort. County and UC officials will work to include community input in the key implementation stages of “New MLK Hospital’s” development so that vital hospital services will once again provide a Los Angeles community with limited access to large-scale medical services.
A New Hospital for a Community in Need
2ndDistrict

�
What Is Happening In Your Community
On March 15, 2006, Sandra Harvey, confused and distraught, walked into our Van Nuys District Office, clutching
her three-year old daughter Sky. A Third District constituent from Panorama City in her early twenties, Sandra desperately needed assistance.
Our staff was able to help, personally contacting or referring her to helpful and knowledgeable County agency employees to help stabilize and enable her to function effectively as a single mother.
Our staff knew they were on the right track when they offered Sky a large brown stuffed bear, left over from a holiday toy donation, while her mother talked to our staff member Benita Trujillo. Benita remembers, “It was the cutest thing to watch her struggling to carry him…she called him ‘Brownie.’”
The Department of Mental Health offered Sandra free domestic-violence counseling for alleged spousal abuse, as well as free bus tokens. Sandra filed for divorce several months later, but continues her counseling, which helped her mitigate effects of the domestic violence and overcome other emotional impediments.
The Department of Public Social Services helped enroll Sandra in the CalWORKS program, which she utilized for cash benefits, food stamps and Medi-Cal health coverage during a three-year period when she had no outside income and nowhere to live. Otherwise, she never could have escaped her abusive relationship.
Sandra’s future depended on financial independence to set her life on a different course. In 2008, her ex-spouse was finally employed, so our staff worked with the County Department of Child Support to successfully reopen her case
for monthly child support. Consequently, Sandra transitioned out of dependence on CalWORKS and began collecting the payments due her.
Through the Van Nuys Civic Child Development Center, DPSS provided low-cost babysitting for Sky for a year and half, enabling Sandra to attend Valley College full-time. Relying on public transportation, Sandra was relieved that Sky could be supervised in the County’s new day-care center, close to home and school.
Sandra left our District office in March 2006 exhausted and uneasy about her future, a sweet young mother in need of guidance. While our staff was glad to assist, they emphasized that she would be responsible for the legwork and follow-through. Initially, she balked at enrolling with CalWORKS, feeling like a “loser,” and never wanting or expecting to rely on welfare benefits. But with no alternative for financial assistance, she was happy to learn after enrolling with DPSS that she could continue at Valley College, and utilize quality child care for Sky through DPSS at the Van Nuys Civic Child Development Center.
Sandra would periodically contact our office to share news of her progress. In 2009, after attending Valley College full-time for more than three years, she earned her certificate of completion. Last January, she stopped by in person to say that she would soon be interning full time as a trainee dental hygienist, realizing a lifelong dream. Sky, now seven, was thriving. Sandra considers our staff member Benita her true friend. These are the success stories that help ensure front-line County employees remain motivated and proud of their commitment to public service.
Sandra Gets a New Start
3rdDistrict
�
What Is Happening In Your Community
It has been just over one year since the national recession began to have widespread local impacts. In that time, Los Angeles County has
focused on protecting and preserving regional jobs – including an ambitious and successful program to create thousands of temporary local jobs. In March 2009, Supervisor Don Knabe introduced a motion with the goal of capturing a portion of the federal stimulus package to create 10,000 temporary jobs across Los Angeles County. Within the stimulus package was an allocation of billions of dollars to specifically create temporary jobs for people who are currently on welfare. The thinking behind the goal was that it is better to use taxpayer money to have someone working, potentially leading to permanent full-time employment, than simply collecting a welfare check.
Supervisor Knabe and County leaders travelled to Washington, D.C. to meet with Congressional leaders, members of the Obama administration, and senior staff members at the Department of Health and Human Services. The County shared a plan with federal lawmakers to utilize hundreds of millions of dollars of unused stimulus funds to put up to 10,000 people in temporary jobs in Los Angeles County. Federal leaders offered their support for the County’s ambitious plan and the 10,000 Jobs Program officially began on July 1, 2009.
Under the new program, employers can hire temporary workers—temporary being the key word—because this funding expires in October 2010. Stimulus funds are used to pay 80 percent of the employee’s salary and workers
are officially employed with the South Bay Workforce Investment Board (WIB). Additionally, the stimulus funds pay for the payroll taxes and Social Security taxes of program participants, leaving the employer with only 20 percent of the cost of the employee. As of April 2010, over 11,900 people have been put to work which has exceeding our goal by nearly 2,000 jobs! One of the thousands of people now employed is Mr. Cyron Byrd, a father of four, who works at the Metro Wilshire Worksource Center. His supervisor, Geraldine, says he is one of the best workers there, consistently performing beyond expectations. Another example is Bruce Landacre, a single parent and Redondo Beach resident, who is now working with the maintenance department in the City of Carson. His supervisor says, “Bruce is doing an outstanding job. His attendance and attitude stands out among his colleagues!” With this program, the County is helping local employers get the temporary help they need to survive the economic recession. More importantly, the County presents hope and opportunity to the thousands of people who now have jobs because of the program, instead of thousands of people still collecting welfare. These people decided to make a better life for themselves and their families and are making use of the available jobs. More information about the 10,000 Jobs Program is available from several sources, including the County’s information hotline at 2-1-1, or through the dedicated website at http://www.employmentstimulus.org.
10,000 People Put to Work Using Stimulus Funding
4thDistrict

�
What Is Happening In Your Community
We have seen significant progress in our County’s commitment to improve the lives of foster youth in Los Angeles
County. In the last decade, the number of children in temporary foster care dropped from nearly 50,000 children to less than 16,000 children in 2009.
In the past ten years, over 22,000 foster children have been adopted into permanent homes in Los Angeles County. The Department of Children and Family Services (DCFS) finalizes more than two thousand adoptions every year through the strong public-private partnerships we have developed with community organizations and the faith-based community.
We are now in the third year of funding flexibility allowed by the Bush Administration’s Title IV-E Waiver Project. The Title VI-E Waiver has enabled Los Angeles County to build an effective infrastructure of community family service providers to keep children safe and in permanent homes, and makes available vital programs that returns children or keeps children safely to their birth families. This common sense approach, strongly supported by the Board of Supervisors, provides mental health and substance abuse services and domestic violence prevention rather
than relying on funding based on the number of children placed in foster care.
In addition to transitional housing programs and other supportive services, including education and job assistance, emancipating youth aging out of the system, need continued support and services. In spite of cuts from the State legislature in this area, the County is working to ensure this support continues.
Also, County departments have established seven medical hubs throughout the LA area that offer children under DCFS care, medical, and mental health assessments. In partnership with the Sheriff’s Department, the Multi-Agency Response Team rescues children from homes during gang and drug raids. Moreover, this year, to enhance the safety of children in the County’s care, when a referral is received on families that have past referrals, an automatic email alerts the Emergency Response staff so that the new referral receives a higher level of review.
In 2010, DCFS will continue to build on its successful efforts of making children safer in their own homes and to move children out of foster care and into permanent homes.
Progress and Hope for Our County’s Foster Children
5thDistrict
Public S
afe
ty reviews, expert witness testimony, and training and administrative responsibilities. The laboratory is used to identify body fluids including blood, semen, and saliva in order to determine possible donor(s). This is achieved by comparing the genetic types, or DNA fingerprint, from the evidence with crime suspects. Field investigators identify, document, and collect biological evidence at scenes of violent crimes and other offenses for preservation, reconstruction, analysis, and subsequent court testimony.
By its highly discriminating nature, DNA testing has contributed greatly to the apprehension of previously unknown criminals and has helped set free wrongfully incarcerated people. DNA results can be used in court to match a suspect or exonerate someone falsely accused. Nationally, 33 percent of all suspects are shown not to be related to evidence when using DNA.
Many cases involve complex evidence analysis from serial rape and homicides, and the confirmation of identity is accomplished through the Combined DNA Index System (CODIS), a database of DNA profiles from arrested and convicted felons. In 2008, approximately 192 field investigations and 677 cases were completed. Of these cases, 457 (68 percent) were analyzed for DNA, having come mostly from homicides, sexual assaults, and property crimes.
DNA Cases Measures(1) Total DNA cases (2) DNA case uploads (into CODIS database),
felon hits, case-to-case
Although circumstantial evidence and eyewitness testimony have helped to identify perpetrators of violent crime,
many cases remain unsolved. Criminals continue to present a threat to the safety of the public, and without sufficient information linking a suspect to a particular crime, prosecution is virtually impossible. As society becomes more technologically advanced, the resources used to catch such criminals must also become more sophisticated and discriminating.
The Los Angeles County Sheriff’s Department Crime Lab (“Scientific Services Bureau” or SSB) is one way these criminals are being held accountable for their crimes. SSB is one of the largest full-service laboratories in the country. It operates out of nine locations and various regional or satellite labs, and has nearly 270 dedicated staff members assigned. Due to advances in forensics, particularly biology or DNA, and the role forensics now play in today’s increasingly complex judicial system, DNA evidence has come to the forefront in crime fighting efforts. The SSB Forensic Biology Section is staffed with personnel trained in the recognition, documentation, collection, categorization, and identification of biological material (such as blood, semen, saliva, and fecal material). It also handles DNA profiling, crime scene investigation and reconstruction, and provides services to 87 of the 88 cities in the County.
DNA analysts have a multitude of duties and responsibilities, including field investigations, laboratory testing, case analysis, technical
Solving Crime One Hair at a Time
�
Sheriff’s Department

Public
Safe
ty
�
0
100
200
300
400
500
600
2000 2001 2002 2003 2004 2005
Case-to-CaseFelon HitsUploadsDNA Cases
2006 2007 2008 2009
Num
ber o
f Cas
es
DNA Cases Analyzed and CODIS Links
AnalysisWith few exceptions, there has been a marked increase in DNA cases analyzed per year for the last nine years. Increased efficiency has been realized, in large part, to being able to process several samples using robotics and other streamlining methods. Many technological advances have contributed to this increased efficiency: • New, state-of-the-art, genetic analyzers
capable of performing analysis four times faster than older models.
• Extraction robots allow procedures previously done by many individuals to be performed by a smaller team.
• Robots now reduce part of the process of DNA extraction from 3-4 hours down to 30 minutes.
DNA testing has helped solve crimes that may not have otherwise been resolved, by identifying convicted offenders and linking cases, even from different agencies. In 2009, of the 522 DNA cases uploaded into the CODIS system, 228 were “felon hits,” meaning that an unknown suspect already has a profile within the CODIS system from a previous case; thereby immediately identifying the suspect. Also, in 2009, there were 42 “case-to-case” hits, where an unknown suspect’s DNA matched the profile from another case but the suspect remains unknown. This is an exciting advancement in the world of law enforcement and science because now there is biological proof linking one suspect to two separate criminal activities. This not only narrows down the pool of suspects, but it also shortens investigation time and virtually eliminates the possibility for a suspect to be wrongly accused for a crime they did not commit. .
What Is in L.A. County’s Future?The Sheriff, with support from the Board of Supervisors, is expanding SSB with additional personnel to keep pace with the growing DNA forensic demands. The additional staffing, and use of new and more efficient technology, will allow for timelier processing of evidence, which will result in better service delivery for the communities we serve. As a result, SSB plans on eliminating the Sexual Assault Kit Backlog by June 2011.
Note: DNA Case values for years 2000 to 2004 include DNA cases done on overtime using State issued Federal grant funding. These cases have significantly exaggerated values for those years, notably in 2003. In 2007, Biology moved to a new location which required several months of downtime, resulting in a moderate case output and static felon and case-to-case hits. 2009 figures are calculated from January 1, 2009 to November 1, 2009.

Public S
afe
ty preparation. Appropriate sentences are sought in every case and when probation is granted, CLEAR prosecutors ask the court to impose gang terms and conditions precluding gang members from associating with other known gang members, frequenting known gang locations, and from possessing drugs and dangerous weapons.
CLEAR program measures(1) Number of criminal act cases filed against
gang members(2) Number of convictions for criminal acts
The creation of the Community Law Enforcement and Recovery (CLEAR) program in November 1996 was fueled
by the widely publicized murder of 3-year-old Stephanie Kuhnen by members of the Avenues Gang. The CLEAR program is a collaboration of law enforcement agencies, public officials and community residents, all working as a team to address specific community problems. The primary purpose of the CLEAR program is to recover communities plagued by gang-infestation and high rates of gang-related crime, and target the most active and notorious gang members for intense investigation and prosecution.
CLEAR operations focus on small geographical areas of no more than four to five square miles and have fixed boundaries that are congruent with the Los Angeles Police Department and Los Angeles Sheriff’s Department reporting districts. District Attorney prosecutors assigned to the CLEAR program prosecute all gang-related crimes committed in the target area. The continuity of having the same specially-trained prosecutors handle all aspects of a case from filing through trial and sentencing, dramatically increases the probability of success in the prosecution of gang-related crimes.
Prosecutors assigned to the CLEAR program have daily contact with police officers and detectives assigned to the program, and offer ongoing advice on legal issues and case
A CLEAR Way to Take Back Our Communities
�0
District Attorney
2006/2007 2007/2008 2008/2009Criminal Act Filed Filed FiledMurder 33 46 38Attempted Murder 27 19 17Robbery 18 18 38Weapon: Firearm 24 20 23Aggravated Assault 6 11 13Drug Possession for Sale 9 3 0Other 21 39 22
Sub Total 138 156 151
Summary of CLEAR Cases Filed
2006/2007 2007/2008 2008/2009Criminal Act Convictions Convictions ConvictionsMurder 13 22 24Attempted Murder 16 8 17Robbery 13 10 24Weapon: Firearm 37 20 25Aggravated Assault 10 12 12Drug Possession for Sale 11 3 2Other 22 31 29
Sub Total 122 106 133
Summary of CLEAR Convictions
Note: Convictions do not compare to the number of filings as they may not represent the same cases.
2006/2007 2007/2008 2008/2009Criminal Act Filed Filed FiledMurder 33 46 38Attempted Murder 27 19 17Robbery 18 18 38Weapon: Firearm 24 20 23Aggravated Assault 6 11 13Drug Possession for Sale 9 3 0Other 21 39 22
Sub Total 138 156 151
Summary of CLEAR Cases Filed
2006/2007 2007/2008 2008/2009Criminal Act Convictions Convictions ConvictionsMurder 13 22 24Attempted Murder 16 8 17Robbery 13 10 24Weapon: Firearm 37 20 25Aggravated Assault 10 12 12Drug Possession for Sale 11 3 2Other 22 31 29
Sub Total 122 106 133
Summary of CLEAR Convictions
Note: Convictions do not compare to the number of filings as they may not represent the same cases. Note: Convictions do not compare to the number of filings as they
may not represent the same cases.

a safety zone following an injunction. Since 1994, the District Attorney’s Office has sought and acquired 16 civil gang injunction orders, most recently against the Varrio Hawaiian Gardens and Florencia 13 gangs. Five of these gang injunction projects were completed with the Los Angeles City Attorney as co-counsel.
What Is in L.A. County’s Future?Personal and community safety is recognized as being one of our most basic needs. The District Attorney’s Office places special emphasis on strategies that focus on gang prosecution programs to suppress organized criminal gang behavior and control the impact of gangs on our community. The effectiveness of this multi-agency collaborative effort has successfully reclaimed and recovered gang-infested neighborhoods. The District Attorney’s Office will continue to be uncompromising leaders and partners in our commitment to prosecuting gang members to the fullest extent of the law and to bring justice and peace to our communities.
Public
Safe
ty
AnalysisAs a result of the initial success of the Northeast CLEAR site in 1997, this model was used for other identified gang infested neighborhoods. Two additional CLEAR sites were added in 1998 and three more in 1999. Currently there are nine CLEAR sites. Success in the Pacific and Mission CLEAR programs resulted in those targeted communities being declared “recovered,” allowing program resources to be focused on other areas of the County experiencing gang activity.
The CLEAR program has been consistently evaluated for performance outcomes. Harder+Company Community Research recently wrote the following, “For over a dozen years, independent evaluations of the CLEAR program have indicated that the program has a positive effect on levels of gang violence and quality of life in targeted communities.”
In addition to gang suppression efforts in the CLEAR areas, the County District Attorney’s Office seeks gang injunction court orders to stop gangs from acting as a group, being in the presence of alcohol, drugs or weapons, and congregating in public places after 10:00 p.m. By preventing gang members from associating with other gang members, it restricts the ability for gangs to be a public nuisance within the enforced safety zone area defined by that particular court order. Statistics prove that gang crime drops from 10 to 50 percent within
��

Public S
afe
ty Correction enforcement actions against businesses serve as an incentive to ensure scales, meters, and pricing are accurate. Enforcement also serves as a warning to other businesses about the ramifications of non-compliance. While criminal convictions rose at percentages consistent with the increase in our activity, notices of violations and civil administrative penalty actions increased at significantly lower rates, indicating that combined efforts of inspections, tests and pursuit of criminal convictions for the most egregious offenses is encouraging businesses to check their pricing and keep scales and meters in good condition.
Scales/Meters and Correction Action Measures(1) Number of inspections and tests for scales/
meters(2) Number of correction enforcement actions
Consumers often pay for goods and services based on count, weight, volume, time or some other form of
measurement. For example, consumers buy fruit by the pound and gasoline by the gallon. The County’s Weights and Measures Bureau is dedicated to ensuring consumers receive the full value for their dollar. We inspect and test meters, scales, and retail scanners for accuracy, and affix our official seal to them if they meet accuracy standards. If any of these apparatuses fail our tests in a way that deprives consumers, they are taken out of service until the problem is corrected. In addition to conducting inspections and testing, packaged goods are checked for accuracy in labeling, making sure that the package contains the number of items, volume of material, or product weight that is written on the label. These inspections protect consumers and businesses from fraudulent competition, promoting integrity and consistency in the marketplace.
The County has been increasing inspections in recent years due to State legislation, specifically Assembly Bill (AB) 889, the Ruskin Weights and Measures Act. AB 889 increased the fee businesses pay when registering their scales, meters, and scanners with a county. The boost in revenue from AB 889 has allowed for increased inspections, more aggressive recruitment and training to procure additional inspectors, and an increase in correction enforcement.
Protecting Consumers through Weights and Measures
��
Agricultural Commission/Weights and Measures
0
1,000
2,000
3,000
4,000
5,000
6,000
7,000
0
20,000
40,000
60,000
80,000
100,000
20092008
Number of Tests and Inspections
Number of Correction Enforcement Actions
Scales & Meters Stores
20092008
Notices Penalty Actions Criminal Convictions
76,484
5,884 7,677
6044538483
6,6666,564
96,687

What Is in L.A. County’s Future?Going forward, as our staff gains experience and improves their efficiency, we may see a temporary increase in violations that are documented, to be followed by a steady decline in violations as businesses seek to avoid violations. This will increase consumer protection as well as protect businesses from fraudulent competition. All of this means that consumers are more likely than before to be getting exactly the number or amount of a product or service for which they are paying, at the lowest price listed, displayed or advertised.
Public
Safe
ty
Note: Convictions do not compare to the number of filings as they may not represent the same cases.
AnalysisConsumers save money as more scanner pricing violations and scale and meter inaccuracies are caught. In 2009, more scales and meters were tested, and more stores checked for pricing accuracy than the year before. Just this past year, there were 96,687 initial inspections performed on scales and meters, up from 76,484 in 2008, which equates to a 26 percent increase. Over the past year, there has been a 30 percent increase in stores tested to compare the lowest advertised or shelf price with the price charged.
Correction enforcement this past year issued 6,666 notices of violation, up from 6,564 in 2008, which is a 1.5 percent increase. A total of 538 civil administrative penalty actions (such as fines) were levied, up from 483, and represents an 11 percent increase. And 60 criminal convictions were rendered, up from 44, resulting in a 36 percent increase.
��
0
1,000
2,000
3,000
4,000
5,000
6,000
7,000
0
20,000
40,000
60,000
80,000
100,000
20092008
Number of Tests and Inspections
Number of Correction Enforcement Actions
Scales & Meters Stores
20092008
Notices Penalty Actions Criminal Convictions
76,484
5,884 7,677
6044538483
6,6666,564
96,687
Public S
afe
ty residents specific steps needed to retrofit their homes, plant fire-resistant landscaping, and prepare themselves to safely evacuate their neighborhood, prior to the arrival of a wildfire.
Brush clearance is an important fire prevention component of the Ready! Set! Go! Program. The Forestry Division of LACoFD educates homeowners and community members living in fire prone areas in Southern California on the most effective types of brush clearance, different methods of clearing vegetation, and the types of plants and landscaping that will help keep homes and shared community spaces safe.
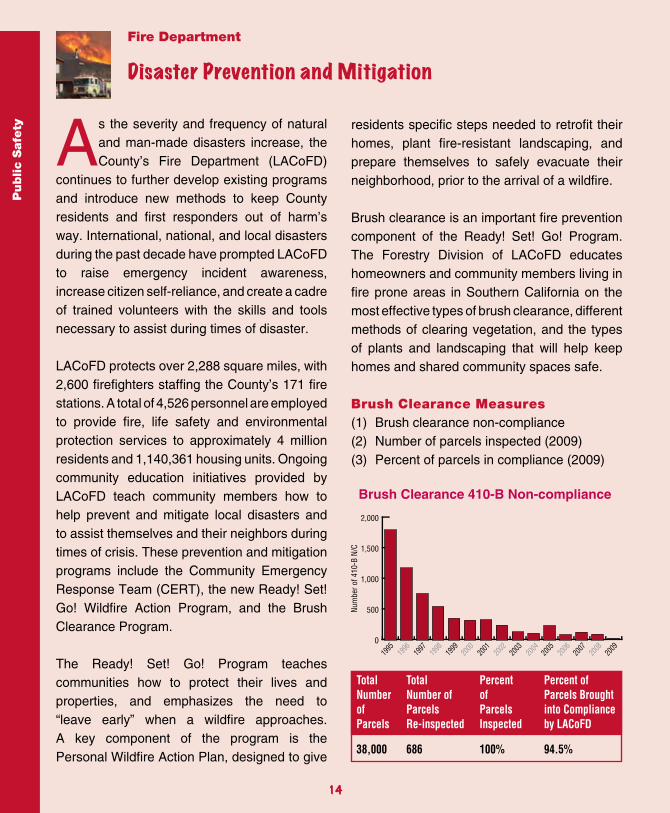
Brush Clearance Measures(1) Brush clearance non-compliance (2) Number of parcels inspected (2009)(3) Percent of parcels in compliance (2009)
As the severity and frequency of natural and man-made disasters increase, the County’s Fire Department (LACoFD)
continues to further develop existing programs and introduce new methods to keep County residents and first responders out of harm’s way. International, national, and local disasters during the past decade have prompted LACoFD to raise emergency incident awareness, increase citizen self-reliance, and create a cadre of trained volunteers with the skills and tools necessary to assist during times of disaster.
LACoFD protects over 2,288 square miles, with 2,600 firefighters staffing the County’s 171 fire stations. A total of 4,526 personnel are employed to provide fire, life safety and environmental protection services to approximately 4 million residents and 1,140,361 housing units. Ongoing community education initiatives provided by LACoFD teach community members how to help prevent and mitigate local disasters and to assist themselves and their neighbors during times of crisis. These prevention and mitigation programs include the Community Emergency Response Team (CERT), the new Ready! Set! Go! Wildfire Action Program, and the Brush Clearance Program.
The Ready! Set! Go! Program teaches communities how to protect their lives and properties, and emphasizes the need to “leave early” when a wildfire approaches. A key component of the program is the Personal Wildfire Action Plan, designed to give
Disaster Prevention and Mitigation
��
Fire Department
1995
1996
1997
1998
1999
2000
2001
2002
2003
2004
2005
2006
2007
2008
2009
Brush Clearance 410-B Non-compliance
0
500
1,000
1,500
2,000
Num
ber o
f 410
-B N
/C
Total Number ofParcels
38,000
TotalNumber of ParcelsRe-inspected
686
PercentofParcels Inspected
100%
Percent ofParcels Brought into Compliance by LACoFD
94.5%

the health of native habitat. The campaign will feature printed materials, trainings, and videos as well as material regarding pruning, produced by the UCCE Environmental Horticulture Program. These new printed materials will include more technical fact sheets and a quick reference laminated poster that will describe basics of brush clearance techniques.
Averting just one wildfire not only saves lives and protects property, it also decreases the amount of taxpayer dollars spent mitigating the crisis. Disasters in the County cost tax-payers millions, sometimes even billions, of dollars each year. Community education, combined with disaster preparedness and prevention, help ensure a safer, healthier, and more secure future for the residents of the County.
Public
Safe
ty
AnalysisFire stations with brush inspection responsibilities complete all inspections within just six weeks, once the brush inspection start date has been determined. Those parcels not in compliance are re-inspected within 30 days, and subsequently brought into compliance with the assistance of the County’s Department of Agricultural Commissioner/Weights and Measures to clear the brush as needed. Due to severe firestorms in recent years, initial brush clearance inspections in 2009 were completed nearly one month ahead of schedule. By August 3, 2009, the Brush Clearance Unit inspection statistics reflected nearly 100 percent completion of brush clearance inspections throughout the entire County.
What Is in L.A. County’s Future?Brush clearance remains a top priority for the County and as part of this vision a partnership has been developed with the University of California Cooperative Extension (UCCE) as a Charter member of the Sustainable and Fire Safe (SAFE) Landscapes Steering Committee. Past efforts have resulted in the 2008 and 2009 SAFE Landscapes Calendar and Guidebook for the County.
In partnership with UCCE, a multi-pronged educational campaign is being developed to teach homeowners, brush clearance contractors, land managers, and insurance inspectors how to conduct, manage, and maintain light-touch fuel management zones that protect property and
��
Child Welfare and Foster Care Reform
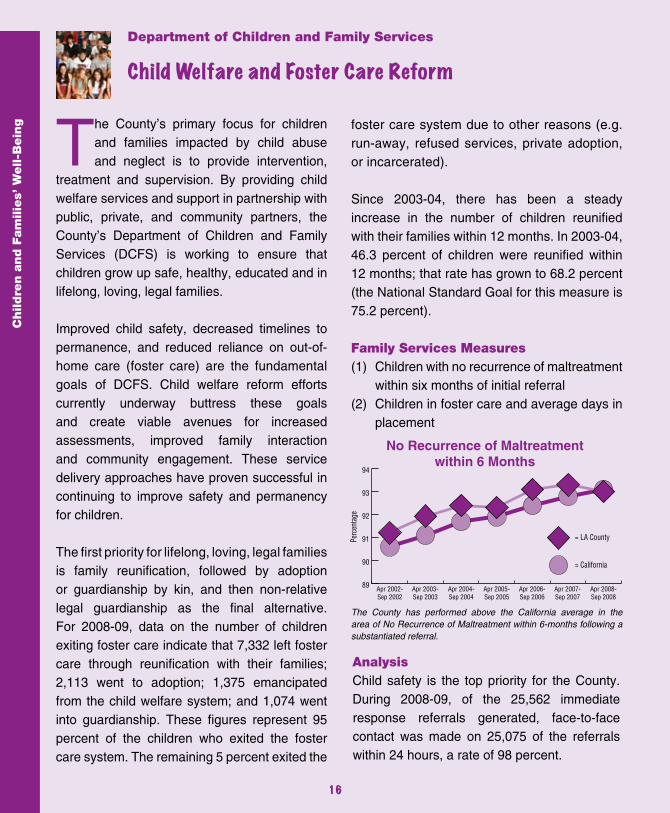
The County’s primary focus for children and families impacted by child abuse and neglect is to provide intervention,
treatment and supervision. By providing child welfare services and support in partnership with public, private, and community partners, the County’s Department of Children and Family Services (DCFS) is working to ensure that children grow up safe, healthy, educated and in lifelong, loving, legal families.
Improved child safety, decreased timelines to permanence, and reduced reliance on out-of-home care (foster care) are the fundamental goals of DCFS. Child welfare reform efforts currently underway buttress these goals and create viable avenues for increased assessments, improved family interaction and community engagement. These service delivery approaches have proven successful in continuing to improve safety and permanency for children.
The first priority for lifelong, loving, legal families is family reunification, followed by adoption or guardianship by kin, and then non-relative legal guardianship as the final alternative. For 2008-09, data on the number of children exiting foster care indicate that 7,332 left foster care through reunification with their families; 2,113 went to adoption; 1,375 emancipated from the child welfare system; and 1,074 went into guardianship. These figures represent 95 percent of the children who exited the foster care system. The remaining 5 percent exited the
foster care system due to other reasons (e.g. run-away, refused services, private adoption, or incarcerated).
Since 2003-04, there has been a steady increase in the number of children reunified with their families within 12 months. In 2003-04, 46.3 percent of children were reunified within 12 months; that rate has grown to 68.2 percent (the National Standard Goal for this measure is 75.2 percent).
Family Services Measures(1) Children with no recurrence of maltreatment
within six months of initial referral(2) Children in foster care and average days in
placement
Childre
n a
nd F
am
ilie
s’ W
ell-B
ein
g
��
Department of Children and Family Services
Average Number of Children in Foster Careand Average Days of Placement
Average Days in PlacementAverage Number of Children in Foster Care
Jan 2006-Jun 2006
Jul 2006-Dec 2006
Jan 2007-Jun 2007
Jul 2007-Dec 2007
Jan 2008-Jun 2008
Jul 2008-Dec 2008
Jan 2009-Jun 2009
No Recurrence of Maltreatmentwithin 6 Months
Perc
enta
ge
89
90
91
92
93
94
Apr 2002-Sep 2002
Apr 2003-Sep 2003
Apr 2004-Sep 2004
Apr 2005-Sep 2005
Apr 2006-Sep 2006
Apr 2007-Sep 2007
Apr 2008-Sep 2008
= LA County
= California
0
3,500
7,000
10,500
14,000
17,500
21,000
1,37
920
,802
20,6
34
20,4
33
19,7
23
18,3
93
17,1
85
15,9
88
1,29
0
1,23
3
1,18
2
1,14
6
1,09
2
1,06
6
AnalysisChild safety is the top priority for the County. During 2008-09, of the 25,562 immediate response referrals generated, face-to-face contact was made on 25,075 of the referrals within 24 hours, a rate of 98 percent.
The County has performed above the California average in the area of No Recurrence of Maltreatment within 6-months following a substantiated referral.

Child
ren a
nd F
am
ilies’ W
ell-B
ein
g
Various front end services available to families have lessened the need to remove children from their home, while maintaining a safe environment. For example, of the 3,191 children that have received Alternative Response Services due to inconclusive or low-to-moderate risk of substantiated abuse or neglect, 3,103 or 97.2 percent of these children did not have another substantiated referral during the year. Also during 2008-09, of the children who required an intervention yet remained in the home of their parent or guardian, 70 percent agreed to a voluntary family maintenance agreement, allowing the family to accept services and engage in corrective action without court involvement.
Where family reunification is not a viable permanent option, the goal is to place children in safe and permanent homes. During 2008-09, there were 2,125 children with finalized adoptions and 2,143 children placed in homes pending adoption.
For children with an initial referral that had been substantiated, 93 percent of these children
��
Average Number of Children in Foster Careand Average Days of Placement
Average Days in PlacementAverage Number of Children in Foster Care
Jan 2006-Jun 2006
Jul 2006-Dec 2006
Jan 2007-Jun 2007
Jul 2007-Dec 2007
Jan 2008-Jun 2008
Jul 2008-Dec 2008
Jan 2009-Jun 2009
No Recurrence of Maltreatmentwithin 6 Months
Perc
enta
ge
89
90
91
92
93
94
Apr 2002-Sep 2002
Apr 2003-Sep 2003
Apr 2004-Sep 2004
Apr 2005-Sep 2005
Apr 2006-Sep 2006
Apr 2007-Sep 2007
Apr 2008-Sep 2008
= LA County
= California
0
3,500
7,000
10,500
14,000
17,500
21,000
1,37
920
,802
20,6
34
20,4
33
19,7
23
18,3
93
17,1
85
15,9
88
1,29
0
1,23
3
1,18
2
1,14
6
1,09
2
1,06
6
The County has managed to decrease both the average days of children in an out-of-home placement and the number of children placed out of home.
did not experience maltreatment within the subsequent six months of the initial referral. The latest available data (April-September 2008) indicate that the County’s performance on this measure is just below the California average of 93.1 percent. The National Standard Goal for this measure is 94.6 percent.
During 2008-09, the foster care population declined by 12 percent. When children enter foster care, they are spending less time in care due to service improvement efforts and programs aimed at reducing the length of stay. Promising statistics reveal that the average number of days children spend in foster care has continued to decline since January 2006.
What Is in L.A. County’s Future?DCFS is working to fully utilize a team approach to engage families, community, and staff in case planning and decision-making. Using a child-focused, family strength-based approach, individualized plans are created to strengthen family capacity, to assure safety, stability, and permanency, as well as build natural supports that will sustain the family over time.
The County continues to implement innovative programs to reduce the likelihood of families entering the system and to reduce the timelines permanency. One such program is the Prevention Initiative Demonstration Project, designed to incorporate community agency involvement and to work together to isolate and prevent the root causes of child abuse. Families are able to receive needed services before they come into the system, preventing small family problems from growing to major crises.

Child Support Modifications — Meeting New Demands in this Tough Economy
The County’s Child Support Services Department (CSSD) is the largest locally-operated child support agency in the
nation and manages approximately 416,000 cases per year, comprising more than 25 percent of the total child support caseload in the State of California. CSSD is responsible for determining paternity, establishing and enforcing orders for child support (including orders for medical support), and in certain cases enforcing orders for spousal support. The very core of what CSSD does is predicated on the belief that both parents, based upon their current financial circumstances, are responsible for the economic support and well-being of their children.
The current economic climate has created challenges to establishing child support orders and collecting support owed to children and families. As the unemployment rate increased, the total amount of support collected has decreased. Close to 70 percent of child support is collected by wage withholding, and a growing number of non-custodial parents are finding it difficult to meet their child support obligations as employers are forced to decrease work hours, reduce the number of employees, and in some cases go out of business.
Child support obligations are based on the financial ability of both parents to support their children. In instances where either parent’s financial circumstances have changed, the court-ordered support obligation may be eligible for a modification (decrease or increase in the
support amount). The impact of the current economic climate on family incomes has caused CSSD to redirect resources to focus more heavily on modifications of support orders.
Currently, a large number of modifications have resulted in a decrease in the amount of support owed, which increases the chance that support will be collected. As a result, a positive trend has begun to occur; as the number of modified support orders increase, so does the percentage of paying cases. When the support order is more in line with the income of the non-custodial parent, the obligated parent is better able to comply with the court-ordered support amount. This overall increase in the collection rate helps to lessen a single parent’s dependency on other types of government assistance such as Welfare, Medi-Cal and General Relief.
Child Support Measures(1) Amount collected by wage garnishment (2) Number of collection modifications filed(3) Percent of current support collected
Childre
n a
nd F
am
ilie
s’ W
ell-B
ein
g
��
Child Support Services Department
Collections by Wage Assignment
Jan Feb Mar Apr May Jun Jul Aug SepOct Nov Dec$20
$22
$24
$26
$28
$30
(In M
illio
ns)
Oct 08 - Sep 09Oct 07 - Sep 08
Oct 08 - Sep 09Oct 07 - Sep 08
Number of Modifications Filed
Jan Feb Mar Apr May Jun Jul Aug SepOct Nov Dec0
5,00
1,000
1,500
2,000
Oct 08 - Sep 09
Percent of Current Support Collected
Jan Feb Mar Apr May Jun Jul Aug SepOct Nov Dec40
43
46
49
52
55
Perc
enta
ge
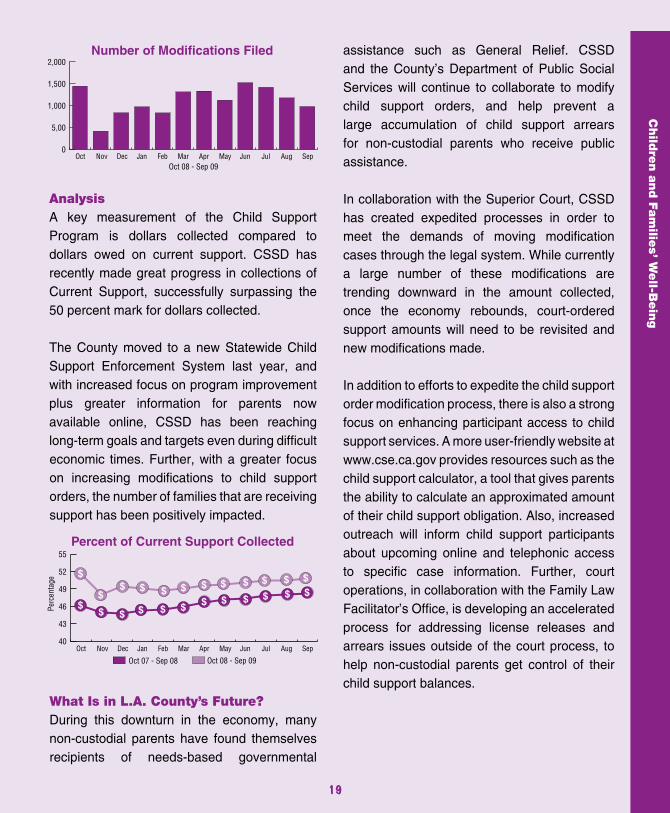
AnalysisA key measurement of the Child Support Program is dollars collected compared to dollars owed on current support. CSSD has recently made great progress in collections of Current Support, successfully surpassing the 50 percent mark for dollars collected.
The County moved to a new Statewide Child Support Enforcement System last year, and with increased focus on program improvement plus greater information for parents now available online, CSSD has been reaching long-term goals and targets even during difficult economic times. Further, with a greater focus on increasing modifications to child support orders, the number of families that are receiving support has been positively impacted.
What Is in L.A. County’s Future?During this downturn in the economy, many non-custodial parents have found themselves recipients of needs-based governmental
Child
ren a
nd F
am
ilies’ W
ell-B
ein
g
assistance such as General Relief. CSSD and the County’s Department of Public Social Services will continue to collaborate to modify child support orders, and help prevent a large accumulation of child support arrears for non-custodial parents who receive public assistance.
In collaboration with the Superior Court, CSSD has created expedited processes in order to meet the demands of moving modification cases through the legal system. While currently a large number of these modifications are trending downward in the amount collected, once the economy rebounds, court-ordered support amounts will need to be revisited and new modifications made.
In addition to efforts to expedite the child support order modification process, there is also a strong focus on enhancing participant access to child support services. A more user-friendly website at www.cse.ca.gov provides resources such as the child support calculator, a tool that gives parents the ability to calculate an approximated amount of their child support obligation. Also, increased outreach will inform child support participants about upcoming online and telephonic access to specific case information. Further, court operations, in collaboration with the Family Law Facilitator’s Office, is developing an accelerated process for addressing license releases and arrears issues outside of the court process, to help non-custodial parents get control of their child support balances.
��
Collections by Wage Assignment
Jan Feb Mar Apr May Jun Jul Aug SepOct Nov Dec$20
$22
$24
$26
$28
$30
(In M
illio
ns)
Oct 08 - Sep 09Oct 07 - Sep 08
Oct 08 - Sep 09Oct 07 - Sep 08
Number of Modifications Filed
Jan Feb Mar Apr May Jun Jul Aug SepOct Nov Dec0
5,00
1,000
1,500
2,000
Oct 08 - Sep 09
Percent of Current Support Collected
Jan Feb Mar Apr May Jun Jul Aug SepOct Nov Dec40
43
46
49
52
55
Perc
enta
ge

Demand for Public Assistance Climbed in Response to Economic Downturn
The financial meltdown that emerged in 2008 reached far and wide across our local economy. The County’s unemployment
rate increased by nearly 50 percent from July 2008 (8.3 percent) to June 2009 (11.3 percent), and caseloads jumped for almost all public assistance programs administered by the County, reversing the recent year’s trend of declining caseloads. New increases in caseloads were seen in the California Work Opportunities and Responsibility to Kids (CalWORKs) Program, Medi-Cal (California’s version of Medicaid), General Relief (the County’s cash assistance program for indigent adults), the County’s Refugee Employment Program, and the Food Stamp Program.
There is a growing body of research that shows the expenditures made by social service programs, tax rebates, tax incentives for businesses, and expanding unemployment benefits have a significant stimulative effect on local economies. For example, United States Department of Agriculture data confirmed that every $1 spent on food by Food Stamp beneficiaries generates $1.84 in local economic activity. Effective April 1, 2009, the American Recovery and Reinvestment Act (ARRA) increased food stamp benefits for each beneficiary by 13.6 percent for an increase of $15 million in benefits per month in LA County.
The main purpose of food stamps is to prevent “food insecurity.” Food insecurity exists when people lack access to enough safe, nutritious, and socially acceptable food for a healthy
and productive life. Persistent food insecurity leaves children weak, vulnerable, less able to fight common childhood illnesses, and with diminished capacity to concentrate in school. Roughly 49 percent of all American children between the ages of 1 and 20 will live in a household that, at some point, will receive food stamps to combat food insecurity.
In direct response to rising unemployment, the County utilized a significant portion of the ARRA stimulus funding received through the State to dramatically expand the existing CalWORKs Transitional Subsidized Employment (TSE) program. The ARRA stimulus funding for this program, due to expire at the end of September 2010, will be used to hire 10,000 people by mid-2010, and will provide participants with paid private and/or public-sector work experience and training to better prepare them to compete in the labor market for permanent jobs after the program’s termination. This is the largest subsidized work program in the nation, and is a “win-win” for employees and employers; employees are able to obtain a new job or to keep a good job, and employers get workers they need to keep their operation running. The TSE program offers fully supervised paid work experiences to unemployed Californians participating in CalWORKs and other government programs. The County is working with the South Bay Workforce Investment Board (SBWIB) to match employees with employers, while SBWIB serves as the employer of record, much like a
Childre
n a
nd F
am
ilie
s’ W
ell-B
ein
g
�0
Department of Public Social Services

temporary employment agency. One Stop/WorkSource Centers throughout the County provide employment services for the TSE program (go to www.worksourcecalifornia.com to find the WorkSource Center near you or call 888.226.6300).
Social Services Measures(1) Number of persons receiving food stamp
assistance(2) Number of CalWORKs cases
Child
ren a
nd F
am
ilies’ W
ell-B
ein
g
��
6%
7%
8%
9%
10%
11%
12%
Jul08
Aug08
Sep08
Oct08
Nov08
Dec08
Jan09
Feb09
Mar09
Apr09
May09
Jun09
Jul08
Aug08
Sep08
Oct08
Nov08
Dec08
Jan09
Feb09
Mar09
Apr09
May09
Jun09
600
650
700
750
800
Thou
sand
s
Unemployment Rate - Los Angeles CountyFiscal Year 2008 - 2009
Persons Aided - Food StampsFiscal Year 2008 - 2009
Jul08
Aug08
Sep08
Oct08
Nov08
Dec08
Jan09
Feb09
Mar09
Apr09
May09
Jun09
135
140
145
150
155
160
Thou
sand
s
CalWORKS Cases (July 2008 - July 2009)
AnalysisAs seen in Figure 1, the number of persons aided by the County’s Food Stamp Program increased by over 100,000 from July 2008 to June 2009. This was due to expanded DPSS outreach in low-income communities, promotion of its Restaurant Meals Program, and increased demand for basic food as a result of the recession.
Over the same time period, Los Angeles County served a steadily increasing number of families who received cash assistance through CalWORKs. As shown in Figure 2, by June 2009 there were 14,739 more families receiving CalWORKs services than in July 2008, an increase of about 10 percent. This increase in welfare services reversed the three year trend of a shrinking welfare caseload. What Is in Los Angeles County’s Future? To keep up with growing community demand for food assistance, on August 4, 2009, the Board of Supervisors authorized the acquisition of one Food Stamp/Medi-Cal Mobile Outreach Vehicle to enhance outreach and take applications at targeted non-traditional locations such as health clinics, churches, schools, and local farmers’ markets. Additionally, the Southern California Gas Company, the Department of Water and Power, and Southern California Edison have entered into an agreement with the County to distribute Food Stamp outreach materials at their customer service centers to boost the County’s outreach effort.
The unemployment rate is expected to remain very high through 2010. In September 2010, Federal stimulus funding, being used to expand the number of subsidized employment opportunities and enable the State to maintain temporary cash grants for increasing numbers of CalWORKs families, is set to expire. In the current year, funding statewide for CalWORKs was reduced by $375 million. As State and Federal revenues are estimated to continue falling, the future of CalWORKs and the social services safety net are precarious, at the time children and families need them most.

Charting a Course to Improved Health for Low-Income Adults
or below the Federal poverty threshold. HWLA targets patients who have been diagnosed with a chronic condition such as diabetes, hypertension (high blood pressure), asthma or chronic obstructive pulmonary disorder, dyslipidemia, or congestive heart failure.
In addition to a full array of primary and specialty care services delivered in both the DHS-run and privately-run clinics, enrollees have access to a member-services hotline which receives more than 1,000 calls per month. There is also a 24/7 multi-lingual nurse advice line available, staffed by registered nurses offering next day appointments and resources such as disease management programs and health education seminars. Preventive services, including flu vaccinations, smoking cessation referrals, and nutrition and exercise presentations, are also included as “add on” services.
HWLA is funded through a $54 million share of $180 million in Federal funding annually allocated to 10 California counties as part of the 2005 California Medicaid Waiver. The funds are to enable counties to implement Health Care Coverage Initiative (HCCI) programs. The goals are to expand health care coverage; strengthen the local safety net system-which includes hospitals, County clinics, and community clinics; create savings in health care costs; and provide grounds for long-term sustainability.
Healthy Way L.A. (HWLA) is a program conceived and run by the County’s Department of Health Services (DHS)
that expands health care coverage to low-income, uninsured adults through a coordinated system of medical care. Approximately 42,000 adult patients are currently enrolled in the no-cost program.
Now in its third year, the centerpiece of the HWLA initiative has been the creation of primary care “medical homes” that provide enrollees with primary, preventive and specialty medical care services. This program emphasizes a coordinated care system that shifts patients from high-cost, episodic treatment to cost-efficient, clinic-based care focusing on prevention, education, and active disease management.
The patients targeted for enrollment are historically among the most difficult to treat in the County’s patient population because they battle one or more chronic conditions, typically rely on the emergency room for medical care, and often resist regular doctor visits because of financial, geographic, language, or other barriers.
To qualify for HWLA, Federal eligibility mandates require that enrollees must be between the ages of 19 and 64 and be residents of the County. Enrollees must also be uninsured and unqualified for other health care coverage programs, and be considered at
Healt
h a
nd M
enta
l H
ealt
h
��
Department of Health Services

Health
and M
enta
l Health
Health Way LA Measures:(1) Number of patients enrolled by Medical
Homes
AnalysisWith an approximate 42,000 HWLA members currently enrolled with assigned medical homes, 97 percent of members visited their medical home at least once during the year, and these patients average five outpatient visits per year (for both primary and specialty care). Recent data illustrate that enrollees have a significantly lower rate of emergency room visits per year (199 per 1,000 HWLA patients, compared to 387 per 1,000 among adult Medi-Cal patients).
Overall, 72 percent of members have reported complying with nurse recommendations on the advice line, which receives on average 120 calls per month, reducing unnecessary emergency room visits and encouraging appropriate use of medical resources.
An Electronic Summary Sheet provides a critical information technology component to the program by providing health care providers across more than 100 clinic sites with secure web-based access to key clinical information on enrollees such as diagnoses, dispensed medications, and scheduled visits. The Electronic Summary Sheet has greatly improved the coordination and efficiency of care among multiple providers.
What Is in L.A. County’s Future?HWLA, as a demonstration project, has shown that health outcomes among a vulnerable patient population can be improved through a patient-centered care system that reduces costs, focuses on preventive medicine, and utilizes information technology to improve the efficiency of care delivery. HWLA administrators are hopeful that additional Federal funding will be made available in the next California Waiver starting in 2010 to continue enrollment momentum, improve the health of County residents, and further build upon the County’s efforts to contain costs while maintaining the highest standard of quality care.
��
0
10,000
20,000
30,000
40,000
50,000
Jun 2008 - Aug 2008
Mar 2008 - May 2008
Sep 2008 - Nov 2008
Dec 2008 - Feb 2009
Mar 2009 - May 2009
Jun 2009 - Aug. 2009
Sep 2009 - Oct 2009
Patie
nts
Enro
lled
Healthy Way LA Total Enrollment(September 2007 to August 2009)
PPP (Public-Private Partnership)DHS (Department of Health Services)

Creating Stable Housing for Youth with Mental Illness
Village, a 7-Unit Permanent Supportive Housing development for youth ages 18 and up in the City of Santa Monica. This is the first of several similar types of projects that will collectively contain over 800-units. These projects are all seeded with MHSA funding for a portion of the development and operating costs, while private-sector partners provide funding for property management and resources for supportive services.
In the absence of this type of funding, units of this type would not exist because rental rates would be at the open competitive “market-rate” and thus not affordable for the special needs populations. These operating subsidies will remain with the housing unit for at least 15 years and in some instances, for up to 50 years offering these young people stable living while they receive services and supports focused on recovery and self-sufficiency.
Mental Health Measures for Youth(1) Prevalence rate of serious mental illness
by age-group(2) Enrollment of youth in Full-Service
Partnership Program
Stable housing is a critical element for the overall health, safety, and well-being of youth ages 16-25 (Transitioned Aged
Youth, or TAY) who are suffering from mental illness including Serious Emotional Disturbance (SED), Severe and Persistently Mentally III (SPMI) and/or Co-Occurring Disorders. Stable housing provides the consistency that these youth require, helping them achieve goals of wellness, recovery, and eventual self-sufficiency.
Various State-approved Mental Health Services Act (MHSA)-funded programs specifically target TAY with SED/SPMI who fall into specific focal populations: 1) homeless or at risk of homelessness; 2) youth aging out of the child mental health, juvenile justice, or child welfare systems; 3) youth leaving long-term institutional care; 4) youth who have experienced a first-onset of major mental illness; and 5) youth diagnosed with co-occurring substance abuse disorders.
As the County began to promote new youth-focused programming through outreach and engagement activities to un-served and underserved populations and ethnic communities, it became clear that in every area of the County, youth are in need of these services. However, it has been difficult to engage this population because of housing instability and the absence of consistent point of contact.
In August 2009, the Department of Mental Health (DMH) celebrated the grand opening of Daniel’s
Healt
h a
nd M
enta
l H
ealt
h
��
Department of Mental Health
Enrollment of Youth in Full-ServicePartnership Program
0
2
4
6
8
10
Children (0-15) TAY (16-25) Adult (25-59) Older Adult (60+)
Perc
enta
ge
Estimated Prevalence Rate of Serious MentalIllness by Age-Group in Los Angeles County
7.8% 8.4%
Enrollment Target Actual Enrollment
6.0% 5.8%
7.88.46.05.8
20%First Psychotic
Break
20%First Psychotic
Break 40%Homeless
20%Homeless
30%Aging Out
30%Long-Term
Care 28%Aging Out
12%Long-Term
Care

Health
and M
enta
l Health
AnalysisThe estimated prevalence rate of serious mental illness is the highest among TAY at 8.4 percent, compared with adults (26 years and older) at 6.0 percent and children (age 0 to 15 years) at 7.8 percent. Out of 1.5 million TAY in the County (15 percent of County’s population), 680,360 are living below the 200 percent poverty line.
Nearly 41 percent of TAY receiving services from the County-funded mental health facilities are diagnosed with a substance related co-occurring disorder, and more than 50 percent of the youth referred to the DMH were homeless at the time of referral. These youth are often undercounted in official homeless counts conducted by various housing agencies, but the Full-Service Partnership programs have been successful in helping these youth with housing supports and benefits establishment.
While more than 50 percent of the allocated focal population group slots are for youth at high-risk of being homeless or in need long-term care, 8,973 youth had been served under
the MHSA plan as of October 2009. Enrollment in the MHSA Homeless Focal Population Group has exceeded its target, clearly underscoring the need for these services especially within the homeless population.
What Is in L.A. County’s Future?Creating permanent supportive housing resources for special needs populations, specifically TAY who meet the MHSA target population, presents a unique opportunity and a need to shift toward creating a system that can effectively leverage public-private partnerships to create more special needs housing. The partners include the Board offices, DMH, Community Development Commission, California Housing Finance Authority, non-profit community-based organizations, local jurisdictions, law enforcement, and community groups. Each partner brings unique resources, authority, and the expertise to leverage these resources in successfully addressing the various barriers faced when attempting to invest in housing for special needs populations.
Currently there are approximately 80 permanent supportive housing units in various stages of approval and development dispersed throughout the County. It is anticipated that most of these units will be completed and approved for occupancy, making the path to self-sufficiency a little less difficult for these youths.
��
Enrollment of Youth in Full-ServicePartnership Program
0
2
4
6
8
10
Children (0-15) TAY (16-25) Adult (25-59) Older Adult (60+)
Perc
enta
ge
Estimated Prevalence Rate of Serious MentalIllness by Age-Group in Los Angeles County
7.8% 8.4%
Enrollment Target Actual Enrollment
6.0% 5.8%
7.88.46.05.8
20%First Psychotic
Break
20%First Psychotic
Break 40%Homeless
20%Homeless
30%Aging Out
30%Long-Term
Care 28%Aging Out
12%Long-Term
Care

AnalysisThe passage of the California Smoke-Free Workplace Law in 1989 requires all businesses, with few exceptions, to provide a smoke-free indoor environment. In 2009, compliance with this policy was approximately 95 percent, and
Tobacco Control & Prevention
This year marks the 20th anniversary of the Los Angeles County Tobacco Control & Prevention Program (TCPP).
With the support of State and local partners, TCPP aims to decrease overall tobacco use by adults and youth and ultimately, reduce tobacco-related diseases and deaths.
Successful efforts over the past two decades have contributed to a significant decrease in smoking among adults and youth in LA County. In 1989, one out of every five adults smoked. Los Angeles County now has one of the lowest levels of smoking in California as well as the entire United States (adults 14.3 percent, youth 12 percent). The goal is to decrease the percent of adults who smoke to 12 percent by 20101 and the percent of youth who smoke to 8 percent by 2011.2
Tobacco Control & Prevention uses a comprehensive strategy to change social norms regarding tobacco use and to make tobacco products and their use less desirable, less acceptable, and less accessible. One of the most effective approaches for changing social norms is enacting tobacco control policies at the City and County level. Priority TCPP policy strategies include creating smoke-free environments where people work and play and reducing youth access to tobacco through the local retail licensure requirements.
Healt
h a
nd M
enta
l H
ealt
h Tobacco Measures:1) Percent of Adults and Youth Who Smoke2) Smoke-free Environment Control Policies
Source: For adult smoking, data are obtained from (a) California Tobacco Survey for 1990 and 1996, and (b) Los Angeles County Health Survey for 1999, 2002, and 2005; for youth smoking, data are obtained from Youth Risk Behavior Surveillance System for 2002, 2004, 2006, and 2008.
��
Department of Public Health
0
5
10
15
20
25
1990 1996 2002 2005 2009 2002
LA CountyCalifornia
Adult Smoking Youth Smoking
2004 2006 2008 2009
0%
20%
40%
60%
80%
100%
Type of Tobacco Control Policy
Smoke-freeWorkplace
Smoke-freeBeaches
Smoke-freeParks
Smoke-freeOutdoor Areas
Smoke-freeHousing
TobaccoRetail
License
Perc
ent o
f LA
Coun
ty C
ities
Smoke-free Environment Control Policies
Percent of Adults and Youth Who Smoke
Goal: 12% Goal: 8%

Health
and M
enta
l Health
��
nearly every California worker enjoys a smoke-free workplace.
Smoke-free environment policies in LA County were not established until 1998. However, over the last 10 years, an increasing number of policies have been passed by cities and the County of LA to protect the public from exposure to secondhand smoke. For example: • 100 percent of the LA County coastline is
smoke-free• At least 27 cities or 31 percent have a
smoke-free parks policy• Seven cities or 8 percent prohibit smoking
in outdoor public spaces• All parks and golf courses in the
unincorporated areas of Los Angeles County are smoke-free
• Three cities or 3 percent have adopted ordinances that restrict smoking in apartments
Regulating access to cigarettes can postpone or prevent smoking initiation among youth. Currently, 24 jurisdictions (27 percent) have adopted policies allowing cities to monitor tobacco retailers and enforce laws that prohibit illegal sales of tobacco products to minors.
What Is in L.A. County’s Future? Despite tremendous progress, there is still more work to be done. Approximately 1.1 million adults in LA County still smoke. Tobacco use
in LA County remains the most common risk factor for preventable death and is associated with the top five leading causes of death (heart disease, stroke, lung cancer, emphysema/COPD, pneumonia/influenza.)3 It is estimated that tobacco-related illnesses cost the County $4.3 billion dollars per (1999 dollars).4
Tobacco Control & Prevention will continue to focus on its priority strategies and will work closely with community-based organizations, advocates, and healthcare providers to enact effective tobacco control policies throughout LA County. For current information on smoke-free policies and other tobacco control polices in your city, go to http://publichealth.lacounty.gov/tob/.
1 U.S. Department of Health and Human Services Office of Disease Prevention and Health Promotion. (2000). Healthy People 2010, Volume 2, Chapter 27-Tobacco Use.
2 Tobacco Education and Research Oversight Committee. Endangered Investment: Toward a Tobacco-Free California 2009-2011 - Master Plan.
3 Los Angeles County Department of Public Health. Office of Health Assessment and Epidemiology. Mortality in Los Angeles County 2005.
4 Los Angeles County Tobacco Control and Prevention Program. (May 25, 2006). A Report for the County of Los Angeles Public Health Commission.

Recharging Our Water Supply
Com
munit
y and M
unic
ipal Serv
ices
California is currently facing a serious water shortage caused by several factors, including three years of
record-breaking low rainfall, environmental restrictions on pumping water from the Sacramento Delta, and low levels of water storage throughout the State. In February 2009, the Governor declared a state of emergency due to the drought, and many communities in Southern California have implemented water restrictions including limited outdoor watering.
But overall, demand for water has increased and in June 2009, the Board of Supervisors implemented Phased Water Conservation in the County’s Waterworks District No. 29 serving Malibu, Topanga Canyon, and Marina del Rey. The Phase II shortage requires a reduction of 15 percent, or customers face substantial surcharges. Moreover, to address the on-going need for an increased water supply, the County conserves storm, recycled, and imported water through groundwater recharge facilities.
The County operates 26 groundwater recharge facilities within the boundaries of the Flood Control District. These facilities direct surface water into the ground to replenish the groundwater basins used to supply water to the residents of the County. Groundwater recharge ensures that larger amounts of groundwater are available to the public both now and in the future. It also reduces reliance
on expensive and diminishing supplies of imported water. Approximately 40 percent of water used in the County is obtained from groundwater supplies. The County recharges on average 250,000 acre-feet (81.5 billion gallons) of storm, recycled and imported water every year.
Groundwater Recharge Measures(1) Acre-feet of groundwater recharge
AnalysisWater conservation efforts in the five Waterworks Districts serving almost 200,000 people in communities throughout the County, have resulted in a reduction of 5,400 acre-feet, or 1.7 billion gallons of potable water, since the summer of 2008.
In addition, through groundwater recharge, the County conserved 107,000 acre-feet (34.8 billion gallons) of storm water; 35,500 acre-feet (11.5 billion gallons) of recycled water; and 7,600 acre-feet (2.4 billion gallons) of imported
��
Department of Public Works
0
100,000
200,000
300,000
400,000
500,000
600,000
700,000
96-97 97-98 98-99 99-00 00-01 01-02 02-03 03-04 04-05 05-06 06-07 07-08 08-09
Gallo
ns
Storm Imported Recycled
Groundwater Recharge in Acre-Feet/Year

Com
munity a
nd M
unic
ipal S
ervic
es
water in the 2008-09 storm season. All these waters were used to replenish the groundwater aquifers, to be pumped out at a later time for potable use. The equivalent amount of water would cost over $58 million to import.
What Is in L.A. County’s Future? In 2006, the County began an aggressive spreading ground improvement program to increase groundwater recharge. Several projects were undertaken to meet this goal. The improvement projects built partnerships with various agencies that contributed to an increase in the storage capacity at facilities to conserve additional storm water, connect spreading grounds to maximize flow of recycled, imported, and storm water, and optimize water conservation efforts. Overall, the County has constructed facilities to recharge an additional 10,000 acre-feet (3.26 billion gallons) of water worth over $4 million through this program, has and received over $12 million in reimbursement from the partnerships.
In addition, through Waterworks District No. 40, the County is designing and will construct a backbone system to serve over 13,000 acre-feet (4.2 billion gallons) of recycled water throughout the Antelope Valley, serving Palmdale, Lancaster, and the surrounding unincorporated communities. Recycled water will be used for irrigation at commercial, industrial, and recreational facilities, and will be offered to customers at a lower cost than drinking water. The beneficial use of recycled
water will increase the reliability of water supplies in the Antelope Valley, decrease the area’s reliance on imported water and local groundwater supplies, and provide a viable means for reusing treated wastewater.
��
Com
munity a
nd M
unic
ipal S
ervic
es

Water Conservation Makes A Difference to LA!
Com
munit
y and M
unic
ipal Serv
ices
Did you know that 75 percent of the earth is covered in water, but only one percent of that can be used for human
consumption? Water is our most precious resource and as California ends its third year of drought and the potential for a fourth consecutive year of drought looms, the need for water efficiency and conservation is more critical than ever.
With more than 140 facilities (10 major regional parks, 67 local parks and 17 community regional parks, four arboreta and botanic gardens, 18 natural areas and 19 golf courses) to manage, the County’s Department of Parks and Recreation (DPR) is exploring all potential and feasible water efficiency technologies to conserve and ensure efficient use of our limited water supply.
Reclaimed water is wastewater that has undergone an extensive treatment process and is available for reuse after being tested and certified by the California Department of Health Services. The main use of reclaimed water is the irrigation of large landscaped areas such as golf courses, parks and gardens. The use of reclaimed water is an efficient way to stretch our water supplies and reduces the County’s water expenses. The cost of reclaimed water is typically 15-20 percent less than potable water.
�0
Department of Parks and Recreation
0
500,000
1,000,000
1,500,000
2,000,000
2009 2010 2011 2012 2013
Reclaimed Water
Potable Water
1.0
1.5
2.0
2.5
Gallo
ns o
f Pot
able
Wat
er(in
bill
ions
)
Gallons of Potable Water Saved
(in billions)Dolla
rs S
aved
0
500,000
1,000,000
1,500,000
2,000,000
2009 2010 2011 2012 2013$1.4 million projected savings
over a five year period
Reclaimed Water
Gallons of Potable Water Saved
(in billions)Dolla
rs S
aved
0.5
1.2
1.8
2.4
3.0
3.6
0.5
1.2
1.8
2.4
3.0
3.6
Water Savings Measures:(1) Reclaimed water savings(2) Redirected potable water savings (billions
of gallons)
AnalysisIn 2008, eleven parks and five golf courses were using reclaimed water, realizing approximately $280,000 annually in savings from using reclaimed water instead of potable water. This accounts for more than 400 million gallons of potable water that was saved by using reclaimed water for irrigation purposes. In 2009, DPR converted three additional parks to use reclaimed water, raising the savings to $360,000 annually.
What Is in L.A. County’s Future?Plans are in development to begin irrigating an additional three parks and one golf course with reclaimed water. The additional savings are estimated at $45,000 per year. Approximately

Com
munity a
nd M
unic
ipal S
ervic
es
42 million gallons of potable water will be directed to areas where it is needed.
In addition, DPR, the Department of Public Works’ Office of Water Recycling, and local water purveyors are working together to determine the feasibility of converting additional County golf courses, parks, and gardens to reclaimed water. As a result, approximately 25 facilities have been identified that will convert to reclaimed water in the next five years.
References
www.waterless.com/index.php?option=com_content& task=view&id=17&Itemid=44
www.water.ca.gov/drought
www.water.ca.gov/recycling
www.mwdh2o.com
��
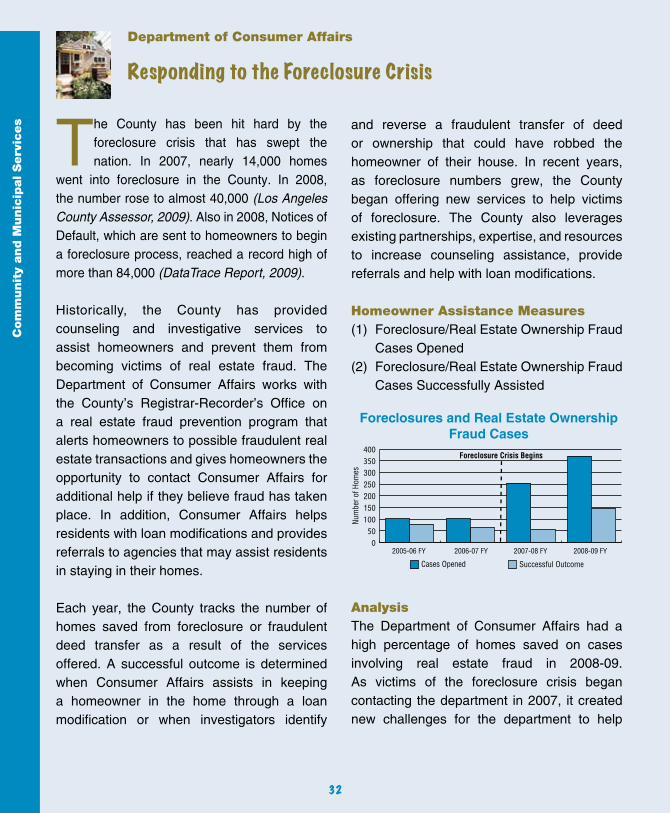
��
Responding to the Foreclosure Crisis
Com
munit
y and M
unic
ipal Serv
ices
The County has been hit hard by the foreclosure crisis that has swept the nation. In 2007, nearly 14,000 homes
went into foreclosure in the County. In 2008, the number rose to almost 40,000 (Los Angeles County Assessor, 2009). Also in 2008, Notices of Default, which are sent to homeowners to begin a foreclosure process, reached a record high of more than 84,000 (DataTrace Report, 2009).
Historically, the County has provided counseling and investigative services to assist homeowners and prevent them from becoming victims of real estate fraud. The Department of Consumer Affairs works with the County’s Registrar-Recorder’s Office on a real estate fraud prevention program that alerts homeowners to possible fraudulent real estate transactions and gives homeowners the opportunity to contact Consumer Affairs for additional help if they believe fraud has taken place. In addition, Consumer Affairs helps residents with loan modifications and provides referrals to agencies that may assist residents in staying in their homes. Each year, the County tracks the number of homes saved from foreclosure or fraudulent deed transfer as a result of the services offered. A successful outcome is determined when Consumer Affairs assists in keeping a homeowner in the home through a loan modification or when investigators identify
Department of Consumer Affairs
Num
ber o
f Hom
es
Cases Opened
2005-06 FY 2006-07 FY 2007-08 FY 2008-09 FY
Successful Outcome
Foreclosures and Real Estate OwnershipFraud Cases
050
100150200250300350400
Foreclosure Crisis Begins
and reverse a fraudulent transfer of deed or ownership that could have robbed the homeowner of their house. In recent years, as foreclosure numbers grew, the County began offering new services to help victims of foreclosure. The County also leverages existing partnerships, expertise, and resources to increase counseling assistance, provide referrals and help with loan modifications.
Homeowner Assistance Measures(1) Foreclosure/Real Estate Ownership Fraud
Cases Opened(2) Foreclosure/Real Estate Ownership Fraud
Cases Successfully Assisted
AnalysisThe Department of Consumer Affairs had a high percentage of homes saved on cases involving real estate fraud in 2008-09. As victims of the foreclosure crisis began contacting the department in 2007, it created new challenges for the department to help

��
Com
munity a
nd M
unic
ipal S
ervic
es
these homeowners with counseling and loan modifications. New strategies and procedures were set up to triage and assist the multitude of residents contacting the County for help.
In 2007-08, the Department of Consumer Affairs developed new methods of identifying emergency foreclosure cases and partnered with local community groups to provide non-emergency loan modification assistance. New procedures were also implemented to work with lenders and keep families in their homes, and a Foreclosure Prevention Project was created to focus resources for this crucial support. A special Web feature was launched at dca.lacounty.gov to provide detailed information on how to survive the housing crisis and includes information on new laws, foreclosure facts, and how to avoid becoming the victim of a foreclosure rescue scam. The results of these efforts are clearly evident in 2008-09. During this single year, more homes were saved than in the previous two years combined.
What Is in L.A. County’s Future?The County continues to strengthen partnerships with local community groups to help homeowners and renters in foreclosure. Using federal stimulus dollars, the County has devoted additional resources to help residents facing foreclosure transition into stable housing to avoid homelessness and offer seamless services in this area. As the foreclosure crisis
continues to impact homeowners the County will develop new and innovative ways of dealing with this dilemma, ensuring that more families stay in their home.
ReferencesLos Angeles County Assessor (2009) Annual Foreclosures
in Los Angeles County – 1992 through 2008 Recording Data.
DataTrace Report (2009) Monthly Foreclosures in Los Angeles County – January 1985 through December 2008.

Arts Education and the Creative Economy
Arts education is crucial to preparing students to be the creative, adaptable, critical thinkers needed in the 21st
century workforce. Creative industries comprise the second largest business sector in the Los Angeles region, generating nearly 1 million jobs. The lack of arts education in the K-12 public school curriculum to adequately prepare students for these jobs is a serious concern.1 Studies have shown that high-quality learning experiences in the arts improve students’ abilities to create and test theories, visualize new possibilities and develop an ethic of persistence.2
In September 2002, following a report that showed inadequacies in arts education in the region,3 Los Angeles County Board of Supervisors adopted Arts for All: Los Angeles County Regional Blueprint for Arts Education, a strategic plan to restore education in dance, music, theatre and the visual arts to the County’s 81 school districts.
The Arts Commission, in collaboration with the L.A. County Office of Education and more than 100 private and public partners, leads Arts for All. Established in 2003-04, Arts for All offers school districts coaching to achieve five critical success factors to establish arts education infrastructure: a school board-adopted policy, implementation plan with timeline, district-level arts coordinator, 5 percent district budget allocation and at least a 400:1 ratio of students to credentialed arts teachers. The decision to concentrate on infrastructure was driven by the understanding
��
that if arts education were woven into the fabric of the school district, it would be more difficult to eliminate during challenging economic times. This supposition has proven to be true. In the current fiscal crisis, arts education programs in Arts for All districts experienced budget cuts, but they were part of across-the-board belt tightening rather than the total elimination of arts education programs and staff.
Arts for All also assists school districts in the implementation of their art education plans. The Artist Residency Grant Program subsidizes the cost for school districts to bring artist teachers — who have been vetted for quality and adherence to California state standards—from the Arts for All’s roster into the classroom. In its first three years, the number of students reached through the program has nearly tripled, increasing from 2,500 to 7,264. In this way, Arts for All helps enrich the arts education curriculum in school districts and raises the standards for artist teachers in the classroom.
Arts Education Measures:(1) Number of participating school districts and
students participating in Arts for All
AnalysisBy 2008-09, 34 of 81 County school districts, representing 476,531 students, were actively participating in the Arts for All initiative. Twenty-eight of the school districts have a school board-adopted plan, and six are in the process of developing plans. Overall, Los Angeles
Com
munit
y and M
unic
ipal Serv
ices
Arts Commission

County school districts are showing significant improvement in arts education for the first time in more than a generation.4 There have been sizeable increases in the number of school districts adopting policies and plans and establishing arts coordinator positions. Improvement has been accelerated in Arts for All school districts: between 2005 and 2008, they adopted policies at 2.5 times the rate of other school districts and plans at 1.6 times the rate of other school districts. The number of arts coordinators in Arts
Com
munity a
nd M
unic
ipal S
ervic
es
for All school districts increased by 44 percent versus a 15 percent increase in other districts.
What Is in L.A. County’s Future?Despite the fiscal crisis, Los Angeles County school districts continue to join Arts for All. Five new districts have signed on for the 2009-10 school year, bringing total students represented to 517,531. With the help of a $1.2 million grant from The Wallace Foundation and guided by case studies of the first 11 districts to join the initiative,5 the Arts Commission and its partners, starting in 2009-10, are offering school districts additional services to address obstacles to implementation of arts education plans. These include training for school district leaders, the building of arts education advocacy teams and help in identifying funding sources. Ultimately the success of Arts for All is measured by what is happening in the classroom. A data collection system is being designed and indicators established to collect information such as the number of students engaged in arts education, the quality of the instruction and the equitable distribution of arts instruction.
References1 Creative Economy Report 2008, Otis College of Art
and Design and the Los Angeles County Economic Development Corporation.
2 Critical Links: Learning in the Arts and Student Achievement and Social Development, Arts Education Partnership, 2002.
3 Arts in Focus: Los Angeles Countywide Arts Education Survey, Arts Education Task Force of Arts for LA, 2001.
4 2008 Arts Education Performance Indicators (AEPI) Report, Arts for All Executive Committee.
5 Arts for All: The Vanguard Districts – Case Studies from the First Five Years, Los Angeles County Arts Commission, 2009.
��
School Districts Participating in Arts for All
2003-04 Culver City, Los Angeles County Office of Education, Norwalk-La Mirada, Pasadena, Rosemead, Santa Monica-Malibu
2004-05 Beverly Hills, Burbank, Castaic, Compton, Hacienda La Puente plus above
2005-06 ABC (serves the cities of Artesia, Cerritos, Hawaiian Gardens, as well as portions of Lakewood, Long Beach and Norwalk), Alhambra, Little Lake City, Palos Verdes Peninsula plus above
2006-07 Inglewood, Mountain View, Paramount, Wiseburn plus above
2007-08 Bassett, East Whittier City, Lancaster, Montebello, Palmdale, Pomona, Redondo Beach, Saugus Union, South Pasadena plus above
2008-09 Glendale, Lawndale, Lynwood, Manhattan Beach, San Marino, Temple City plus above
Participating School Districts
Culver City, Los Angeles County Office of Education, Norwalk-La Mirada, Pasadena, Rosemead, Santa Monica-Malibu
Beverly Hills, Burbank, Castaic, Compton,Hacienda La Puente plus above
ABC (serves the cities of Artesia, Cerritos, Hawaiian Gardens,as well as portions of Lakewood, Long Beach and Norwalk), Alhambra, Little Lake City, Palos Verdes Peninsula plus above
Inglewood, Mountain View, Paramount, Wiseburn plus above
Bassett, East Whittier City, Lancaster, Montebello, Palmdale,Pomona, Redondo Beach, Saugus Union, South Pasadenaplus above
Glendale, Lawndale, Lynwood, Manhattan Beach, San Marino,Temple City plus above
Year
2003-04
2004-05
2005-06
2006-07
2007-08
2008-09
Total StudentsRepresented
81,679
164,795
223,434
268,635
409,842
476,531
Arts for All Participation
Number of Districts and Students Added Total Participation
2003-04 2004-05 2005-06 2006-07 2007-08 2008-09
Num
ber o
f Stu
dent
s in
Arts
for A
ll
0
100,000
200,000
300,000
400,000
500,000
4 9 6456

Opera
tions
Climate change and energy efficiency remain vitally important issues, not only to County residents, but
to the entire world. When Governor Arnold Schwarzenegger signed California’s Global Warming Solutions Act, Assembly Bill (AB) 32, into law in 2007, the County Internal Services Department’s (ISD) Energy Management Division was already hard at work on the development and implementation of many energy efficiency initiatives. AB 32 mandates that the State reduces greenhouse gas (GHG) emissions to 1990 levels by 2020. The energy used to heat, cool and light buildings generates greenhouse gases that contribute to global warming. The County continues to be proactive in its efforts to mitigate global warming and increase energy efficiency. Through various energy efficiency projects, the ISD’s Energy Management program, established in 1994, continues to significantly reduce GHG emissions, managing energy consumption and capping costs. Energy efficiency projects implemented include upgrades to energy efficient lighting, state of the art lighting controls, heating, ventilating and air condition retrofits, and retro commissioning projects that optimize the operation of the building heating and cooling systems.
Energy Conservation and Management
��
Internal Services Department
Analysis Los Angeles County continues its comprehensive approach to energy efficiency and global warming. The County’s Energy Management Program continues to achieve energy efficiency and CO2 reduction through the implementation of energy efficiency projects. Since 1994, the County’s energy efficiency efforts are projected to save over $122 million in avoided utility costs by June 2010. The energy saved results in over 541,000 metric tons of CO2 emissions, equating to taking 12,295 cars off the road and planting 18,442 trees.
What Is in L.A. County’s Future?Most recently, the County has begun to focus on renewable energy. As a major electricity user with facilities spread across a wide geography, the County is a natural “test-bed” for the implementation of solar energy systems. Solar power is a proven technology for meeting energy needs while reducing the carbon footprint on the environment. The County has
0
25
50
75
100
125
250
500FY 1994-95 FY 2008-09
$122,000,000 Saved
541,000 Metric tonsCO2 eliminated
Cost Savings and CO2 Emissions Eliminated(Fiscal Year 1994-95 to 2008-09)
Dollars saved(in millions)
CO2 emissionseliminated(in thousandsof metric tons)
Opera
tions
��
created a countywide Solar Map, combining data from aerial imagery mapping with solar energy measuring software to calculate energy savings from solar projects installed on building rooftops. Project costs, installation detail and where to get more information about solar installations can be accessed at solarmap.lacounty.gov. In addition, the general public can visit the site and calculate the “solar potential” of their homes and businesses throughout the County.
In an effort to encourage environmental stewardship, the Green Leadership Award was created to recognize outstanding efforts by individuals and organizations within the County who have developed and implemented innovative programs and projects to enhance environmental sustainability and stewardship. Categories include “Individual”, “Public Agencies”, “Business and Private Sector”, “Non-Profit Agencies” and the “Chair Award”. More information about the Green Leadership Award is available on the County’s Energy and Environmental Efforts Website: green.lacounty.gov.
The County will continue to focus on being energy and environmentally efficient. The County will continue to expand and create new programs that will increase both energy and water efficiency. To meet AB 32 requirements, the County will pursue environmental
programs involving recycling, waste reduction, green purchasing, fleet management and the use of renewable power. Information about all of the County’s energy and environmental efforts are available on the County’s Energy and Environmental Efforts Website at green.lacounty.gov.

Opera
tions
Under the leadership of the Board of Supervisors, the County has prudently and conservatively managed its budget
and fiscal resources to better position itself for the cyclical ups and downs in the national and local economy. A key facet of this fiscal prudence is the tenet that ongoing funding needs should be financed only by ongoing revenues, and one-time revenues should be used for temporary or one-time needs. This approach mitigates the need to reduce or eliminate ongoing services, and having to find new funding to replace one-time revenues.
In the relatively more fiscally stable years leading into the recession, the County avoided the use of one-time revenues for ongoing needs. Bolstered by a strong real estate market and healthy local economy during these more fiscally stable years, the County was able to set aside one-time funds for a “rainy day” to, among other things, protect against reducing service levels due to temporary revenue shortfalls.
As the recession began to gather steam in 2008-09, fiscal year 2009-10 was significantly impacted. Ongoing revenues began to decline and unemployment soared, swelling the ranks of those seeking and receiving public assistance. As a result, the County cautiously
“Rainy Day” Funds Save the County from Harsh Drought
��
County of Los Angeles
committed limited one-time funding for ongoing needs in order to minimize reductions to critical services. Had the County been supporting such services with one-time revenues in the past, service reductions would likely have been far more severe.
Given the depth of the fiscal crisis and the attendant stress on State and local revenues, the County will continue to utilize one-time funds for ongoing needs on a limited basis for the current and subsequent fiscal year. Similarly, the County’s ability to achieve agreement with employee bargaining units regarding no employee salary increases for two years (one year for public safety units) avoided additional costs that would have made cuts more severe. Due to the County’s fiscal prudence and discipline, the one-time funds that were set aside during more fiscally stable years are available to lessen the impact of the current fiscal crisis that is being experienced not only by the County, but the entire nation.
Percent of Ongoing Needs Financed by Ongoing Revenues:2006-07 Actual 100%2007-08 Actual 98.9%2008-09 Actual 100%2009-10 Estimated 97.6%2010-11 Projected 93.0%

Opera
tions
��
What Is in L.A. County’s Future?As government revenues begin to stabilize and the slow recovery begins as projected in fiscal year 2011-12, the County will replenish the one-time reserves and return to the strict dictum of using one-time revenues for one-time funding needs.

Departments Listed within Clusters
Health and Mental Health Services• Health Services• Mental Health• Public Health
Operations• Affirmative Action Compliance• Assessor• Auditor-Controller• Chief Information Office• County Counsel• Executive Office, Board of Supervisors• Human Resources• Internal Services• Registrar-Recorder/County Clerk• Treasurer and Tax Collector
Children and Families’ Well-Being• Child Support Services• Children and Family Services• Community and Senior Services• Military and Veterans Affairs• Public Social Services
Community and Municipal Services• Animal Care and Control• Beaches and Harbors• Community Development Commission• Consumer Affairs• Museum of Art• Museum of Natural History• Parks and Recreation• Public Library• Public Works• Regional Planning
Dial 2-1-1 for access to information for various health and human services programs throughout Los Angeles
County, such as emergency food and shelter, senior services, childcare, employment resources, low-cost health care, mental health assistance, and more.
For residents in the unincorporated areas of the County, you can also dial 2-1-1 to access an array of municipal services, as well as report code enforcement problems, such as lost dogs,
graffiti, and illegal dumping.
2-1-1 operates 24 hours a day, 7 days a week.The information you provide to the resource advisors is confidential.
Public Safety• Agricultural Commissioner/Weights and Measures• Alternate Public Defender• Coroner• District Attorney• Fire • Probation • Public Defender• Sheriff
AW 0610