Embed Size (px)
Citation preview

1
Type of contribution: Regular paper 1
Date of preparation: 5 March 2007 2
Number of text pages: 31 3
Number of tables: 5 4
Number of figures: 5 5
Instructions to the printer: Figures 1, 3 and 5 are designed to cover two columns 6
7
8
9
Contribution of nitrification and denitrification to N2O emissions from urine 10
patches 11
12
Mette S. Carter 13
14
Biosystems Department, Risø National Laboratory, Technical University of Denmark, 15
P.O. Box 49, DK-4000 Roskilde, Denmark 16
Tel.: +45 4677 4238; fax: +45 4677 4160; e-mail: [email protected] 17
18
19
20
Prepared for submission to: Soil Biology & Biochemistry 21
2
Abstract 22
Urine deposition by grazing livestock causes an immediate increase in nitrous oxide 23
(N2O) emissions, but the responsible mechanisms are not well understood. A nitrogen-24
15 (15N) labelling study was conducted in an organic grass-clover sward to examine the 25
initial effect of urine on the rates and N2O loss ratio of nitrification (i.e. moles of N2O-N 26
produced per moles of nitrate produced) and denitrification (i.e. moles of N2O produced 27
per moles of N2O + N2 produced). The effect of artificial urine (52.9 g N m-2) and 28
ammonium solution (52.9 g N m-2) was examined in separate experiments at 45 and 29
35% water-filled pore space (WFPS), respectively, and in each experiment a water 30
control was included. The N2O loss derived from nitrification or denitrification was 31
determined in the field immediately after application of 15N-labelled solutions. During 32
the next 24 h, gross nitrification rates were measured in the field, whereas the 33
denitrification rates were measured in soil cores in the laboratory. Compared with the 34
water control, urine application increased the N2O emission from 3.9 to 42.3 μg N2O-N 35
m-2 h-1, whereas application of ammonium increased the emission from 0.9 to 6.1 μg 36
N2O-N m-2 h-1. In the urine-affected soil, nitrification and denitrification contributed 37
equally to the N2O emission, and the increased N2O loss resulted from a combination of 38
higher rates and higher N2O loss ratios of the processes. In the present study, an 39
enhanced nitrification rate seemed to be the most important factor explaining the high 40
initial N2O emission from urine patches deposited on well-aerated soils. 41
42
Keywords 43
Denitrification; Grass-clover; Grassland; Gross nitrification; Loss ratio; 15N; Nitrous 44
oxide; pH; Urine 45

3
46
1. Introduction 47
Grazed grasslands cover about 40% of the agricultural area in Europe (FAO, 48
2004), and urine deposited by grazing livestock has a large impact on the emission of 49
nitrous oxide (N2O) from these soils. Nitrous oxide is a well recognized greenhouse gas. 50
Agricultural soils contribute approximately 50% of the World’s anthropogenic N2O 51
emissions (IPCC, 2001) and currently this source of N2O represents 2.4% of the 52
European release of anthropogenic derived greenhouse gasses (EEA, 2006). 53
Furthermore, N2O is involved in the depletion of the stratospheric ozone layer (Crutzen, 54
1981). 55
Nitrous oxide is mainly produced by nitrifying and denitrifying bacteria in the 56
soil (Wrage et al., 2001) and the N2O emission usually increases immediately after urine 57
deposition (e.g. Allen et al., 1996; Koops et al., 1997; Yamulki et al., 1998). Williams et 58
al. (1999) estimated that N2O losses within the first 24 h after urine deposition 59
accounted for approximately 8% of the annual N2O emission from a grassland. 60
The mechanisms responsible for the high N2O loss from urine patches are not 61
well understood and may vary according to abiotic factors, e.g. soil type, moisture, pH 62
(Clough et al., 1998, 2004) and the amount of urine-nitrogen (N) deposited (Petersen et 63
al., 2004). It is well-known that soil pH rises temporarily following urine deposition 64
because alkaline products are formed during the rapid enzymatic hydrolysis of urea, 65
which is expressed as 66
67
(NH2)2CO + 3 H2O → 2 NH4+ + OH- + HCO3
- (1) 68
69

4
The raised pH in the urine-affected soil shifts the equilibrium between ammonium 70
(NH4+) and dissolved ammonia (NH3(aq)) towards NH3(aq) (Schmidt, 1982), which at high 71
concentrations inhibits microbial activity. Sherlock and Goh (1983) applied urine, urea 72
and ammonium corresponding to 20 g N m-2 dissolved in similar volumes of liquid and 73
found that urine gave rise to the largest N2O emission, especially immediately after 74
application. Thus, elevated soil water content and availability of inorganic N only 75
explain part of the urine-induced N2O emission. Urine contains hippuric acid, which is 76
known to accelerate the hydrolysis of urea and thereby also the formation of NH3(aq) 77
(Whitehead et al., 1989). The findings of Sherlock and Goh (1983) could indicate that 78
the NH3(aq) concentration in the soil solution plays an important roll for the initial N2O 79
production in urine patches. 80
The N2O loss via nitrification and denitrification is influenced by four 81
parameters (Firestone and Davidson, 1989; Granli and Bøckmann, 1994). These are the 82
rate of gross nitrification (N) and denitrification (D), the N2O loss ratio of nitrification, 83
i.e. moles of N2O-N lost per moles of nitrate (NO3-) produced (LN) and the N2O loss 84
ratio of denitrification, i.e. moles of N2O lost per moles of N2 + N2O produced (LD). 85
Thus, the total loss of N2O from nitrification and denitrification (E) can be described as 86
87
E = N × LN + D × LD (2) 88
89
Any particular environmental factor may affect the four parameters differently. 90
In urine patches, the rate of nitrification (N) may be stimulated by the enhanced 91
availability of the substrate, NH4+. However, as nitrite (NO2
-) oxidation is more readily 92
inhibited by NH3(aq) than the NH4+ oxidation (Harada and Kai, 1968), the N2O formation 93

5
may rise due to chemical decomposition of NO2- or reduction of NO2
- via nitrifier 94
denitrification (Wrage et al., 2001, 2004b). Thus, the first hypothesis is that in urine-95
affected soil the N2O loss from nitrification will increase mainly as a result of an 96
increase in the N2O loss ratio of the process (LN). 97
The rate of denitrification (D) in urine-affected soil may be stimulated by a 98
urine-induced rise in dissolved organic carbon (DOC), either via solubilization of soil 99
organic carbon (C), or because labile compounds are released from scorched plant roots 100
(Monaghan and Barraclough, 1993). However, the N2O loss ratio of denitrification (LD) 101
decreases when pH increases and when the NO3-/labile C ratio decreases (Hutchinson 102
and Davidson, 1993; Simek and Cooper, 2002), i.e. denitrification is more complete 103
with more N2O reduction. Thus, the second hypothesis is that in urine-affected soil the 104
N2O loss from denitrification will increase due to an increase in the rate of the process 105
(D). 106
The objective of the present study was to investigate the mechanisms involved 107
in the initial N2O production following urine deposition. More specifically, the 108
objective was to assess changes in the four parameters that influence the N2O 109
production (viz. N, D, LN and LD) in urine patches deposited on a sward having 110
intermediate soil water content (about 45% water-filled pore space, WFPS). Artificial 111
urine (52.9 g N m-2) was used and a water treatment was included as control. In 112
addition, an experiment with an ammonium solution and water was conducted at lower 113
soil water content (about 35% WFPS) to study the effect of soil moisture on the four 114
parameters. The nitrogen-15 (15N) labelling and acetylene inhibition techniques were 115
used to quantify the parameters. Separate labelling of the NH4+ and NO3
- pools with 15N 116
has been used frequently to assess the contribution of nitrification and denitrification to 117
6
the N2O production in soil, but was only involved in a few studies on urine-affected soil 118
(e.g. Monaghan and Barraclough, 1993). 119
120
2. Materials and methods 121
122
2.1. Field site 123
The study was conducted in a sward consisting of white clover (Trifolium repens 124
L.), red clover (Trifolium praténse L.) and perennial ryegrass (Lolium perenne L.) 125
during the second production year. The grass-clover sward was part of an organic crop 126
rotation, which represented a dairy system, and was situated in Taastrup, 18 km west of 127
Copenhagen (55º 40′N, 12º 18′E). The soil was a loamy sand with a total N content of 128
0.21%, total C content of 2.1% and pH in water of 7.9. Microplots were established in 129
December 2002 by pushing 56 PVC cylinders (30 cm i.d. by 30 cm long) into the soil to 130
a depth of approximately 22.5 cm. Grazing was simulated during the summer of 2003 131
by regularly mowing the sward to 15 cm high. Soil temperature at a depth of 10 cm was 132
registered continuously and measurements of daily rainfall were obtained from a local 133
meteorological station (CWB, 2003). 134
The effect of ammonium (52.9 g N m-2) on the nitrification and denitrification 135
processes was examined in the first experiment, which took place from 26 to 30 August 136
2003. Two weeks later, the effect of artificial urine (52.9 g N m-2) on the processes was 137
assessed in the second experiment. In each experiment, a set of 28 microplots was used. 138
139

7
2.2. Solutions for 15N field measurements 140
Nitrogen-15 techniques were used in the field to determine the rate of gross 141
nitrification and the amount of N2O produced via nitrification or denitrification. Five 142
solutions were prepared for the first experiment, viz. water only, water/15NH4+, 143
water/15NO3-, ammonium/15NH4
+ and ammonium/15NO3-. The total N concentrations of 144
the ammonium and water solutions were 15.6 g N l-1 and ≤ 0.02 g N l-1, respectively. In 145
the second experiment, ammonium in the solutions was replaced by artificial urine 146
consisting of urea (28.5 g l-1), hippuric acid (11.9 g l-1), creatinine (0.3 g l-1), allantoin 147
(0.6 g l-1), uric acid (0.2 g l-1), NH4Cl (1.4 g l-1), KHCO3 (22.9 g l-1) and KCl (16.9 g l-1) 148
(De Klein and Van Logtestijn, 1994), giving a total N concentration in the solutions of 149
15.6 g N l-1. Details of the content, 15N labelling, total N concentration and specific 150
purpose of each of the solutions are given in Table 1. 151
152
2.3. 15N field measurements 153
For practical reasons, the two 15NH4+ labelled solutions were applied on day 1 of 154
each experiment (viz. 26 August and 9 September), whereas the remaining three 155
solutions were applied the following day. More specifically, 240 ml of each solution 156
was carefully applied on the soil surface in four microplots using a 60 ml Plastikpak 157
syringe fitted with a veterinary injection needle. Subsequently, 180 ml distilled water 158
was added using the same technique, which altogether resulted in a mean penetration 159
depth of about 2 cm. 160
Measurement of N2O emission by a static chamber method was initiated within 161
2.5 h of solution application. Briefly, each microplot was sealed with a PVC lid (5 cm 162
inner height) fitted with a rubber septa to allow gas sampling. The lid had an EPDM 163
Table 1
8
(Ethylene Propylene Diene Monomer) rubber gasket on the sealing edge and was 164
weighed down to ensure a complete seal. For analysis of initial N2O concentration and 165
15N enrichment, three 3.5 ml N2-flushed Venoject vials and three evacuated 120 ml 166
serum bottles were filled with samples of ambient air using a 60 ml syringe. After 50, 167
100 and 150 min of cover period, a sample of the headspace gas was taken with a 168
syringe through the rubber septa and stored in a 3.5 ml vial for later analysis of N2O 169
concentration. At the end of the cover period (150 min), a 120 ml sample was taken to 170
determine the 15N enrichment of N2O. 171
Following gas sampling a soil sample, consisting of four soil cores (0-10 cm 172
depth, 2 cm diameter) was collected from each microplot. In the microplots labelled 173
with 15NO3-, the sampling holes were closed with 50 ml screw capped test tubes to 174
prevent aeration of the soil and drainage of water. After about 24 h, soil sampling was 175
repeated in these microplots to determine the rate of gross nitrification via 15NO3- pool 176
dilution. 177
178
2.4. Analysis of gas samples from the field 179
The 3.5 ml gas samples were pressurized by adding 2 ml N2 before they were 180
analysed for N2O in a gas chromatograph (GC-14B, Shimadzu, Kyoto, JP) fitted with a 181
HaySep Q column (100-120 mesh) and an electron capture detector (column and 182
detector temperature were 30 °C and 300 °C, respectively). The 120 ml samples were 183
analysed for 15N enrichment of N2O following removal of H2O and CO2 as well as 184
cryogenic focusing of N2O on a trace gas concentration unit (PreCon, Thermo 185
Corporation, Bremen, DE) coupled in continuous flow mode to an isotope-ratio mass 186
spectrometer (IRMS; Finnigan MAT Delta Plus, Bremen, DE). 187

9
188
2.5. Soil analyses 189
Coarse roots and pebbles (> 4 mm) were removed by tweezers. Within 7 h of 190
soil sampling, 20 g portions of each ‘root free’ soil sample were extracted in 1 M KCl 191
(1:5, w:vol), stirred on a horizontal shaker for 1 h at 140 rpm. The extracts were filtered 192
through Whatman 40 filters and kept at -20 °C until further analysis. 193
Dissolved organic carbon in the extracts from 15NO3- labelled microplots was 194
measured on a TOC-5000A total organic C analyzer (Shimadzu, Kyoto, JP). The 195
content of NH4+, NO3
- and NO2- in extracts were analysed colorimetrically on an 196
autoanalyzer (Bran+Luebbe, Norderstedt, DE). Nitrogen-15 enrichment of NH4+ and 197
NO3- were determined in extracts by the diffusion method (Sørensen and Jensen, 1991). 198
Briefly, NH4+ in the extract was converted into NH3, which was trapped on an acidified 199
filter paper. Subsequently, NO3- was converted via NH4
+ into NH3, which was trapped 200
on another filter. The filters were analysed for 15N using an elemental analyser (EA 201
1110, Carlo Erba, Milano, IT) coupled in continuous flow mode to the IRMS. Some 202
carry-over of NH4+ was detected on the NO3
- filters from the ammonium and urine 203
treatments, which was corrected for via the autoanalyzer measurements. 204
Soil pH was determined in a 10:25 (w:vol) suspension of fresh soil in distilled 205
water using soil sampled on day 3 of each experiment. Samples of air-dried soil from 206
the water-only treatment in the first experiment were finely ground and analysed for 207
total C and total N on the elemental analyser. 208
209

10
2.6. Acetylene inhibition technique 210
The rate of denitrification was determined on soil cores in the laboratory using 211
acetylene (C2H2) inhibition of the bacterial reduction of N2O to N2 (Ryden et al., 1987). 212
On day 4 of the experiments, unlabelled solutions of water and ammonium or urine 213
were applied to microplots replicated four times, using the same technique as described 214
above. From each microplot, four soil cores were then collected avoiding plants, in PVC 215
tubes of 10 cm by 4.4 cm inner diameter. The tubes were sealed at the bottom and 216
brought to the laboratory. 217
Incubation with C2H2 was initiated using two soil cores from each microplot. 218
Thus, 4 ml C2H2 (acetone free, AGA A/S, Copenhagen, DK) was injected along the 219
length of each core using a veterinary needle connected to a 5 ml syringe and a C2H2 220
reservoir via a three-way valve (Ambus and Christensen, 1993). The two cores were 221
placed in a 2 litre glass jar, which was closed with a rubber-sealed lid fixed with 222
clamps. A volume (180 ml) of headspace air was extracted from the jar and then 223
replaced with 180 ml of C2H2 using 60 ml syringes and a rubber septa mounted in the 224
lid of the jar. The resulting C2H2 concentration in soil and headspace atmosphere was 225
9%, which inhibits nitrification and is above the 5% needed to block the reduction of 226
N2O to N2 (Okereke, 1984). Subsequently, control incubations were initiated on the 227
other two soil cores, using pure N2 instead of C2H2. The glass jars were then incubated 228
at 15ºC. After 2, 5 and 20 h of incubation, a 30 ml sample of headspace gas was taken 229
through the rubber septa and transferred to a 3.5 ml N2-flushed Venoject vial using a 230
syringe. A volume of 30 ml N2 was added to the jar before each gas sampling to 231
maintain atmospheric pressure. Soil dry matter was determined after the last gas 232
sampling (oven drying at 105 °C for 24 h). 233
11
The 3.5 ml gas samples had 2 ml of N2 added before they were analysed for N2O 234
in a gas chromatograph (Chrompack-9001, Chrompack, Middelburg, NL) fitted with 235
two HayeSep Q columns (60-80 and 80-100 mesh, respectively) and an electron capture 236
detector (column and detector temperature were 60 °C and 325 °C, respectively). 237
238
2.7. Calculations and statistics 239
Fluxes of N2O in the field and laboratory were calculated from the increase in 240
N2O concentration in the headspace during the incubation periods. The rate of 241
denitrification in the 0-10 cm soil layer was established from the N2O-N formation in 242
the glass jars with C2H2. 243
When significant N2O emission was detected from the microplots (i.e. R2 of 244
N2O concentration vs. time ≥ 0.65), then the 15N enrichment of the emitted N2O (C*) 245
could be determined as 246
247
C* = (CtCt* - C0C0
*) / (Ct - C0) , (3) 248
249
where C0 and Ct are the N2O concentration calculated from the regression equation at 250
the start and at the end of the cover period, respectively, and C0* and Ct
* are the 15N 251
atom% excess enrichment of N2O at the start and at the end of the cover period, 252
respectively. 253
The emission of N2O derived from nitrification was calculated from the 15N 254
labelled N2O emitted from the 15NH4+ labelled microplots, which was determined in two 255
ways. If a significant N2O emission took place, then emission of 15N labelled N2O (CC*) 256
was established as 257
12
258
CC* = CtCt* - C0C0
* (4) 259
260
If only a significant increase in 15N enrichment of N2O was detected, then the emission 261
of 15N labelled N2O was calculated as 262
263
CC* = (Ct* - C0
*)C0 (5) 264
265
Gas measurements were initiated within 2.5 h of solution application and 266
therefore it may be assumed that the unlabelled N pool (i.e. NH4+ in 15NO3
- labelled 267
microplots and NO3- in 15NH4
+ labelled microplots) had not yet been labelled via 268
transformation of labelled N (Panek et al., 2000). Furthermore, the added solutions were 269
assumed to affect the 0-2 cm soil layer, as this was the mean penetration depth. 270
As a result, emission of N2O-N derived from nitrification (CP) was established as 271
272
CP = CC*/Ni*
, (6) 273
274
where Ni* is the calculated 15N atom% excess enrichment of NH4
+ in the 0-2 cm soil 275
layer. The estimates were subsequently converted from concentrations of N2O to 276
amounts of N. Likewise, emission of N2O derived from denitrification was determined 277
from the emission of 15N labelled N2O from the 15NO3- labelled microplots, using 278
equation 4 and 5, and the atom% excess enrichment of NO3- in the 0-2 cm soil layer, 279
using equation 6. Panek et al. (2000) made similar calculations. The 15N tracer 280
technique is based on the assumption that the 15N labelled compound mixes 281

13
homogeneously with the soil pool (Stevens et al., 1997), but in field trials it may be 282
difficult to obtain completely uniform labelling. However, when the addition of labelled 283
N by far exceeds the native soil N, there is initially only one significant pool, which is 284
practically uniform (Bergsma et al., 1999). 285
Gross nitrification rates were calculated according to Mosier and Schimel (1993) 286
using the isotopic dilution of 15N labelled NO3- in the 0-10 cm soil layer measured 287
during 24 h. The rate of nitrification and denitrification in the 0-2 cm soil layer was 288
estimated as 1⁄5 of the activity in the 0-10 cm layer. Gravimetric water content was 289
converted to water-filled pore space using measured soil bulk density and assuming a 290
particle density of 2.65 g cm-3. 291
Analysis of variance (ANOVA), analysis of covariance (ANCOVA) and 292
Tukey’s multiple comparison tests (α = 0.05) were performed using SAS General 293
Linear Model procedure (SAS Institute, 1997). Statistics on net N2O emissions and 294
denitrification rates were performed on square root and log transformed data. Some 295
results are reported as the mean ± standard error. 296
297
3. Results 298
299
3.1. Soil moisture, temperature and pH 300
Water-filled pore space of the soil increased between the two experiments due to 301
rains during the intervening period (P < 0.0001; Fig. 1). Mean soil temperature at 10 cm 302
depth during the experimental periods was 15.3 °C and did not vary significantly 303
between day and night or between the two experiments (P ≥ 0.29; data not shown). Soil 304
Figure 1
14
pH was 7.9 in the water treatment, decreased to 7.4 in the ammonium treatment and 305
increased to 8.3 in the urine treatment (P < 0.05; data not shown). 306
307
3.2. Inorganic N and DOC 308
The small amounts of 15N label added in the water treatments had no significant 309
effect on the content of soil NH4+ and NO3
- in the microplots (P ≥ 0.057; data not 310
shown). In the water treatment, the major part of the inorganic N was found as NH4+ (P 311
< 0.0001) (Table 2). Overall, data on soil NO3- showed an effect of the added solutions 312
(P < 0.0001), which derived from high net nitrification in the urine treatment. The 313
increase in soil inorganic N in the urine treatment compared to the water control 314
indicated that 84 ± 4% of the urea was hydrolysed before the first soil extraction. In all 315
treatments the soil content of NO2- was below the detection limit of about 0.1 μg N g-1 316
dry soil. 317
The soil content of DOC showed an effect of the added solutions (P = 0.0003), 318
which resulted from a higher content in the urine treatment compared to the water 319
control in the second experiment (P = 0.0028; Fig. 2). However, relatively, the NO3- 320
content increased more than the DOC content, and therefore the NO3-/DOC ratio 321
increased in the urine treatment compared to the water control in the second experiment 322
(P = 0.032). 323
324
3.3. N2O emission 325
The N2O emission and the final 15N enrichment of N2O in the chambers are 326
shown in Table 3 for each individual treatment. The 15NH4+ and 15NO3
- label added in 327
the water treatments had no effect on the amount of N2O emitted from the microplots (P 328
Table 2
Figure 2
Table 3
15
= 0.36; Table 3). Compared to the water control, ammonium application increased the 329
N2O emission from 0.9 to 6.1 μg N2O-N m-2 h-1 (P = 0.011), whereas application of 330
urine increased the emission from 3.9 to 42.3 μg N2O-N m-2 h-1 (P < 0.0001) (Fig. 3). 331
The increased N2O emission from the water treated microplots between the two 332
experiments was probably a result of increased WFPS (P = 0.0021). Using N2O 333
emission from the water treatments as a covariate revealed a significantly higher N2O 334
emission from the urine treatment compared to the ammonium treatment (P = 0.013). 335
336
3.4. 15N of inorganic N 337
For soil sampled 5 h after solution application, the 15N enrichment of NH4+ and 338
NO3- in the paired treatments of water and ammonium or urine deviated more than 339
could be explained by the initial soil content of NH4+ and NO3
- (Table 4). This 340
suggested that the 15N enrichment had changed over the 12-hour period that separated 341
application of solutions and KCl extraction of the soil, and was perhaps a result of 342
microbial activity or due to exchange of 15NH4+ with 14NH4
+ adsorbed to soil colloids. 343
Furthermore, the 15N enrichment of NH4+ in the water/15NO3
- treatments showed that 344
some NO3- had been converted into NH4
+, possibly via immobilization followed by 345
mineralization or via dissimilatory nitrate reduction to ammonium (DNRA). Recovery 346
of the added 15N in the inorganic N pool of the 0-10 cm soil layer ranged between 8 and 347
118%, with the highest recovery occurring in the ammonium/15NH4+ and urine/15NH4
+ 348
treatments. Low recovery was probably because of N uptake by plants or loss via 349
denitrification. 350
351
Figure 3
Table 4

16
3.5. Source of N2O produced in the 0-2 cm soil layer 352
In the labelled microplots, the 15N enrichment of the emitted N2O often 353
exceeded the enrichment of soil NH4+ or NO3
- measured 5 h after solution application in 354
the 0-10 cm soil layer (Fig. 4; Table 4). In some cases it also exceeded the initial 355
enrichment calculated for the 0-10 cm soil layer. Thus, the 15N enrichment of the 356
labelled pool being nitrified or denitrified appeared to be higher than the mean 357
enrichment in the 0-10 cm soil layer. During gas measurement, the added solutions were 358
therefore assumed to affect the 0-2 cm soil layer only, as this was the mean penetration 359
depth. The 15N enrichment of N2O emitted from the labelled microplots and the 360
calculated 15N enrichment of soil NH4+ and NO3
- in the 0-2 cm soil layer are shown in 361
Figure 4. Missing values are (1) N2O from the water/15NH4+ treatment in the first 362
experiment, where no net N2O emission took place (Table 3), and (2) NH4+ from the 363
urine/15NH4+ treatment, because the progression of urea hydrolysis was unknown. 364
Based on the emission of 15N labelled N2O and the enrichment of NH4+ and 365
NO3- in the labelled soil layer, it is possible to calculate the contribution of NH4
+ 366
oxidation and NO3- reduction in the soil layer in question to the total N2O emission (Fig. 367
3). The responsible process for N2O formation via NO3- reduction was most likely 368
denitrification. As regards the water treatment, the emission of N2O derived from 369
nitrification or denitrification in the 0-2 cm soil layer was rather similar (P ≥ 0.053) and 370
did not change significantly between the two experiments (P = 0.060) (Fig. 3). In the 371
ammonium treatment, the N2O loss from denitrification in the 0-2 cm soil layer rose to 372
1.1 μg N2O-N m-2 h-1 (P = 0.014), whereas the N2O loss from nitrification in the 0-2 cm 373
layer increased to 5.7 μg N2O-N m-2 h-1 (P = 0.0061), leading to a considerably higher 374
N2O loss from nitrification than from denitrification (P = 0.015). In the urine treatment, 375
Figure 4
17
the N2O loss from denitrification in the 0-2 cm soil layer rose to 21.0 μg N2O-N m-2 h-1 376
(P < 0.0001). The N2O emission derived from nitrification could not be calculated in the 377
urine treatment because the 15N enrichment of NH4+ was unknown. However, it is likely 378
that nitrification was the source of the urine-induced N2O emission, which was not 379
accounted for by denitrification in the 0-2 cm soil layer. Thus, the N2O loss from 380
nitrification in the 0-2 cm soil layer was calculated to be 20.1 ± 1.2 μg N2O-N m-2 h-1, 381
and consequently, nitrification and denitrification contributed equally to the N2O 382
production in the urine treatment (P = 0.63). 383
384
3.6. Rate of gross nitrification and denitrification 385
The rate of gross nitrification in the water treatment measured via 15NO3- pool 386
dilution declined between the two experiments (P = 0.0066; Table 5). In the urine 387
treatment, the nitrification rate increased by factor 9 compared to the water control (P < 388
0.0001). A rate could not be determined for the ammonium/15NO3- treatment, because 389
the 15N enrichment of NO3- apparently increased between the two measurements (Table 390
4). This was probably caused by difficulties in collecting a representative soil sample, 391
combined with increased uncertainty in the determinations, induced by the correction 392
for carry-over of NH4+. 393
During the first experiment, the glass jar incubation with and without acetylene 394
revealed a high N2O reductase activity, which in some cases caused the soil to be a sink 395
of atmospheric N2O (Fig. 5 A). Production of N2O via nitrification was detected in the 396
ammonium treatment, however net N2O emission stopped after 5 h, probably because 397
N2O reductase was induced (Fig. 5 C vs. D). The denitrification rate, determined via the 398
acetylene incubation, demonstrated that the denitrifying activity in the water treatment 399
Table 5
Figure 5

18
increased between the two experiments (P = 0.0002), and was 7-fold higher in the urine 400
treatment compared to the water control (P = 0.0014) (Table 5). No denitrifying activity 401
was detected in the ammonium treatment. In the urine treatment, the N2O loss ratios of 402
nitrification (LN) seemed to increase substantially compared to the water control and the 403
loss ratios of denitrification (LD) also appeared to increase (Table 5). 404
405
4. Discussion 406
407
4.1. Effect of urine on the N2O production 408
Immediately after application of urine corresponding to 52.9 g N m-2 the 409
emission of N2O was 42.3 μg N2O-N m-2 h-1 (Fig. 3), which is comparable to the initial 410
rates determined in other field studies, where similar amounts of urine-N were applied 411
(Allen et al., 1996; Yamulki et al., 1998). Nitrification and denitrification seemed to 412
contribute equally to the N2O production in the urine-affected soil. This could relate to 413
the intermediate soil water content of about 45% WFPS, which provided both aerobic 414
and anaerobic microsites, enabling nitrification and denitrification to occur 415
simultaneously. In contrast, Koops et al. (1997) found that initial N2O from urine 416
applied on very dry top-soil was mainly produced via nitrification, however, in moist 417
soil (75-90% WFPS) denitrification was reported to be the dominant source of the initial 418
N2O (Monaghan and Barraclough, 1993; De Klein and Van Logtestijn, 1994). In all the 419
mentioned studies urine was applied at rates between 40 and 55 g N m-2, thus in 420
amounts comparable to the present study. 421
Concerning the N2O produced during nitrification, the hypothesis was that the 422
N2O production would increase mainly as a result of an increase in the N2O loss ratio of 423

19
the process (LN). This hypothesis turned out only to be partly right as both the gross 424
nitrification rate (N) and the N2O loss ratio of nitrification (LN) increased substantially 425
in the urine treatment compared to the water control. More specifically, the simulated 426
urine deposition lead to a 9-fold increase of the nitrification rate and calculated on soil 427
weight basis the rate corresponded to 6.3 ± 0.3 μg N g-1 soil d-1. Studies reporting gross 428
nitrification rates in urine-affected soil are very rare. For comparison, however, gross 429
nitrification was measured to be 2.4 μg N g-1 soil d-1 in a laboratory study on soil at 50% 430
WFPS and fertilized with 20 g N m-2 (Bateman and Baggs, 2005). Application of urine 431
in the field at rates below 53 g N m-2 has been seen to inhibit nitrification for 2-14 d, 432
possibly as a result of microbial stress (Thomas et al., 1988; Bol et al. 2004). Monaghan 433
and Barraclough (1992) found that inhibition of nitrification due to NH3(aq) toxicity and 434
salt-induced stress only occurred when the urine-N concentration exceed 16 g N l-1. 435
Thus, the urine-N concentration of 15.6 g N l-1 in the present study may explain why the 436
nitrifying bacteria were not adversely affected in the urine-treated soil. 437
The increased NH4+ availability was most likely a part of the reason for the 438
higher nitrification rate in the urine treatment than in the water control. Furthermore, 439
soil pHH2O rose from 7.9 in the water control to 8.3 in the urine treatment because of the 440
alkaline products formed during the hydrolysis of urea. A recent field study 441
demonstrated that the rate of nitrification increased with soil pHH2O in the range from 6 442
to 8, which supported indications found in earlier studies (Kyveryga et al., 2004). 443
Hence, the higher soil pH in the urine treatment could be part of the reason for the 444
increased nitrification rate, indicating that the higher soil pH, in part, caused the greater 445
N2O loss from nitrification. In line with this, Yoshida and Alexander (1970) showed 446
20
that the N2O production by an ammonia-oxidizing bacterium strongly increased when 447
pH was raised from 6 to 8. 448
In well-aerated soils, the N2O loss ratio of nitrification is usually below 0.5% 449
(Ambus, 2005; Mathieu et al. 2006). In the second experiment, the ratio seemed to 450
increase from 0.02% in the water control to 0.29% in the urine-treated soil. To my 451
knowledge this is the first time the N2O loss ratio of nitrification has been determined in 452
urine patches. In the study of Bateman and Baggs (2005), which was conducted at 453
equivalent soil water content (50% WFPS) but with lower N addition (20 g N m-2 as 454
NH4NO3), the N2O loss ratio of nitrification was determined to be 0.18%. A study on 455
pure cultures of an ammonia-oxidizing bacterium showed that the N2O loss ratio rose 456
with increasing NH4+ concentration up to about 1 g NH4-N l-1 (Yoshida and Alexander, 457
1970). Thus, the gradual increase in the N2O loss ratio of nitrification from the water 458
control via the study of Bateman and Baggs (2005) to the urine treatment may relate to 459
the increase in NH4+ availability. 460
The hypothesis for denitrification was that the N2O loss from the process would 461
increase solely as a result of an increase in the rate of the process (D). The N2O loss 462
ratio of denitrification was predicted to decline. This hypothesis also turned out only to 463
be partly right as both the denitrification rate (D) and the N2O loss ratio of 464
denitrification (LD) appeared to increase in the urine treatment compared to the water 465
control. Calculated as diurnal value, denitrification in the 0-10 cm soil layer constituted 466
49 ± 10 mg N m-2 d-1. This rather low rate was expected as high rates of denitrification 467
are usually associated with soil water contents above 60% WFPS (Davidson, 1991; De 468
Klein and Van Logtestijn, 1996). The rate is in the same order of magnitude at rates 469
measured by Koops et al. (1997) in urine patches on peat soil. 470

21
The denitrification rate in the urine treatment was stimulated by the enhanced 471
supply of NO3- from nitrification and possibly also by the higher pH and the increased 472
soil content of DOC (Weier et al., 1993; Simek and Cooper, 2002). The organic 473
compounds in the added urine largely explained the observed rise of DOC in the urine 474
treatment, thus there was no evidence for release of DOC due to root scorching or 475
solubilization of soil organic C as observed in some studies (e.g. Monaghan and 476
Barraclough, 1993; Shand et al., 2002). 477
A recent study showed that the hippuric acid component of urine inhibited 478
denitrification via the breakdown product benzonic acid, and thereby decreased the N2O 479
emission (Van Groenigen et al., 2006). However, the denitrifying activity was only 480
affected when the concentration of hippuric acid exceeded 3.9 mmol kg-1 soil. These 481
findings are supported by the present study where a hippuric acid content of 3.4 mmol 482
kg-1 soil in the 0-5 cm layer did not seem to hinder denitrification. 483
The N2O loss ratio of denitrification appeared to increase from 0.9% in the water 484
control to 5.1% in the urine treatment. When denitrifying bacteria have much greater 485
access to oxidant than to reductant they tend to reduce nitrogen oxide incompletely, 486
resulting in a high N2O/N2 ratio of end products (Hutchinson and Davidson, 1993; 487
Weier et al., 1993). Hence, the higher N2O loss ratio of denitrification in the urine 488
treatment compared to the water control might be a result of increased NO3-/DOC ratio 489
(Fig. 2). The measured N2O loss ratio of denitrification in the urine treatment is much 490
lower than ratios, which can be calculated from the data presented by De Klein and Van 491
Logtestijn (1994), giving N2O loss ratios during denitrification of 54 and 80% following 492
application of 40 g urine-N m-2. However, my ratio is with in the range of 4 and 27% 493

22
reported for ryegrass swards fertilized with about 300 kg N ha-1 (Kester et al., 1997; 494
Stevens and Laughlin, 1998). 495
496
4.2. Effect of soil moisture on the N2O production 497
The rise in the soil water content between the two experiments enabled an 498
evaluation of the effect of soil moisture on the N2O production via nitrification and 499
denitrification based on the results for the water treatment. The soil water content 500
increased from about 35% WFPS in the first experiment to about 45% WFPS in the 501
second experiment (Fig. 1). The net emission of N2O from the water treatment rose 502
between the two experiments, which seemed to be a result of increased denitrification 503
rate (Fig. 3; Table 5). Presence of O2 is most often the limiting factor for denitrification 504
(Tiedje, 1988; Robertson, 1989), and the increased rate was probably caused by the 505
more frequent occurrence of anaerobic microsites following the rise in WFPS. 506
In most cases the measured N2O formation via NO3- reduction was probably due 507
to denitrification. Furthermore, the 15N data indicated that DNRA possibly occurred in 508
the water treatment (Table 4) and therefore this process could have produced a part of 509
the N2O originating from NO3-. Occurrence of DNRA was also reported in a study on 510
soil from permanent grassland (Stevens et al., 1998). The N2O loss ratio for 511
denitrification in the water treatment appeared to be highest in the first experiment 512
(Table 5), which is in line with Tiedje (1988) stating that the N2O/N2 ratio generally 513
increases with increasing O2 concentrations. 514
The rate of nitrification dropped as the soil water content increased from 35 and 515
45% WFPS. This is contrary to the study of Grundmann et al. (1995), where maximum 516
nitrification rate in a sandy loam soil was found at 50% WFPS. The N2O loss ratio of 517

23
the process appeared to increase slightly (Table 5), leading to an unchanged N2O loss 518
from nitrification (Fig. 3). 519
At 35% WFPS during the first experiment, simultaneous emission and 520
consumption of N2O by the soil sometimes took place, e.g. in the water/15NH4+ 521
treatment emission of 15N labelled N2O was detected without net N2O emission (Table 522
3). In some cases the soil acted as a net sink of atmospheric N2O (e.g. Fig. 5A), which 523
was also observed in other studies on grassland (Glatzel and Stahr, 2001; Wrage et al., 524
2004a). The responsible process for the reduction of N2O could be denitrification, 525
nitrifier denitrification or DNRA (Poth, 1986; Conrad, 1996). 526
527
4.3. Effect of ammonium on the N2O production 528
Application of an ammonium solution (52.9 g N m-2) to the pasture soil at about 529
35% WFPS resulted in a rather low N2O emission of 6.1 μg N2O-N m-2 h-1, which was 530
primarily formed during nitrification (Fig. 3, 5). The rate of nitrification seemed to be 531
low as no NO3- accumulation was detected, although the denitrification rate was minor 532
(Table 2, 5). In many ways the results for the ammonium treatment deviated from the 533
results obtained in the urine treatment during the second experiment. The retarded 534
processes in the ammonium treatment could relate to the lower soil water content, the 535
lower pHH2O of 7.4 and a slightly lower osmotic potential compared to the urine 536
treatment. 537
538
4.4. Conclusions 539
Nitrification and denitrification contributed equally to the enhanced N2O 540
emission from the simulated urine patches and the N2O loss was caused by a 541

24
combination of higher rates and higher loss ratios of the processes. The study shows that 542
even though denitrification rates are low at soil water contents under 60% WFPS, the 543
process may account for a considerable part of the N2O produced in urine patches 544
deposited on these soils. The nitrification rate was stimulated by the high NH4+ 545
availability and possibly also by the increased soil pH following urea hydrolysis. In 546
itself a high nitrification rate does lead to raised N2O losses, and furthermore, it enables 547
denitrification with associated N2O losses. Based on the present study, an increased 548
nitrification rate therefore appears to be the most important factor explaining the high 549
initial N2O emission from urine patches deposited on well-aerated soils. The study 550
delivers new information on the mechanisms responsible for the N2O formation in urine 551
patches, and the results are suitable for incorporation into process-based modelling of 552
N2O emissions from grazed grasslands. 553
554
Acknowledgements 555
This work was funded by the Danish Research Centre for Organic Farming 556
(DARCOF) and the Danish Agricultural and Veterinary Research Council. I wish to 557
thank Dr. Per Ambus for his qualified advice, Liselotte Meltofte for her assistance with 558
the 15N diffusion as well as Dr. Sten Struwe, Dr. Finn P. Vinther and Jane Hansen for 559
their valuable comments on the manuscript. 560
561
References 562
Allen, A.G., Jarvis, S.C., Headon, D.M., 1996. Nitrous oxide emissions from soils due 563
to inputs of nitrogen from excreta return by livestock on grazed grassland in the 564
U.K. Soil Biology & Biochemistry 28, 597-607. 565

25
Ambus, P., 2005. Relationship between gross nitrogen cycling and nitrous oxide 566
emission in grass-clover pasture. Nutrient Cycling in Agroecosystems 72, 189-199. 567
Ambus, P., Christensen, S., 1993. Denitrification variability and control in a riparian fen 568
irrigated with agricultural drainage water. Soil Biology & Biochemistry 25, 915-569
923. 570
Bateman, E.J., Baggs, E.M., 2005. Contribution of nitrification and denitrification to 571
N2O emissions from soils at different water-filled pore space. Biology and Fertility 572
of Soils 41, 379-388. 573
Bergsma, T.T., Bergsma, Q.B.C., Ostrom, N.E., Robertson, G.P., 1999. A heuristic 574
model for the calculation of dinitogen and nitrous oxide flux from nitrogen-15-575
labeled soil. Soil Science Society of America Journal 63, 1709-1716. 576
Bol, R., Petersen, S.O., Christofides, C., Dittert, K., Hansen, M.N., 2004. Short-term 577
N2O, CO2, NH3 fluxes, and N/C transfers in a Danish grass-clover pasture after 578
simulated urine deposition in autumn. Journal of Plant Nutrition and Soil Science 579
167, 568-576. 580
Clough, T.J., Kelliher, F.M., Sherlock, R.R., Ford, C.D., 2004. Lime and soil moisture 581
effects on nitrous oxide emissions from a urine patch. Soil Science Society of 582
America Journal 68, 1600-1609. 583
Clough, T.J., Ledgard, S.F., Sprosen, M.S., Kear, M.J., 1998. Fate of 15N labelled urine 584
on four soil types. Plant and Soil 199, 195-203. 585
Conrad, R., 1996. Soil microorganisms as controllers of atmospheric trace gases (H2, 586
CO, CH4, OCS, N2O, and NO). Microbiological Reviews 60, 609-640. 587

26
Crutzen, P.J., 1981. Atmospheric chemical processes of the oxides of nitrogen, 588
including nitrous oxide. In: Delwiche,C.C. (Ed.), Denitrification, Nitrification and 589
Atmospheric Nitrous Oxide. John Wiley & Sons, Chichester, pp. 7-44. 590
CWB, 2003. Agroclimate in Taastrup. Dept. of Agric. Sciences, Section of Env. Res. 591
and Tech., Roy. Vet. and Agric. Univ. Copenhagen. 592
Davidson, E.A., 1991. Fluxes of nitrous oxide and nitric oxide from terrestrial 593
ecosystems. In: Rogers, J.E., Whitman, W.B. (Eds.), Microbial Production and 594
Consumption of Greenhouse Gases: Methan, Nitrogen Oxides, and Halomethanes. 595
American Society for Microbiology, Washington, DC, pp. 219-235. 596
De Klein, C.A.M., Van Logtestijn, R.S.P., 1994. Denitrification and N2O emission from 597
urine-affected grassland soil. Plant and Soil 163, 235-242. 598
De Klein, C.A.M., Van Logtestijn, R.S.P., 1996. Denitrification in grassland soils in 599
The Netherlands in relation to irrigation, N-application rate, soil water content and 600
soil temperature. Soil Biology & Biochemistry 28, 231-237. 601
EEA, 2006. Annual European Community greenhouse gas inventory 1990-2004 and 602
inventory report 2006. Technical report No 6. European Environment Agency, 603
Copenhagen, 429 pp. 604
FAO, 2004. FAO Statistical Databases [online]. Available: http://faostat.fao.org 605
[05/10/05]. 606
Firestone, M.K., Davidson, E.A., 1989. Microbiological basis of NO and N2O 607
production and consumption in soil. In: Andreae, M.O., Schimel, D.S. (Eds.), 608
Exchange of Trace Gases between Terrestrial Ecosystems and the Atmosphere. 609
John Wiley & Sons, Chichester, pp. 7-21. 610

27
Glatzel, S., Stahr, K., 2001. Methane and nitrous oxide exchange in differently fertilised 611
grassland in southern Germany. Plant and Soil 231, 21-35. 612
Granli, T., Bøckmann, O.C., 1994. Nitrous oxide from agriculture. Norwegian Journal 613
of Agricultural Sciences, Supplement 12, 128 pp. 614
Grundmann, G.L., Renault, P., Rosso, L., Bardin, R., 1995. Differential effects of soil 615
water content and temperature on nitrification and aeration. Soil Science Society of 616
America Journal 59, 1342-1349. 617
Harada, T., Kai, H., 1968. Studies on the environmental conditions controlling 618
nitrification in soil. Soil Science and Plant Nutrition 14, 20-26. 619
Hutchinson, G.L., Davidson, E.A., 1993. Processes for production and consumption of 620
gaseous nitrogen oxides in soil. In: Harper, L.A., et al. (Eds.), Agricultural 621
Ecosystem Effects on Trace Gases and Global Climate Change. American Society 622
of Agronomy, Madison, Wisconsin, pp. 79-93. 623
IPCC, 2001. Climate Change 2001: The Scientific Basis. Contribution of Working 624
Group I to the Third Assessment Report of the Intergovernmental Panel on Climate 625
Change. Houghton, J.T., et al. (Eds.), Cambridge University Press, Cambridge, 881 626
pp. 627
Kester, R.A., Meijer, M.E., Libochant, J.A., De Boer, W., Laanbroek, H.J., 1997. 628
Contribution of nitrification and denitrification to the NO and N2O emissions of an 629
acid forest soil, a river sediment and a fertilized grassland soil. Soil Biology & 630
Biochemistry 29, 1655-1664. 631
Koops, J.G., Van Beusichem, M.L., Oenema, O., 1997. Nitrous oxide production, its 632
source and distribution in urine patches on grassland on peat soil. Plant and Soil 633
191, 57-65. 634

28
Kyveryga, P.M., Blackmer, A.M., Ellsworth, J.W., Isla, R., 2004. Soil pH effects on 635
nitrification of fall-applied anhydrous ammonia. Soil Science Society of America 636
Journal 68, 545-551. 637
Mathieu, O., Hénault, C., Lévêque, J., Baujard, E., Milloux, M.-J., Andreux, F., 2006. 638
Quantifying the contribution of nitrification and denitrification to the nitrous oxide 639
flux using 15N tracers. Environmental Pollution 144, 933-940. 640
Monaghan, R.M., Barraclough, D., 1992. Some chemical and physical factors affecting 641
the rate and dynamics of nitrification in urine-affected soil. Plant and Soil 143, 11-642
18. 643
Monaghan, R.M., Barraclough, D., 1993. Nitrous oxide and dinitrogen emissions from 644
urine-affected soil under controlled conditions. Plant and Soil 151, 127-138. 645
Mosier, A.R., Schimel, D.S., 1993. Nitrification and denitrification. In: Knowles, R., 646
Blackburn, T.H. (Eds.), Nitrogen Isotope Techniques. Academic Press, London, pp. 647
181-208. 648
Okereke, G.U., 1984. Prevalence of nitrous oxide reducing capacity in denitrifiers from 649
a variety of habitats. Plant and Soil 81, 421-428. 650
Panek, J.A., Matson, P.A., Ortiz-Monasterio, I., Brooks, P., 2000. Distinguishing 651
nitrification and denitrification sources of N2O in a Mexican wheat system using 652
15N. Ecological Applications 10, 506-514. 653
Petersen, S.O., Stamatiadis, S., Christofides, C., 2004. Short-term nitrous oxide 654
emissions from pasture soil as influenced by urea level and soil nitrate. Plant and 655
Soil 267, 117-127. 656
Poth, M., 1986. Dinitrogen production from nitrate by a Nitrosomonas isolate. Applied 657
and Environmental Microbiology 52, 957-959. 658
29
Robertson, G.P., 1989. Nitrification and denitrification in humid tropical ecosystems: 659
potential controls on nitrogen retention. In: Procter, J. (Ed.), Mineral Nutrients in 660
Tropical Forest and Savanna Ecosystems. Blackwell Scientific, Oxford, pp. 55-69. 661
Ryden, J.C., Skinner, J., Nixon, D.J., 1987. Soil core incubation system for the field 662
measurement of denitrification using acetylene-inhibition. Soil Biology & 663
Biochemistry 19, 753-757. 664
SAS Institute, 1997. SAS/STAT users guide, release 6.12. Statistical Analysis Systems 665
Institute, Cary. 666
Schmidt, E.L., 1982. Nitrification in soil. In: Stevenson, F.J. (Ed.), Nitrogen in 667
Agricultural Soils. American Society of Agronomy, Madison, Wisconsin, pp. 253-668
288. 669
Shand, C.A., Williams, B.L., Dawson, L.A., Smith, S., Young, M.E., 2002. Sheep urine 670
affects soil solution nutrient composition and roots: differences between field and 671
sward box soils and the effects of synthetic and natural sheep urine. Soil Biology & 672
Biochemistry 34, 163-171. 673
Sherlock, R.R., Goh, K.M., 1983. Initial emission of nitrous oxide from sheep urine 674
applied to pasture soil. Soil Biology & Biochemistry 15, 615-617. 675
Simek, M., Cooper, J.E., 2002. The influence of soil pH on denitrification: progress 676
towards the understanding of this interaction over the last 50 years. European 677
Journal of Soil Science 53, 345-354. 678
Sørensen, P., Jensen, E.S., 1991. Sequential diffusion of ammonium and nitrate from 679
soil extracts to a polytetrafluoroethylene trap for 15N determination. Analytical 680
Chimica Acta 252, 201-203. 681

30
Stevens, R.J., Laughlin, R.J., 1998. Measurement of nitrous oxide and di-nitrogen 682
emissions from agricultural soils. Nutrient Cycling in Agroecosystems 52, 131-139. 683
Stevens, R.J., Laughlin, R.J., Burns, L.C., Arah, J.R.M., Hood, R.C., 1997. Measuring 684
the contributions of nitrification and denitrification to the flux of nitrous oxide from 685
soil. Soil Biology & Biochemistry 29, 139-151. 686
Stevens, R.J., Laughlin, R.J., Malone, J.P., 1998. Soil pH affects the processes reducing 687
nitrate to nitrous oxide and di-nitrogen. Soil Biology & Biochemistry 30, 1119-688
1126. 689
Thomas, R.J., Logan, K.A.B., Ironside, A.D., Bolton, G.R., 1988. Transformations and 690
fate of sheep urine-N applied to an upland UK pasture at different times during the 691
growing season. Plant and Soil 107, 173-181. 692
Tiedje, J.M., 1988. Ecology of denitrification and dissimilatory nitrate reduction to 693
ammonium. In: Zehnder, A.J.B. (Ed.), Biology of Anaerobic Microorganisms. John 694
Wiley & Sons, Chichester, pp. 179-244. 695
Van Groenigen, J.W., Palermo, V., Kool, D.M., Kuikman, P.J., 2006. Inhibition of 696
denitrification and N2O emission by urine-derived benzoic and hippuric acid. Soil 697
Biology & Biochemistry 38, 2499-2502. 698
Weier, K.L., Doran, J.W., Power, J.F., Walters, D.T., 1993. Denitrification and the 699
dinitrogen/nitrous oxide ratio as affected by soil water, available carbon, and 700
nitrate. Soil Science Society of America Journal 57, 66-72. 701
Whitehead, D.C., Lockyer, D.R., Raistrick, N., 1989. Volatilization of ammonia from 702
urea applied to soil: Influence of hippuric acid and other constituents of livestock 703
urine. Soil Biology & Biochemistry 21, 803-808. 704

31
Williams, D.L.1., Ineson, P., Cowards, P.A., 1999. Temporal variations in nitrous oxide 705
fluxes from urine-affected grassland. Soil Biology & Biochemistry 31, 779-788. 706
Wrage, N., Velthof, G.L., Van Beusichem, M.L., Oenema, O., 2001. Role of nitrifier 707
denitrification in the production of nitrous oxide. Soil Biology & Biochemistry 33, 708
1723-1732. 709
Wrage, N., Lauf, J., Del Prado, A., Pinto, M., Pietrzak, S., Yamulki, S., Oenema, O., 710
Gebauer, G., 2004a. Distinguishing sources of N2O in European grasslands by 711
stable isotope analysis. Rapid Communications in Mass Spectrometry 18, 1201-712
1207. 713
Wrage, N., Velthof, G.L., Laanbroek, H.J., Oenema, O., 2004b. Nitrous oxide 714
production in grassland soils: assessing the contribution of nitrifier denitrification. 715
Soil Biology & Biochemistry 36, 229-236. 716
Yamulki, S., Jarvis, S.C., Owen, P., 1998. Nitrous oxide emissions from excreta applied 717
in a simulated grazing pattern. Soil Biology & Biochemistry 30, 491-500. 718
Yoshida, T., Alexander, M., 1970. Nitrous oxide formation by Nitrosomonas europaea 719
and heterotrophic microorganisms. Soil Science Society of America Proceedings 34, 720
880-882. 721
32
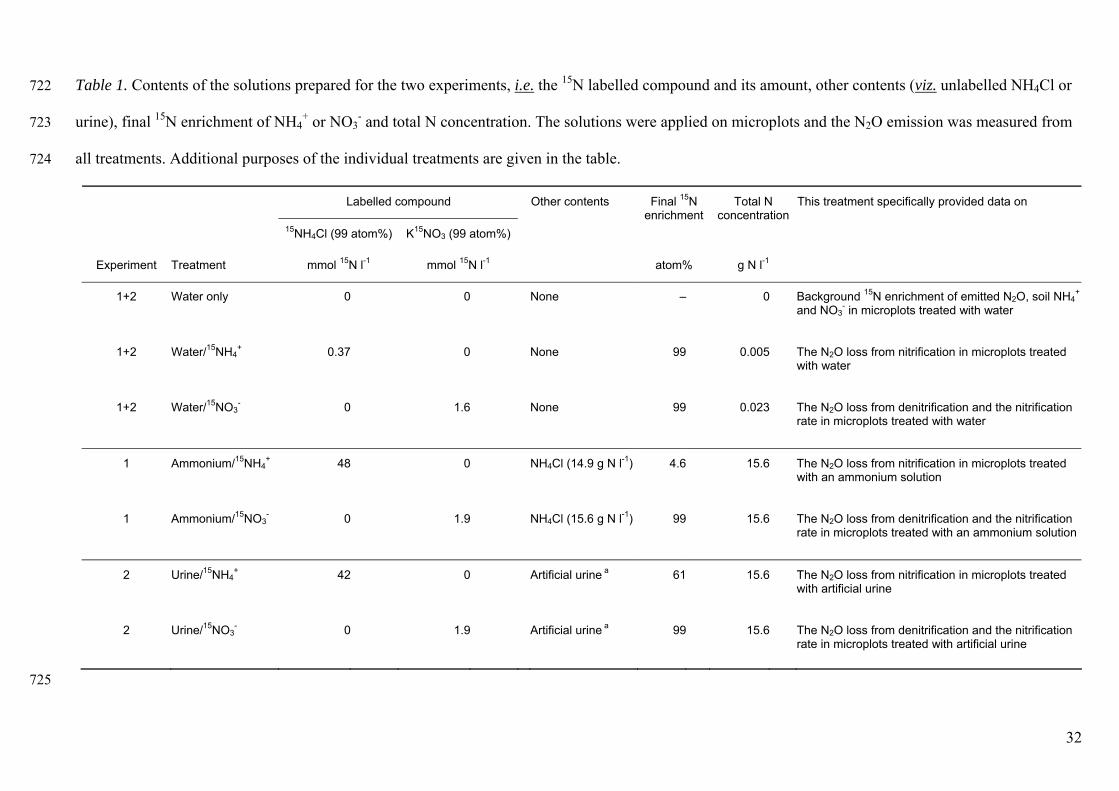
Table 1. Contents of the solutions prepared for the two experiments, i.e. the 15N labelled compound and its amount, other contents (viz. unlabelled NH4Cl or 722
urine), final 15N enrichment of NH4+ or NO3
- and total N concentration. The solutions were applied on microplots and the N2O emission was measured from 723
all treatments. Additional purposes of the individual treatments are given in the table. 724
Labelled compound Other contents This treatment specifically provided data on
15NH4Cl (99 atom%) K15NO3 (99 atom%)
Final 15N enrichment
Total N concentration
Experiment Treatment mmol 15N l-1 mmol 15N l-1 atom% g N l-1
1+2 Water only 0 0 None – 0 Background 15N enrichment of emitted N2O, soil NH4+
and NO3- in microplots treated with water
1+2 Water/15NH4+ 0.37 0 None 99 0.005 The N2O loss from nitrification in microplots treated
with water
1+2 Water/15NO3- 0 1.6 None 99 0.023 The N2O loss from denitrification and the nitrification
rate in microplots treated with water
1 Ammonium/15NH4+ 48 0 NH4Cl (14.9 g N l-1) 4.6 15.6 The N2O loss from nitrification in microplots treated
with an ammonium solution
1 Ammonium/15NO3- 0 1.9 NH4Cl (15.6 g N l-1) 99 15.6 The N2O loss from denitrification and the nitrification
rate in microplots treated with an ammonium solution
2 Urine/15NH4+ 42 0 Artificial urine a 61 15.6 The N2O loss from nitrification in microplots treated
with artificial urine
2 Urine/15NO3- 0 1.9 Artificial urine a 99 15.6 The N2O loss from denitrification and the nitrification
rate in microplots treated with artificial urine
725

33
a Consisting of urea (28.5 g l-1), hippuric acid (11.9 g l-1), creatinine (0.3 g l-1), allantoin (0.6 g l-1), uric acid (0.2 g l-1), NH4Cl (adjusted to make a total 726
concentration of 1.4 g l-1), KHCO3 (22.9 g l-1) and KCl (16.9 g l-1) 727

34
Table 2. Content of soil NH4+ and NO3
- (g N m-2) in the 0-10 cm soil layer of the 728
microplots determined about 5 and 31 h after application of water, ammonium solution 729
and urine; n = 4-12, means and SE (in brackets). 730
5 h after application 31 h after application
Experiment Treatment NH4+ NO3
- NH4+ NO3
-
1 Water 0.29 (0.03) 0.14(0.01) 0.47 (0.06) 0.12 (0.00)
1 Ammonium 54.94 (4.72) 0.14(0.04) 57.75 (5.35) 0.09 (0.01)
2 Water 0.19 (0.03) 0.11(0.01) 0.27 (0.03) 0.08 (0.02)
2 Urine 39.09 (1.91) 0.24 (0.04) 28.15 (2.12) 1.05 (0.05) 731

35
Table 3. Net N2O emission and final 15N enrichment of headspace N2O for all 732
treatments measured in microplots; n = 1-4, means and SE (in brackets). 733
Net N2O emission 15N enrichment of headspace N2O
Experiment Treatment μg N2O-N m-2 h-1 atom%
1 Water only 0 (0) 0.3694 (0.0008)
1 Water/15NH4+ 0 (ND) 0.5651 (0.0132)
1 Water/15NO3- 1.8 (1.5) 0.9266 (0.2275)
1 Ammonium/15NH4+ 5.5 (1.8) 1.4005 (0.0943)
1 Ammonium/15NO3- 6.5 (2.2) 3.4536 (0.6615)
2 Water only 3.6 (0.9) 0.3676 (0.0005)
2 Water/15NH4+ 3.3 (0.4) 0.5881 (0.0545)
2 Water/15NO3- 5.0 (0.4) 2.2738 (0.6671)
2 Urine/15NH4+ 38.5 (4.8) 5.0307 (0.4215)
2 Urine/15NO3- 46.1 (2.6) 34.0064 (0.9668)
734
The treatments are described in Table 1.735

36
Table 4. Nitrogen-15 enrichment of soil NH4+ and NO3
- (atom% excess) in the 0-10 cm 736
soil layer measured about 5 and 31 h after application of water, ammonium solution or 737
urine labelled with 15NH4+ or 15NO3
-, n = 1-4, means and SE (in brackets). 738
5 h after application 31 h after application
Experiment Treatment 15NH4+ 15NO3
- 15NH4+ 15NO3
-
1 Water/15NH4+ 0.2631 (ND) 0.7915 (ND) ND ND
1 Ammonium/15NH4+ 4.6710 (0.0277) 0 (ND) ND ND
2 Water/15NH4+ 0.2908 (ND) 0.8711 (ND) ND ND
2 Urine/15NH4+ 5.3603 (0.1208) 0 (ND) ND ND
1 Water/15NO3- 0.6058 (0.0337) 9.5903 (ND) 1.0128 (0.1005) 2.4571 (ND)
1 Ammonium/15NO3- 0.0053 (0.0012) 2.7122 (ND) 0.0117 (0.0014) 3.2492 (ND)
2 Water/15NO3- 0.7360 (ND) 3.8859 (ND) 0.5722 (ND) 1.1632 (ND)
2 Urine/15NO3- 0.0336 (0.0022) 2.0624 (0.1477) 0.0414 (0.0048) 0.1059 (0.0537)
739

37
Table 5. Rates of gross nitrification and denitrification, moles of N2O-N lost per moles 740
of NO3- produced via nitrification (LN) and moles of N2O lost per moles of N2 + N2O 741
produced via denitrification (LD) in the 0-2 cm soil layer of microplots treated with 742
water, ammonium solution and urine; n = 4, means and SE (in brackets). 743
Gross nitrification LN Denitrification LD
Experiment Treatment mg NO3-N m-2 h-1 % μg N m-2 h-1 %
1 Water 1.3 (0.1) 0.01 0.60 (0.37) 26
1 Ammonium ND ND 0 (ND) ND
2 Water 0.8 (0.1) 0.02 62 (16) 0.9
2 Urine 6.9 (0.3) 0.29 412 (81) 5.1 744
38
Figure captions 745
746
Figure 1. Summed rainfall and irrigation (mm) as well as water-filled pore space in the 747
0-10 cm soil layer (%; n = 4, means ± SE) during the experimental period. 748
749
Figure 2. Soil content of dissolved organic carbon (DOC) and the NO3-/DOC ratio in 750
the 0-10 cm soil layer of microplots treated with water, ammonium solution and urine; n 751
= 4; means ± SE. 752
753
Figure 3. Net N2O emission (n = 6-12) as well as N2O derived from oxidation of NH4+ 754
in the 0-2 cm soil layer determined in 15NH4+ labelled microplots (n = 4) and N2O 755
derived from reduction of NO3- in the 0-2 cm soil layer determined in 15NO3
- labelled 756
microplots (n = 4) for the water, ammonium and urine treatment; means ± SE. Please, 757
note the break on the y-axis. 758
759
Figure 4. Calculated 15N enrichment of soil NH4+ and NO3
- in the 0-2 cm soil layer as 760
well as measured 15N enrichment of emitted N2O (n = 4, means ± SE) in microplots 761
treated with water, ammonium solution or urine labelled with (A) 15NH4+ or (B) 15NO3
-. 762
763
Figure 5. Headspace concentration of N2O in four glass jars during control or acetylene 764
incubation of soil cores taken during the first experiment from microplots treated with 765
(A, B) water or (C, D) ammonium solution; n = 1. 766