Embed Size (px)
Citation preview

COUPLING NITRIFICATION AND DENITRIFICATION
IN MIXED ATTACHED FILM AERATED
EXPANDED BED SYSTEM
By
WEIPING XIAO (HSIAO)
Bachelor of Engineering
Dalian Institute of Light Industry
Dalian, P.R.China
1982
Subm1tted to the Faculty of the Graduate College of the
Oklahoma State University 1n partial fulflllment of
the requirements for the Degree of
MASTER OF SCIENCE December, 1992

' J\

COUPLING NITRIFICATION AND DENITRIFICATION
IN MIXED ATTACHED FILM AERATED
EXPANDED BED SYSTEM
Thesis A/Jroved:
~c~ Thes1s Adv1sor
-~a:~----
Dean of the Graduate College
ii

ACKNOWLEDGEMENTS
I w1sh to express my s1ncere grat1tude to Dr. W1ll1am
W. Clarkson, my pr1ncipal advisor, for the intelligent
1nsp1rat1on and f1nanc1al a1d he has g1ven me dur1ng my
graduate studies at Oklahoma State University. He has been
a constant source of gu1dance and understanding throughout
th1s research proJect. In fact, the 1ncentive of th1s
research was d1rectly kindled by and based on the research
work of Dr. Clarkson and his former graduate students.
Spec1al thanks go to Drs. John N. Veenstra and Gregory
G. Wilber for the1r participation in my advisory comm1ttee,
for the1r help dur1ng my exper1ment, and for the1r 1nstruc
t1ons 1n the graduate courses. I would like to thank my
fellow students Feiyun Zeng, Zhihuai Xue, Gee Bong Han,
Xuefeng Deng and Jingshl Wu for the1r discussion and help
dur1ng my study and research at Oklahoma State Un1vers1ty.
A s1ncere thank you goes to my uncle Jlan-min Hs1ao and
h1s fam1ly for the1r constant encouragement and both moral
and financial support during my study in the United States
of Amer1ca. I would l1ke to ded1cate th1s thes1s to my
parents An-mln Hsiao and Wan-qing Wu, and my brothers We1guo
Hs1ao, Weij1 Hs1ao, my s1ster We1y1 Hs1ao and their families
in China. Without their continual love, encouragement and
understanding, this thesis would not have been possible.
iii

TABLE OF CONTENTS
Chapter Page
I. INTRODUCTION 1
1.1 1.2
Development of this Research . . ObJect1ves of this Research
1 3
II. LITERATURE REVIEW 5
2.1 2.2
2.3 2.4
2.5 2.6
Scope of Review 5 Microbiology of n1tr1f1cat1on and
Den1tri£1cation . . . . . . . • . • . • 5 Stoichiometric Relationsh1ps . . . . . 10 Factors Affect1ng Nitr1f1cat1on and
Den1trification . . . . . . . . . . 12 2.4.1 Effects of Temperature .... 12 2.4.2 Effects of Other Substrate 12 2.4.3 Effects of Other Substances .. 13 2.4.4 Effects of D1ssolved oxygen .. 14
Aerob1c Expanded Bed . . . . . . . . . . . 15 Coupl1ng N1tr1ficat1on and Den1tr1f1cat1on 16
2.6.1 Different Approaches ..... 16 2.6.2 MAFAEB Development . . . . 20
III. MATERIALS AND METHODS . . . . 24
3.1 Exper1mental Apparatus . . ...... 24 3.2 Feed Solution . . . . . 26 3. 3 Start-up Procedure . . . . . . 29 3.4 Ana1ys1s Techniques .. 30
3.4.1 Ammonia Nitrogen . 30 3.4.2 Nitr1te and N1trate . . 31 3.4.3 Chem1cal Oxygen Demand .. 31 3.4.4 Total Suspended Solids .... 31 3.4.5 Volatile Suspended Solids ... 31 3.4.6 Attached B1omass ....... 32 3 • 4 • 7 pH • • • • • • • • • • • • • • 3 3 3.4.8 Alkalinity . . . . . . . . 33 3.4.9 Dissolved Oxygen ....... 33
3.5 Sampling and Implementation Timeline ..• 34
IV. EXPERIMENTAL APPROACHES AND RESULTS . 37
4.1 Development of Autotrophic and Heterotrophic Denitr1f1ers in Mixed Attached Films .. 37
iv

,:...>.- -i'
Chapter Page
4.2 Nitr-ificat1on with MAFAEB System . . . . 39 4.3 Den1trif1cat1on w1th Mixed Attached F1lms 42 4.4 Coupl1ng React1on with MAFAEB System ... 43
4.4.1 Coupl1ng Reaction w1th Methanol and Th1osulfate as Electron Donors . . • • . . . • • 43
4.4.2 Alternative Aerobic and Anaerobic Coupl1ng React1on ...... 46
4.4.3 Coupling React1on w1th Acetate and Thiosulfate as Electron Donors . . • . . . . . . . . 47
4.4.4 Coupling React1on with Thiosulfate as Electron Donor . • 53
4.4.5 Coupl1ng Reaction w1th Acetate as Electron Donor . . . . . . 53
4.5 N1tr1f1cat1on recovery 1n MAFAEB System . 64
V. DISCUSSION ..... . . 66
5.1 S1multaneous Growth of Autotrophic and Heterotrophic Denitrifiers . . . 66
5.2 Nitrification with MAFAEB System . . . . . 66 5.3 Denitrification w1th MAFAEB System . . . 67 5.4 Alternating Aeration for coupling
reaction . . . . . . . . . . . . 69 5.5 Inhibition Effects . . . . . . . . 69 5.6 DO Effects . . . . . . . . . . . . . . 70 5.7 Contamination Effects . . . . . . . . 71 5.8 Alkalinity and COD Consumpt1on . . . . . . 72
VI. CONCLUSIONS . 74
VII. SIGNIFICANCE OF THE STUDY . 77
VIII. FURTHER RESEARCH NEEDS . 79
8.1
8.2
8.3
8.4 8.5
REFERENCES
Coupl1ng React1on 1n a Str1ctly Controlled Low DO MAFAEB System . . . . 79
Coupling React1ons at Elevated Temperatures • . . . . . . . . . . . . . 79
The Maximum Loading Rate for Denitrification with MAFAEB without Aeration . 80
N1tr1f1cation Wlth MAFAEB System . . . 80 Other Poss1ble usages of the MAFAEB
system . • . . . . . . . . . . . 81
. . 82
APPENDIX - Two Population T-Test for Nitrificat1on Efficiency an Nitrogen Removal Rate at Different DO concentrations . . . . . . . . . 85
v

LIST OF TABLES
Table Page
I. Compos1t1on of 250 mg NH4•-NJL Feed Solut1on • 27
II. Composition of 500 mg Noo--N/L Feed Solution • 27
I I I. Composition of 500 mg No::;)--N + NQ.:;;.--N/L Feed solution . . . . . . . . . . . . . . . . . 27
IV. Composition of coupling Reaction Feed Solution ( 1) . . . . . . . . . . . . . . . . . . 28
v. Composition of Coupling Reaction Feed Solution ( 2 ) . . . . . . . . . . . . . . . . . . 28
VI. Composition of Coupling Reaction Feed Solution ( 3 ) . . . . . . . . . . . . . . . . . . 29
VII. Test Conditions and Results of Energy Sources for Mixed Den1trification ....... 38
VIII. N1trificat1on Wlth MAFAEB System constant loading rate . . . .
IX. Nitrification with MAFAEB System constant HRT . . . . . . . . .
X. Denitrification w1th MAFAEB-same HRT,
• • • 3 9
• • • 4 2
w1thout Aerat1on ................ 43
XI. Coupling Reaction w1th Methanol and Thiosulfate as Electron Donors • . . . . . • 46
XII. Comparison of Alternating Aeration with Low DO Coupling Reaction Pattern . . . . . . . . 47
XIII. Coupling Reaction with Sodium Th1osulfate and Sodium Acetate as Electron Donors ..... 49
XIV. Coupling Reaction with Sodium Thiosulfate as Electron Donor . . . . • • • . . . . . . 53
XV. Coupling Reaction with Sodium Acetate as Electron Donor . • . . . . . • . • . . . . . 56
vi

Table Page
XVI. MAFAEB Coupl1ng React1on General Cond1t1ons and Results . • . . . . • • . . . . . . 59
XVII. Alkal1n1ty Consumpt1on for Coupl1ng React1on and N1tr1fication ............... 62
XVIII. COD Consumption for Denitrif1cat1on and coupling Reaction ..... . . 63
XIX. Comparison of Influences by D1fferent DO . . 64
XX. N1tr1f1cat1on Recovery 1n MAFAEB System 64
XXI. Comparison of N1tr1ficat1on Results • • • • 6 7
XXII. Compar1son of Den1tr1flcat1on Results • • • 6 8
Vil

LIST OF FIGURES
Figure Page
1. Schemat1c Diagram of MAFAEB System . 25
2. Implementation Timel1ne for the Sequence of Operat1ons . • . . • . • . • . . . . . 36
3. N1tr1f1cat1on with MAFAEB System (Constant Loading Rate, Vary1ng HRT) ....•.. 40
4. N1tr1f1cat1on w1th MAFAEB System (Constant HRT, Vary1ng Load1ng Rate) ......• 41
5. Denitr1f1cat1on w1th MAFAEB System {Constant HRT, without Aerat1on) .....•.•• 44
6. Comparison of React1on Patterns (Low DO and Alternat1ve Aerat1on) ....•...• 48
7. Coupling Reaction with MAFAEB System ( Th1osulfate and Acetate as Electron Donors [ 11) • 50
8. Coupling React1on w1th MAFAEB System (Thiosulfate and Acetate as Electron Donors [ 21) • 51
9. Compar1son of Coupl1ng React1ons (w1th or w1thout Add1ng Thlosulfate) ....... 52
10. Coupl1ng React1on w1th MAFAEB System (Thlosulfate as Electron Donor [ 11 ) . . . . . . . . 54
11. coupl1ng React1on w1th MAFAEB System (Thiosulfate as Electron Donor [ 2] ) . . . . . . . . 55
12. Coupl1ng React1on w1th MAFAEB System (Sod1um Acetate as Electron Donor [ 1 1 ) . . . . . . 57
13. Coupl1ng React1on w1th MAFAEB System (Sod1um Acetate as Electron Donor [ 2 ) ) . . . . . . 58
14. Coupling React1on w1th MAFAEB System {with Acetate as Electron Donor, Long Term [ 11) . • 60
15. Coupling Reaction with MAFAEB System (with Acetate as Electron Donor, Long Term [2]) .. 61
viii

F1gure Page
16. MAFAEB N1tr1f1cat1on Recovery (at Loading Rate of 4.34 g/L-D) .......... 65
lX

CHAPTER I
INTRODUCTION
1.1 Development of this Research
Th1s research ~as undertaken to Investigate the feasi--
bil1ty of us1ng a mixed attached f1lm aerated expanded bed
reactor system (MAFAEB system) to conduct b1olog1cal n1tr1-
f1cat1on and den1tr1f1cat1on through a coupled reaction
sequence via a shortened path~ay, NH4+-N -> N02 -N -> N~.
B1olog1cal n1trif1cat1on and den1tr1f1cat1on are ~ell
established treatment processes used to eliminate the
nitrogenous oxygen demand and the ammon1a toxicity 1n both
munlcipal and 1ndustr1al ~astewaters and to prevent
eutrophication of receiv1ng ~ater bodies such as lakes and
other slo~-flow ~ater courses. Conventionally, nitri-
ficat1on and denitrification are performed separately in
different biotreatment processes. The reason for th1s is
that nitr1f1cat1on occurs under aerobic cond1tions while
denitrification requires anoxic conditions.
In conventional nitr1ficat1on and denitrification for
highly nitrogenous ~astewater treatment processes, the
pathway of n1trogen removal can be s1rnply represented by:
If a shortcut, or shortened pathway, represented by:
1
NH ....... -N --> NO.:;;:--N --> NO.:a. -- N.:;;:
could be achieved, the advantages would at least include
reduct1on of DO and alkalin1ty demand dur1ng n1tr1f1cat1on,
reduct1on of COD demand dur1ng den1trif1cation, and lower
biomass yield. Many efforts have been made on th1s top1c.
However, unt1l recently, few studies appear to have been
undertaken to successfully prove the hypothesis and develop
a process configurat1on that could achieve the shortcut.
The n1trifiers 1n wastewater treatment processes are
generally autbtrophs while the denitriflers are both auto
trophs and heterotrophs. In n1tr1fication processes, the
autotrophic nitrifiers use CO.:;;: as carbon source and use
NH4~--N as electron donor. Nltrosomonas consumes 3.22mg o~
for each mg of NH ....... -N ox1d1zed to N02--N, and 1.11 mg of OL
is required for each mg of No~--N ox1d1zed to No3--N by
N1trobacter accord1ng to sto1ch1ometric relat1onsh1ps
presented by Grady et al. (1980). These bacter1a also
consume a large amount of alkal1n1ty [Hco~-J dur1ng the
ox1daf:1on.
2
In den1tr1f1cat1on processes, the heterotroph1c
den1tr1f1ers use organ1c matter as carbon sources, and use
nitrate as the electron acceptor, while the autotroph1c
den1trlfiers use sodium thiosulfate as electron donor. They
convert Noo--N to No~--N first, and N02--N to N~ last.
Heterotrophic denitrif1cation produces a certain amount of
alkalin1ty during reduction of No3--N and/or N02--N, which
normally is wasted in the treatment process effluent.
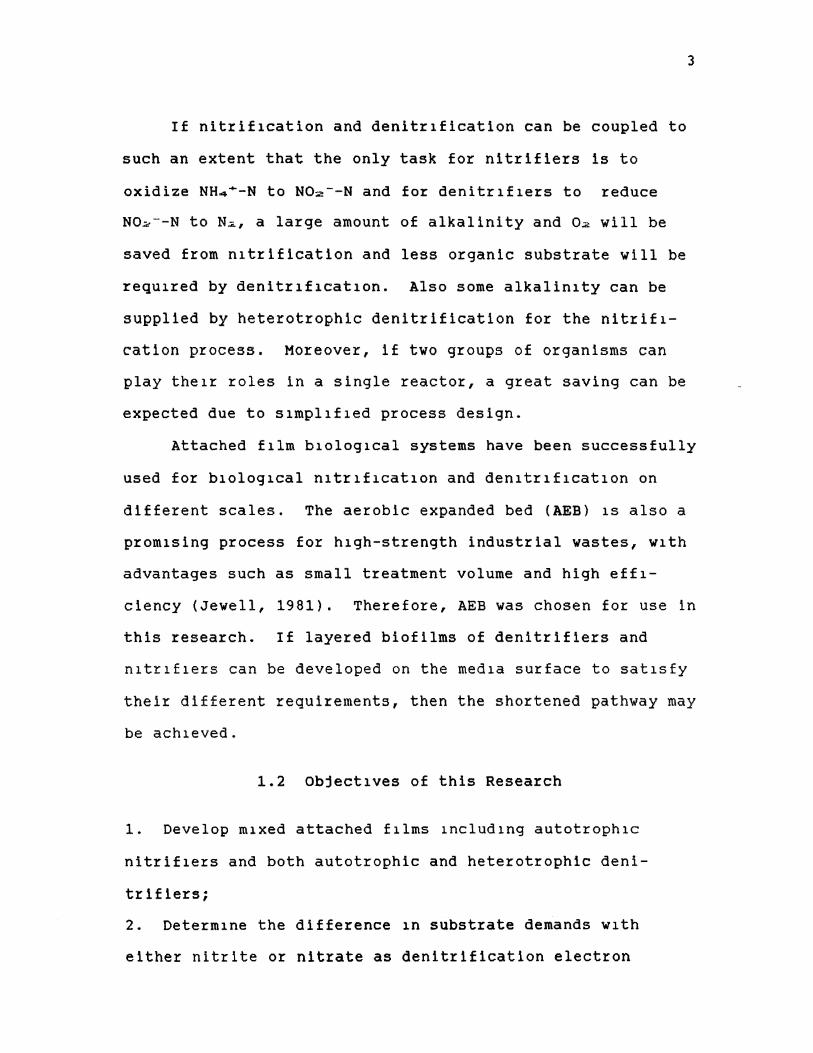
If nitrif1cation and denitrlfication can be coupled to
such an extent that the only task for nitrifiers is to
oxidize NH4•-N to Noz--N and for denitr1f1ers to reduce
No~--N to N~, a large amount of alkalinity and 02 will be
saved from n1trification and less organic substrate will be
requ1red by denitr1f1cat1on. Also some alkalinity can be
supplied by heterotrophic denitrification for the nitrifl
catlon process. Moreover, if two groups of organisms can
play the1r roles in a single reactor, a great saving can be
expected due to s1mpl1f1ed process design.
3
Attached f1lm b1olog1cal systems have been successfully
used for b1olog1cal n1tr1f1cat1on and den1tr1f1cat1on on
different scales. The aerobic expanded bed (AEB) 1s also a
prom1sing process for hlgh-strength industrial wastes, w1th
advantages such as small treatment volume and high effl
ciency (Jewell, 1981). Therefore, AEB was chosen for use in
this research. If layered biofilms of denitrifiers and
n1tr1f1ers can be developed on the med1a surface to sat1sfy
their different requirements, then the shortened pathway may
be ach1eved.
1.2 Object1ves of this Research
1. Develop m1xed attached f1lms 1nclud1ng autotroph1c
nitrif1ers and both autotrophic and heterotrophic deni
trifiers;
2. Determ1ne the difference 1n substrate demands w1th
either nitrite or nitrate as denitrification electron

4
acceptor by mixed attached films;
3. Determine nitr1ficat1on behavior of the MAFAEB system;
4. Determine denitrification behavior of the MAFAEB system;
5. Determ1ne coupling reaction rates in response to varying
loading rates, electron donors, and aeration rates and the
llm1tations of MAFAEB treatment efficiency.

CHAPTER II
LITERATURE REVIEW
2.1 scope of Review
Th1s research focuses on coupl1ng n1tr1f1cat1on and -
den1tr1ficat1on through a shortened pathway, pr1mar1ly 1n a
s1ngle HAFAEB reactor under low d1ssolved oxygen (DO)
aerob1c cond1tions. Although nitrificat1on and den1tr1-
fication in general are well-studied, information on
coupl1ng reactions through a shortened pathway 1s lim1ted.
Thus, this l1terature survey emphas1zes the need to explain
the m1cro-b1olog1cal cond1t1ons of nitr1f1ers and denitr1-
f1ers, the sto1chiometr1c relat1onsh1ps, the effects which
interfere w1th nitr1ficat1on and den1trif1cat1on, and the
possib1l1ty of coupl1ng n1tr1ficat1on and den1tr1f1cat1on
through the shortened pathway.
2.2 Microbiology of Nitrification
and Denitrification
Nitrificat1on 1s the conversion of ammonia n1trogen
NH4+-N to nitrate nitrogen No3--N. It may be performed by
either heterotrophic or autotroph1c bacteria. The maJor
nitrifying bacteria are Nitrosomonas and Nitrobacter. They
are autotrophic organisms. Nitrosomonas oxidizes NH4+-N to
5

nitrite, N02--N, and N1trobacter oxidizes n1trite to
nitrate. The energy released in these reactions is used by
the nitr1fy1ng organ1sms 1n synthes1zing the1r organ1c
requirements from inorganic carbon sources such as carbon
dioxide, bicarbonate and carbonate. (Barnes, et al, 1983).
The above reactions can be written as follows (EPA, 1975;
Pa1nter, 1970}:
NH4+ + 1.5 02 -> 2 H+ + H~o + N02- + (58-84 Kcal) (1)
No~- + 0.5 o~ -> Noa- + (~5.4-20.9 Kcal} (2)
The biochem1stry of ammon1a ox1dation is rather more
6
complex than 1ndicated by the above equations, 1nvolving the
format1on of hydroxylamine and other unstable intermed1ates
wh1ch have yet to be determined (Painter, 1970; Sharma, et
al. 1977).
Both Nitrosomonas and Nltrobacter are obl1gate aerobes
for growth on their respective forms of substrate n1trogen.
Absence of oxygen for long periods, however, is not lethal
(Pa1nter, 1970), and 1n the absence of substrate the rate of
decline 1n respirat1on rate 1s cons1derably slower under
anaerob1c than under aerob1c cond1t1ons. In the absence of
oxygen, Nltrobacter 1s able to reduce n1trate to nitr1te 1n
a reaction which is the reverse of Equation 2 (Sharma et al.
1977).
In addition to the autotrophic n1tr1fiers, many hetero
trophic organisms are able to produce oxidized nitrogen
forms from ammon1a. The importance of heterotroph1c n1tri
ficat1on is still a matter of debate(Geraats et al., 1990).

7
The specific nitrifying activity of the heterotrophs is sald
to be 10~ - 104 times lower than that of the autotrophs, and
therefore heterotrophic nitrification is often considered to
be of minor ecological significance. However, th1s activity
was measured by the accumulation of nitrite or nitrate.
Since many heterotrophic n1tr1f1ers are able to den1tr1£y
aerobically as well as anaerobically, ammonia is directly
converted to nitrogen gas and nitrite or nitrate will not
accumulate. When making mass balances for continuous cul--
tures, 1t was found that the n1tr1fication activ1ty (in
terms of ammon1a ox1d1zed) of the n1tr1f1er/aerob1c
denitrifier, Thiosphaera pantqtropha, is only 10-10~ t1mes
lower than the autotrophs(Geraats et al., 1990). It seems
likely that, as other bacteria of this physiological type
are studied, 1t will be found that most n1trif1cat1on rates
have been underestimated because of the simultaneous nitrite
reduct1on. Thus, in view of the fact that heterotrophs
generally outnumber autotrophs in the bacteria commun1ties
found in most wastewater treatment systems, heterotrophic
n1tr1fy1ng organ1sms might well be of greater s1gn1f1cance
than prev1ously thought (Geraats, et al.,1990).
Denitrification is the reduction of nitrate as it
serves as the term1nal hydrogen acceptor for m1crobial
respiration in the absence of molecular oxygen. The
bacter1a responsible for denitrlfication are facultat1ve and
ut1l1ze the same bas1c b1ochem1cal pathway during both
aerobic and anaerobic respiration(Grady et al., 1980).

Den1trification can be accomplished by a large number of
bacteria commonly found 1n wastewater treatment systems,
including Achromobacter, Aerobacter, Alcaligenes, Bacillus,
Flavobacter1um, M1crococcus, Proteus, Pseudomonas and
Thiosphaera pantotropha.
8
Under aerob1c cond1t1ons organic and other materials
are oxid1zed and oxygen acts as the effect1ve electron
acceptor. However, under conditions where the concentration
of DO 1s low or zero, an alternat1ve electron acceptor 1s
needed. Inorganic anions like nitrate, phosphate, sulphate
and even carbon dioxide can act as the electron acceptor.
The proport1on of any m1crobial species present 1n a
m1xed culture w1ll depend upon the relative abundance of
appropriate electron donor material, the relat1ve abundance
of appropr1ate electron acceptor and the energy to be ga1ned
by using a part1cular electron acceptor (Barnes et al.,
1983}. Under aerob1c cond1t1ons, oxygen is the favored
electron acceptor and aerobic ox1dation will predom1nate.
The next most favored react1on uses n1trate, and th1s 1s
cons1derably more advantageous than other anaerob1c path
ways. Under cond1t1ons of low DO concentrat1on, b1ological
denitrif1cat1on can be expected to occur.
The biological reaction to reduce nitrate ions to
n1trite ions and subsequently to nitrogen requires that a
suitable electron donor is available. When the electron
donor is methanol, the reactions can be represented by the
following equat1ons:

9
NOs- + 1/3 CHsOH -->No~- + 1/3 C02 + 2/3 H20 (3)
No~- + 1/2 CH~OH - ->N2 + 1/2 CO- + 1/2 HzO +OH-. (4)
When the electron donor 1s th1osulfate, the react1ons can be
represented by the follow1ng equat1ons:
No3- + 1/4 Szo~z- + 1/2 HCOo- --> No~- + 1/2 804~-
+ 112 co~ + 1/4 H20 (5)
NOz- + 3/8 S.;;:,Os·;;;,-- + 1/4 H+ --> 1/2 N2 + 3/4 80"'" 2
+ 1/8 H~o. (6)
Many organ1c chem1cals other than methanol, for example
acet1c ac1d, c1tr1c ac1d and acetone, can be used as
electron donors for den1tr1f1cat1on. Methane (Rhee et al.,
1978) and sulphur (Batchelor et al., 1978) also have been
suggested,
The ev1dence for aerob1c denitrif1cation was obta1ned
from a number of 1ndependent exper1ments (Robertson et al.,
1984). The max1mum spec1f1c growth rate of T. pantotropha
was higher (0.34 h- 1 ) 1n the presence of both oxygen ( > 80%
air saturat1on ) and n1trate than 1n s1m1lar cultures not
suppl1ed w1th n1trate ( 0.27 h- 1 ) 1nd1cat1ng that the rate
of electron transport to oxygen was l1m1t1ng. Th1s was
conf1rmed by oxygen uptake exper1ments wh1ch showed that
although the rate of resp1rat1on on acetate was not affected
by n1trate, the total oxygen uptake was reduced 1n its
presence. The or1ginal oxygen uptake could be restored by
the add1t1on of den1tr1f1cat1on 1nh1b1tors.

10
2.3 Sto1chiornetr1c Relationships
On the assumpt1on that the gross compos1t1on of Nltros
omonas and N1trobacter can be represented as c~H?N02, the
sto1chiometry of cell growth of nitrifiers has been repre
sented as (EPA, 1975):
15 C02 + 13 NH4+ -> 10 No~- + 3 CsH?No~ (Nltrosomonas)
+ 23 H+ + 4 H~O {7)
5 C02 + NH"""~ + 10 No~-+ 2 H20 -> 10 No~-
+ CsH7NO~ (Nitrobacter) + H•. (8)
Although carbon dlOXide 1s represented as the 1norganic
carbon source, lt exists in aqueous systems in equilibrium
With other spec1es accord1ng to the equations:
co~+ H~O <====> H2C03 <====> H+ + HCo3·. ( 9 )
Hydrogen 1ons produced 1n Equat1ons 1, 7 and 8 react w1th
bicarbonate according to Equation 9 which may therefore be
incorporated into these three equations to give:
NH"""+ + 1. 5 0~· + 2 HCO~~- · > No~-· + 2 H::o..C0-,1 + H~O
+ (58-84 Kcal) (10)
13 NH"""• + 23 HC03---~ 8 H~co~ + 10 N07
+ 3 c~H7N02+19H~O
NH4~ + 10 No~-+ 4 a~co~ + aco3- -> 10 No~
+ 3 H20 + CsH?N02.
(11)
{ 12)
Since the energy produced in Equation 10 is used in the cell
synthes1s reaction, assuming a Nitrosomonas cell y1eld of
0.15 gVSS/g NH"""~-N {EPA, 1975), Equation 10 and 11 can be
comb1ned to g1ve:

11
55 NH4++ 76 o.+ 109 Hco~- -> C5H?No~ (N1trosomonas)
+ 54 No~- + 57 H2o + 104 H~co~. (13)
Similarly, Equations 2 and 12 can be combined, assume in a
Nitrobacter cell yield of 0.02 g VSS/gNo.--N oxidized, to
give:
400 N02- + NH4+ + 4 H2C03 + HC03- + 195 02
--> CsH?NO. (Nftrobacter) + 3 H.o + 400 No~-. (14)
The overall reaction for nitrifler synthesis and oxidation
obtained by combining Equation 13 and 14 is then:
NH4++ 1.83 02+ 1.98 HCo3- --> 0.021 CsH?N02
( 15) ~
Equation 15 reveals the very low cell yield per unit of
ammonium nitrogen oxidized, the significant requirement for
oxygen in nitrification, approximately 4.2 g oxygen for each
g NH4+-N removed, and the requirement for alkalinity to
buffer the system against hydrogen ions produced during
ni~rification, amounting to approximately 7 g alkalinity for
ea~h g NH4+-N oxidized.
The stoichiometric equation of heterotrophic denitrifi
cation was presented by MaCarty et al. (1969):
No3- + 1.08 CH30H + H• = 0.065 CsH?NO~ + 0.47 N2
+0.76 co~ + 2.44 H20 (16)
The stoichiometr1c equation of autotrophic denitrifica
tion using thiosulfate as electron donor was calculated by
Ross (1989):
No~- + 0.79 s2o3- + 0.21 Hco3- + 0.2 H20
= 0.05 CsH?N02 + 0.47 Na + 1.56 so4· + 0.28 H+ (17)

12
Comparison of the stoichiometry of heterotrophic and
autotrophic denitrification reveals that, whereas the heter
otrophs are net alkalinity producers, autotrophic denitrifi
ers consume alkalinity (are net producers of acidity) in
much the same way as nitrifying bacteria (Clarkson et al.,
1990).
2.4 Factors Affecting Nitrification
and Den1trification
2.4.1 Effects of Temperature
The saturation constants for both Nitrosomonas and
Nitrobacter, with respect to both inorganic nitrogen and DO,
have been found to 1ncrease with 1ncreas1ng temperature
(Painter, 1970). For Nitrosomonas, reported values of KM
for ammon1a nitrogen range from 0.54 - 1 mg/L at 2o•c, 3.5
mg/L at 25•c and to 10 mg/L at Jo•c (Pa1nter, 1970).
The temperature dependence of denitrification is simi
lar to related biological processes. The reaction occurs
between o•c and so•c w1th optlmum reactLon rates at 35-5o•c.
The reactLon rate increases by a'factor of 1.5-2.0 I 1o•c
between 5•c and 15°C (EPA, 1975).
2.4.2 Effects of other Substrate
some studies indicate that high concentration of NH~+-N
up to 1000 mg/L may not inhibit Nitrosomonas. Even at a
concentration of 8000 mg/L, some oxidation can still proceed
at a much reduced rate (Sharma et al., 1977; Anthonisen et

al., 1976). However, for Nitrobacter in pure culture,
concentrations of 8 - 16 mg/L of NH4+-N reportedly
increased the lag period, but only slightly decreased the
growth rate (Sharma et al., 1977).
13
Nitrite is reported 1n one case to have an 1nhibit1ng
effect on nitrification in a laboratory-scale activated
sludge plant at a concentration as low as 10 mg/L (Tomlinson
et al., 1966). In batch and pure culture studies with
Nitrosomonas, however, although toxic effects were exhibited
in the lag phase at 500 mg/L No~--N, the organisms were not
susceptible in the logarithmic growth phase (Sharma et al.,
1977). At 1400 mg/L No~--N about 40% 1nhib1tion has been
reported while at 2500 mg/L inhibition varied from 50\ to
complete. For Nitrobacter, 40% inhibition was reported at
1400 mg/L N02--N (Boon et al., 1976). The effect increased
with increasing concentration.
Inhibition of n1tr1fication by free ammonia and free
nitrous acid has been described by Anthon1sen et al. (1976).
Inhibition of Nitrosomonas by free ammonia is likely in the
range 10 - 150 mg/L. Inhibition of Nitrobacter is likely at
the much lower concentrations of 0.1 - 1.0 mg/L, lead1ng to
the possibility that in wastes containing high concen
trations of NH4+/NH~ inhibition of Nitrobacter may lead to
the accumulation of n1tr1te.
2.4.3 Effects oi Other Substances
Nitrification is subject to inhibition by a wide

14
variety of organic and inorganic chemicals, Nitrosomonas
generally being more susceptible than Nitrobacter. Among
the factors wh1ch have been found to affect the degree of
inhibition by any given inhibitor are (Sharma et al., 1977):
(a) the presence of microorganisms other than the nitri
fiers;
(b) the concentration of the inhibitor;
(c) the concentrat1on of the nitr1fiers.
Inhibitors may act either by interfering with the
general metabolism of the cell or by disrupt1ng the primary
oxidation react1ons. Although many organic compounds are
inhlbitory to n1trif1ers, espec1ally Nitrosomonas, it now
seems to be accepted that organic matter in general is not
directly inh1b1tory to nitrif1cat1on (Painter, 1970).
Compounds such as glucose, glycerol and acetate were not
found to be toxic to Nitrosomonas although peptone at
concentrations of 1 and 10 mg/L reduced growth rate by 25%
and 60%, respectively(Palnter, 1970).
2.4.4 Effects of Dissolved Oxygen
Dissolved oxygen has been cons1dered to be an absolute
requirement for growth of both Nitrosomonas and Nitrobacter.
There is evidence that for pure cultures of both Nitrosomo
nas and Nitrobacter the cr1t1cal DO concentrat1on below
which nitrif1cation does not occur is 0.2 mg/L (Schoberl et
al., 1964). DO concentrations higher than 1-2 mg/L are
enough to keep the nitrification a zero-order reaction with

15
respect to nitrogen (Schoberl et al., 1964; Knowles et al.,
1965), therefore 2 mg/L of DO has been widely suggested as a
minimum for nitrification (EPA, 1975). Some observations
show that higher DO concentrations of 3-4 mg/L can signifi
cantly enhance nitrification efficiency (Benefield et al.,
1980), but relatively little further improvement can be
achieved at 5-6 mg/L of DO (Bliss et al., 1981).
For denitrification, generally, strict anoxic condi
tions and the presence of nitrogen oxides in the medium are
required for synthesis of denitrifying enzymes. However, if
the amount of nitrate far exceeds the oxygen concentration,
anaerobic respiration may become significant (Payne, 1981).
Strand et al. (1985) found that if organ1c matter and
microbial biomass are present in sufficient excess, the
No3--N loss rate in microbial films exposed to aerobic med1a
can be as high as those observed in anoxic cultures. The
bulk fluid dissolved oxygen concentration (0.1-14 mg/L} had
a negligible effect on the microbial film's consumption rate
of oxidized nitrogen. The reason for this is that dissolved
oxygen does not fully penetrate microbial films with
population densities greater than 0.5x10~ cells em-~ (Strand
et al, 1985).
2.5 Aerob1c Expanded Bed
Aerobic expanded bed (AEB) reactors are submerged
biofilm units using small b1omass support particles with
continuous recycle. The small particles provide a high

16
surface area to volume ratio in the reactor. After applying I
AEB to nitrification treatment of semiconductor wastewater,
Collins et al. (1991) concluded that the AEB reactor,
despite its physical limitations, has potential as a pre
treatment process to provide highly efficient nitrification
of sem1conductor wastes. Biological fluidlzed-bed reactors
have been used successfully for BOD and nitrogen removal in
many plants (Jeris et al., 1977). AEB 1s similar to a
flu1d1zed-bed reactor. The principal dlfference between AEB
and fluidized-bed is the bed expansion rate. Strictly
speaking, the AEB reactor should not have a bed expansion
rate higher than 20% (Jewell, 1981). In the research by
Collins et al. (1991) and Zeng (1992), bed expansion rates
higher than 60% were used, which are actually intermediate
between expanded and flu1d1zed bed operation.
2.6 Coupling Nitrification
and Denitrification
2.6.1 Dlfferent Approaches
Many industr1es such as fertillzers, sem1conductor,
meat and milk processing and munitions production generate
waste streams that conta1n high concentrations of nitro-
genous compounds. Nitrification and denitrification of such
effluents should both be employed to remove soluble nitrogen
for preventing eutroph1cation of receiving water bodies.
Conventionally, nitrification and denitrification are
performed separately in d1fferent biotreatment processes.

17
some efforts have been made on coupling nitrification
and denitrification. Timberlake et al. (1988) developed a
biofilm reactor, termed the permeable-support biofilm, in
which oxygen was supplied to the interior of the biofilm
through a permeable membrane. The reactor was tested on
filtered sewage supplemented with nutrient broth. The bulk
solution was anoxic and the interior of the biofilm was
supplied with pure oxygen. All tests were performed on a
non-steady state biofilm with a depth of 1 mm. Mass
balances on total organic carbon, ammonia, organic nitrogen
and nitrate showed that combined heterotroph1c oxidation of
organic matter, n1trificat1on and den1trificat1on occurred
simultaneously within the biofilm.
One study conducted by Turk et al. (1986) 1nvest1gated
the feasibility of removing nitrogen from highly nitrogenous
wastes by the shortened pathway. The study employed bench
scale, activated sludge cells. Free ammon1a, controlled by
manipulating pH, was used as inhibitor of nitrite oxidation.
A multi-cell reactor system was operated in series to appro
ximate a plug flow conflguration. N1trite build-up was
achieved by 1ntermittent contact with a higher than 5 mg/1
free ammonia level at the front end of the system, which was
maintained anoxic to create a high free ammonia environment.
Intermediary den1tr1f1cation at the po1nt where the n1trite
level was highest was used to sustain n1trite build-up
level. The process configuration would normally produce an
effluent devoid of nitrite, due to its oxidation to nitrate

in the remaining aerobic cells. The feasibility of
initiating nitrite build-up in an activated sludge nitrogen
removal system via the shortened pathway, wh1le producing a
fully nitrified effluent devoid of nitrite was confirmed
(Turk et al., 1987). A 40 \reduction of COD during
denitrification was also claimed (Turk et al., 1989).
However, nitrite build-up could not be sustained
1ndef1n1tely due to acclimation of the n1tr1te ox1d1zers to
free ammonia. Numerous measures have also been taken (Turk
et al., 1989) to prevent the eventual decline of nitrite
build-up. Unfortunately, nitrite oxidizers appeared capable
of tolerat1ng ever-increasing levels of free ammonia, thus
causing an 1rreversible decline in n1trite accumulat1on for
most operat1onal systems tested. They suggest if a way can
be found to permanently overcome the apparent acclimation of
the nitrite oxidizers to free ammonia, a cost-effective
technology based on nitr1te production and reduction may
evolve for the removal of nitrogen from highly nitrogenous
wastewaters.
One poss1ble way to solve the problem involves hetero
trophic nitrification and aerobic denitrification. It has
commonly been accepted that denitrificatlon requires com
pletely anoxic cond1tions because some well-studied bacteria
completely shut down their denitrify1ng capacity upon
exposure to oxygen (Robertson et al., 1984a). However,
there have been periodic reports of aerobic denitrification
(Marshall et al., 1953; Mescher et al., 1963; Krul, 1976;

1~.
Robertson et al., 1964a; Simpkin et al., 1988; Hanak! et
al~, 1990). The results of these experiments clearly
1ndicate that in a number of denitrifying bacteria, aerobic
denitrification does indeed occur. However, the denitri
flers convert No3--N at highest rates under anaerobic condi
tions (Robertson et al., 1984b). Many other heterotrophic
nltrifiers were also found able to denitrify aerobically as
well as anaerobically (Robertson et al., 1989). For waste
water treatment, this means that when nitrification is not
subject to inhibit1on by either organ1c matter or any other
inh1b1tors, s1multaneous aerob1c organic degradation, nltri
flcation and den1trification can occur with1n a single
aerat1on basin.
There is another possibility for coupling n1trification
and denitrification, which involves aerobic nitrification
and den1trification combined w1th methanotrophic and methyl
atrophic mixed cultures. Since ammonia can be oxidized by
obligate methanotrophic bacteria, in any unprotected process
where bacterial growth on methane occurs, the mixed culture
w1ll comprise not only obligate methane-utillzing bacteria,
but also methylotrophlc bacteria, spec1f1cally Hyphomlcrob
lUm, and a range of heterotrophic bacteria (Hamer et al.,
1989). In such m1xed cultures, the role of the Hyphomicro
bium is to scavenge methanol produced from methane by the
methane-ut1l1z1ng species. When th1s same Hyphom1crob1um
was grown in pure culture at 32°C in the presence of
nitrate, denitrification became evident. Although a high

20
level of methane inhibits ammonia oxidation, at low levels,
it will stimulate nitrite formation (O'Neill et al., 1977).
If methane is used as carbon source for the nitrification,
methanol will be the product when ammonia is converted to
n1trite. If the dissolved oxygen concentrat1on in the
solution is kept low, then denitrification may occur
simultaneously.
2.6.2 MAFAEB Development
To achieve the shortened pathway, the ma1n problem
comes from the fact that one of the reactions is favored
aerobically while another 1s favored under anoxic con-
d1t1ons. The other problems include: 1. avoiding inh1b1t1on
of autotroph1c nitrifiers by organic matter used by some
den1trifiers; 2. stopp1ng n1tr1f1cation at the N02--N stage
with efficient N02--N ut1l1zation by denitr1fiers.
Hanakl et al. (1990) conducted a lab-scale n1trif1-
cat1on study 1n a mixed flow reactor with DO control at 2s•c
using substrate contain1ng 80 mg/L of NH4~-N. At 0.5 mg/L
DO, ammonia oxidation was not affected. However, N02--N
oxidation was strongly inhibited by 0.5 mg/L of DO, and 60
mg/L of No~--N accumulated. The maximum specific growth
rate ~m for NH4+-N oxidation was not sign1f1cantly changed
by low DO because of elevated growth yield. When Jones et I
al. (1990) were 1nvestigating a process incorporating
sequencing batch reactors for organic removal and denitri-
fication and a fixed-film device for nitrification, they

. . . . .. .21
found a small amount of No~--N ln the denltrlflcatlon feed
stream had resulted in a robust population of organisms
capable of reducing N02--N faster than No3--N, result1ng 1n
a 30% increase in the denitrification rate over systems fed
only No3--N as an electron acceptor.
Consequently, if a proper condition can be created, the
symbiosis of two groups of organisms is possible. Since
both organisms share the same pH range, the goal ought to be
possible.
Colllns et al. (1991) and Zeng {1992) successfully
conducted nitrification of high strength 1ndustry wastewater
with AEB, and Clarkson et al. (1990) successfully conducted
denitrification of high strength industry wastewater with
attached f1lm expanded bed (AFEB). They used d1atomaceous
earth as inert support to attach microorgan1sms. These
reactor configurat1ons can be combined to meet the require-
ments for the coupled nitrification and den1trification.
To take advantage of the1r d1fferences in growth
requirements, nitrifiers and denitrifiers should be
accl1mated separately prior to seed1ng the coupled b1of1lm
reactor. This may be done by feeding the nitrifiers with
NH4~-N under low DO to acclimate mainly Nitrosomonas and
feeding both No~--N and NO~ -N as electron acceptors for
denitrifiers.
Inert support media should be supplied for both groups
of organisms separately to develop attached biofilms or be
supplied to denitrifiers to develop the first layer of

22
combined biofilm. Then, nitrifiers should be attached to
develop double films with the nitrifiers exposed to liquid
phase DO. In this way, two groups of organisms could be put
in a single reactor and fed with an influent containing
NH4+-N with low organic electron donor (only sufficient for
those heterotrophic denitrifiers to convert N02--N to N2)
under low DO conditions.
The key problems are understanding how to supply 02 for
nitrifiers and how the system works. The reactor should be
a combination of AFEB, AEB and fluidized-bed reactors.
Influent enters the reactor from the bottom. Compressed air
should be introduced into the reactor from the aeration
bottle through recycle tublng connected to the bottom of the
reactor. The amount of air should be controlled to maintain
a low DO in the reactor and offer a mild mixing. Since at
low DO conditions oxygen supply may become critical, a large
recycle may be necessary, especially for h1gh strength
influents. The recycle rate can be altered accord1ng to the
organic and NH4+-N concentration of the original influent
and allowable loading of the system.
To summarize, accl1mat1ng nitrify1ng and denitrify1ng
organisms separately may induce their b1odegradation
spec1fic1ty to particular substrates; attach1ng the two
groups of organisms together may develop aerobic and
anaerob1c zones within the biof!lms, which may keep
n1tr1f1ers and denitrifiers always act1ve in their favorable
local environment; mild mixing may improve diffusion between

23
liquid phase and solid phase; alkalinity produced by
heterotrophic denitrifiers may be utilized by autotrophic
denitrifiers and nitrifiers; large recycle rate may supply
sufficient oxygen to the reactor and maintain a lower inlet
NH4+-N and organic concentration; low DO (about 0.5-2.0
mg/L) may not only avoid unnecessary oxidation from N02--N
to No~--N but also avoid the suppression of denitrification.

CHAPTER III
MATERIALS AND METHODS
3.1 Experimental Apparatus
The mixed attached films aerobic expanded bed (MAFAEB)
system is shown in Figure 1. The MAFAEB reactors consisted
of an Imhoff cone, which was 1 L in volume. The effluent
from the top of the expanded bed reactor was introduced to a
500-mL aeration bottle in which the effluent was aerated by
compressed air. Effluent recycl1ng was carr1ed out to
increase dissolved oxygen and expand the bed in the reactor.
A positive displacement pump (7553-50, Cole-Parmer) was used
to recycle the aerated effluent to the bottom of the
reactors. The pump was fitted with two model 7015-20 pump
heads (Cole-Parmer Instrument co.). Treated water left the
system through an overflow opening located at the upper part
of the aeration bottle. The feeding solution from 25-L or
4-L containers was pumped to the bottom of the reactor by a
Cole-Parmer model 7553-50 pump fitted w1th positive dis
placement pump head (model 7016-13). The feed and the
recycled effluent Joined together in a plastic tub1ng
lead1ng to the bottom of the reactor. The b1ofilm support
media in the reactor consisted of diatomaceous earth parti
cles (diameter 1-3 mm), which provide a high surface area to
24

I
~~FAEB
Reactor
Influent Bottle
Feed Pump
0 ..
Compressed Air
Aeration Bottle
0
0
Recycle Pump ,
Effluent Bottle
Figure 1. Schematic Diagram of MAFAEB System

volume ratio and have a bulk density of 0.40 g/cm3 • The
support media bed was expanded by the mixture of the feed
and the recycled effluent, and the expansion rate was
adjusted through changing the recycle rate. The bed was
expanded over a range of approx1mately 20-100 percent at
various times during the study by the recycle flow. The
experiment was carr1ed out at room temperature.
3.2 Feed Solution
26
synthetic substrate was used in this research to
simulate industrial or municipal wastewater. The com
position of the feed solution for nitrification tests was
determined mainly based on the stoichiometric equations
described 1n Chapter II with respect to the biomass growth
requ1rements for trace nutrients. The composition of 250 mg
NH4+-N/L feed solut1on for example, is g1ven in Table I.
All chemicals were dissolved separately in tap water and
then mixed well in 25-L or 4-L containers; pH ranged from
7.7-8.0 1n all the feed solutions, except denitrification
influent, used in th1s experiment.
Methanol or sodium acetate were added as energy sources
for heterotrophic denitrlfiers. Sodium thiosulfate was
added as energy source for autotrophic denltrifiers. Some
ferrous sulfate was also added as trace nutr1ent. A typ1cal
composit1on of 500 mg No~--N/L feed solut1on 1s given 1n
Table II and a typ1cal compos1t1on of 500 mg (No3--N +
No~--N)/L feed solution in Table III.

TABLE I
COMPOSITION OF 250 mg NH~·-N/L FEED SOLUTION
Ingredients
Ammonium Sulfate Ammonium Chloride Sodium Bicarbonate Potassium Dihydrogen Phosphate Magnesium Sulfate
TABLE II
Concentration, g/L
1.2 1.0 6.0 0.2 0.2
COMPOSITION OF 500 mg No3--N/L FEED SOLUTION
Ingredients
Potassium Nitrate Methanol Potassium D1hydrogen Phosphate Magnesium Sulfate Ferrous Sulfate
--------------
TABLE III
Concentration
3.6 g/L 1.9 ml/L 0.1 g/L 0.01 g/L 0.002 g/L
COMPOSITION OF 500 mg No~--N + N02--N/L FEED SOLUTION
---------------- ·-------Ingredients
Potassium Nitrate Sod1um N1trite , Methanol Potass1um Dihydrogen Magnes1um Sulfate Ferrous Sulfate
Phosphate
Concentrat1on
1.8 1.2 1.9 0.1 0.01 0.002
g/L g/L
ml/L g/L g/L g/L
-------··--
27

The feed solutions for coupling reactions consist of
combined nitrification and denitrification feedstock
ingredients with ammonium in place of nitrate or nitrite.
Typical feed solutions are listed in Tables IV, V and VI.
TABLE IV
COMPOSITION OF COUPLING REACTION FEED SOLUTION (1)
Ingredients Concentration ____ , ____ _ Ammonium Chloride Methanol Sodium Thiosulfate Sodium Bicarbonate Potassium D1hydrogen Magnesium Sulfate Ferrous Sulfate
Phosphate
0.50 0.25 1.00 2.00 0.05 0.05 0.002
g/L mL/L g/L g/L g/1 g/L g/L
---· ---------- -------·
TABLE V
COMPOSITION OF COUPLING REACTION FEED SOLUTION (2)
Ingredients
Ammonium Sulphate Ammonium Chlor1de Sod1um Acetate Sodium Thiosulfate Sodium Bicarbonate Potassium D1hydrogen Phosphate Magnesium Sulfate Ferrous Sulfate
Concentration, g/L
0.53 0.44 0.25 1.13 1.50 0.05 0.05 0.002
28

TABLE VI
COMPOSITION OF COUPLING REACTION FEED SOLUTION(3)
Ing~edients
Ammonium Sulphate Ammonium Chlo~ide Sodium Acetate Sodium Bica~bonate Potassium Dihyd~ogen Phosphate Magnesium Sulfate Fe~rous sulfate
Concent~ation, g/L
0.53 0.44 0.75 1.50 0.05 0.05 0.002
3.3 Start-up P~ocedure
The same seed, which was collected from an activated
29
sludge aeration tank of the sewage t~eatment plant of Ponca
City, Oklahoma, was used for acclimation of all the o~ga-
nisms used in this expe~iment. The seed for autot~ophic
nitr1fication was acclimated in a 25-L plastic bottle. The
bottle was ae~ated by a cyllndric a1~ distributo~ with
compressed air. The supernatant was drained every day and
replenished with 10 L feed solution containing 250 mg
NH4+-NJL. The seed for both autotrophic and heterotrophic
denitrification was acclimated in a 25-L plastic barrel.
The content 1n the barrel was mixed with a magnetic stirrer.
The barrel was kept covered to exclude oxygen. The super-
natant was also drained every day and replen1shed with 10 L
feed solution containing 125 mg Noa--N/L and 125 mg
N02--N/L.
Prior to placing support medium into the reactor, the
inert particles were washed well to eliminate very fine

30
particles. The reactor was then filled with 150 mL of these
particles and expanded to about 20\ above its static volume
by recycling the supernatant through the bottom of the
reactor.
The acclimated denitrifiers were introduced first in
the MAFAEB reactor, and (No3--N + N02--N) feed solution was
fed continuously with a hydraulic retention time (HRT) of
about 6 hours to begin establishing the b1ofilm. As washout
of biomass occurre'd during the initial start-up period,
small amounts of fresh 1noculum from the seed bottle were
added to replace the loss. Both autotrophic and hetero
trophic den1trifiers were successfully attached on the dia
tomaceous earth particles. The static bed volume grew from
150 mL to 300 mL in 11 weeks.
Then, the aeration bottle was connected into the system
and was aerated with compressed air. (No3--N + N02--N) feed
solution was replaced with NH4+-N feed solution and
acclimated nitrifiers were inoculated in the same way as
denitrifiers. The HAFAEB showed steady nitrification
ability within about three weeks. When the coupl1ng
reaction feed solution was fed, it was evident that
nitrification and den1trlfication occurred simultaneously.
3.4 Analytical Techniques
3.4.1 Ammonia Nitrogen
Concentration of ammonia nitrogen was measured accord
ing to the methods described in standard Methods (APHA et
al., 1985), Section 417 c. The distillation method was
used, and its validity was checked by distillation with
known concentrations of pure reagent.
3.4.2 Nitrite and Nitrate
31
The techniques used for determination of concentrations
of nitrite and nitrate were given in Standard Methods (APHA
et al., 1985) Section 429. A Dionex ion chromatograph,
series 2000i/sp, was used for the measurements. standard
solutions were prepared for each analysis.
3.4.3 Chemical Oxygen oemand
Chemical oxygen demand (COD) was measured with Reactor
Digestion Method descr1bed in HACH WATER ANALYSIS HANDBOOK
(HACH Company, 1992).
3.4.4 Total Suspended Solids
Total suspended solids were measured according to the
methods described in standard Methods (APHA et al., 1985),
Section 209 c. Filtered solids were dried at 103-105°C.
3.4.5 Volatile Suspended Solids
The procedures descrioed in standard Methods (APHA et
al., 1985), Sectfon 209 D, were followed for determination
of volatile suspended sol1ds. The residue from total sus
pended solids determination was used for the determination
of volatile suspended solids.

32
3.4.6 Attached_Bloma~
The procedures described by Clarkson (1986) were
followed to determine the attached biomass. Samples were
taken from the center of the expanded bed reactor using a
wide mouth pipet and transferred to 10 mL wide bore
graduated cyl1nders. The cylinders were then tapped and
spun several times to consolidate the samples. During this
process of consolidation, particles were added or removed
and the tamping procedure followed until each sample
contained exactly 5.0 mL of packed particles. supernatant
was decanted and the sample was transferred to an ashed,
preweighed porcelain drying dish by sluicing it out with a
stream of distilled water from a wash bottle. The jet of
water from the wash bottle was used to agitate the particles
vigorously. The supernatant containing loose solids was
transferred to other drying dishes. Care was taken not to
remove support particles from their original dish. This
process was repeated until further washing produced no
further loose b1omass.
The dishes containing these samples were subJected to
the total suspended solids procedure described in Section
3.4.3. Blanks consisted of biomass-free diatomaceous earth
particles prepared along with those used for the expanded
bed but stored in a buffer solution at room temperature.
Blank samples we~e necessary to correct for hygroscopically
bound water in the diatomaceous earth in perform1ng the
sol1ds calculations. After the samples were ashed finally,

the particles were rehydrated with distilled water, trans
ferred to the graduated cylinders, and the final volume of
sample was taken. The samples were tamped well before the
final volume of the rehydrated sample was recorded.
3.4.7 pH'
pH values of samples were measured with a model 900
Accumet pH meter (Fisher Scientific Co.). This meter was
calibrated with standard solution each time when used on
every set of samples.
3.4.8 Alkalinity
33
Alkalinity was measured according to the procedures
descr1bed in standard Methods (APHA et al., 1985), Section
403. Sulfuric acid of 0.02N was used for titration. The
end point of pH 4.3 of t1tration was determ1ned with a model
900 Accumet pH meter (Flsher Scientific Co.).
3.4.9 Dissolved Oxygen
Dissolved Oxygen (DO) was measured with a model 97-08-
00 02 electrode (Orion Research Co.). Procedures described
in Standard Methods (APHA et al., 1985), Section 421 c, were
followed to check the results measured with the 02 electrode
once a week. The difference between the results from these
two methods was always smaller than 0.2 mg/L of DO.

34
3.5 Sampling and Implementation Timeline
Zeng (1992) found that nitrification in AEB reactor
with HRT at about 0.75 h could reach a new steady state well
within two days after operational conditions had been
changed, which was ident1cal w1th what happened in most of
the reaction conditions in this study. For this reason,
most experimental conditions were maintained for at least
two to three days in this experiment.
Influent samples were taken when it was freshly made
while effluent samples were taken from the top of the
reactor or from the aerat1on bottle. The pH and DO were
measured by 1nserting probes into the top layer of liqu1d
phase in the reactor. The readings were taken after
stirring the liquid phase with the probes until a steady
reading was reached. The analyses for the influent and
effluent were conducted daily. Usually, the last day's
results were reported.
Since there was some instability of the pump feeding
rate, the flow rate of influent was measured daily by
measuring the influent consumed within 24 hours. The
recycle rate was measured weekly by measuring the recycle
flow from the reactor to ~eratiori bottle, then subtract1ng
the influent flow.
All analyses were conducted immediately after sampling.
No sample storage was involved. Since th1s experiment 1s
only a feas1bility study, the water loss by evaporation and
splash were overlooked in this experiment.

The experiment lasted for approximately eight months.
The sequence of operations is shown in the implementation
timeline (Figure 2).
35

Mar '92 Apr
MA.FAEB Coupling Reaction, long term
MA.FAEB Coupling Reaction, acetate D MAFAEB Coupling Reaction, acetate & thiosulfate D M.AFAEB Nitrification Recovery D M.AFAEB DenitrifiCatiOn c=J
MAFAEB Coupling Reaction, thiosulfate c=J
MA.FAEB Nitrification, constant HRT
MA.FAEB Nitrification, constant loading
D MAFAEB Coupling Reaction, methanol &. thiosulfate
0 MAFAEB AlternatiVe Aerat1on
Nltrlflers Attachment D D Energy Sources Tests
~...-_______ =:1 Denltrrfiers Attachment
Batch Feed 1 Acclimation
May June Juty Aug Sep Oct Nov. Dec. Jan '93
Figure 2. Implementation Timeline for the Sequence of Operations w en

CHAPTER IV
EXPERIMENTAL APPROACHES AND RESULTS
4.1 Development of Autotrophlc and
Heterotrophic Denitrifiers in
Mixed Attached Films
S1nce both methanol and thiosulfate inhibit nitrifi-
cation (Beccari, 1980; Hooper et al., 1973), no accessory
energy sources (electron donors) more than that required by
denitrifiers during the coupling reaction should be added.
Unit nitrate or nitrite conversion rates with methanol and
sod1um thiosulfate as energy sources were tested under
electron-donor-limitation in the presence of excess electron
acceptors (nitrate or n1trite). Methanol and sodium
th1osulfate were added in vary1ng amounts to account for any
possible interference between autotrophic and heterotrophic
denitrification activities. The test conditions and results
are listed 1n Table VII.
According to the data in Table VII, the unit energy
source convers1on rates may be obtained by solving the
following equation groups:
Nitrate as electron donor:
{3.0 Crh~o 1
1.5 CTh~o 1
37
1 = 8 X 86,
1 = 8 X 152;

and n1trite as electron donor:
{3.0 CTh.t.o .2 + 1.5 cM ... 'bh..,.MC>l 2 = 8 )( 152,
1.5 CTh.t.o 2 + 3.0 CM..,th .... nol .2 = 8 X 213;
where,
CThio: Conversion rate of No~- vs. thiosulfate;
CM&th4nol: Conversion rate of No.- vs. methanol.
The results are:
nitrate as electron acceptor,
nitrite as electron acceptor,
TABLE VII
TEST CONDITIONS AND RESULTS OF ENERGY
SOURCES FOR MIXED DENITRIFICATION
Electron Acceptor
Electron Donor Loading Rate
NO:z.1--N, mg/L N0.2--N, mg/L N-Removed, mg/L
Nitrite
Na2S20o: 3.0 g/8 L 7.68 g/L-D*
Influent Effluent
1.3 0 229 77.9
152
Nitrate
Methanol: 1.5 mL/8 L 8.93 g/L-D*
Influent
268 0
Effluent
86
1.82 0
Electron Donor Na.o.:S.:..O::a: 1. 5 g/8 L Methanol: 3. 0 mL/8 L
N0::.1--N, mg/L NO.:a--N, mg/L N-Removed, mg/L
Influent Effluent
1.3 0 229 17.4
213
Influent
268 0
Effluent
152
116 0
----------·-------·--·-- -----------------------* g/L-D: g/per liter stat1c volume per day.
38
It was also found that part of the alkallnity produced

39
by heterotrophic denitrlfication was consumed in the auto-
trophic denitriflcation. Total alkalinity produced from the
simultaneous growth was much less than when only hetero-
trophic denitrifiers were grown.
4.2 Nitrification with MAFAEB System
After attached biofilms had shown steady state nitrifi-
cation ability, nitrification was carried out in two MAFAEB
reactors. The nitrification ability of the mixed attached
films was tested first under a constant loading rate over a
range of d1fferent hydraulic retention times (HRT) then
under constant HRT with d1fferent loading rate conditions.
The results are presented in Tables VIII and IX, and Figures
3 and 4. All the nitrogen forms in the figures have been
converted to nitrogen bases.
TABLE VIII
NITRIFICATION WITH MAFAEB SYSTEM - CONSTANT LOADING RATE
---· -----HRT, Hours
Items 0.25 0.38 0.50 0.75 1.50 3.0
Influent Ammonium, mg/L 42 63.9 85.2 128 251 500 Effluent Ammonium, mg/L 7.3 10.8 10.2 14.8 21.2 29.7 Effluent Nitrate, mg/L 17.6 11.7 22.2 25.0 46.2 112 Effluent Nitrite, mg/L 14.5 31.7 44.5 74.0 157 287
Influent DO, mg/L 5.9 6.2 5.8 5.7 5.7 5.5 Effluent DO, mg/L 3.2 3.2 3.2 2.8 2.6 2.2
influent pH 7.8 7.8 7.8 7.85 7.85 7.85 Effluent pH 7.4 7.5 7.4 7.4 7.5 7.5
Loading Rate, g/L-D* 4.12 4.17 4.09 4.1 4.27 4.00 N1trification, % 82.6 83.1 88.0 88.4 91.6 94.1

500·.---------------------------------------------------~~
, ·-· ·---~8----------- ~----------------------~-
.. .. . . -...
.. ._. ... ......... .. -__ .
_,~
_, .... ...... -
.--. -·
........... ........
---------------
.. ---·
---
.. -.--
~+---~~-T--------~------~--------~------~--------4-0 0.5 1 1 5
HRT, h 2 25
-+- Influent Ammonia ··*-· Effluent Ammonia ·•· Effluent Nitrite - EJ- Effluent N H:rate - • N itrWi. Efficiency
Figure 3 NITRIFICATION WITH MAFAEB SYSTEM
(Constant loading rate. varying HRT)
3
100
90
80
70 '#. .e
60 td 0:
50 c:: 0
40 t ~ c::
30 0 0
20
10
0

40
35
--' 30 .......... Ci)
E 25
c: 0
~ 20 b-. +-I c CD 15 0 c 0 0 10
5
II-------E-- ...... -·19 ...... ........ ... 1111 ...... ............ ............
~-------------···· ,. .. .,. .... _ .... " .........
.. ----·• .. _A,········
-- .... ..... ,_., ••.• A ....... ~
........... .. ., ........ . ••• .;~olE ..... , .....
.... M·····-· ~-·· ...... ~
... ~~--··1~ Hf--S"i'~~~:...;;..JdiW~-r--~LI'-u.,.'-"_-_-_-_-. -------e--------------- -EJ
I I I I 3 4 5 6 7 8 9
Loading F1ate 1 g/L-D
-+- Influent Ammonia ··*-· Effluent .Ammonia ·•· Effluent Nitrite
- EJ- Effluent N ftrate -a- N itrWi. E:fl iciency
Figure 4 NITRIFICATION 'iVITH MAFAEB SYSTEM
(Constant HAT, varying loading rate)
100
90
so 70
0~ Q)
60 td a: 50 t:::
0
40 1::: g;
30 c: 0 ()
20
10
I o 10

42
TABLE IX
NITRIFICATION WITH MAFAEB SYSTEM - CONSTANT HRT
Loading Rate, g/L-D Items 2.29 3.44 4. 59 5.73 6.88 9.17
Influent Ammonium, mg/L 100 150 200 250 300 400 Effluent Ammonium, mg/L 2.8 4.4 6.5 21.3 45.8 102 Effluent N1trate, mg/L 4.9 5.1 5.3 12.4 5.3 5.0 Effluent Nitrite, mg/L 87.0 133 178 203 229 253
Influent DO, mg/L 7.7 7.5 6.7 6.4 6.0 5.4 Effluent DO, mg/L 4.6 3.2 2.7 1.7 1.4 0.7
influent pH 7.85 7.85 7.85 7.85 7.95 7.95 Effluent pH 7.5 7.5 7.4 7.5 7.8 7.85
Nitrification, % 97.2 97.0 96.8 91.5 84.7 74.5
4.3 Denitrification with
Mixed Attached Films
After more than one month of nitriflcation tests, one
of the MAFAEB reactors was turned to anoxic cond1tions.
W1th1n hours, denitrificat1on activity was noted in the
MAFAEB w1thout aeration. Denitrification was tested at
constant HRT with different loading rates when steady state
had been reached in the MAFAEB reactor. No obvious
decreases in denitrification efficiency occurred at loadings
up to about 14 g/L-D.
Sodium acetate was used as electron donor 1n this test.
It was found that no adaptat1on time was needed for sod1um
acetate to replace methanol and/or sod1um thiosulfate as
electron donor, and the system showed tremendous potential

43
for denitrification.
The results of denitrification in the MAFAEB system are
shown in Table X and F1gure 5.
TABLE X
DENITRIFICATION WITH MAFAEB SYSTEM - CONSTANT HRT
Loading Rate, g/L-D Items 2.87 42.8 5.65 6.89 8.93 14.1
Influent Nitrate, mg/L 101 157 215 262 346 544 Effluent Nitrate, mg/L 0 0.4 0.8 0.9 0.6 2.2 Effluent Nitrite, mg/L 0 0 0 0 0 0
HRT, Hours 0.85 0.88 0.91 0.91 0.93 0.93 Effluent pH 7.85 7.8 7.6 7.6 7.6 7.6 Denitriflcation, \ 100 99.8 99.6 99.6 99.8 99.6
4.4 Coupling Reaction with MAFAEB System
4.4.1 Coupling Reaction with Methanol ang
Sod1um Thiosulfate as Electron Donors
After an attached b1of1lm had been well establ1shed 1n
the MAFAEB reactor, coupling reaction feed solution {1) was
fed. The aeration rate was controlled that the DO in the
reactor was close to 2 mg/L s1nce it was m~ch more diff1c~lt
to control the DO to below 2 mg/L. The recycle ratio was
set at 200 - 400% to supply obl1gatory oxygen for the nitri-
ficat1on. Some a1r bubbles were also introduced into the
reactor d1rectly through the recycling tubing to supply
additional oxygen and mild ag1tation.
During the first two days, loading rate was kept at

_I -.. 0)
E c:. 0
".i=• ctl io-+-• c. C];1 c;l t:: 0 C'
60 1-r-------1~----·----Ill- ____ , ________ ..._..._......_._.._._...--~~.---..,- 100
90 50
80
40 70
60
50
40 20
30
10 20
10
0 0 2 4 12 14 16
......_. Influent Nitrate ··*Eo· Effluent Nitrate --.4k- Effluent Nitrite • •· Denitri. Efficiency
Figure 5. DENITRIFICATION WITH MAFAEB SYSTEM
(Constant HAT, without Aeration)
?fl. Q)
tti c:r:: c:: 0 ~
~ c: 0 (.)

45
lower than 1 g/L-D. Loading rate was increased to 1.84 g/L-D
on the third day. on the fourth day, the nitrogen removal
rate reached 74.4%, and no nitrite or nitrate accumulated
in the effluent, which means the nitrogen removal rate was
equal to the nitrification rate. On the fifth day, nitrogen
removal rate was sustained at 74.0%, however, there were
21.2 mg/L No~--N and 1.0 mg/L No~--N remaining in the
effluent. The nitrification rate was as high as 91.2%. The
possibility of coupling nitrification and denitrification in
a single reactor was clearly proved.
However, between the fifth and eighth days, the
nitrogen removal rate dropped to 42.6% and the nitrification
rate dropped to 69.2%. Tremendous floes formed in the MAFAEB
system. Both nitrification and denitr1ficat1on were
inhibited at the same time. Since all the electron donors
added for denitrification were consumed while a significant
amount of nitrite and nitrate remained in the solution, this
may suggest that part of the energy sources added must have
been biodegraded through another pathway. The first eight
days results of this experiment are presented in Table XI.
4.4.2 Alternative Aerobic and
Anaerobic coupling Reaction
S1nce n1tr1flcat1on and denitriflcation requ1re totally
different conditions, alternating aerobic and anaerobic
reactor operation was conducted to test the influence on the
coupling reaction. Considering that there will be a certain

amount of oxygen to be consumed after aeration is stopped,
the non-aeration time should be longer than the aeration
time. At first, aeration time was set for 5 min and non-
aeration for 15 min. The nitrification rate was 71.7% and
the nitrogen removal rate was 46.8% over a period of 8
hours. The denitrification rate lagged behind the nitri-
fication rate. In the second test, aeration time was set
46
for 20 min and non-aeration time for 40 min. The comparison
between the alternating aeration (sampling immediately after
stopping alternating test) and low DO aeration pattern
(sampling under steady state condition just before alterna
ting aeration test) is shown in Table XII and Figure 6.
TABLE XI
COUPLING REACTION WITH METHANOL AND
THIOSULPATE AS ELECTRON DONORS
--------- ------·-- _____ .. __ ... _ Day Influent Effluent N1tri- Nitrogen
Ammonium Ammonium Nitrate Nitrite fication Removal mg/L mg/L mg/L mg/L % \
1 56.0 2 66.6 3* 127.5 10 0 2.4 92.2 90.3 4 129 33 0 0 74.4 74.4 5 129 11.3 21.2 1.0 91.2 74.0 6 123 9.3 25.7 13.6 92.4 60.5 7* 240 105 19.3 1.6 56.3 47.5 8* 129 39.7 6.3 28.1 69.2 42.6
------- ---- _,. ______ - ...... _____ - ____ ., _______ --------* Unbalanced results because of altering influent concentration.
47
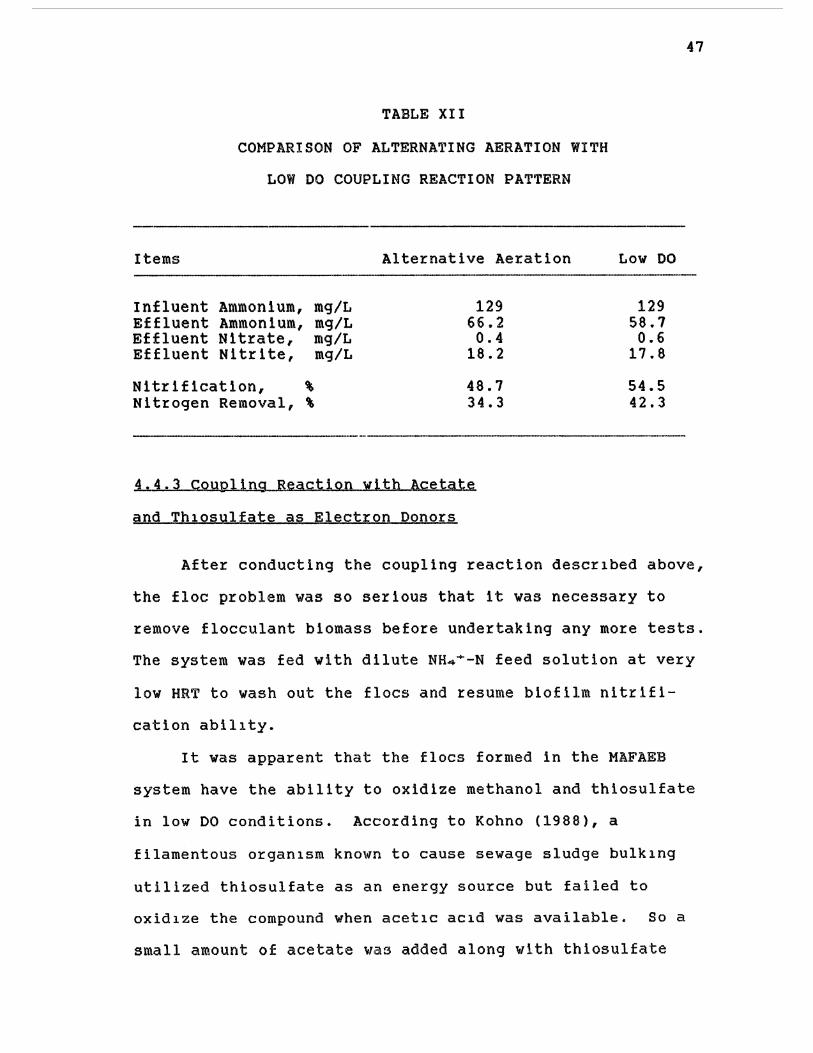
TABLE XII
COMPARISON OF ALTERNATING AERATION WITH
LOW DO COUPLING REACTION PATTERN
Items Alternative Aeration Low DO
Influent Ammonium, mg/L 129 129 Effluent Ammonium, mg/L 66.2 58.7 Effluent Nitrate, mg/L 0.4 0.6 Effluent Nitrite, mg/L 18.2 17.8
Nitrification, % 48.7 54.5 Nitrogen Removal, \ 34.3 42.3
4.4.3 coupling Reaction with Acetate
and Th1osulfate as Electron Donors
After conducting the coupling reaction descr1bed above,
the floc problem was so serious that it was necessary to
remove flocculant biomass before undertaking any more tests.
The system was fed with dilute NH4•-N feed solution at very
low HRT to wash out the floes and resume biofilm nitrifl-
cation abil1ty.
It was apparent that the floes formed in the MAFAEB
system have the ability to oxidize methanol and thiosulfate
in low DO conditions. According to Kohno (1988), a
filamentous organ1sm known to cause sewage sludge bulk1ng
utilized thiosulfate as an energy source but failed to
oxid1ze the compound when acet1c ac1d was available. So a
small amount of acetate wa3 added along with thiosulfate

1
1
_J ....... 1 0)
E r::: 0
tti "-
oj.-1
c. (1;1 c:;J c:: Cl (.)
Low D 0. Alternating Aeration Reaction Patern
~ Influent Ammonium §§§ Effluent Ammonium B Effluent Nitrate
D Effluent Nitrite ~ N itrificarton ~ Nitrogen Removal
Figure 6. COMPARISON OF REACTION PATIERNS
{low D 0 and alternating aeration)
100
90
80
70 '#. tl)
60 td 0:
50 c:::: .o
40 e! g:
30 c::: 0
(.)
20
10
0

49
(Table VI) and used as electron donors in the next series of
coupling reaction experiments. The results are listed in
Table XIII, and Figures 7 and 8.
TABLE XIII
COUPLING REACTION WITH THIOSULFATE
AND ACETATE AS ELECTRON DONORS
----- ...... ____ Day
Item 1 2 3 4 5 6 7 ----- -----
Influent Ammonium, mg/L 212 212 219 219 219 234 234 Effluent Ammonium, mg/L 14.4 22.2 31.5 57.3 63.8 70.5 80.8 Effluent Nitrate, mg/L 0 0.6 0.9 1.2 1.7 1.4 1.5 Effluent Nitrite, mg/L 82.8 80.9 83.7 63.8 72.0 66.8 65.2
Nitrification, % 93.2 89.5 85.1 73.8 70.9 69.9 65.5 Nitrogen Removal, % 54.2 51.1 45.2 44.2 37.2 40.7 37.0 Denitr. of Available
N02--N & No3--N, % 58.1 57.1 53.1 59.8 52.5 58.3 56.5
Loading Rate, g/L-D 3.08 3.08 2.97 3.75 3.56 3.44 3.44 N-Removal Rate, g/L-D 1.67 1.57 1.32 1.67 1.33 1.40 1.27
When thiosulfate was removed from the feed solution
after the above test, nitrification efficiency recovered,
and nitrogen removal rate dropped. After reaching a new '
steady state level, a comparison between coupling reactions
with or without- adding thiosulfate can be seen, as shown in
Figure 9. Figure 9 shows that nitrification efficiency was
somewhat greater in the absence of thiosulfate. At the same
time, thiosulfate also was util1zed as electron donor in the
denitrification process of the coupling reaction.

...J ........ 0')
E
25
20
c 15 0 tg """"+""'
§ 10 0 c: 0 u
5
1
,..-- ............ ~ ----------, ---~--------., ... ... ··-··---------..... ... ... ..,.. --- .....
---------- -G -------- -[3'"' ~--~ ..... , ........ . '""'~- -----8---- ..... ;;w.··-
.... ..... ............ ~ ........... ~-···-·· .........
••• ••• .. ~---- ~········ ....... 11.,!-r!::l--------. •••••••••Me•••-•• ~
5
45
4
35
3
2.5
2
1 5
1
0.5
--~·~---....................... i:"""' ......................................... ....,. •• ~ ............................ .::.::..:-··""""'·""::..:..:,·-~-------- .. ----- ... ............. 0 2 3 4 5 6 7
Time, day
. ...,.._ Influent Ammonia '"*" · Effluent Ammonia -•- Efflr.Jent Nitrate - EJ- Effluent Nitrite .. • Loading rate
Figure 7 COUPLING REACTION WITH MAF AEB SYSTEM
(thiosu~ate and acetate as electron donors [1])
0 ..J ........ C)
af 1a lo.Q
0) c:
ai 0
...J
U1 0

9
8 ....I -.. 0)
E c: 0
"ta s... ...... c: 4 0) Q c: 3 0 ()
2
1
1
············· ....... ............. ·····•················· ·················~················-~··········· ············~············ ' ........ , ..
-···-·~················:~ --- .......... . ------- .. - ... _ ... ,....... • ......... ;tf4p ......... . ------.. _, ...... . ... QI&,....... . ......... . ...... ..- ..... ~ _.-
--~-- -,.--------------~---
2
-+- N itrHication
-M- Loading Rate
3 4 Time, day
5 6
• ·~ •· Nitrogen A emoval · '* · D enitr. of ND;;: -a-· Removal Rate
. Figure 8 COUPLING REACTION WITH MAFAEB SYSTEM
(thiosu~ate & acetate as electron donors [2])
4
35
,3
2.5
2
1.5
1
05
0 7
0 ..J -.. 0')
.ei ~ 0') 1: ·-~ _g
l11 ....

Nitrification Nitrogen Removal Denitr. of No;
~ With thiosulfate ~~I Without thiosulfate
Figure 9. COMPARISON OF COUPLING REACTIONS
(with or without adding sodium thiosu~at:e)

53
4.4.4 Coupling aeaction with ThlosulfatLe
as Electron Donor
Subsequent experiments were performed using only sodium
thiosulfate as electron donor for the coupling reaction.
The thiosulfate addition was from 273 - 1275 mg/L. The
results are shown in Table XIV, and Figures 10 and 11.
TABLE XIV
COUPLING REACTION WITH SODIUM THIOSULFATE
AS ELECTRON DONOR
Thiosulfate, mg/L 273 563 850 1275
Influent Ammonium, mg/L 50 100 150 151 Effluent Ammonium, mg/L 9.5 39.4 48.3 72.5 Effluent Nitrate, mg/L 10.9 15.6 23.2 14.8 Effluent Nitrite, mg/L 17.7 22.6 48.4 31.7
Nitrification, % 81.0 60.6 67.8 51.7 Nitrogen Removal, % 23.8 22.4 20.1 20.7 Denitr. of Available
NO::z--N & NOo--N, % 29.4 37.0 29.6 40.0 Loading Rate, g/L-D 2.02 2.84 4.23 4.23 N-Removal Rate, g/L-D 0.48 0.64 0.85 0.87
------------------------------
4.4.5 Coupling React1on with Acetate
as Electron Donor
In the next experimental series, the effect of using
only sodium acetate as electron donor for the coupl1ng
reaction was tested. The acetate addition was from 375 mg/L

1
273 563 850 1275
Thiosulfate Concentration, mg/L
~ Influent Ammonium §§§ Effluent Ammonium Effluent Nitrate
D Effluent Nitrite ~ Loading Rate
Figure 1 0. COUPLING REACTION WITH MAF AEB SYSTEM
(thiosuWate as electron donor, [1])
4 0 ...J ~ 35
3 0)
2.5 .5 ~ 2 0 _J
15 E :::l c::
1 0 E
05 E <

.....I --.. Ci)
E
1 0
h---------------------------------------------------~45 ~
273 563 850 1275
Thiosulfate Concentration, mg/L
~ Nitrification
D Loading Rate
E§§1 Nitrogen Removal ~~~~~ Denitr. of NO x ~Removal Rate
Figure 11 COUPLING REACTION WITH MAFAEB
(thiosuffate as electron donor [2])
0') . 4 .ea
ttl 0:: 3.5
~ 3 E
25 ~ o6
2 C) c:
1.5 -g .9 E
1 :::::;
05 c: 0 E
~

to 1875 mg/L. The results are found in Table XV, and
Figures 12 and 13.
TABLE XV
COUPLING REACTION WITH'SODIUM ACETATE
AS ELECTRON DONOR
Acetate, mg/L 375 750 1125 1500
Influent Ammonium, mg/L 221 226 222 222 Effluent Ammonium, mg/L 27.1 36.6 59.2 117 Effluent Nitrate, mg/L 4.3 2.1 2.8 0.7 Effluent Nltrite, mg/L 139 93.2 91.4 47.9
Nitrification, % 87.7 83.8 73.3 47.3 Nitrogen Removal, % 22.9 41.6 30.9 25.4 Denitr. of Available
N02--N & NO::;,--N, % 26.1 49.7 42.1 53.7 Loading Rate, g/L-D 3.16 3.23 3.18 3.18 N-Removal Rate, g/L-D 0.73 1.35 0.98 0.81
--------·
Comparing Tables XIV and XV, acetate is a more
efficient electron donor for the denitrification in the
56
1875
222 136 0.3
12.3
38.7 33.1
85.3 3.18 1.05
coupling reaction. Figure 13 and Table XV show that there
is a maximum nitrogen removal at sodium acetate con-
centration of 750 mg/L without seriously decreasing the
nitrification rate, so this condition was selected to run a
long term test, which lasted for 40 days. The results of
this 40-day MAFAEB trial are given in Table XVI, and
F1gures 14 and 15.

20 .....J -... 0)
E c 15 0 .td I--+-' c 10 (]) 0 !:: 0 u
5
375 750 11 25 1 500 1875
NaAc Concentration, mg/L
~ Influent: Ammonium ~ Effluent Ammonium B Effluent Nitrate
Figure 12 COUPLING REACTION WITH MAFAEB
(sodium acetate as electron donor. [1 ])

1
375
~ N~rification
fm Loading Rate
750 11 25 1 500 1875 NaAc Concentration~ mg/L
~ Ntrogen Removal ~~~~~ Denitr of NO ~
~ Removal Rate
Figure 13. COUPLING REACTION WITH MAFAEB
(sodium acetate as electron donor [2])
4.5 0
4 _J ..._ 0)
35 !9 ro 3 a:
25 ~ 0 E
2 Q) cc
1.5 "0 c ttl
1 0) c ·-"0
0.6 ['fj
.9 0

TABLE XVI
MAFAEB COUPLING REACTION GENERAL CONDITIONS AND RESULTS
(VALUES CALCULATED FROM FOURTH DAY
THROUGH THE END OF THE TEST)
Item
Static Bed Volume, Bed Expansion Rate, Recycle Rate, Substrate Flow Rate, HRT,
Influent NH4+-N, Effluent NH4+-N, Influent No::a--N, Effluent NO::a--N, Influent N0.2--N, Effluent N0.2--N,
mL \ L/D L/D Hrs
mg/L mg/L mg/L mg/L mg/L mg/L
Nitrification Efficiency, % Nitrogen Removal Efficiency, \ Denitrification Efficiency
of Available N02--N & No::a--N, %
Loading Rate, Removal Rate,
Influent pH, Effluent pH,
Influent DO, Effluent DO,
Influent COD, Effluent COD,
g NH""'+-N/L-D g NH...,+-N/L-D
mg/L mg/L
mg/L mg/L
Influent Alkalinity, mg as CaCO::a/L Effluent Alkalin1ty, mg as caco~/L
Effluent TSS, Effluent vss,
Attached VS, Entrapped VS,
mg/L mg/L
g VS/L static bed g VS/L stat1c bed
t Five days accumulated sample. tt Include M1tr1te COD 89.7 mg/L.
Data
250-255 100 1350 3.43 ± 0.05 1.77 ± 0.03
222.0 ± 0.8 61.5 ± 6.5 undetectable 6.9 ± 1.3 undetectable 83.3 ± 6.4
72.3 ± 3.0 31.7 ± 1.8
44.2 ± 2.7
3.00 ± 0.04 0.95 ± 0.06
7.75 7.3
no control 2.06 ± 0.19
390 155 * ** 1164 252 *
61 * 51 * 27.8 4.21
59

250.---------------------------------------------------------~ 5
_.J ....... 01 E
20
c:: 15 0
~ I-.
e lXI 1 OCt-o c. Ct Ct
5
0 5 10 15 20 Time, day
25 30
--+- Influent Ammonia --*- Effluent Ammonia -lk Effluent Nitrate
- EJ- Effluent Nitrite ....... Loading rate
Figure 14 COUPLING REACTION WITH MAFAEB SYSTEM
(w~h acetate as electron donor. long term [1])
4.5
4
3.5
3
2.5
2
1 5
1
05
0 35 40
0 ~ ....... 0')
.si ~ C') c ·-"C co .9
en 0

100
90
80 f. 70 or co 60 a: c: 50 0
"U,i lo... 40 OJ > c: 0 u 30
20
10
0
4.5
4
3.5
3
25
2
1.5
1
0.5
+------r------~-----r------~----~----~------~-----+0 0 5 10
-+- Nitrification
~Loading Rate
15 20 Time, day
25 30
··*Eo·· Nitrogen Removal-k Denitr of NOx
- • · Removing Rate
FigtJre 1 5. CO UP LING REACTION WITH MAFAEB SYSTEM
(with sodium acetate as electron do11or. long term [2])
35 40
0 ...J ............ C)
or ta cc
~ E CD cr.:
ai!!i 0) c:
~ 0 _J
z

62
The flow rate, hydraulic retention time, concentrations
of all the nitrogen forms, conversion ratios, loading and
removing rates and effluent DO were calculated at 95\ of
confidence intervals. Effluent COD, alkalinity, total
suspended solids and volatile suspended solids were measured
from a 5-day accumulated sample. Influent concentrations
were measured with sam~les freshly made.
During the long term test, the pH of the influent and
effluent was very steady. DO was controlled by adjusting
the aeration rate to the aeration bottle and adjusting the
air bubbles introduced into the reactor.
The alkalinity consumption of coupling reaction and
nitrification were measured and listed in Table XVII. The
COD consumptions of coupling reaction with sodium acetate as
electron donor and denitr1f1cation with methanol as electron
donor were also measured, and the results listed in Table
XVIII.
TABLE XVII
ALKALINITY CONSUMPTION FOR COUPLING
REACTION AND NITRIFICATION
________ , ______ -----------·----------Nitrification Coupl1ng
Reaction -------------------- - ----·- -··---·-- -···----Alkalinity
mg as CaCO::'I/L NH ..... --N
mg/L
mg HCO::-)-/mg NH4+-N ··------
Influent Effluent Influent Effluent
3780 407 542
48.5
6.83
1164 252 220 51.5
5.40 -----------------------------------------

TABLE XVIII
COD CONSUMPTION FOR DENITRIFICATION
AND COUPLING REACTION
Denitri-fication
COD Influent 5300 mg/L - Effluent 285
No!3--N and/or Influent 1509 No.:.:--N mg/L Effluent 0
mg COD/mg No4--N or NO::a--N 3.32
*After correction for each mg of N02--N consuming 1.1 mg COD.
63
------Coupling Reaction
390 155
168.3 90.8
4.19* -----
DO had a very subtle influence on the coupling
reactions. Since DO could not be strictly controlled during
this experiment, the DO values used for analysis are only
rough estimations from several readings taken during a day.
The results shown in Table XIX were calculated at 95%
confidence interval. The whole DO range in the last 36 days
of the long term test was divided to three categories (high:
2.8- 2.2, middle: 2.1- 1.8 and low: 1.7- 1.4 mg/L). Two
population T-test and F test were used to test if there were
significant differences of the means of the nitrificat1on
efficiency and the nitrogen removal rate between high DO and
middle DO, and between middle DO and low DO (Appendix).
' These results should be 1nterpreted as an indication of
react1on behav1or only. More str1ct DO control means snould
be adopted in further studies of this factor.

64
4.5 Nitrification Recovery in MAFAEB System
After conducting coupling reaction or denitrification
experiments, the system was purged of excess floes as
described prev1ously. During the recovery process, the
nitrification rate was tested. Table XX and Figure 16 show
that full nitr1fication ability was closely approached
within 5 days.
TABLE XIX
COMPARISON OF INFLUENCES BY DIFFERENT DO
----DO, mg/L
Item 2.59±0.20 1.94 ±0.06 1.57±0.09
Influent Ammonium, mg/L 222.9±1.4 221.9±2.0 221.1±0.8 Effluent Ammonium, mg/L 52.5±10.6 59.1±5.4 73.6±12.4 Effluent N1trate, mg/L 8.9±2.2 7.1±2.1 4.3±1.4 Effluent Nitrite, mg/L 96.1±11.7 81.5±4.2 70.7±7.3
Nitrification, % 76.4±4.7 73.4±2.5 66.7±5.7 Nitrogen Removal, % 129.3±2.3 33.4±1.6 32.8±4.5 Loading Rate, g/L-D 2.97±0.06 2.98±0.07 3.06±0.09 N-Removing Rate, g/L-D 0.87±0.07 1.00±0.06 1.00±0.14
--·------
TABLE XX
NITRIFICATION RECOVERY IN MAFAEB SYSTEM
____ .. __ Time, day
Item 1 2 3 4 5 ---- .. _ .. , .. ---- ----.. --.. Influent Ammon1um, mg/L 151 146 146 146 151 Effluent Ammonium, mg/L 73.5 46.5 28.4 24.3 18.4 Effluent Nitrate, mg/L 6.3 8.1 8.8 7.1 10.7 Effluent Nitr1te, mg/L 60.9 75.8 94.9 98.8 110.1
Loading Rate, g/L-D 4.34 4.34 4.34 4.34 4.34 Nitrification, % 51.3 68.2 80.6 83.4 87.8 ---

16
14
-I 12 ..._ 0)
E 10 -c:
0
ta ..... 8 ...... c:: CD 6 0 c: 0 u 4
2
1
... ...... ..... ......
,. ... ...... .......
,. ...
........... ........ ••• .. •:....-~ .....
---------_____ .. __
...... ..... ..... ..... ........
........ , ...... ........... ...... ~ ~···························~
-------------
........................... ,. _A_ ..A. __._. --------------------~------~------~------------~~-~-~--
1 5 2 2.5 3 Time. day
35 4
-+- Influent Ammonium··*-·· Effluent Ammonium -6: Effluent Nitrate
-a- Effluent Nitrite -111- • Nitrffication A ate
Figure 1 e MAFAEB NITRIFICATION RECOVERY
(at loading rate of 4. 34 giD ·L)
45
100
90
80
70
eo 50
40
30
20
10
0 5
'1. c: 0
~ 0
tt= "i:.: ±: z
en U1

CHAPTER V
DISCUSSION AND CONCLUSIONS
5.1 Simultaneous Growth of Autotrophic
and Heterotrophic Denitrifiers
Both autotrophic and heterotrophic denitrifiers
developed active b1ofilm populations when they were accli
mated together in this research. However, in the presence
of different electron acceptors, their contributions to the
denitrification were different. Table VII shows that when
nitrite was used as electron acceptor, both thiosulfate and
methanol were utilized more effectively than when nitrate
was used as electron acceptor. With nitrate, the contri
bution of thiosulfate to den1trificat1on was very lim1ted,
and the reaction consumed more electron donors with n1trate
as electron acceptor than with nitrite. This may support
the suggestion that the shortened pathway of nitrite
reduction will save energy sources.
5.2 Nitrification with MAFAEB System
After only 24 days of accl1mation for the n1trif1ers
added to the denitrifying attached films, the system demon
strated steady state nitrification ability. A comparison of
the nitrification results of this experiment with Collins
66

67
et a1.(1991) and zeng (1992) is shown in Table XXI. The
nitrification efficiency in this experiment was slightly
lower than that obta1ned by Collins et al. (1991) at h1gher
loading rates, but comparable to that of Zeng (1992). This
nitrification capacity is significant in light of operat-
ional factors such as larger size of support media used in
this research and lower density of n1tr1£1ers in the
attached films.
TABLE XXI
COMPARISON OF NITRIFICATION RESULTS
Item Collins Zeng This et al. ( 1991) (1992) Experiment
Influent NH4 ... -N, mg/L 199 220 200 Conversion Rate, % 98 94.0 96.8 Loading Rate, g NH.:t ... -N/L-0 11.52 7.5 4.59 HRT, hours 0.41 0.77 1.05
Reactor Type AEB AEB MAFAEB Med1a Particle Size, mm 0.4-0.6 0.2-0.6 1-3 Attached VS, g VS/L Bed 42.5 46.7 27.8* Bed expansion % 62 60 100
---------------- --------* Includes nitrifiers and denitriflers.
5.3 Denitrification with MAFAEB System
After aeration was stopped and feeding with nitrate
resumed, the MAFAEB system restored steady state denitrifi-
cat1on in a few days. The data from Table X show that the
den1trif1cat1on eff1ciency of th1s system was extremely
high.
Table XXII shows a comparison of experimental results

68
with other heterotrophic denitrification results. Since the
main objective of this research is not to determine maximum
denitrification rates, the results of this experiment listed
in the table are only representative reasonable rather than
maximum loading rates. From Table X and Figure 5 we can
anticipate the maximum loading rate may be even higher.
TABLE XXII
COMPARISON OF DENITRIFICATION RESULTS
Item
Influent No3--N,
Jeris et al. (1975)
Miyaji et al. (1975)
mg/L 21.5 900 HRT, Hrs 0.11 3.8 Loading Rate,
gNo3--N/L-D* 5.42 6.5 Removal Rate, gNo3--N/L-D* 5.37 6.38
Conversion Rate, % 99.0 98.6
Reactor Type FLUIDIZED UASB Media Particle Size,
mm < 0.6 Organ1c Substrate METHANOL WASTE Attached vs,
gVS/L Bed 30-40 Bed Expansion, % 100 ---·--·--------
Clarkson et al.
(1992)
934 3.4
6.54
6.16 94.2
AFEB
0.2-0.6 METHANOL
82 15-20
* g No3--N/per liter of expanded bed per day.
This Experiment
544 1.86
7.15
6.99 99.6
MAFAEB
1-3 ACETATE
27.8 100 -------
It was found that when returning the system from
nitrification or coupling reaction to denitrification, some
attached f1lm particles floated on the l1qu1d surface and {
tended to be washed out. Sludge particles floated due to
entrapped gas, indicating that denitrification occurred in
the inner layer of the particles. This phenomenon dis-

69
appeared after a couple of weeks, but the previously smooth
attached blofllm surface became spiky or fuzzy at this time.
Although these phenomena occurred during operation as a
denitrification reactor, it may suggest that during the
coupling reaction, the denitrifiers not only attach and grow
in the inner layer of the particles, but also attach with
nitriflers on the outer layer, to form thoroughly mixed
rather than layered attached films only.
5.4 Alternating Aeration
Table XII shows that alternating aeration for coupling
reaction is not as efficient as the system operated under
constant low DO conditions. Although much of the operating
cycle was devoted to denitr1fication, its conversion rate
still lagged behind that of nitrification. This may suggest
that denitrification recovery from aerobic conditions is not
as fast as nitrif1cat1on from anoxic condit1ons.
5.5 Inhibition Effects
Methanol and th1osulfate were reported to have
inhibitory effects on nitrification (Beccari, 1980; Hooper
et al., 1973). Throughout this experiment both nitrifi
cation and denitrification seemed to be inhibited. Acetate
was fed to the system due to its lack of inhibition effect
on n1trification. However, its effect on the coupled
react1on rates was very s1milar to that of methanol and
thiosulfate. Some other mechanisms must have been 1n action.

70
All the electron donors added to the reactor were
favored by denitrifiers at anoxic conditions. If only
nitrification were inhibited, when a large amount of
electron donor was added to the coupling reaction, there
should have been no n1trate or nitrite left in the effluent.
However, Tables XIV and XV show that when concentrations of
electron donors were increased, both nitrification and
denitrification were slowed. At the same time, tremendous
floes accumulated in the reactor and the aeration bottle.
Considering the large recycle rate utilized, the effects of
inhibition should not be so large. All of this suggests
that the nitrif1cation rate was likely not affected by
inhibitors, but by low oxygen content, which was caused by
co-oxidation of the electron donors added for denitrifi
cation. Oxidation of those substrates competed for oxygen
with ammonia oxidation. At the same time, the availability
of electron donors to the denitrifiers was also depleted.
5.6 DO Effects
Th1s system lacked means to strictly control DO. The
DO in this experiment was controlled by adjusting the
aeration rate and adjusting the amount of air bubbles intro
duced into the reactor through recycle tubing.
It was found that when DO 1n the upper end of the
reactor was much higher than about 2.0 mg/L, nitrification
improved, but denitr1fication was slowed, result1ng in an
overall reduction of nitrogen removal. Conversely, when DO

was set too low, n1tr1£1cat1on was seriously inhibited and
the availability of oxidized nitrogen forms was limited.
When DO was controlled around 2.0 mg/L, there was a
compensation between nitrification and denitrificat1on
(Table XIX). The results of statistical analyses results
(Appendix) support the above observations.
71
After running the experiment under this condition with
750 mg/L sodium acetate as an energy source for 40 days, the
system outputs remained reasonably steady (Figure 14, 15 and
Table XVI).
5.7 Contamination effects
The MAFAEB 1s an open system filled with mixed attached
organisms. When the system favored aerobic heterotrophic
conditions or sulfur-oxidizing conditions, they became
prominent in the reactor. At the beginning stage of the
coupling reaction experiments with newly acclimated, mixed,
attached f1lms, the coup1~ng reaction tended to be com
pletely balanced between nitrification and denitrification
at a low loading rate (Table XI, day 4). However, both
nitrification and denitrification conversion rates dropped
briskly as floes accumulated in the reactor and the aeration
bottle. This suggests that aerob1c organisms oxid1z1ng
methanol and th1osulfate predominated 1n the system. After
returning to only a nitrificat1on feed solution at small
HRT, the floes were washed out and coupl1ng reaction abil1ty
was resumed. However, in only a few days, contaminat1on

72
again predominated. To address this situation, the
concentration of energy sources were greatly reduced (much
less than stoichiometric needs of denitrifiers) in the rest
of the experiments.
By comparing the results in Tables XIII, XIV, and XV,
it is clear that acetate in the feed solution obstructed
thiosulfate oxidat1on. However, when the concentration of
thiosulfate was too high, inhibition to nitrification become
serious. At the same time, it was found that acetate could
be used as electron donor for denitrification in the
coupling reaction system, and there was a maximum nitrogen
removal rate at the acetate concentration of 750 mg/L.
The long term coupling reaction experiment (Figure 14
and 15) was conducted to demonstrate that the contamination
or co-oxidation problems could be controlled in the coupling
reaction. Although d1ff1culties existed for exactly
controlling flow rate and DO, the pH outcomes of the system
were extremely steady and no s1gnificant floes were
accumulated in the reactor. This indicate that as long as
the concentration of energy sources was kept low, a steady
state reaction could be reached and maintained with a
somewhat limited nitrogen removal rate.
5.8 Alkalinity and COD Consumption
Nitrification consumes large amounts of alkalinity,
while heterotrophic denitrif1cation produces alkal1nity.
Table XVII shows that alkalinity consumed per unit ammonium

73
conversion is 6.63 mg Hco~-;mg NH4+-N. Thls figure is much
lower than the theoretical value of 8.64 (Grady et al.,
1980), because the main product of nitrification in th1s
experiment was nitrite. During coupling reactions, the
alkalinity consumptions were even lower; only 5.40 mg
HCo3-/mg NH4+-N was consumed. The coupling reaction with
sodium acetate as electron donor and with 34.4% nitrogen
removal rate can save alkalinity by 20.9% compare with
nitrification.
The COD consumption for denitrification in the coupling
reaction should be lower because one reduction step is saved
in nitrogen removal. However, Table XVIII shows that total
COD consumption was higher instead of lower than that of
heterotrophic denitrificat1on. This also supports the con
clusion that part of the electron donor supply was oxidized
through aerobic competition.

CHAPTER VI
CONCLUSIONS
1. This research has shown that autotrophic and heterotro
phic denitrifiers can be attached together on support
media, and simultaneous growth can be achieved in both
batch acclimation and mixed attached growth. However,
their contr1butions to denitr1fication depend on what
kind of electron acceptor is available. When nitrite
was used as electron acceptor, both thiosulfate and
methanol were util1zed more effectively than with
nitrate as electron acceptor. When nitrate was used as
electron acceptor, the contribution from thiosulfate to
denitrification was very limited.
2. For denitrlfication, the electron donor requ1rement can
be lowered with nitr1te instead of nitrate as electron
acceptor. In the coupling reaction system, however,
COD consumption is higher than in denitrification,
apparently due to co-oxidat1on.
3. Nitrifiers can be easily attached onto an existing
attached den1tr1fying f1lm layer. The m1xed attached
films demonstrated both nitrification and denitri
fication abilities.
74

75
4. The MAFAEB system can be used for either nitrification
or denitrification purposes. The capacity for
denitrification of the system is much higher than that
for nitrification. At a loading rate of 4.59 g/L-D
(static volume), the nitrification efficiency was found
to be 96.8%, while at a denitrification efficiency of
99.6%, the loading rate was ~ 13.98 g/L-D (static
volume) . '
5. coupled nitrification and denitrification reactions can
occur in MAFAEB system. The DO should be maintained at
about 2 mg/L. Higher DO will sacrifice denitrification
with improvement of nitrification but reduction of
total nitrogen removal, while lower DO will sacrifice
nitrif1cation without 1mproving nitrogen removal.
6. Methanol, sodium thiosulfate, and sodium acetate can be
used as electron donors for operation in the coupling
reaction mode. Acetate affects thiosulfate oxidation.
At high concentrat1ons, all can be oxidized by
competing bacteria. When this occurs, nitrification
will be l1mited by a shortage of oxygen, while denitri
fication will be limited by a shortage of electron
donors.
7. Compared to pure nitrification or denitrification
operation, coupling reactions with sodium acetate as
electron donor (34.4% nitrogen removal rate) can save
alkal1n1ty by 20.9%. The total COD consumption per un1t
nitrogen removal in the coupling reaction is higher

76
than that in heterotrophic denitrification due to some
electron donors being oxidized through competing
aerobic reactions.
8. Contamination or co-oxidation problems are not destruc
tlve to coupling reaction. Steady state reaction can
be maintained at low electron donor concentrations.

CHAPTER VII
SIGNIFICANCE OF THE STUDY
This is the first effort of which the author is aware
to couple nitrification and denitrification through a
shortened pathway in a single mixed attached film aerated
expanded bed reactor. This investigation also included
simultaneous growth of autotrophic and heterotrophic
denitrifiers and utilization of the MAFAEB system in either
nitrification and denitrification mode.
This study demonstrated that coupl1ng reactions do
occur in a single MAFAEB reactor, and a steady state
reaction can be reached and mainta1ned as long as the
electron donor concentration is relatively low.
One poss1ble appl1cation of the results from this study
is attached film expanded bed denitrif1cation with mixed
autotrophic and heterotrophic denitrifiers. In th1s way,
both organic and inorganic electron donors can be util1zed.
If controlled well, no alkalinity adjustment will be
necessary.
Another possible usage is to develop attached
nitrifiers through first attaching denitrifiers on the
support med1a, then attach1ng nitr1fiers on the denitrifying
bacteria layer. In this way, much time and chemicals can be
77

saved.
Since this system can be used as both a nitrification
and denitrificat1on system, it may be used as an lnter
mediate stage between nitrification and denitrification
facilities where nitrogen must be totally removed. This
system can be used as a buffer to compensate the capacity
deficiency between the two facilities when waste charac
teristics or operat1ng conditions vary.
78
Where nitrification 1s mandatory while oxidized
nitrogen forms are not strictly regulated, and also some COD
is available in the wastewater, this system can be d1rectly
used to perform nitrification and part1al removal of
ox1dized nitrogen forms and COD. Thus such a process could
have a role in industrial pretreatment (particularly for
oxygen demand reduction).

CHAPTER VIII
FURTHER RESEARCH NEEDS
8.1 coupling Reaction in a
Strictly Controlled low DO MAFAEB System
The Results from this experiment demonstrated that
coupling nitrification and denitrification through a
shortened nitrite pathway is possible. However, there was
no means to strictly control DO throughout this research
period so that the optimized DO conditions and maximum
loading rate for coupling reaction could not be assessed.
If DO could be effectively controlled at exact values around
or lower than 2 mg/L all the time, and sufficient oxygen
could be supplied for nitrification, the control and extent
of the coupling reaction should be largely improved.
8.2 Coupling Redction
at Elevated Temperatures
This exper1ment was carr1ed out at room temperature.
During this per1od, the room temperature was 17 - 22°C. Due
to the heat released by nitrif1cation and denitrificat1on,
the temperature 1n the reactors was always 2 - 56 C h1gher
than the room temperature.
S1nce both nitrification and denitriflcation are
79

80
temperature dependent, reaction rates will be increased at
higher temperatures. The effects of temperature on coupling
reactions may deserve further investigation.
8.3 The Maximum Loading Rate
for Denitrification with MAFAEB
without Aeration,
When the MAFAEB was used without aeration to conduct
denitrification in this experiment, there was little reduc
tion of denitrification efficiency when the load1ng rate
reached 14 g No~--N/L-D stat1c volume. The attached biofilm
particles took on an irregular surface configurat1on. The
reasons for the extremely high denitrification capacity and
the deformation of the b1ofilm particles deserve further
investigations.
8.4 Nitrification with MAFAEB System
Diff1culties 1n develop1ng attached films for n1tr1-
fiers were encountered throughout this experiment. One
possible solution is to attach other organisms, for example,
heterotroph1c den1trif1ers which tend to be eas1er to attach
on support media, before acclimating nitrifiers onto the
same media.
The nitrif1cat1on efficiency of the n1trif1ers
developed 1n this experiment 1s lower than that of Coll1ns
et al. (1991) and Zeng (1992) obtained from AEB reactors.
However, this lower efficiency was obtained from a short
61
term acclimation and short period of experiment. Long term
acclimation and nitrification experiment may be needed to
verify the maximum loading rate under reasonably high nitri
fication efficiency in a mature system.
8.5 Other Possible Usages
of the MAFAEB Sy~tem
Since nltrifiers are much easier to attach on the
denitrifying blofilm layer than on the bare media surface
itself, other organ1sms may also have this property. The
versatility of this system will allow reactions to occur
under aerob1c or anaerobic cond1tions at different energy
levels by changing electron acceptors. After specialized
acclimation, other aerobic, anaerobic, or facultat1ve
organisms may be developed on this system. If energy and
nutrient conditions favor biodegradation of some particular
substances, for example, TCE, pesticides or herbicides,
those reactions may also be conducted 1n this type of
system.

REFERENCES
Anthonisen, A.C., Loehr, R.C., Prakasam, T.B.S. & Srinath, E.G., Journal Water Pollut1on Control Federation, 48,835,1976.
APHA, AWWA & WPCF, standard Methods for the Examination of Water and Wastewater, 16th Ed, American Public Health Association, Washington, DC., 1985.
Barnes, D. and Bliss, P.J., Biological Control of Nitrogen 1n wastewater Treatment, E. & F.N.Spon, New York & London, 1983.
Batchelor, B. and Lawrence, A.W., Journal of water Pollution Control Federation, 50, 1986, 1978.
Beccari, Environmental Technology Letters, 1, 245, 1980.
Benefield, L.D. and Randall, c.w., Biological Process Design for Wastewater Treatment, Prentice-Hall, Englewood Cliffs, New Jersey, 1980.
Bliss, P.J., Barnes, D. and Windschuttel, B.A.,Proceedings of Ninth Federal Convention, Australian Water & Wastewater Association, Perth, April, 1-12, 1981.
Boon, B. and Laudelout, H., Biochemistry, 65, 440, 1962.
Clarkson, w.w., Fermentation of Particulate Organic Matter to Methane 1n A Thermophi1lc Anaeroblc Attached F1lm Expanded Bed Reactor (Ph.D. Thesis), Cornell Un1versity, 1986.
Clarkson, W.W., Ross, B.J.B. and Krishnamachar1, s., Denitrification of High-Strength Industry Wastewaters. Paper presented at the 45th Ind. Waste Conference, Purdue Univ., W. Lafayette, Ind., 1990.
Coll1ns, A.G., Clarkson, W.W. and Florio, S.A., Research Journal of water Pollution Control Federat1on, 63, 60, 1991.
Environmental Protect1on Agency, Process Des1gn Manual for Nitrogen Control, U.S.E.P.A., Cincinnati, Ohio, 1975.
82

83
Geraats, S.G.M., Hooijmans, C.M., van Niel, E.W.J., Robert son, L.A., Heijnen, J.J., Luyben, K.Ch.A.M. and Kuenen, J.G., Biotechnology and Bioengineering, 36, 921, 1990.
Grady, C.P.L., Jr. and Lim, H.C., Biological Wastewater treatment: Theory and Applications, Marcel Dekker, Inc. New York and Basel, 1980.
HACH Company, HACH Water Analysis Handbook, 2nd Ed., 1992.
Hamer, G.,Egli, Th. and Snozz1, M., Exper1ent1a, 45, 1070, 1989.
Hanaki, K., wantawin, c. and Ohgaki, s., Water Research, 24, 297, 1990.
Hooper, A. and Terry, K., Journal of Bacteriology, 115, 480, 1973.
Jeris, J.S. and Owens, R.W., Journal Water Pollut1on Control Federation, 47, 2043, 1975.
Jeris, J.S., Owens, R.W., Hickey, R. & Flood, F., Journal Water Pollution Control Federation, 49, 816, 1977.
Jewell, W.J., in Cooper, P.F. & Atkinson, B. (Ed), Blological Fluidized Bed Treatment of Water and Wastewater (p 251), Ellis Horwood Limited, West Sussex, England, 1981.
Jones, W. L., Schroeder, W.O. and Wilderer, P.A., Research Journal of the Water Pollution Control Federation, 62, 259, 1990.
Knowles, G., Downing, A.L. and Barrett, M.J., Journal of General M1crobioiogy, 38, 263, 1965.
Kohno, T., Water Science and Technology, 20, 241, 1988.
Krul, J.M., Journal of Applied Bacteriology, 40, 245, 1976.
Krul, J.M. and Veen1ngen, R., Water Research, 11, 39, 1977.
Marshall, R.O., D1shburger, H.J., MacVicar, R. and Hallmark, G.D., Journal of Bacter1ology, 66, 254, 1953.
McCarty, P.L., Beck, L. and St. Amant, P., Proc. Purdue Industr. Waste Con£., 24, 1271, 1969.
Meschner, K von and Wuhrmann, K., Pathology of M1crob1ology, 26, 579, 1963.
Miyaji, Y. and Kato, K., Water Research, 9, 95, 1975.

84
O'Neill, J.G. and Wilkinson, J.F., Journal of General Microbiology, 100, 407, 1977.
Painter, H.A., Water Research, 4, 393, 1970.
Paney, W.J., In: Denitrification, p.61, John Wiley & Sons, New York, 19 81.
Rhee, G.Y. and Fuhs, G.W., Journal of Water Pollution Control Federation, 50, 2111, 1978.
Robertson, L.A. and Kuenen, J.G., Archives of Microbiology, 139, 351, 1984a.
Robertson, L.A. and Kuenen, J.G., Journal of General Microbiology, 129, 2874, 1984b.
Robertson, L.A., Cornelisse, R., Zeng, R. and Kuenen, J.G., Antonie Van Leeuwenhoek., 56, 301, 1989.
Ross, B.J.B., High-rate Autotrophic Denitrification of Simulated Industrial Wastewater, M.S. Thesis, Oklahoma State University, 1989.
Schober!, P. and Engel, H., Archives of Microb1ology, 48, 393, 1964.
Sharma, B. and Ahlert, R.C., Water Research, 11, 897, 1977.
Simpk1n, T.J. and Boyle, w.c., Water Research, 22, 201, 1988.
Strand, S.E., McDonnell, A.J. and Unz, P.F., Water Research, 19, 335, 1985.
T1mberlake, D.L., Strand, S.E. and Williamson, J., water Research, 22, 1513, 1988.
Toml1nson, T.G., Boon, A.G. and Trotman, G.N.A., Journal of Applled Bacteriology, 29, 266, 1966.
Turk, 0. and Mavin1c, D.S., Canadian Journal of C1vil Engineering, 13, 600, 1986.
Turk, o. and Mavinic, D.S., Environmental Technology letters, 8, 419, 1987.
Turk, o and Mavinic, D.S., Journal of Water Pollution control Federation, 61, 1440, 1989.
Zeng, F., Effect of Nitrate on Nitrification of Concentrated N1trogenous Wastewaters in Rotating Biological Contactor and Aerobic Expanded Bed Reactors, M.S. Thesis, Oklahoma state University, 1992.
APPENDIX
TWO POPULATION T-TEST FOR NITRIFICATION
EFFICIENCY AND NITROGEN REMOVAL RATE
AT DIFFERENT DO CONCENTRATIONS
85

86
TITLE 'TWO POPULATION T-TEST FOR NITRIFICATION EFFICIENCY AT HIGH DO AND MIDDLE DO'; OPTIONS PS=60; DATA TTEST; INPUT POPULATION$ NITRIFICATION EFFICIENCY; CARDS; HIGH 80.00 HIGH 78.35 HIGH 78.57 HIGH 68.62 HIGH 82.50 HIGH 83.35 HIGH 64.84 HIGH 78.50 HIGH 66.82 HIGH 82.82 MIDDLE 77.14 MIDDLE 74.11 MIDDLE 74.95 MIDDLE 76.59 MIDDLE 74.80 MIDDLE 70.68 MIDDLE 70.45 MIDDLE 68.09 ; PROC TTEST;
CLASS POPULATION; VAR NITRIFICATION EFFICIENCY;
RUN;
TTEST PROCEDURE
Variable: NITRIFICATION EFFIEIENCY
POPULATION
HIGH MIDDLE
Variances
N
10 8
T
Mean
76.43700000 73.35125000
OF
Std Dev
6.98040917 3.23614161
Prob>ITI
0.2361
Std Error
2.20739920 1.14414884
Unequal Equal
1.2411 1.1502
13.3 16.0 0.2670 --> Fail to reJect,
no significant difference.
For HO: Variances are equal, F' = 4.65 OF = ( 9 I 7)
Prob>F' = 0.0550 --> Fail to reJect, no sign1ficant
difference.

87
TITLE 'TWO POPULATION T-TEST FOR NITRIFICATION EFFICIENCY AT MIDDLE AND LOW DO'; OPTIONS PS=60; DATA TTEST; INPUT POPULATION$ NITRIFICATION EFFICIENCY; CARDS; MIDDLE 77.14 MIDDLE 74.11 MIDDLE 74.95 MIDDLE 76.59 MIDDLE 74.80 MIDDLE 70.68 MIDDLE 70.45 MIDDLE 68.09 LOW 67.84 LOW 57.50 LOW 56.27 LOW 57.00 LOW 71.45 LOW 70.59 LOW 70.53 LOW 79.73 LOW 68.74 . , PROC TTEST;
CLASS POPULATION; VAR NITRIFICATION EFFICIENCY;
RUN;
TTEST PROCEDURE
Variable: NITRIFICATION EFFICIENCY
POPULATION N Mean Std Dev Std Error
LOW MIDDLE
9 8
66.62777778 73.35125000
8.02397622 3.23614161
2.67465874 1.14414884
Variances T DF Prob>ITI
Unequal -2.3112 10.8 0.0417 --> Reject, Equal -2.2093 15.0 0.0431 s1gnificantly
different.
For HO: Variances are equal, F' = 6.15 DF = ( 8 I 7 )
Prob>F' = 0.0270 --> ReJect, sign1£1cantly d1fferent.

TITLE 'TWO POPULATION T-TEST FOR NITROGEN REMOVAL RATE AT HIGH AND MIDDLE DO'; OPTIONS PS=60; DATA TTEST; INPUT POPULATION$ NITROGEN REMOVAL RATE; CARDS; HIGH 0.95 HIGH 0.85 HIGH 0.78 HIGH 0.77 HIGH 0.90 HIGH 0.69 HIGH 0.92 HIGH 0.83 HIGH 1.01 HIGH 1. 03 MIDDLE 1.13 MIDDLE 1.01 MIDDLE 0.89 MIDDLE 1.00 MIDDLE 1. 03 MIDDLE 0.94 MIDDLE 0.94 MIDDLE 1. 05 . , PROC TTEST;
CLASS POPULATION; VAR NITROGEN REMOVAL RATE;
RUN;
TTEST PROCEDURE
Var1able: NITROGEN REMOVAL RATE
88
POPULATION N Mean Std Dev Std Error:
HIGH MIDDLE
Variances
Unequal Equal
10 8
T
-2.8833 -2.7649
0.87300000 0.99875000
DF
15.7 16.0
0.10924488 0.07529703
P:rob>ITI
0.0110
0.03454627 0.02662152
0.0138 --> ReJect, sign1f1cantly different.
For HO: Va:r1ances a:re equal, F' = 2.10 OF = (9,7)
Prob>F' = 0.3388 --> Fail to :reject, no signif1cant
difference.

89
TITLE 'TWO POPULATION T-TEST FOR NITROGEN REMOVAL RATE AT MIDDLE AND LOW DO'; OPTIONS PS=60; DATA TTEST; INPUT POPULATION$ NITROGEN REMOVAL RATE; CARDS; MIDDLE 1.13 MIDDLE 1. 01 MIDDLE 0.89 MIDDLE 1.00 MIDDLE 1.03 MIDDLE 0.94 MIDDLE 0.94 MIDDLE 1. 05 LOW 0. 95 LOW 0.82 LOW 0.64 LOW 0.99 LOW 1.08 LOW 1.23 LOW 1.04 LOW 1. 24 LOW 1. 05 . , PROC TTEST;
CLASS POPULATION; VAR NITROGEN REMOVAL RATE;
RUN;
TTEST PROCEDURE
Variable: NITROGEN REMOVAL RATE
POPULATION N
LOW MIDDLE
Variances
Unequal Equal
9 8
T
0.0833 0.0796
Mean
1.00444444 0.99875000
DF
10.7 15.0
For HO: Variances are equal, F'
Std Dev
0.18888562 0.07529703
Prob>ITI
0.9351 --> 0.9376
= 6.29 DF
Std Error
0.06296187 0.02662152
Fall to reJect, no significant difference.
= ( 8 , 7 )
Prob>F' = 0.0253 --> ReJect, significantly different.

VITA
We1ping Xiao (Hsiao)
Candidate for the Degree of
Master of Science
Thesis: COUPLING NITRIFICATION AND DENITRIFICATION IN MIXED ATTACHED FILM AERATED EXPENDED BED SYSTEM
Major Field: Environmental Engineering
Biographical:
Personal Data: Born in Shanghai, P.R.Ch~na, June 18, 1952, the son of An-min Hsiao and Wan-q1ng Wu.
Education: Graduated from Dalian Institute of Light Industry, Dalian, P.R.China, in August 1982, with a Bachelor of Engineering Degree in Sugar Engineer1ng; completed requ1rements for the Master of Science degree at Oklahoma State University in December, 1992.
Professional Experience: Research Assistant and Teaching Assistant, School of Civil Engineering and Department of Agriculture Engineering, Oklahoma State University, August, 1991, to December, 1992; ~ood Engineer, Scient1f1c Research Institute of Food and Fermentat1on Industry, Beijing, P.R.Ch1na, August, 1982, to December, 1990.