Embed Size (px)
Citation preview

Integration of nitrification with denitrification for surface
water and groundwater treatment
Duc Toan Do
Master of Science (Water Resources Management)
A thesis submitted in partial fulfilment of the requirement of Master Degree
at Flinders University
Supervisor: Prof. Howard Fallowfield
School of the Environment
Adelaide, October 2016

i
Declaration
I certify that this thesis does not incorporate without acknowledgement any
material previously submitted for any degree or diploma in any university;
and that to the best of my knowledge and belief it does not contain any
material previously published or written by another person except where due
reference is made in the text.
Duc Toan Do
18/10/2016

ii
Acknowledgements
I would like to express my gratitude to my supervisor, Professor Howard
Fallowfield, for his constant enthusiasm, strong support, motivation and
guidance. Thank you for your faith in me. I know I have received lots of
encouragement from you during this project.
I feel grateful for the opportunity to study in Australia provided by the
Australia Government through the Australia Awards Scholarship. My great
gratitude also goes to all staff members at International Students Services
(ISS) Flinders University for their assistance and timely support during my
study.
To my fellows at the Health and Environment Group Laboratory, I thank you
for your encouragement, sharing and support even when I did not request it.
I have truly enjoyed the time with you and will not forget the memories
shared with all of you.
To my dear friends Hoang Anh, Mai and Ngoc Anh, I have always
appreciated your support and encouragement. I have been motivated by you
and thank you for being good listeners and even commentators.
Last but not least, I would like to convey my sincere thanks to my loving
wife, Linh, as well as my children, My and Nguyen Anh. You are both my
strong motivation and my support. I could not have completed this research
without your love.

iii
Table of contents
Summary ...................................................................................................... xii
1. Introduction ............................................................................................ 1
1.1. Background of Study ........................................................................ 1
1.2. Nitrogen ............................................................................................ 3
Nitrogen compounds .............................................................. 3
Nitrogen contamination .......................................................... 5
Sources of nitrogen ................................................................ 6
Health effects of nitrogen ....................................................... 6
1.3. Nitrification ...................................................................................... 7
Nitrifying Trickling Filters (NTFs) ........................................ 7
Autotrophic nitrification ........................................................ 8
Heterotrophic nitrification ...................................................... 9
1.4. Denitrification ................................................................................ 10
Heterotrophic denitrification ................................................ 10
Autotrophic denitrification ................................................... 11
1.5. Factors influencing nitrification and denitrification ...................... 12
1.6. Integration of nitrification and denitrification................................ 13
Single stage process ............................................................. 13
Separated stage process ........................................................ 15
1.7. Research Question .......................................................................... 16
2. Material and Methods .......................................................................... 18
2.1. Equipment and materials ................................................................ 18
Equipment ............................................................................ 18

iv
Materials ............................................................................... 18
2.2. Preparation ..................................................................................... 19
Water quality makeup .......................................................... 19
Nitrifying trickling filters (NTFs) ........................................ 20
NTF hydraulic loading rate .................................................. 23
Denitrifying design and operation ....................................... 25
2.3. Methods .......................................................................................... 25
Commissioning phase: Growing bacteria ............................ 26
Experimental phase 1: Defining the capacity of nitrification
and denitrification systems .................................................................. 28
Experimental phase 2: Measuring maximum capacity of the
nitrification system .............................................................................. 29
Experimental phase 3: Measuring maximum capacity of the
denitrification system ........................................................................... 29
2.4. Sampling and data analysis ............................................................ 29
3. Results .................................................................................................. 31
3.1. Quality of lake water ...................................................................... 31
3.2. Commissioning phase: Growing bacteria ...................................... 33
3.3. Experimental phase 1: Defining the capacity of nitrification and
denitrification systems ............................................................................. 41
Capacity of the nitrification system ..................................... 41
Capacity of the denitrification system ................................. 46
3.4. Experimental phase 2: Measuring maximum capacity of the
nitrification system .................................................................................. 50

v
3.5. Experimental phase 3: Measuring maximum capacity of the
denitrification system ............................................................................... 55
4. Discussion ............................................................................................ 58
4.1. Nitrifiers and denitrifiers development .......................................... 58
Substrate ............................................................................... 58
pH, DO and temperature ...................................................... 59
Nitrifiers development ......................................................... 61
Denitrifiers development...................................................... 62
4.2. Nitrification performances ............................................................. 63
4.3. Denitrification performances ......................................................... 68
Denitrification capacity ........................................................ 68
Organic carbon and spongy iron .......................................... 73
5. Integration of nitrification and denitrification model .......................... 78
5.1. Scenario .......................................................................................... 78
5.2. Hypotheses ..................................................................................... 79
5.3. Ammonium and nitrate removal units ............................................ 81
Nitrification unit ................................................................... 81
Denitrification unit ............................................................... 83
5.4. Limitation ....................................................................................... 84
5.5. Future improvement ....................................................................... 86
6. Conclusion ........................................................................................... 88
References .................................................................................................... 89

vi
List of Figures
Figure 1.1. The nitrogen cycle ...................................................................... 3
Figure 2.1. The schematic diagram of nitrification and denitrification
systems ......................................................................................................... 21
Figure 2.2. The schematic diagram of diluted activated sludge circulation in
the nitrification system................................................................................. 27
Figure 3.1. Influent ammonium, nitrate and nitrite nitrogen of the
nitrification system during Commissioning Phase ...................................... 35
Figure 3.2. Effluent ammonium, nitrate and nitrite of nitrogen the
nitrification system during Commissioning Phase ...................................... 35
Figure 3.3. Comparison between influent and effluent ammonium, nitrate
and nitrite nitrogen of the nitrification system during Commissioning Phase
...................................................................................................................... 36
Figure 3.4. Influent and effluent ammonium of the nitrification and
denitrification systems during Commissioning Phase ................................. 36
Figure 3.5. Comparison between influent and effluent nitrate and nitrite of
Column 1 of the denitrification system during Commissioning Phase ....... 37
Figure 3.6. Comparison between influent and effluent nitrate and nitrite of
Column 2 of the denitrification system during Commissioning Phase ....... 37
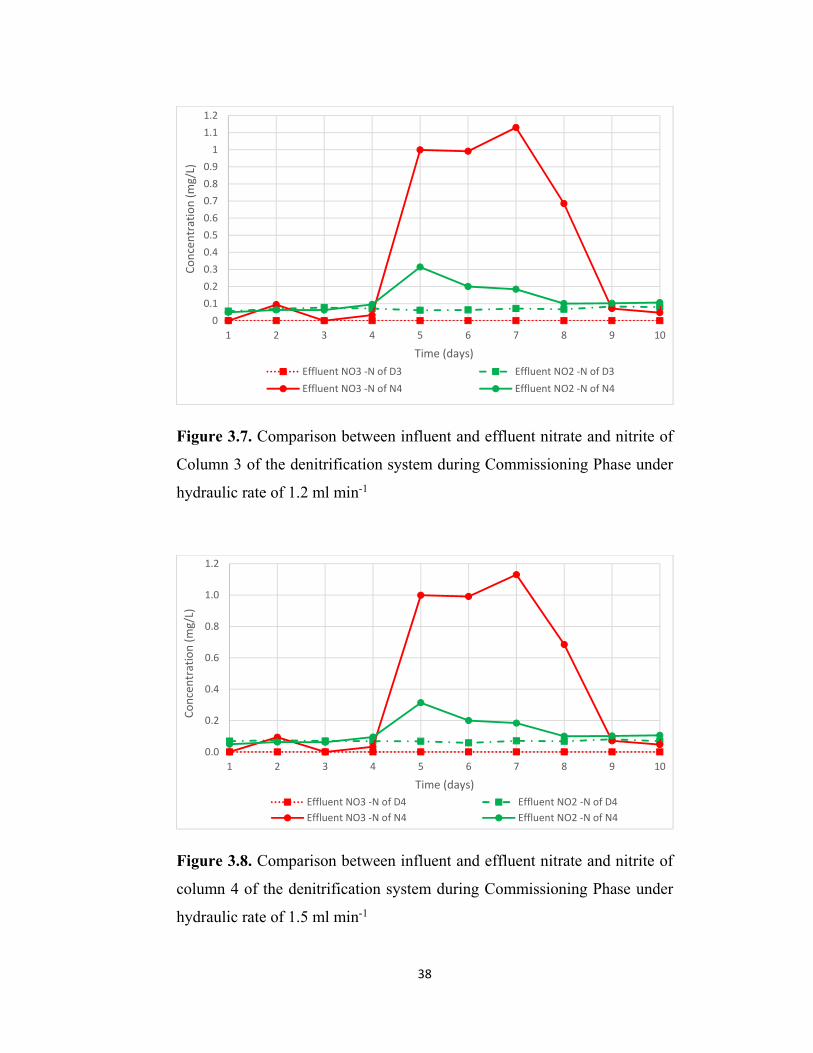
Figure 3.7. Comparison between influent and effluent nitrate and nitrite of
Column 3 of the denitrification system during Commissioning Phase ....... 38
Figure 3.8. Comparison between influent and effluent nitrate and nitrite of
column 4 of the denitrification system during Commissioning Phase ........ 38
Figure 3.9. Change in dissolved oxygen in the nitrification and
denitrification systems during the Commissioning Phase ........................... 39
vii
Figure 3.10. Change in inorganic carbon in the nitrification and
denitrification systems during the Commissioning Phase ........................... 40
Figure 3.11. Change in total organic carbon in the nitrification and
denitrification systems during the Commissioning Phase ........................... 40
Figure 3.12. Change in DO in the nitrification and denitrification systems
during the first stage of Phase 1 ................................................................... 42
Figure 3.13. Change in ammonium in the nitrification system during the first
stage of Phase 1 ............................................................................................ 43
Figure 3.14. Influent and effluent ammonium, nitrate and nitrite of the
nitrification system during the first stage of Phase 1 .................................. 44
Figure 3.15. Influent and effluent nitrate and nitrite of the denitrification
system during the first stage of Phase 1 ....................................................... 44
Figure 3.16. Change in inorganic carbon of the nitrification and
denitrification systems during the first stage of Phase 1 ............................. 45
Figure 3.17. Change in TOC of the nitrification and denitrification systems
during the first stage of Phase 1 ................................................................... 45
Figure 3.18. Influent and effluent ammonium, nitrate and nitrite of the
nitrification system during the second stage of Phase 1 .............................. 47
Figure 3.19. Influent and effluent ammonium, nitrate and nitrite of the
denitrification system the second stage of Phase 1 ...................................... 48
Figure 3.20. Influent and effluent ammonium, nitrate and nitrite of
denitrification Column 1 during the second stage of Phase 1 ..................... 48
Figure 3.21. Influent and effluent ammonium, nitrate and nitrite of
denitrification Column 2 during the second stage of Phase 1 ..................... 49
Figure 3.22. Comparison between influent and effluent ammonium during
Experimental Phase 2 ................................................................................... 51

viii
Figure 3.23. Influent and effluent ammonium, nitrate and nitrite of the
nitrification system during Experimental Phase 2 ....................................... 52
Figure 3.24. Influent and effluent nitrate and nitrite of the denitrification
system during Experimental Phase 2 ........................................................... 53
Figure 3.25. Change in IC of the both nitrification and denitrification
systems Experimental Phase 2 ..................................................................... 54
Figure 3.26. Change in influent and effluent nitrate and nitrite of the
denitrification system in Experimental Phase 3........................................... 56
Figure 3.27. Change in influent and effluent nitrate of the denitrification
system in a last day of Experimental Phase 3 .............................................. 57
Figure 4.1. Ammonium, nitrate and nitrite in the nitrifying reservoir during
the first stage of Experimental Phase 1 ........................................................ 65
Figure 4.2. Daily average converted ammonium mass 1 ............................ 66
Figure 4.3. Defining total converted ammonium mass 1 ............................ 67
Figure 4.4. Total ammonia nitrogen (TAN) and nitrate removal mass 1 ... 69
Figure 4.5. Ammonium and nitrate in the nitrifying reservoir ................... 70
Figure 4.4. Total converted and remain nitrate in a day of the denitrification
system in Experimental Phase 3 .................................................................. 72
Figure 4.5. Nitrate removal mass of groups in the denitrification system in
Experimental Phase 3 ................................................................................... 72
Figure 4.6. Change in total organic carbon in the denitrification system
during whole experiment ............................................................................. 76
Figure 4.7. Change in dissolved oxygen in the denitrification system during
whole experiment ......................................................................................... 77
Figure 5.1. Location of water source supplying the water treatment plant ....
...................................................................................................................... 78

ix
Figure 5.2. Relationship among loading Ammonium/Nitrate mass, media
and barley straw ........................................................................................... 80

x
List of Tables
Table 1.1. Overview of the nitrogen forms ................................................... 4
Table 2.1. Main equipment used in the study ............................................. 18
Table 2.2. Characteristics of TPK 312 polypropylene ................................ 23
Table 2.3. The descriptions of groups in the denitrification system ........... 25
Table 3.1. The quality of lake water before being used for the experiment ...
...................................................................................................................... 32
Table 4.1. Oxygen consumption for complete nitrification ....................... 60

xi
List of Plates
Plate 2.1. The nitrification and denitrification system ................................ 22
Plate 2.2. Structure of TPK 312 polypropylene .......................................... 23
Plate 2.3. Immersing polypropylene media in diluted activated sludge ..... 26

xii
Summary
With the growth of major cities led by the population boom over the world
and poor water catchment protection, surface water and groundwater sources
can be polluted by many substances, of which, ammonia is one of the primary
factors. While conventional methods for ammonia treatment using chlorine
present limitations during treatment processes, biological treatment solutions
are highly appropriate in efficiently removing contaminants such as
ammonia.
The study was conducted by an experiment at the lab-scale focused on the
integration of a nitrification system with a denitrification system to remove
ammonia and other nitrogen compounds in treatment surface water and
groundwater. The experiment was conducted in four phases including
bacteria development, primary defining capacity of nitrification and
denitrification systems, maximum capacity of the nitrification system and
maximum capacity of the denitrification system. The results revealed that the
nitrification system with hydraulic rate of 0.3 L min-1 can remove 83 mg
NH4-N day-1 with 4.88 m2 of polypropylene media. It corresponds to 17 mg
NH4-N m-2 day-1 of ammonium nitrogen surface load. Meanwhile, 716 mg
NO3-N day-1 was eliminated by the denitrification system with hydraulic rate
of 15 ml min-1 for Column 1 and 2 and 12 and 15 ml min-1 for Column 3 and
4 respectively.
A graph of the relationship among ammonium/nitrate mass, polypropylene
media volume and barley straw mass was created based on the results of the
experiment. The results contribute a basic foundation to select the suitable
model integrating a nitrification unit and a denitrification unit in removing
ammonium and nitrite in surface water and groundwater treatment.

1
1. Introduction
1.1. Background of Study
With the expanse of major cities led by the population boom over the world
and poor water catchment protection, water sources including both surface
water and groundwater have been affected by a deterioration of both quantity
and quality. Human activities in catchment areas are believed to be a main
reason for these issues (Henry & Heineke 1996). For example, discharge of
poorly treated waste water or agriculture activities causes pollution for water
sources which are used to supply potable water to communities (Umezawa et
al. 2008). Surface water and groundwater sources can be polluted by many
substances, of which ammonia is one of the primary factors. The ammonia
content in these water sources varies from over 0 mg NH4+ L-1 to 25 mg NH4
+
L-1 (Angelopoulos et al. 2009). The low concentration of ammonium nitrogen
(under 5 mg NH4+ L-1) has been recorded in a number of sources. For
example, low concentration of ammonia from 0.09 to 0.1 mg NH4+ L-1 has
been found in the tap water of many households in Southeast Asian cities
such as Manila and Jakarta (Umezawa et al. 2008). Ammonia seriously
influences chlorine disinfection processes which is an important stage in
drinking water treatment (van den Akker 2008). Inorganic chloramines will
be created as a result of the reaction between chlorine and ammonia.
Meanwhile, inorganic chloramines are quite stable and persist for a long time
and this leads to poor water quality (Symons & Carswell 1977). In addition,
a part of the amount of chlorine will be utilized for this reaction and it could
lead to lack of chlorine for disinfection when the required chlorine mass only
is calculated for demand disinfection. Therefore, the ammonia contamination
should be considered in order to minimize its negative effects.
In the context of the water quality deterioration by nitrogen in recent decades,
the demand for ammonia removal in potable water treatment plants is

2
increasing. Meanwhile, conventional methods for ammonia treatment using
chlorine present limitations during treatment processes. This conventional
approach uses pre-chlorination as an effective solution to eliminate ammonia
in raw water. However, this approach has a number of disadvantages such as
generating disinfection by-products and increasing chlorine consumption
(van Den Akker et al. 2010). By-products such as chloramine will lead to
poor treated water quality and can cause public health problems.
Furthermore, in order to eliminate 1mg ammonia, an amount of chlorine 10
mg is required which could significantly increase the water treatment cost.
Therefore, it is necessary to develop environment friendly approaches for
ammonia removal.
Biological treatment solutions are highly appropriate in efficiently removing
contaminants such as ammonia because they can minimize chlorine
consumption and disinfection by-products generated by the interference
between ammonia and chlorine during the disinfection process (Rittmann,
Huck & Bouwer 1989). Therefore, biological methods to remove nitrogen in
water sources have been studied since the early 1990s (Pearce & Williams
1999). While nitrification is known as one effective option to biologically
convert ammonia into nitrate, which does not increase chlorine demand for
disinfection, denitrification is indicated as a powerful solution to transfer
nitrate into nitrogen gas which is released into the atmosphere.
Unfortunately, most of this research has focused on either nitrification or
denitrification processes. Meanwhile, only a few researchers have
investigated combining nitrification with denitrification, such as Cecen and
Gönenç (1992), Kuai and Verstraete (1998), and Furukawa et al. (2006).
Nevertheless, these studies were regularly conducted on wastewaters, which
have extremely high nitrogen concentrations compared with those in surface
water and groundwater. Hence, further study on the integration of

3
nitrification with denitrification is necessary at lower concentrations of
ammonia contamination.
1.2. Nitrogen
Nitrogen compounds
Nitrogen plays a significant role in all life on Earth and is an essential element
in biological processes because it is a primary factor for building blocks of
proteins, amino and nucleic acids as well as other cellular constituents (Bryan
2011; Ward & Jensen 2014). The largest source of nitrogen is located in the
Earth’s atmosphere which accounts for about 78 percent of the atmosphere.
However, the vast majority of living organisms cannot directly access
atmospheric nitrogen which is an inert nitrogen form; therefore, this gaseous
nitrogen must be converted to usable nitrogen compounds, such as ammonia
and nitrate, by micro-organisms. Normally, these transformations of nitrogen
occur in the soils and they are grouped into a system which is named as the
nitrogen cycle (Figure 1.1).
Figure 1.1. The nitrogen cycle (Modified from Bryan 2011)

4
Nitrogen compounds are diverse. An overview of the nitrogen forms is
provided in Table 1.1 below. However, several nitrogen compounds
including nitrogen gas, ammonium, ammonia, nitrate and nitrite are seen as
the most common compounds in general (Tchobanoglous et al. 2003; Wall
2013). In surface water and groundwater, ammonium, nitrite and nitrate are
believed to be important compounds because they are one of the key factors
leading to contamination of water sources and, therefore, have negative
effects on the public health (Shrimali & Singh 2001).
Table 1.1. Overview of the nitrogen forms (Adapted from Tchobanoglous et
al. 2003; Wall 2013)
Nitrogen
parameter
Abbreviation General description
Ammonia NH3 Ammonia is low concentration in both
surface and groundwater.
Ammonium NH4+ Ammonium is regularly measured
together with ammonia in a laboratory.
Normally. The level of ammonium is
higher than the concentration of
ammonia, however it is less toxic.
Nitrate NO3- Nitrate is the primary form of nitrogen in
water sources. It is dissolved in water and
simply moves through soils.
Nitrite NO2- Nitrite is low level in waters and is
frequently measured together with nitrate
in a laboratory.

5
Organic nitrogen Organic N TKN – (NH3 + NH4+)
Inorganic nitrogen TIN NH3 + NH4+ + NO3
- + NO2-
Total Kjeldahl
nitrogen
TKN Organic N + NH3 + NH4+
Total nitrogen TN TKN + NO3- + NO2
-
Nitrogen contamination
Surface water and groundwater are the main sources for provision of drinking
water supply and other purposes throughout the world. However, a number
of these water sources are seriously polluted by nitrogen compounds such as
ammonia and nitrate. In a number of countries in Asia, such as Vietnam and
China, the level of nitrate in both groundwater and surface water has steadily
increased in recent times and exceeded the safe level which is 10 mg L-1 of
nitrate nitrogen based on the WHO standards (Kumazawa 2002). A survey
conducted in six regions in northern Vietnam indicates that the
concentrations of nitrate nitrogen of most samples are greater than 10 mg L-
1; however, the nitrate in some samples reached up to 34 mg L-1 (Cam et al.
2008). Meanwhile, in the European Union, Angelopoulos et al. (2009) report
that the concentrations of nitrate nitrogen in over 24% of monitoring stations
were above 40 mg L-1 and 7% of total stations showed the level in a range of
25 – 0 mg L-1 between 2000 and 2003. In the USA, up to 400 thousand sites
of water sources were reported to be polluted by nitrogen (Yang & Lee 2005).
In addition, the levels of nitrate nitrogen in 36% of the sample wells in the
Pantanoso stream of Argentina were higher than 10 mg L-1. There is also
evidence of nitrogen pollution in surface water and ground water in Oceania.
For example, in Australia, the concentration of nitrate nitrogen from 15 to 54
6
mg L-1 was observed in the Northern Territory (Salvestrin & Hagare 2009).
Therefore, is seems clear from these studies that nitrogen contamination in
water sources has been found in many areas in the world and there are signs
that its concentration has slightly increased over time.
Sources of nitrogen
Nitrogen sources leading to contamination in surface water and groundwater
are divided into two main sources including artificial and natural sources.
Agricultural irrigation, nitrogenous fertilizers, and human and animal waste
are key artificial nitrogen sources generating pollution in water while the
important natural nitrogen sources include atmospheric nitrogen deposition,
contaminated land and river-aquifer interaction (Liu et al. 2013; Wall 2013).
Health effects of nitrogen
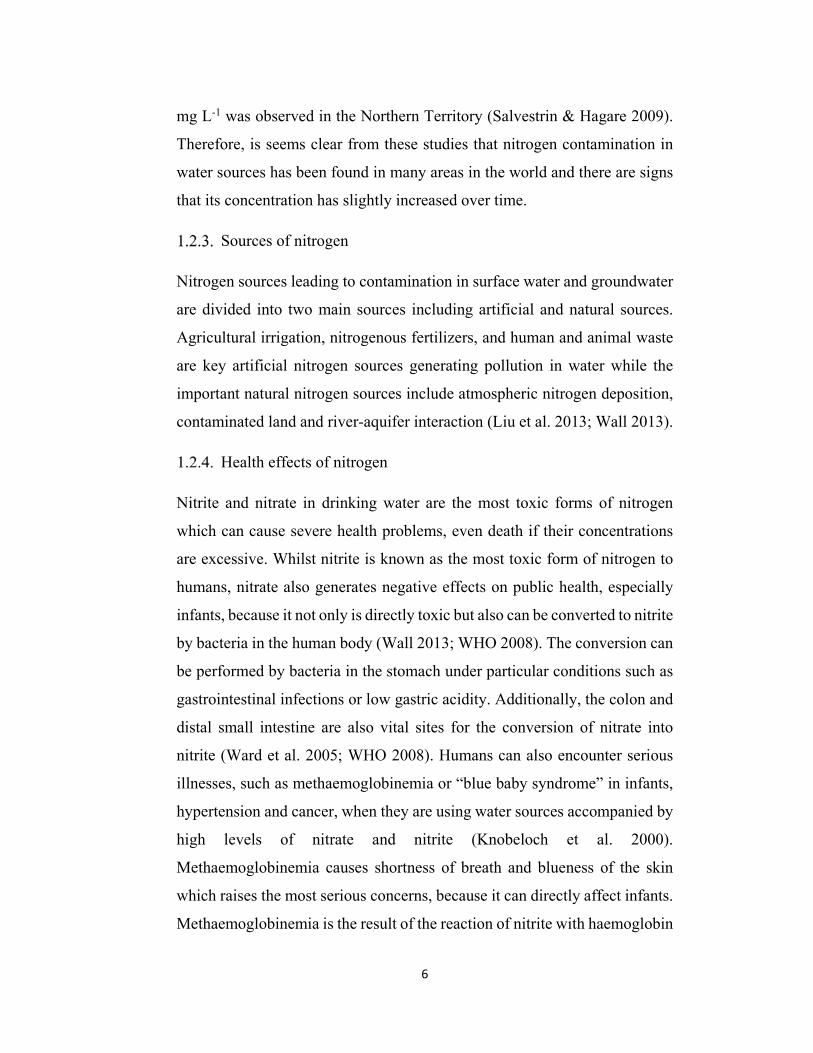
Nitrite and nitrate in drinking water are the most toxic forms of nitrogen
which can cause severe health problems, even death if their concentrations
are excessive. Whilst nitrite is known as the most toxic form of nitrogen to
humans, nitrate also generates negative effects on public health, especially
infants, because it not only is directly toxic but also can be converted to nitrite
by bacteria in the human body (Wall 2013; WHO 2008). The conversion can
be performed by bacteria in the stomach under particular conditions such as
gastrointestinal infections or low gastric acidity. Additionally, the colon and
distal small intestine are also vital sites for the conversion of nitrate into
nitrite (Ward et al. 2005; WHO 2008). Humans can also encounter serious
illnesses, such as methaemoglobinemia or “blue baby syndrome” in infants,
hypertension and cancer, when they are using water sources accompanied by
high levels of nitrate and nitrite (Knobeloch et al. 2000).
Methaemoglobinemia causes shortness of breath and blueness of the skin
which raises the most serious concerns, because it can directly affect infants.
Methaemoglobinemia is the result of the reaction of nitrite with haemoglobin

7
in red blood cells, which will lead to a changed state of haemoglobin into
methemoglobin. This altered form will significantly contribute to reducing
the transport capacity of oxygen, even blocking these transports (El Midaoui
et al. 2002; Knobeloch et al. 2000; Luk & Au-Yeung 2002; WHO 2008). To
limit the serious effects on public health, removing or reducing the
concentration of nitrate and nitrite in drinking water is essential.
1.3. Nitrification
Nitrifying Trickling Filters (NTFs)
There are a number of methods to convert ammonia or ammonium into
nitrate. However, application of high rate NTFs for raw water treatment is
one of the most effective methods. This method is not only efficient for
removing high ammonia concentration but is also a reliable solution in
dealing with low ammonia concentration in surface water and groundwater
(Pearce & Williams 1999; Vayenas & Lyberatos 1994).
Trickling filters have been successfully applied in the elimination of
inorganic and organic substances in wastewater and potable water since the
1890s (Boller, Gujer & Tschui 1994). In general, a trickling filter system
includes an influent water distribution system, trickling filter media,
ventilation gates and effluent pipes or channels. Although each part of the
system plays an important role in the system, trickling filter media is believed
to be central in performance of this system. The media is divided into two
groups based on its attributes, including rock and plastic media groups
(Lewandowski & Boltz 2011). While the rock media group had been
commonly applied for over 100 years, plastic media group have been
developed and replaced rock media since the 1950s. The efficiency of plastic
media is believed to be superior to the rock group because plastic media can
assist in increasing hydraulic rates and limiting clogging (Tchobanoglous et
al. 2003).

8
Trickling filters used to eliminate ammonia or ammonium are known as
NTFs in which two microbiological processes occur including autotrophic
and heterotrophic nitrification. The efficacy of NTFs in removal of ammonia
and ammonium in raw water was demonstrated by a series of pilot
experiments conducted by van den Akker et al. (2008) and van den Akker
(2008). In these experiments, low ammonia concentrations from 0.5 to 5.0
mg NH4-N L-1 were successfully removed under high hydraulic load between
72.5 and 145 m3 m-2 day-1.
Autotrophic nitrification
Nitrification is the process including two stages by which ammonium or
ammonia is converted to nitrite followed by the transformation of nitrite to
nitrate. This process cannot remove the nitrogen compound, nevertheless it
assists to transform the toxic nitrogen forms ammonium or ammonia to
nitrate form which can be removed by the denitrification process. In the first
stage, the oxidation of ammonium (NH4+) into nitrite by ammonia oxidizing
bacteria (AOB) is presented according to Equation 2.1 (Noda et al. 2004;
Sharma & Ahlert 1977; Tchobanoglous et al. 2003).
2NH4+ + 3O2 → 2NO2- + 4H+ + 2H2O (Eq. 2.1)
In the second stage, nitrite oxidizing bacteria (NOB) oxidize nitrite into
nitrate according to Equation 2.2 (Noda et al. 2004; Tchobanoglous et al.
2003).
2NO2- + O2 → 2NO3
- (Eq. 2.2)
The two stages naturally occur in the environment with specialized bacteria
such as Nitrosomonas sp. and Nitrobacter sp. in the first and second stage
respectively. These two bacteria are considered as autotrophic bacteria and
nitrifying bacteria. They use carbon dioxide as their carbon requirements for

9
the synthesis of cellular material. This reaction is indicated in Equation 2.3
(Noda et al. 2004; Watson, Valois & Waterbury 1981).
4CO2 + HCO3- + NH4
+ + H2O → C5H7O2N + 5O2 (Eq.2.3)
The energy generated by autotrophic bacteria is assigned to fixing carbon
dioxide. This is a main reason for the reduced growth rate of nitrifies.
Wiesmann (1994) and Van Benthum, Van Loosdrecht and Heijnen (1997)
indicate that the growth rate of nitrifying at 30oC is approximately 0.08 h-1,
while this rate of aerobic heterotrophic organisms at the same temperature is
from 0.3 to 0.5 h-1.
Heterotrophic nitrification
Heterotrophic nitrification is the process by which inorganic and organic
nitrogen forms are oxidized to nitrate by heterotrophic bacteria and fungi
(Watson, Valois & Waterbury 1981). In general, the mechanism of
heterotrophic nitrification is similar to that in autotrophic ammonia oxidizers.
Besides, this mechanism is evaluated to be linked to aerobic denitrification
(Conrad 1996; Nyerges & Stein 2009; Prosser 1989).
In terms of fungal nitrification, the second mechanism of heterotrophic
nitrification is linked to the degradation of lignin. In addition, the mechanism
can contribute to reducing organic compounds with hydroxyl radicals
(Prosser 1989).
Although heterotrophic nitrification has a similar mechanism to autotrophic
nitrification, the cellular rates of heterotrophic bacteria is significantly slower
than that in autotrophic organisms. In drinking water systems, the number of
heterotrophic nitrifiers may be negligible in comparison with autotrophic
nitrifiers (Verstraete, Willy & Alexander 1973; Watson, Valois & Waterbury
1981).

10
1.4. Denitrification
Heterotrophic denitrification
Biological denitrification is the process to transform nitrate to dinitrogen gas
in the anoxic or anaerobic conditions by the action of denitrifying bacteria.
In the sequence of denitrification, nitrate is converted into dinitrogen gas
through nitrite, nitric oxide and nitrous oxide as the Equation 2.4 (Fernández-
Nava et al. 2010; Tchobanoglous et al. 2003). During the transformations in
Eq. 2.4, nitrate and nitrite are used as terminal electron acceptors (Moreno et
al. 2005).
NO3- → NO2
- → NO → N2O → N2 (Eq.2.4)
Types of bacteria in the biological denitrification process are diversified
compared with the biological nitrification process. These bacteria can use
both organic and inorganic carbon sources to act as a hydrogen donor and to
supply the biological synthesis (Liljedahl 2014). While bacteria in the
autotrophic denitrification tend to use inorganic carbon, that in the
heterotrophic denitrification prefer to use organic carbon for their activations
(Liu et al. 2013; Van Rijn, Tal & Schreier 2006).
Heterotrophic denitrifiers play a strong role in the success of the microbial
denitrification processes. This finding has been confirmed by numerous
studies and it is widely applied in the field (Soares 2000). However, intrinsic
nitrate degradation cannot protect water sources because this process may
occur only slowly in the limited carbon sources conditions (Devlin, Eedy &
Butler 2000; Mohseni-Bandpi, Elliott & Zazouli 2013; Strauss & Lamberti
2002). Therefore, external carbon sources are necessary to support bacterial
growth, respiration and enrichment. Organic carbon is a key carbon source
for heterotrophic denitrifiers and is classified into liquid, solid and gas groups
(Liu et al. 2013).

11
Autotrophic denitrification
Apart from heterotrophic denitrifiers, autotrophic denitrification is an
effective way of the biological denitrification processes. In some cases,
autotrophic denitrification is evaluated to be more powerful than
heterotrophic denitrification. This is represented by its advantages over
heterotrophic denitrification including reduction of clogging, low biomass
build-up and limitation of organic carbon contamination thanks to using
inorganic carbon as a carbon and energy source (Ghafari, Hasan & Aroua
2008; Pan 2007; Van Rijn, Tal & Schreier 2006). In the autotrophic growth
conditions, several bacteria can gain energy sources and electron donors for
microbial metabolic chain by using hydrogen and sulphur compounds such
as S0, S2-, SO32-, and H2S (Matějů et al. 1992). Concerning electron donors,
autotrophic denitrification can be divided into hydrogenotrophic and sulphur
autotrophic denitrification (Liu et al. 2013).
Hydrogenotrophic denitrification uses hydrogen gas as a substrate in the
denitrification processes. This gas is an ideal substrate because it is harmless
to public health and does not required post treatments further to remove by-
products (Liu et al. 2013). The pathways for hydrogenotrophic denitrification
are indicated as Equation 2.5 and 2.6 (Chang, Tseng & Huang 1999;
Karanasios et al. 2010).
2NO3- + 5H2 → N2 + 4H2O + 2OH- (Eq. 2.5)
2NO3- + 2H+ + 5H2 → N2 + 4H2O (Eq. 2.6)
Regarding sulphur autotrophic denitrification, this process contributes both
advantages and drawbacks to autotrophic denitrification. On the one hand,
elemental sulphur is not an expensive substrate in comparison with ethanol
or methanol which are commonly used in a carbon sources for biological
denitrification. In addition, under aerobic conditions, sulphur autotrophic
denitrification also can take place, therefore deoxygenating the water sources

12
is not necessary (Zhang & Lampe 1999). On the other hand, sulphur
autotrophic denitrification has to deal with undesirable by-product sulphates
and low solubility of reduced sulphurs (Karanasios et al. 2010).
A novel heterotrophic-autotrophic denitrification approach which uses mixed
bacteria, pine bark and granulated spongy iron to support its processes was
proposed by Liu et al. (2013) to remove nitrogen under the aerobic
conditions. Besides pine bark, a number of agricultural residues such as
cotton, wood chips and wheat straw has been used as external carbon sources
in heterotrophic denitrification processes (Saliling, Westerman & Losordo
2007; Soares & Abeliovich 1998; Volokita, Abeliovich & Soares 1996).
However, valuable information on barley straw as a potential carbon source
is limited. In heterotrophic-autotrophic denitrification, a series of processes
including chemical reduction of dissolved oxygen and nitrate, biological
deoxygenation, autotrophic denitrification and heterotrophic denitrification
are involved in the heterotrophic-autotrophic denitrification. The results
indicate that nearly 100% of nitrate nitrogen was removed after 16 days by
this method, in which all above processes contributed to the effectiveness,
however, the heterotrophic denitrification accounts for over 83% of the total
nitrate nitrogen removal. The denitrification rate was steady at 1.23 to 1.39
mg NO3-N L-1 day-1 during 3.5 months (Liu et al. 2013).
1.5. Factors influencing nitrification and denitrification
The effectiveness of a biological system heavily depends on nitrification and
denitrification rates. However, it is not simple to maintain the high rate of
nitrification and denitrification in the biological processes, although there are
a large number of studies on their attributes (Noda et al. 2004). A series of
studies demonstrate that environmental factors seriously affect the rate of
nitrification and denitrification reaction including temperature, oxygen
concentration, pH, hydraulic loading rate and inhibiting substances (Chen,

13
Ling & Blancheton 2006; Jenicek et al. 2004; Liljedahl 2014; Ling & Chen
2005; Sharma & Ahlert 1977; Zanetti et al. 2012). In these studies,
deoxygenation and carbon sources are considered as essential factors for
biological denitrification.
1.6. Integration of nitrification and denitrification
Single stage process
A single stage process for nitrogen removal basically combines nitrification
and denitrification in the same reactor to obtain carbonaceous removal,
ammonia oxidation and nitrate reduction (Wang, Shammas & Hung 2010).
A partial nitrification and anoxic oxidation of ammonia processes
simultaneously occur under the oxygen limited environment and, as a result,
ammonium is transformed into nitrogen gas. Overall reaction for nitrogen
removal in the process is showed in Equation 2.7 (Sliekers et al. 2003).
NH4+ + 0.85O2 → 0.44N2 + 0.11NO3
- + 0.14H+ (Eq. 2.5)
The integration of nitrification and denitrification in a single stage has been
studied extensively since the last decade because of its potential cost
advantage and high volumetric nitrogen removal rate in comparison with the
separated stage process (Abbas et al. 2014; Wyffels et al. 2003). Numerous
nitrogen removal models based on the single state process were developed
by different research groups around the world. In which, it is important to
mention several typical models including Completely Autotrophic Nitrogen
removal over Nitrite (CANON); Aerobic Deammonification (DEMON);
Oxygen-Limited Autotrophic Nitrification Denitrification (OLAND); and
Single-stage Nitrogen removal using Anammox and Partial nitritation
(SNAP); Simultaneous Partial Nitrification, Anammox and Denitrification
(SNAD).

14
The CANON method can achieve a very high nitrogen transformation rate
under a low concentration of organic materials. It could remove up to 1.5 kg
N (m3 reactor)-1 day-1 and the rate could be higher, up to 20 times if the
CANON process was maintained in a gas-lift reactor which has a high
oxygen mass transfer rate (Sliekers et al. 2003).
The DEMON process was developed by Hanover University, Germany
(Hippen et al. 1997). This model can convert a huge amount of the
ammonium into nitrogen gas in aerobic conditions by deammonification.
During the process, nitrate and nitrite are known as the intermediary
substances (Hippen et al. 1997).
The OLAND system was developed by Kuai and Verstraete (1998) at Ghent
University, Belgium. The system uses normal nitrifying sludge as the
biocatalyst for the nitrogen removal in water sources in one step. Ammonium
is oxidized and converted into nitrogen gas with nitrite as the electron
acceptor. The nitrogen removal rate of the OLAND system in the lab-scale
was not really high. It was only 16mg of N g of volatile suspended solids-1
day-1 corresponding to 50 mg of N L-1 day-1 (Kuai & Verstraete 1998).
SNAP was developed to effectively eliminate ammonium as an economical
process. In this process, a novel biofilm reactor was applied to remove 60 to
80% of total ammonium under conditions of temperature 35oC, pH 7.5 – 7.7
and DO 2-3 mg. Both anammox bacteria and ammonium oxidizing bacteria
were detected in SNAP sludge with the ratio being 15% and 8.7%
respectively (Furukawa et al. 2006).
SNAD is a reliable method for nitrogen removal under limited oxygen
conditions. The research results show that 19% of ammonium or 70% of total
nitrogen were successfully converted into dinitrogen gas, corresponding to
0.69 kg N (m3 reactor)-1 day-1 (Chen et al. 2009).

15
Although the single state process has great advantages and can obtain ideal
results in lab-scale, it should be realized that this process is dealing with
several potential limitations (Wang, Shammas & Hung 2010). As the single
stage process is based on anaerobic ammonium oxidation (Anammox), this
is considered as the first limitation because of the extended time in the
Anammox process, which needs further research to shorten this period.
Additionally, the application capacity of the single state process in the field
is not really high and has only been realized at several locations (Zhang et al.
2014).
Separated stage process
Separated stage process is known as the conventional biological process to
remove ammonia or ammonium in water sources. The nitrification is the first
step of the process followed by denitrification and they are accomplished in
separate reactors (Wang, Shammas & Hung 2010; Windey, De Bo &
Verstraete 2005). Supplemental carbon and energy sources are necessary to
optimize nitrogen remove by the denitrification stage because most of
degradable organics in a water source are removed in or prior to the
nitrification stage (Wang, Shammas & Hung 2010).
An experiment was conducted by Cecen and Gönenç (1992) in which the
integration of nitrification with denitrification occurred in two upflow
submerged filters. High strength nitrogenous wastes participated in reaction
in the nitrification filter to convert ammonium into nitrate. Before flow into
the denitrification filters, diluted molasses was added into the water source.
The results show that about 98% of ammonium was transformed in the
nitrification step, however, the rate and effectiveness strongly depended on
the concentration of oxygen. The finding was logical with the research results
which were conducted by a number of researchers, such as Okey and
Albertson (1989) and Gönenç and Harremöes (1985).

16
Rusten, Hem and Ødegaard (1995) developed a moving bed biofilm reactor.
Small plastic elements were installed with density less than 1.0 g/cm3 in the
large surface area. Two options for the integration of nitrification with
denitrification were deployed in recirculated systems. In the first option,
wastewater was pumped through pre-denitrification reactors before it was
nitrified, and then water was returned to pre-denitrification reactors.
Conversely, wastewater ran through a nitrification system with post-
denitrification in the other option. The external carbon sources were fed into
the second system. The results indicate that the latter system was to dominate
the former one. In the similar conditions, the first system only converted from
50 to 70% of the total nitrogen, while this number was 80 to 90% in the
second system.
In conclusion, nitrogen contamination in surface water and groundwater is a
serious problem because it can generate negative effects on public health.
Although there are a large number of studies on either nitrification or
denitrification, these studies are only a part of completed stages in removing
nitrogen in water sources. To absolutely remove nitrogen compounds in
water, normally it requires a system which combines both nitrification and
denitrification processes. Researches on a complete system to remove
nitrogen have been conducted, however, they are too limited in number and
they have tended to focus on wastewater which has high nitrogen
concentrations greater than surface water and groundwater. Therefore, it is
necessary to carry out a further study in the integration of nitrification with
denitrification in treatment of nitrogen contamination in surface water and
groundwater.
1.7. Research Question
What is the best method to effectively integrate nitrification and
denitrification for surface water and groundwater treatment?

17
The integration of a nitrification system with a denitrification system to
remove ammonia and other nitrogen compounds in treatment of surface water
and groundwater was studied by experimentation at lab-scale. The study was
divided into several stages including installation of artificial media for
nitrification and development of nitrifying bacteria, followed by
supplementation of barley straw as a carbon source, deoxygenation by
spongy iron and adjustment to find the optimal process rate for
denitrification. It is anticipated that the findings of the study can significantly
contribute to a reliable method for the treatment of nitrogen pollution in
surface water and groundwater given that studies on the integration of
nitrification with denitrification are limited.
This study aims to determine the most suitable combination model between
nitrification and denitrification systems in treatment of nitrogen pollution in
surface water and groundwater. This model will be very useful for small
communities in rural areas and remote towns or villages in developing
countries. In these communities, water drawn from rivers, lakes or bores can
be easily contaminated by ammonia or ammonium from poor agriculture
activities. A commercial water treatment plant may be beyond the economic
capability of such communities, however, a low-tech practical system may
offer solutions, especially when people do not have access to other potable
water sources.

18
2. Material and Methods
2.1. Equipment and materials
Equipment
The study was conducted at pilot-scale at the Health and Environment Group
Laboratory of Flinders University. The main items of equipment used to
collect and analyse data, are listed in Table 2.1 below.
Table 2.1. Main equipment used in the study
No. Name of equipment Descriptions
1 FOSS - FIAstar 5000
Analyser
Used to measure ammonium (NH4-N), nitrite
(NO2-N) and nitrate (NO3-N)
2 TOC-L Shimadzu
Analyser
Used to measure total carbon (TC), inorganic
carbon (IC) and total organic carbon (TOC)
3 HACH DR 2000 Used to measure total chlorine and free chlorine
4 DO meter – HANNA
HI9147
Used to measure dissolved oxygen and
temperature
5 pH meter - Jenway
370 pH/mV
Used to measure pH and temperature
6 Air pump Provide oxygen for water in the reservoir
7 Peristaltic pumps –
Watson Marflow 323
Pump and control flow into the pilot system
Materials
Lake water from the main campus of Flinders University was utilized as a
water source for the experiment. Ammonium chloride was used as
ammonium source to supplement the water sample. Activated sludge

19
collected from Bolivar Waste Water Treatment Plant was used as a source
from which to develop nitrifying bacteria in the Commissioning Phase.
Furthermore, barley straw was collected from a hay farm in Kuitpo, South
Australia. Several chemical reagents were utilized for samples analysis at the
laboratory.
2.2. Preparation
Water quality makeup
In order to simulate an ammonium pollution in water sources, ammonium
chloride solution was added to the water sourced from the lake at Flinders
University (Figure 2.1). This addition created water samples with different
concentrations of ammonium for the respective experimental phases.
Ammonium chloride with the formula (NH4Cl) was used to adjust the quality
of lake water to simulate poor quality of surface water and groundwater. An
ammonium stock standard solution 1000 mg NH4+ L-1 was prepared by
dissolving a desired quantity of ammonium chloride into distilled water. This
solution was stored in a refrigerator (5°C) and was stable for at least three
months. Before using ammonium stock standard solution, the solution was
allowed to reach room temperature. Calcium carbonate (70 mg L-1) was
added to water samples during NTF commissioning phase to supply
inorganic carbon for the growth of nitrifying bacteria.
Carbon source plays a primary role in the denitrification processes. However,
a low carbon content is quite common in groundwater and some surface water
sources. Therefore, a supply of external carbon sources is necessary for
bacterial growth. Recently, a number of studies have been conducted to
determine the potential carbon sources for denitrification, such as pine bark,
cotton, sawdust, wood chips, newspaper and wheat straw, and they have
achieved positive results (Aslan & Türkman 2005; Kim et al. 2002; Liu et al.
2013; Robertson, Vogan & Lombardo 2008; Saliling, Westerman & Losordo

20
2007). However, valuable information for barley straw as an external carbon
source for both nitrification and denitrification processes is still limited.
Hence, the suitability of barley straw to provide inorganic and organic carbon
for nitrification and denitrification systems was considered in this study.
Nitrifying trickling filters (NTFs)
The pilot system including nitrification and denitrification systems was
designed as given in Figure 2.1 and shown in Plate 2.1. The NTFs were
packed in four polyvinyl chloride columns (0.104 m internal diameter, height
0.85 m). The filters used a bed (thickness, 0.6 m and volume 0.0051 m3) of
TKP 312 (2H Plastic Australia) polypropylene with area to volume ratio of
240 m2 m-3, void volume of 95% and average foils thickness of 0.35 mm. The
effective filter surface area (1.22 m2) of each filter was similar. The 4 NTFs
were operated in series, with water distribution on to the top of the NTFs by
a peristaltic pump at a constant flow rate of 0.3 L min-1. The system operated
under recirculated flow. The detail characteristics of TKP 312 polypropylene
is indicated in Plate 2.2 and Table 2.2.
Following passage through the in series NTF, a fraction of the nitrified
effluent was diverted to the denitrification system, and the remainder was
returned to the NTF reservoir for recirculation through the NTFs.

21
1- Plastic reservoir, 2- Peristaltic pump, 3- Discharge silicone tube, 4- Spray distribution, 5- Nitrifying column,
6- Natural ventilation ports, 7- Glass reservoir, 8- Intake silicone tube, 9- Polypropylene media,
10- Returned silicone tube, 11- Air pump, 12- Stirring pump, 13- Denitrifying column, 14- Barley straw, 15- Spongy iron
Figure 2.1. The schematic diagram of nitrification and denitrification systems
Nitrification system Denitrification

22
1- Plastic reservoir, 2- Peristaltic pump, 3- Discharge silicone tube,
4- Spray distribution, 5- Nitrifying column, 6- Natural ventilation ports,
7- Glass reservoir, 8- Intake silicone tube, 9- Polypropylene media,
10- Returned silicone tube, 11- Air Pump, 13- Denitrifying column
Plate 2.1. The nitrification and denitrification system

23
Plate 2.2. Structure of TPK 312 polypropylene (2H Plastic Australia n.d)
Table 2.2. Characteristics of TPK 312 polypropylene
Specification Units Value
Surface area m2 m-3 240
Channel width mm 12
Void volume % 95
Average foil thickness mm 0.35
Dry weight kg m-3 29
Specific weight g cm-3 1.03
Dimensions (Diameter x Height) mm 104 x 300
Max service temperature oC 80
Material Polypropylene
NTF hydraulic loading rate
Influent hydraulic flow rate to the NTFs was 0.3 L min-1 and constant during
the experiment time. This flow rate was controlled by rotational speed of
peristaltic pump. Hydraulic surface load of the nitrification system was

24
defined based on media surface area which was 0.354 m3 m-2 d-1 as Equation
2.1 below.
3 2 1frs
Q 0.432Q 0.354 m m d
A 1.22 (Eq. 2.1)
Where Qs is hydraulic surface load (L m-2 d-1); QTfr is total hydraulic flow
rate in a day (QTfr = 0.432 m3 d-1); and A is surface area of polypropylene
media in a column (A = 1.22 m2).
Meanwhile the irrigation rate was 50.82 m-3 m-2 d-1. This value was calculated
from Equation 2.2 and it was based on the total hydraulic flow rate per unit
of cross sectional area of a nitrification column per day.
3 2 1TfrI
s
Q 0.432Q 50.82 m m d
A 0.0085 (Eq. 2.2)
Where QI is irrigation rate (m-3 m-2 d-1); and As is cross sectional area of a
nitrification column (As = 0.0085 m2).
The corresponding irrigation velocity was 2.1 m h-1 and it was defined as
Equation 2.3 below.
1frI
s
Q 0.018V 2.12 m h
A 0.0085 (Eq. 2.3)
Where VI is irrigation velocity (m h-1); and Qfr is hydraulic flow rate per hour
(Qfr = 0.018 m3 h-1).
The flow rates in the denitrification system were 1.5, 1.2 and 1.5 ml min-1 for
Group 1, 2 and 3 respectively in all phases except Experimental Phase 4. In
the Phase 4, the flows rates in each group of the denitrification system were
increased three fold. They were 4.5 ml min-1 for Groups 1 as well as 3, and
3.6 ml min-1 for Group 2.

25
Denitrifying design and operation
Denitrification system was divided into three groups: Group 1 comprised the
first two columns in the series, Group 2 was the third column and Group 3
with the last column. The descriptions of each Group are showed in Table
2.3 below. The nitrified effluent from the in series NTF was delivered by
peristaltic pump to the base of each enclosed, denitrifying filter to ensure that
barley straw and spongy iron in each column were submerged. Following
passage through the denitrifying filters, the water was returned to the
reservoir of the nitrification system for subsequent recirculation through the
NTFs and the denitrifying filters. Barley straw (200g/filter) provided organic
carbon for the denitrifying processes, while spongy iron was included to
assist in elimination of dissolved oxygen in the water.
Table 2.3. The descriptions of groups in the denitrification system
Groups Columns
Inside diameter
(m)
Total height
(m)
Effective filter
height
(m)
Materials
Barley straw
(g)
Spongy iron
(g)
1 1 0.104 0.9 0.75 200 -
2 0.104 0.9 0.75 200 20
2 3 0.104 0.9 0.75 200 20
3 4 0.104 0.9 0.75 200 20
2.3. Methods
In the study, the experiment was divided into five main phases including
Commissioning phase, Experimental phase 1, Experimental phase 2,
Experimental phase 3, and Experimental phase 4. In the commissioning

26
phase, nitrifying bacteria were developed in NTFs in the presence of
ammonium spiked lake water. After that, all water in the system was replaced
by new lake water spiked with ammonium in the Experimental phase 1. This
Phase assisted to basically define the capacity of nitrification and
denitrification systems. Thereafter, capacity of the nitrification and
denitrification systems were measured in the Experimental phase 2 and 3
respectively. A further explanation of these phases is provided below.
Commissioning phase: Growing bacteria
The Commissioning phase was conducted over 20 days in three stage. In the
first two stages of the Commission phase, only nitrification system was
operated. The first stage (7 days) polypropylene media was immersed in
diluted activated sludge (Plate 2.3), which was collected from Bolivar Waste
Water Treatment Plant. Enrichment of nitrifying bacteria was stimulated by
the addition of 10 mg NH4-N L-1. Nitrosomonas sp. and Nitrobacter sp.
bacteria in the nitrification system use carbon dioxide for syntheses and
growth. To alleviate potential inorganic carbon limitation issues, an external
carbon source, being calcium carbonate (70 mg L-1), was added to the
activated sludge. Activated sludge was circulated by a pump and aerated.
Plate 2.3. Immersing polypropylene media in diluted activated sludge

27
In stage 2 of the commissioning the media was packed into the nitrifying
columns and the activated sludge was recirculated through the filter media
over 3 days at a flow rate of 0.3 L min-1 (Figure 2.2). The activated sludge
was supplemented with 5 mg NH4-N L-1 and 35 mg of carbonate. The return
activated sludge resident in the reservoir was continuously mixed and aerated
before recirculation through the NTFs.
1- Plastic reservoir, 2- Peristaltic pump, 3- Discharge silicone tube,
4- Spray distribution, 5- Nitrifying column, 6- Natural ventilation ports,
7- Glass reservoir, 8- Intake silicone tube, 9- Polypropylene media,
10- Returned silicone tube, 11- Air pump, 12 – Stirring pump
Figure 2.2. The schematic diagram of diluted activated sludge circulation
in the nitrification system

28
In Stage 3, the last 10 days of the commissioning, the activated sludge was
replaced by 60 L water collected from the lake at the main campus of Flinders
University. Then, 2.5 mg NH4-N L-1 was added to this water to simulate the
water quality of a polluted surface or groundwater. The water was pumped
to the nitrification system at a flow rate of 0.3 L min-1. Most effluent water
was circulated to the nitrifying reservoir, from which 4.2 ml min-1 was
pumped to the feed reservoir for the denitrification system with the
denitrified effluent returned to the nitrifying systems feed reservoir. The
nitrifying reservoir was kept aerated and stirred. The schematic diagram of
this stage is shown as Figure 2.1.
Experimental phase 1: Defining the capacity of nitrification and
denitrification systems
Experimental phase 1 was conducted over 14 days to determine the efficiency
of both the nitrification and denitrification systems. The results of this Phase
play a significant role in determining influent ammonium and nitrate
concentration in the following Phases. In the first 7 days, 60 L of fresh lake
water was prepared to replace the water used in the final stage of
commissioning. In addition, 150 mg NH4-N (4.3 mg NH4-N L-1) was added
into the nitrifying reservoir containing 35 L of lake water. The rest of new
lake water (25 L) was added into denitrifying columns. The flow in the
nitrification system was still circulated at a constant hydraulic rate at 0.3 L
min-1, while the flow rates through the denitrification system were 1.5, 1.2
and 1.5 ml min-1 for Group 1, 2 and 3 respectively. In the following 7 days,
0.6 mg NH4+ L-1 was daily loaded into the nitrification system. Nitrate
converted from ammonium by nitrifying columns was pumped to the
denitrifying columns to primarily evaluate the effectiveness of the
denitrification system. All other conditions such as stirring and aeration
remained the same as in the previous Phase. The schematic diagram of the
systems is showed as Figure 2.1.

29
Experimental phase 2: Measuring maximum capacity of the
nitrification system
The whole volume of water in the both nitrification and denitrification
systems was replaced by 50L of new lake water. In the first 7 days of the
Phase, 150 mg NH4-N day-1 was daily loaded to the system and following six
days, this figure was reduced to 100 mg NH4-N day-1. All conditions were
similar to the previous Phase. The schematic diagram of the systems is
showed as Figure 2.1.
Experimental phase 3: Measuring maximum capacity of the
denitrification system
The last experimental phase was conducted for 5 days including two sub
stages. The first stage was operated in the first four days. A constant
concentration of ammonium (100 mg NH4-N L-1) was continuously supplied
to the nitrification system. The water in the NTF feed reservoir of stirred and
aerated. However, the flow rates to the denitrification system were increased
three times compared with those in Phases 1 and 2. They were 4.5, 3.6 and
4.5 ml min-1 for Group 1, 2 and 3 respectively.
Follow that, the operation of the NTFs was paused and whole water in
denitrification columns was pumped out. Fresh lake water, 35L with 22.86
mg NO3-N L-1 was supplied to the denitrification system. The operation of
air pump and stirring pump were remained. The system was operated over a
day and sampling was conducted hourly.
2.4. Sampling and data analysis
During the experiment, lake water that was prepared for the experiment was
sampled. Additionally, influent and effluent samples of each column of both
nitrification and denitrification systems was collected daily. About 50 ml of
water was collected for each sample at 11am (± 1h). At the same time of

30
sampling, the dissolved oxygen (DO), the temperature and the potential of
hydrogen (pH) was measured by a DO meter and a pH meter. The samples
were filtered through glass microfiber filters (exclusion size, 4 µm) before
analysis. This filtration can assist to eliminate negative effects of sediment
on the analysis results of ammonium, nitrite and nitrate concentrations.
All lake water samples were measured free and total chlorine by HACH DR
2000. These measurements are necessary because chlorine in lake water can
interact with ammonium to reduce the concentration of ammonium in water
samples. Water samples were analysed for total organic carbon (TOC),
inorganic carbon (IC) were analysed by TOC-L Shimadzu Analyzer.
Ammonium (NH4-N), nitrite (NO2-N) and nitrate (NO3-N) were analysed as
described in Standard Methods for the Examination of Water and Wastewater
(Greenberg et al., 1992) using a FOSS - FIAstar 5000 Analyzer.

31
3. Results
3.1. Quality of lake water
All lake water samples used in the experiment were analysed for free chlorine
(Cl2 free), total chlorine (Cl2 total) – since Flinders Lake is supplied with
potable water, DO, ammonium, nitrate, nitrite, total organic carbon and
inorganic carbon. The results are shown in Table 3.1. The results indicate that
virtually all inorganic nitrogen compounds including ammonium and nitrate
were not present in the lake water samples. Only very small amounts of nitrite
nitrogen, which is not stable, were found in two of four lake water samples.
In addition, the concentration of free and total chlorine also was low 0.01 mg
L-1 to 0.09 mg L-1 and 0 mg L-1 to 0.06 mg L-1 respectively. These
concentrations of both free and total chlorine could not create negative effects
on the performance of the nitrification and denitrification systems.

32
Table 3.1. The quality of lake water before being used for the experiment
Date DO
mgL-1 pH
Cl2 free
mgL-1
Cl2 total
mgL-1
NH4-N
mgL-1
NO2-N
mgL-1
NO3-N
mgL-1
TOC
mgL-1
IC
mgL-1
04/6/2016 6.0 7.65 0.09 0.01 0 0.05 0 4.49 5.31
11/6/2016 6.3 7.43 0.01 0 0 0.04 0 4.62 5.84
18/6/2016 5.8 7.35 0.03 0.06 0 0 0 6.32 8.24
21/7/2016 5.83 7.46 0.06 0.05 0 0 0 1.81 7.57

33
3.2. Commissioning phase: Growing bacteria
The Commissioning phase was conducted over 20 days (25/05/2016 to
13/062016). Firstly, polypropylene media was immersed in diluted activated
sludge collected from Bolivar Waste Water Treatment Plant for 7 days
(25/05/2016 to 31/05/2016). During this time, nitrifiers were fed with 10 mg
NH4-N L-1 from ammonium chloride and 70 mg L-1 of carbonate from
calcium carbonate. Activated sludge was stirred and provided oxygen by a
stirring pump and an air pump respectively. pH, DO and temperature were
measured daily at 11.00 am (± 0.5h). The value of pH was in the range of 7.5
to 8, while DO ranged from 6.0 to 7.6 mg L-1 at 19°C.
After that, the development of biofilm was continued by packing
polypropylene media to nitrifying columns. The sludge was recirculated to
the media during the following three days (01/06/2016 to 03/03/2016) at a
flow rate of 0.3 L min-1. Ammonium (5 mg NH4-N L-1) and carbonate (35
mgL-1) were added to the system in this stage. Moreover, the operation of
stirring pump and air pump were continued. pH, DO and temperature were
continually measured. The pH values were between 7.6 and 8.0. Meanwhile
the DO value was around 6.4 mg L-1 at room temperature (20°C).
Finally, the activated sludge solution was replaced by 60 L water collected
from the lake at the main campus of Flinders University on 4th June 2016.
This stage was maintained over 10 days (04/06/2016 to 13/06/2016). In order
to make up water quality of polluted surface water and groundwater, 2.5 mg
NH4-N L-1 was added to the prepared water. The water was loaded onto the
NTFs in re-circulation mode at a flow rate of 0.3 L min-1. Most effluent water
was returned to the nitrifying reservoir, while only 4.2 ml min-1 was loaded
to the denitrification system. The denitrification flows also returned to the
nitrifying reservoir. The reservoir was kept aerated and stirred as described
above. The changes of ammonium, nitrate and nitrite were monitored at the

34
nitrifying reservoir and effluent flow of the nitrification system. The results
are shown as Figure 3.1, Figure 3.2, and Figure 3.3.
As presented in Figure 3.1 and Figure 3.2, the pattern of nitrate and nitrite in
influent and effluent points of the nitrification system was quite similar. In
the first 4 days, the effectiveness of the system was limited. The
concentration of nitrate and nitrite was constant and under 0.15 mg L-1.
However, the nitrate mass formed significantly increased to 1.0 mg L-1 in the
following day, while this mass of nitrite also reached to over 0.3 mg L-1. After
that the nitrate production remained constant, reducing after day 7. The
comparison of change in ammonium, nitrate and nitrite in the influent and
effluent are shown in Figure 3.3.
Furthermore, the change in ammonium, nitrate and nitrite also were
measured at influent and effluent points of all denitrification columns. Figure
3.4 presents results of the changes in ammonium in the denitrification system
during the 10 days of the Commissioning phase. It is obvious that the influent
ammonium concentration to the denitrification system was smaller than that
in the effluent of each denitrification columns. The ammonium
concentrations in denitrifying columns were quite high in the first days. They
were between over 1.0 and 5.5 mg NH4-N L-1. While the influent ammonium
concentration was only below 0.5 mg NH4-N L-1. Even in the last days of
Commissioning Phase, effluent ammonium concentrations were still double
influent ammonium concentration. It is unusual because normally, effluent
concentration is equal or lower influent concentration. The high effluent
ammonium concentrations was due to ammonification of the barley straw.
The comparison of influent and effluent concentration of nitrate and nitrite
of the denitrification system is shown in Figure 3.5, Figure 3.6, Figure 3.7
and Figure 3.8 respectively. The results indicate that while the influent
concentration of nitrate was quite high between day 5 and 8, effluent
concentration was zero.

35
Figure 3.1. Influent ammonium, nitrate and nitrite nitrogen of the
nitrification system during Commissioning Phase under following
conditions: Hydraulic rate of 0.3 L min-1, recirculation flow, and initial
ammonium nitrogen of 2.5 mg NH4-N L-1
Figure 3.2. Effluent ammonium, nitrate and nitrite of nitrogen the
nitrification system during Commissioning Phase under following
conditions: Hydraulic rate of 0.3 L min-1, recirculation flow, and initial
ammonium nitrogen of 2.5 mg NH4-N L-1
0.0
0.2
0.4
0.6
0.8
1.0
1.2
1.4
1.6
1.8
2.0
1 2 3 4 5 6 7 8 9 10
Conc
entr
atio
n (m
g/L)
Time (days)Influent NH4 -N influent NO3 -N Influent NO2 -N
0.0
0.2
0.4
0.6
0.8
1.0
1.2
1.4
1.6
1.8
2.0
1 2 3 4 5 6 7 8 9 10
Conc
entr
atio
n (m
g/L)
Time (days)Effluent NH4 -N of N4 Effluent NO3 -N of N4 Effluent NO2 -N of N4

36
Figure 3.3. Comparison between influent and effluent ammonium, nitrate
and nitrite nitrogen of the nitrification system during Commissioning Phase
under following conditions: Hydraulic rate of 0.3 L min-1, recirculation flow,
and initial ammonium nitrogen of 2.5 mg NH4-N L-1
Figure 3.4. Influent and effluent ammonium of the nitrification and
denitrification systems during Commissioning Phase under hydraulic rate of
1.5 ml min-1 for Column 1 and 2, and 1.2, 1.5 ml min-1 for Column 3 and 4
respectively
0.0
0.2
0.4
0.6
0.8
1.0
1.2
1.4
1.6
1.8
2.0
1 2 3 4 5 6 7 8 9 10
Conc
entr
atio
n (m
g/L)
Time (days)Influent NH4 -N influent NO3 -N Influent NO2 -NEffluent NH4 -N of N4 Effluent NO3 -N of N4 Effluent NO2 -N of N4
0
1
2
3
4
5
6
1 2 3 4 5 6 7 8 9 10
Conc
entr
atio
n (m
g/L)
Time (days)Effluent NH4 -N of D1 Effluent NH4 -N of D2 Effluent NH4 -N of D3Effluent NH4 -N of D4 Effluent NH4 -N of N4

37
Figure 3.5. Comparison between influent and effluent nitrate and nitrite of
Column 1 of the denitrification system during Commissioning Phase under
hydraulic rate of 1.5 ml min-1
Figure 3.6. Comparison between influent and effluent nitrate and nitrite of
Column 2 of the denitrification system during Commissioning Phase under
hydraulic rate of 1.5 ml min-1
0.00.10.20.30.40.50.60.70.80.91.01.11.2
1 2 3 4 5 6 7 8 9 10
Conc
entr
atio
n (m
g/L)
Time (days)Effluent NO3 -N of D1 Effluent NO2 -N of D1Effluent NO3 -N of N4 Effluent NO2 -N of N4
0.00
0.02
0.04
0.06
0.08
0.10
0.12
0.14
0.16
0.18
0.20
1 2 3 4 5 6 7 8 9 10
Conc
entr
atio
n (m
g/L)
Time (days)Effluent NO3 -N of D1 Effluent NO3 -N of D2Effluent NO2 -N of D1 Effluent NO2 -N of D2
38
Figure 3.7. Comparison between influent and effluent nitrate and nitrite of
Column 3 of the denitrification system during Commissioning Phase under
hydraulic rate of 1.2 ml min-1
Figure 3.8. Comparison between influent and effluent nitrate and nitrite of
column 4 of the denitrification system during Commissioning Phase under
hydraulic rate of 1.5 ml min-1
00.10.20.30.40.50.60.70.80.9
11.11.2
1 2 3 4 5 6 7 8 9 10
Conc
entr
atio
n (m
g/L)
Time (days)Effluent NO3 -N of D3 Effluent NO2 -N of D3Effluent NO3 -N of N4 Effluent NO2 -N of N4
0.0
0.2
0.4
0.6
0.8
1.0
1.2
1 2 3 4 5 6 7 8 9 10
Conc
entr
atio
n (m
g/L)
Time (days)Effluent NO3 -N of D4 Effluent NO2 -N of D4Effluent NO3 -N of N4 Effluent NO2 -N of N4

39
Furthermore, pH, DO and temperature were monitored daily. The pH values
in the nitrification and denitrification system were from 7.7 to 8.5 and 4.0 to
5.9 respectively. Meanwhile the room temperature was around 21°C. The DO
concentrations of both systems is shown in Figure 3.9. A trend of reducing
DO concentrations was noted during the Commissioning Phase in both
nitrification and denitrification systems.
The change in inorganic carbon and total organic carbon is shown in Figure
3.10 and Figure 3.11 respectively. Inorganic carbon values in the nitrification
system were much higher than those in the denitrification system.
Conversely, total organic carbon in the nitrification system was smaller than
that in the denitrification system (Figure. 3.11).
Figure 3.9. Change in dissolved oxygen in the nitrification and
denitrification systems during the Commissioning Phase under following
conditions: Nitrification hydraulic rate of 0.3 L min-1, denitrification
hydraulic rate of 4.5 ml min-1, recirculation flow, and initial ammonium
nitrogen of 2.5 mg NH4-N L-1
0.0
1.0
2.0
3.0
4.0
5.0
6.0
7.0
8.0
9.0
10.0
1 2 3 4 5 6 7 8 9 10
Conc
entr
atio
n (m
g/L)
Time (days)DO of the reservoir DO of N4 DO of D1DO of D2 DO of D3 DO of D4

40
Figure 3.10. Change in inorganic carbon in the nitrification and
denitrification systems during the Commissioning Phase
Figure 3.11. Change in total organic carbon in the nitrification and
denitrification systems during the Commissioning Phase under following
conditions: Nitrification hydraulic rate of 0.3 L min-1, denitrification
hydraulic rate of 4.5 ml min-1, recirculation flow, and initial ammonium
nitrogen of 2.5 mg NH4-N L-1
0
10
20
30
40
50
60
70
80
1 2 3 4 5 6 7 8 9 10
Conc
entr
atio
n (m
g/L)
Time (days)IC of the reservoir IC of N4 IC of D1IC of D2 IC of D3 IC of D4
0
100
200
300
400
500
600
700
800
900
1000
1 2 3 4 5 6 7 8 9 10
Conc
entr
atio
n (m
g/L)
Time (days)TOC of the reservoir TOC of N4 TOC of D1TOC of D2 TOC of D3 TOC of D4

41
3.3. Experimental phase 1: Defining the capacity of nitrification and
denitrification systems
The Experimental phase 1 includes two stages and was conducted over 14
days (14/06/2016 to 27/06/2016) to determine the efficiency of both
nitrification and denitrification systems.
Capacity of the nitrification system
The first stage of this Phase was conducted in 7 days (14/06/2016 to
20/06/2016). The main task of this stage was to measure the capacity of the
nitrification system. Accordingly, 35 L of fresh lake water was amended to
yield 4.3 mg NH4-N L-1 for the nitrification system. Another 25 L of fresh
lake water, containing only native ammonium, was used to replace the water
in the denitrification system used in the Commissioning Phase. The hydraulic
rate loading of the NTF systems was 0.3 L min-1 and it was still a re-
circulation flow configuration. While the flow rates in the denitrification
system were 1.5, 1.2 and 1.5 ml min-1 for columns in Group 1, 2 and 3
respectively. The temperature was measured during this stage and ranged
from 20.8 to 21.4°C. The pH values were from 7.1 to 8.1 for the nitrification
system and from 4.7 to 6.2 for the denitrification system. The change in DO
is shown in Figure 3.12. The DO values in the nitrification system increased
slightly over the 7 days from over 5.0 mg L-1 to nearly 6.0 mg L-1, the DO
values in the denitrification increased over 4 fold from around 1 mg L-1 to
over 4 mg L-1.
The changes in ammonium in the nitrification columns are shown in Figure
3.13. The initial concentration of ammonium was 4.3 mg NH4-N L-1 as
mentioned above. This concentration in the nitrifying reservoir reduced to
1.9 mg NH4-N L-1 after 24 hours and 0.034 mg NH4-N L-1 after 48 hours.
Then ammonium was not detected in the nitrifying reservoir and effluent
point of the system during following days of the Phase. The average daily

42
rate of nitrification achieved to be over 2.1 mg NH4-N L-1 (75 mg NH4-N
day-1).
Figure 3.12. Change in DO in the nitrification and denitrification systems
during the first stage of Phase 1 under following conditions: Nitrification
hydraulic rate of 0.3 L min-1, denitrification hydraulic rate of 4.5 ml min-1,
recirculation flow, and initial ammonium nitrogen of 4.3 mg NH4-N L-1
0.0
1.0
2.0
3.0
4.0
5.0
6.0
7.0
8.0
9.0
10.0
1 2 3 4 5 6 7
Conc
entr
atio
n (m
g/L)
Time (days)
DO of the reservoir DO of N4 DO of D1DO of D2 DO of D3 DO of D4

43
Figure 3.13. Change in ammonium in the nitrification system during the first
stage of Phase 1 under following conditions: Nitrification hydraulic rate of
0.3 L min-1, denitrification hydraulic rate of 4.5 ml min-1, recirculation flow,
and initial ammonium nitrogen of 4.3 mg NH4-N L-1
Figure 3.14 below presents the relationship among influent and effluent
ammonium, nitrate and nitrite of the nitrification system. While the
concentration of nitrate was quite high, the values of nitrite were limited,
suggesting almost complete nitrification. They only reached to 0.2 mg NO2-
N L-1 in the first two days, then no nitrite was detected. The nitrate mass
reached a maximum value around 3.5 mg NO3-N L-1 at day 2 before steadily
reducing. From the analysis of these measurement, it was determined that
about 0.5 mg NO3-N L-1 on average was converted daily to nitrogen gas. This
number was utilized for calculation influent ammonium mass in the
nitrification system in the next Phase. Although the concentration of nitrate
in the nitrification was quite high, there was no nitrate detected at effluent
points of the denitrification system (Figure 3.15).
The analysis results of IC and TOC during the stage are shown in Figure 3.16
and Figure 3.17 respectively. While IC values in the nitrification system
tended to increase, the values in the denitrification system halved in 7 days.
0.00.20.40.60.81.01.21.41.61.82.0
1 2 3 4 5 6 7
Conc
entr
atio
n (m
g/L)
Time (days)Influent NH4 -N Effluent NH4 -N of N1 Effluent NH4 -N of N2Effluent NH4 -N of N3 Effluent NH4 -N of N4

44
Figure 3.14. Influent and effluent ammonium, nitrate and nitrite of the
nitrification system during the first stage of Phase 1 under following
conditions: hydraulic rate of 0.3 L min-1, recirculation flow, and initial
ammonium nitrogen of 4.3 mg NH4-N L-1
Figure 3.15. Influent and effluent nitrate and nitrite of the denitrification
system during the first stage of Phase 1 under following conditions: hydraulic
rate of 4.5 ml min-1, recirculation flow, and initial ammonium nitrogen of 4.3
mg NH4-N L-1
0.00.51.01.52.02.53.03.54.04.55.0
1 2 3 4 5 6 7
Conc
entr
atio
n (m
g/L)
Time (days)Influent NH4 -N influent NO3 -N Influent NO2 -NEffluent NH4 -N of N4 Effluent NO3 -N of N4 Effluent NO2 -N of N4
0.00.51.01.52.02.53.03.54.0
1 2 3 4 5 6 7
Conc
entr
atio
n (m
g/L)
Time (days)
Effluent NO3 -N of D1 Effluent NO3 -N of D2 Effluent NO3 -N of D3Effluent NO3 -N of D4 Effluent NO2 -N of D1 Effluent NO2 -N of D2Effluent NO2 -N of D3 Effluent NO2 -N of D4 Effluent NO3 -N of N4Effluent NO2 -N of N4

45
Figure 3.16. Change in inorganic carbon of the nitrification and
denitrification systems during the first stage of Phase 1 under following
conditions: Nitrification hydraulic rate of 0.3 L min-1, denitrification
hydraulic rate of 4.5 ml min-1, recirculation flow, and initial ammonium
nitrogen of 4.3 mg NH4-N L-1
Figure 3.17. Change in TOC of the nitrification and denitrification systems
during the first stage of Phase 1 under following conditions: Nitrification
hydraulic rate of 0.3 L min-1, denitrification hydraulic rate of 4.5 ml min-1,
recirculation flow, and initial ammonium nitrogen of 4.3 mg NH4-N L-1
02468
1012141618202224
1 2 3 4 5 6 7
Conc
entr
atio
n (m
g/L)
Time (days)IC of the reservoir IC of N1 IC of N2IC of N3 IC of N4 IC of D1IC of D2 IC of D3 IC of D4
020406080
100120140160180200
1 2 3 4 5 6 7
Conc
entr
atio
n (m
g/L)
Time (days)TOC of the reservoir TOC of N1 TOC of N2TOC of N3 TOC of N4 TOC of D1TOC of D2 TOC of D3 TOC of D4

46
Capacity of the denitrification system
The data shown in Figure 3.14 in the first 7 days of the Phase 1 indicated the
denitrification system could remove0.5 mg NO3-N L-1 d-1 at a corresponding
hydraulic flow rate 4.2 ml min-1. Meanwhile, the theory of nitrogen mass
balance contends that total influent nitrogen including ammonia, nitrate and
nitrite equals total effluent nitrogen. Consequently, in order to maintain the
nitrate concentration of 0.5 mg NO3-N L-1 to sustain denitrification, it
requires 0.5 mg NH4-N L-1 to be added to the nitrifying reservoir.
In the following 7 days (21/06/2016 to 27/06/2016), a constant concentration
of ammonia 0.5 mg NH4-N L-1 (30 mg NH4-N day-1) was daily loaded to
evaluate the effectiveness of the denitrification system. All other conditions
such as stirring and aeration remained as for the previous Phase. The pH
values of the nitrification system were in the range 8.0 to 8.3 and they were
between 4.4 and 4.8 for the denitrification system. The temperature was about
21°C. Meanwhile, DO values in the nitrification were still higher than that in
the denitrification system. DO concentrations were from 4.0 mg L-1 to 6.0 mg
L-1 in nitrifying columns, while these figures were between 2.9 mg L-1 and
5.2 mg L-1 for denitrifying columns.
The results for nitrate concentrations in effluent flow of the nitrification
system (Figure 3.18) shows that the concentrations were stable throughout
this Phase (1.0 mg NO3-N L-1 to 1.2 mg NO3-N L-1). Figure 3.19 shows the
concentrations of influent and effluent nitrate and nitrite in denitrifying
columns. While no nitrate and nitrite were detected at effluent flows of
Columns 2, 3 and 4, a small concentration of nitrate < 0.1 mg NO3-N L-1 was
detected in Column 1 (Figure 3.20). Effluent flow from denitrifying Column
1 was considered as influent flow to denitrifying Column 2. The comparison
between influent and effluent factors in Column 1 and 2 was as shown in
Figure 3.21.

47
After finishing Phase 1, the system was continually maintained in all
conditions without sampling during 23 days (28/06/2016 to 20/07/2016).
Figure 3.18. Influent and effluent ammonium, nitrate and nitrite of the
nitrification system during the second stage of Phase 1 under following
conditions: hydraulic rate of 0.3 L min-1, recirculation flow, and ammonium
nitrogen of 0.5 mg NH4-N L-1 day-1
0.0
0.2
0.4
0.6
0.8
1.0
1.2
1.4
1.6
1.8
2.0
8 9 10 11 12 13 14
Conc
entr
atio
n (m
g/L)
Time (days)
Influent NH4 -N influent NO3 -N Influent NO2 -N
Effluent NH4 -N of N4 Effluent NO3 -N of N4 Effluent NO2 -N of N4

48
Figure 3.19. Influent and effluent ammonium, nitrate and nitrite of the
denitrification system the second stage of Phase 1 under following
conditions: hydraulic rate of 4.5 ml min-1, recirculation flow, and ammonium
nitrogen of 0.5 mg NH4-N L-1 day-1
Figure 3.20. Influent and effluent ammonium, nitrate and nitrite of
denitrification Column 1 during the second stage of Phase 1 under following
conditions: hydraulic rate of 1.5 ml min-1, recirculation flow, and ammonium
nitrogen of 0.5 mg NH4-N L-1 day-1
0.0
0.2
0.4
0.6
0.8
1.0
1.2
1.4
1.6
8 9 10 11 12 13 14
Conc
entr
atio
n (m
g/L)
Time (days)Effluent NO3 -N of N4 Effluent NO2 -N of N4 Effluent NO3 -N of D1Effluent NO2 -N of D1 Effluent NO3 -N of D2 Effluent NO2 -N of D2Effluent NO3 -N of D3 Effluent NO2 -N of D3 Effluent NO3 -N of D4Effluent NO2 -N of D4
0.0
0.2
0.4
0.6
0.8
1.0
1.2
1.4
1.6
8 9 10 11 12 13 14
Conc
entr
atio
n (m
g/L)
Time (days)Effluent NO3 -N of N4 Effluent NO2 -N of N4 Effluent NO3 -N of D1
Effluent NO2 -N of D1 Effluent NH4 -N of N4 Effluent NH4 -N of D1

49
Figure 3.21. Influent and effluent ammonium, nitrate and nitrite of
denitrification Column 2 during the second stage of Phase 1 under following
conditions: hydraulic rate of 1.2 ml min-1, recirculation flow, and ammonium
nitrogen of 0.5 mg NH4-N L-1 day-1
0.0
0.1
0.2
0.3
0.4
0.5
0.6
0.7
0.8
0.9
1.0
8 9 10 11 12 13 14
Conc
entr
atio
n (m
g/L)
Time (days)
Effluent NH4 -N of D1 Effluent NO3 -N of D1 Effluent NO2 -N of D1
Effluent NH4 -N of D2 Effluent NO3 -N of D2 Effluent NO2 -N of D2

50
3.4. Experimental phase 2: Measuring maximum capacity of the
nitrification system
Experimental Phase 2 was conducted during 13 days (21/07/2016 to
02/08/2016). In order to commence the Phase 2, 50 L of lake water was
prepared to replace the whole volume of water in both the nitrification and
denitrification system. In this procedure, 25 L of fresh lake water was added
150 mg NH4-N day-1 to maintain a concentration of 6.0 mg NH4-N L-1 in the
influent feed to the nitrification system. 150 mg NH4-N was daily loaded to
the system in the first 7 days. Then this figure was adjusted to 100 mg NH4-
N per day in following six days. Another 25 L of fresh lake water, containing
only native ammonium, was used to replace the whole former water in the
denitrifying columns. All other conditions were similar to the previous Phase.
The daily (room) temperature during the Phase 2 was about 21°C. The pH
value of nitrification was between 6.0 and 7.0. The pH values in the Group 1
of the denitrification system including Column 1 and 2 were in range 4.0 to
5.0. These values were lower than pH in Group 2 and 3 which were from 5.1
to 6.4. DO in the nitrifying columns changed between 4.2 mg L-1 and 6.3 mg
L-1 in comparison the DO in the denitrifying columns ranged between 2.6 mg
DO L-1 to 5.5 mg DO L-1.
In this experimental phase, besides defining influent and effluent ammonium
concentrations of both nitrification and denitrification systems, ammonium
concentration in the nitrifying reservoir was measured after adding the
ammonium chloride mass. Its results were as shown in Figure 3.22. Based on
the daily initial ammonium concentrations and effluent ammonium
concentrations of the whole system, ammonium mass which was daily
converted was defined. Figure 3.22 indicates that all ammonium
concentration values in the nitrifying and denitrifying systems steadily
increased during this experimental period. The effluent ammonium

51
concentration in Column 2 (D2) of the denitrification system was lowest in
comparison with other denitrifying columns. It is in agreement when column
D2 was in series with denitrifying Column 1. The influent flow of Column
D2 is the discharge flow of the denitrifying Column 1 which has much lower
ammonium concentration than that in the influent flows of other denitrifying
columns.
Figure 3.22. Comparison between influent and effluent ammonium during
Experimental Phase 2 under following conditions: Nitrification hydraulic
rate of 0.3 L min-1, denitrification hydraulic rate of 4.5 ml min-1, recirculation
flow, and ammonium nitrogen of 6 mg NH4-N L-1 in the first 7 days and
adjust to 4 mg NH4-N L-1 in following six days
Nitrate and nitrite production during the Experimental Phase 2 are shown in
Figure 3.23. While only very low nitrite concentrations under 0.06 mg
NO2-N L-1 were found at both influent and effluent points, nitrate
0
2
4
6
8
10
12
14
16
18
20
1 2 3 4 5 6 7 8 9 10 11 12 13
Conc
entr
atio
n (m
g/L)
Time (days)Influent NH4 -N Effluent NH4 -N of N4
Effluent NH4 -N of D1 Effluent NH4 -N of D2
Effluent NH4 -N of D3 Effluent NH4 -N of D4
Influent NH4 -N after adding ammonium

52
concentrations were quite high. In the first day of the Phase, over 8.4 mg
NO3-N L-1 was detected in the system and it reached a peak at around 9.5 mg
NO3-N L-1 in the following day. However, nitrate concentration in the
nitrification system began declining from day 3 to day 6 before stabilising
around 6.2 mg NO3-N L-1 during the rest of Phase 2. It was notable that
effluent nitrate masses were lower than that at the influent point during most
of this period.
Figure 3.23. Influent and effluent ammonium, nitrate and nitrite of the
nitrification system during Experimental Phase 2 under following conditions:
hydraulic rate of 0.3 L min-1, recirculation flow, and ammonium nitrogen of
6 mg NH4-N L-1 in the first 7 days and adjust to 4 mg NH4-N L-1 in following
six day
0
2
4
6
8
10
12
14
1 2 3 4 5 6 7 8 9 10 11 12 13
Conc
entr
atio
n (m
g/L)
Time (days)
Influent NH4 -N Effluent NH4 -N of N4 influent NO3 -N
Effluent NO3 -N of N4 Influent NO2 -N Effluent NO2 -N of N4

53
Although effluent nitrate concentration of the nitrification system, which
supplied the nitrate concentration to the denitrifying columns, was quite high,
most nitrate was transferred to nitrogen gas by denitrification process. The
results are presented in Figure 3.24 and show that the effluent nitrate
concentrations in Group 2 and 3 of the denitrification system were zero
during all of the Experimental phase. A limited amount of nitrate between
0.28 mg NO3-N L-1 and 0.75 mg NO3-N L-1 was found daily in denitrifying
Column 1. Similarly, low effluent nitrate concentration under 0.4 mg NO3-N
L-1 was detected in several days during this period.
Figure 3.24. Influent and effluent nitrate and nitrite of the denitrification
system during Experimental Phase 2 under following conditions: hydraulic
rate of 4.5 ml min-1, recirculation flow, and ammonium nitrogen of 6 mg
NH4-N L-1 in the first 7 days and adjust to 4 mg NH4-N L-1 in following six
days
0
2
4
6
8
10
12
14
16
1 2 3 4 5 6 7 8 9 10 11 12 13
Conc
entr
atio
n (m
g/L)
Time (days)
Effluent NO3 -N of N4 Effluent NO3 -N of D1 Effluent NO3 -N of D2
Effluent NO3 -N of D3 Effluent NO3 -N of D4 Effluent NO2 -N of N4
Effluent NO2 -N of D1 Effluent NO2 -N of D2 Effluent NO2 -N of D3
Effluent NO2 -N of D4

54
Change in inorganic carbon of nitrifying columns in this Phase was definitely
different in comparison with all previous Phases. The concentrations of
inorganic carbon in nitrifying columns were much higher than that in the
denitrifying columns in the previous Phases. However, in this Phase,
inorganic carbon concentration in the nitrification system was lower than that
in the denitrification system (Figure 3.25). Most of the inorganic carbon
values in the nitrification system were under 1 mg L-1 and they were quite
stable rather than increasing as in previous experimental Phases.
Figure 3.25. Change in IC of the both nitrification and denitrification
systems Experimental Phase 2 under following conditions: Nitrification
hydraulic rate of 0.3 L min-1, denitrification hydraulic rate of 4.5 ml min-1,
recirculation flow, and ammonium nitrogen of 6 mg NH4-N L-1 in the first 7
days and adjust to 4 mg NH4-N L-1 in following six days
0
1
2
3
4
5
6
7
8
9
1 2 3 4 5 6 7 8 9 10 11 12 13
Conc
entr
atio
n (m
g/L)
Time (days)
IC of the reservoir IC of N4 IC of D1
IC of D2 IC of D3 IC of D4
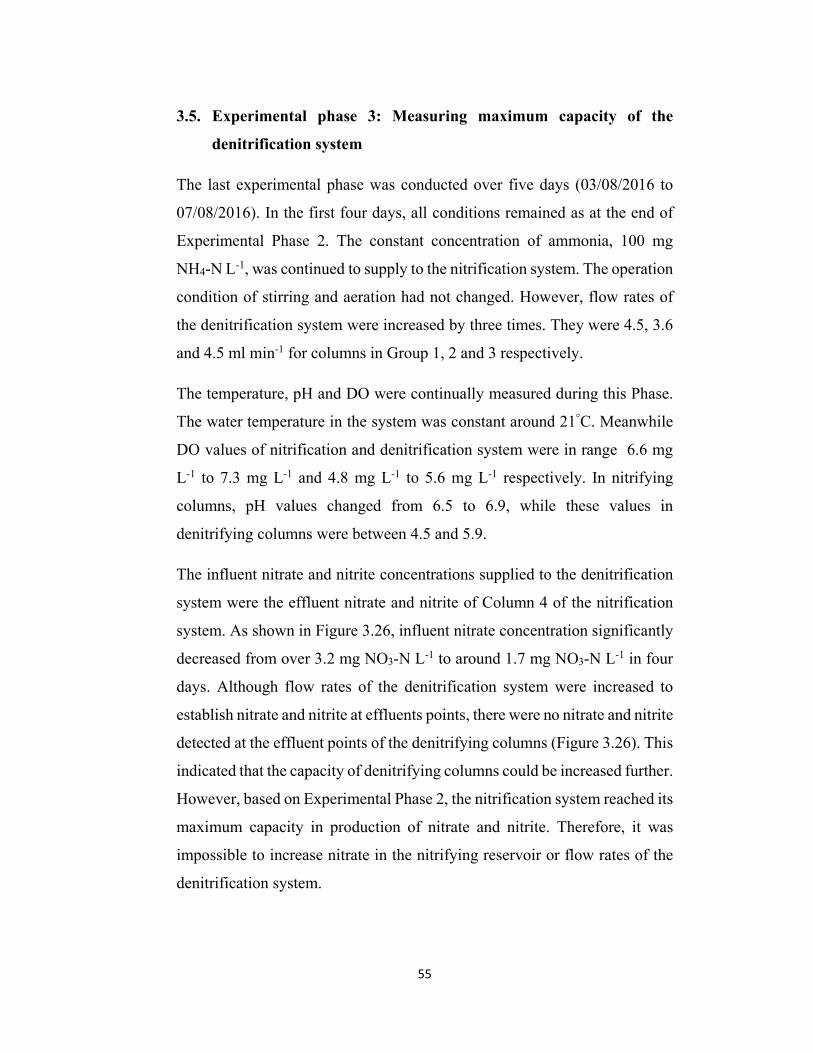
55
3.5. Experimental phase 3: Measuring maximum capacity of the
denitrification system
The last experimental phase was conducted over five days (03/08/2016 to
07/08/2016). In the first four days, all conditions remained as at the end of
Experimental Phase 2. The constant concentration of ammonia, 100 mg
NH4-N L-1, was continued to supply to the nitrification system. The operation
condition of stirring and aeration had not changed. However, flow rates of
the denitrification system were increased by three times. They were 4.5, 3.6
and 4.5 ml min-1 for columns in Group 1, 2 and 3 respectively.
The temperature, pH and DO were continually measured during this Phase.
The water temperature in the system was constant around 21°C. Meanwhile
DO values of nitrification and denitrification system were in range 6.6 mg
L-1 to 7.3 mg L-1 and 4.8 mg L-1 to 5.6 mg L-1 respectively. In nitrifying
columns, pH values changed from 6.5 to 6.9, while these values in
denitrifying columns were between 4.5 and 5.9.
The influent nitrate and nitrite concentrations supplied to the denitrification
system were the effluent nitrate and nitrite of Column 4 of the nitrification
system. As shown in Figure 3.26, influent nitrate concentration significantly
decreased from over 3.2 mg NO3-N L-1 to around 1.7 mg NO3-N L-1 in four
days. Although flow rates of the denitrification system were increased to
establish nitrate and nitrite at effluents points, there were no nitrate and nitrite
detected at the effluent points of the denitrifying columns (Figure 3.26). This
indicated that the capacity of denitrifying columns could be increased further.
However, based on Experimental Phase 2, the nitrification system reached its
maximum capacity in production of nitrate and nitrite. Therefore, it was
impossible to increase nitrate in the nitrifying reservoir or flow rates of the
denitrification system.

56
Figure 3.26. Change in influent and effluent nitrate and nitrite of the
denitrification system in Experimental Phase 3 under following conditions:
hydraulic rate of 0.3 L min-1, denitrification hydraulic rate of 12.6 ml min-1,
recirculation flow, and ammonium nitrogen of 4 mg NH4-N L-1
In order to evaluate capacity of the denitrification system, another approach
was applied. The nitrification was paused and all of the water in
denitrification columns was pumped out and replaced by 35L of new lake
water with 22.86 mg NO3-N L-1. The operation of the air pump and stirring
pump was continued. The system was operated over one day and sampling
was conducted hourly.
The results of converted nitrate in a day are as shown in Figure 3.27. Initial
nitrate concentration in denitrifying columns were 22.86 mg NO3-N L-1.
After 24 hours, nitrate concentration in the reservoir remained over 7 NO3-N
L-1, while these figures in Column 3 and 4 were 2.3 NO3-N L-1 and 0.36 NO3-
N L-1 respectively. In Column 1 and 2 of Group 1, nitrate was not detected at
the effluent discharge points.
0.0
0.5
1.0
1.5
2.0
2.5
3.0
3.5
4.0
4.5
5.0
1 2 3 4
Conc
entr
atio
n (m
g/L)
Time (days)
Effluent NO3 -N of N4 Effluent NO3 -N of D1 Effluent NO3 -N of D2
Effluent NO3 -N of D3 Effluent NO3 -N of D4 Effluent NO2 -N of N4
Effluent NO2 -N of D1 Effluent NO2 -N of D2 Effluent NO2 -N of D3
Effluent NO2 -N of D4

57
Figure 3.27. Change in influent and effluent nitrate of the denitrification
system in a last day of Experimental Phase 3 under following conditions:
hydraulic rate of 42 ml min-1, recirculation flow, and initial ammonium
nitrogen of 22.86 mg NO3-N L-1
0
2
4
6
8
10
12
14
16
18
20
22
24
26
28
30
2pm 4pm 6pm 8pm 10pm 12pm 2am 4am 6am 8am 10am 12pm 2pm
Conc
entr
atio
n (m
g/L)
Time (days)
Influent NO3 -N Effluent NO3 -N of D1 Effluent NO3 -N of D2
Effluent NO3 -N of D3 Effluent NO3 -N of D4

58
4. Discussion
4.1. Nitrifiers and denitrifiers development
Substrate
In order to achieve bacterial growth in the Commissioning Phase of the study,
calcium carbonate was added to dilute activated sludge as a necessary
substrate for bacteria growth. As mentioned, nitrification includes a two-step
process of ammonia oxidizing bacteria and nitrite oxidizing bacteria with
Nitrosomonas sp. and Nitrobacter sp. bacteria respectively. Both bacteria are
autotrophic and their carbon source for the synthesis of cellular material is
inorganic carbon. Absence of an external inorganic carbon source during this
period could result in low bacteria growth. Therefore, 70 mg L-1 of calcium
carbonate was supplied when media was immersed in activated sludge
solution and other 35 mg L-1 of calcium carbonate was added when
recirculation flows was initiated. These calcium carbonate masses played a
role as a food source to enhance nitrifiers growth in the nitrification system.
However, ammonium is not consumed by nitrifiers because bacteria only use
ammonium as their energy transfer source (Villaverde, Garcia-Encina & Fdz-
Polanco 1997).
A number of studies have reported the importance of inorganic carbon in
nitrification processes. These studies have confirmed that low inorganic
carbon concentration in water sources limits nitrification activity (Furukawa,
Kenji et al. 1993; Guisasola et al. 2007; Kimura, Isaka & Kazama 2011; Wett
& Rauch 2003). Furthermore, Guisasola et al. (2007) indicated that the
minimum inorganic carbon concentration needed to maintain nitrification
rate is 3 mmol C L-1 in a water source. If its concentration was lower,
nitrification rate was limited, especially for ammonia oxidizing process. For
the oxidation of 1 mg ammonium to nitrate, it regularly consumes around 7.0
mg alkalinity (as calcium carbonate). This theory has been confirmed by a

59
range of studies (Chen, Ling & Blancheton 2006; Liptak & Liu 1997; van
den Akker 2008). The complete nitrification process is described as Equation
4.1 as follows (Zhang & Bishop 1996).
NH4+ + 1.83O2 + 1.98HCO3
- →
0.021C2H7O2N + 0.98NO3- +1.041H2O +1.88CO3
- (Eq.4.1)
Calcium carbonate added to dilute activated sludge is not only the substrate
for autotrophic biomass but also increases the pH in solution to buffer
acidification. It is recognized that the nitrification process strip carbon
dioxide and hydrogen is released. As a result, pH significantly reduces and
an acid environment in the water source can be established (Villaverde,
Garcia-Encina & Fdz-Polanco 1997; Wett & Rauch 2003). Meanwhile, an
optimum pH for ammonia oxidizing bacteria and nitrite oxidizing bacteria is
in the range of 7.0 to 9.0 (Zhang & Bishop 1996). Hence alkalinity such as
calcium carbonate is useful to maintain and improve pH in a water source.
pH, DO and temperature
In a range of factors affecting nitrification and denitrification processes, pH,
DO and temperature are considered as primary parameters. Any change in
these factors could cause a low growth rate of bacteria. The nitrifiers growth
rate is limited when pH is lower than 6.5 or higher than 9.0. With lower pH,
development of nitrifiers might be prevented because acid formation occurs
and it is toxic to bacteria. In contrast, with higher pH values, the oxidation
process might be inhibited or nitrite is accumulated in the system (Wu, Zheng
& Xing 2014). In the Commissioning Phase, pH was maintained at optimal
values between 7.3 and 8.6 in the nitrification system. In this condition,
nitrifiers could achieve a high rate of growth (Lájer 2012). Meanwhile, pH
values in denitrifying columns were in a range of 5.0 to 6.6 which were lower
than optimum pH value between 7.0 and 7.5 (Thomas, Lloyd & Boddy 1994).
The pH of the denitrification system was lower than that within the

60
nitrification system. This led to decomposition of barley straw in the
denitrifying columns (Holmes, Plant & Water 2010).
Dissolved oxygen and nitrifiers growth is believed to have a close
relationship. The maximum growth rate of nitrifiers has been reported to be
affected by dissolved oxygen concentration over 4.0 mg L-1 (Poquillon &
Petit 1989). In order to complete nitrification, a relatively large amount of
oxygen is required. In reality, approximately 4.6 mg of oxygen is necessary
to oxidize 1.0 mg ammonium to nitrate, Table 4.1 by Gerardi (2003).
Table 4.1. Oxygen consumption for complete nitrification (modified from
Gerardi 2003)
Biochemical reaction Oxygen consumption (mg)
1 mg NH4-N to 1 mg NO2-N 3.43
1 mg NO2-N to 1 mg NO3-N 1.14
1 mg NH4-N to 1 mg NO3-N 4.57
In the Commissioning Phase, dissolved oxygen concentration in the NTFs
was in range of 6.0 mg L-1 to 7.6 mg L-1 in the first 10 days and 4.0 mg L-1 to
5.9 mg L-1 in the last 10 days. The concentration was not optimum for
nitrification in the first 10 days of the Commissioning Phase because in those
days, ammonium concentration was quite high. However, in the last 10 days
of this Phase when ammonium concentration declined to 2.5 mg NH4-N L-1,
the oxygen demand also significantly reduced. Dissolved oxygen
concentration in the denitrification system declined from around 4.0 mg L-1
to over 1.0 mg L-1, however, it still did not reach to the optimum value of
0.15 mg DO L-1 to 0.35 mg DO L-1 (Hocaoglu et al. 2011) for denitrifying
process. As a result, denitrification process occurred but it might not obtain
maximum rate. Although, effluent dissolved oxygen concentrations of
denitrifying columns were higher than the optimum value, dissolved oxygen

61
concentrations inside denitrifying columns might reach the optimum value
because environments in the denitrifying columns are not homogeneous.
Hence, dissolved oxygen concentrations at different points are may not be
similar.
In terms of temperature, although the Commissioning phase was operated in
cold weather conditions (May and June 2016), temperature in the water
source was regularly between 19°C and 21°C because the experiment was
conducted in a room of the Laboratory. The temperature during the
experiment period was not an optimum temperature for both nitrifiers and
denitrifiers growth, however, these temperatures did not inhibit bacteria
activity. Indeed, optimum temperature for biological processes is believed to
be between 25oC and 35oC. In the range of this temperature, the nitrifiers
growth might attain a maximum rates (Cruikshank & Gilles 2007;
Tchobanoglous et al. 2003). Conversely, higher or lower temperatures can
limit nitrifying and denitrifying bacteria activity. Tchobanoglous et al. (2003)
indicated that nitrification and denitrification ceased, when the temperature
rises to 50°C. In addition, when temperature is under 15°C, bacteria become
quite inactive and autotrophic nitrifying bacteria cease functioning at around
5°C (Henze 2008).
Nitrifiers development
As shown in Figure 3.3, ammonia oxidizing bacteria had developed since day
1 of the last stage of the Commissioning Phase and it was maintained during
the period, whereas, nitrite oxidizing bacteria only appeared and developed
after 3 days of this stage. There are several explanations for this situation
including the time required for bacteria growth, flow rates and total organic
carbon. Firstly, it is not simple to start-up a nitrifying system in a short time.
It regularly requires up to 30 days to grow bacteria (Jubany et al. 2008;
Sudarno et al. 2010) and up to 100 days to reach a nitrifying stability (Vallés-

62
Morales et al. 2004; Verstraete, Vanstaen & Voets 1977). In comparison, the
Commissioning Phase of this study was conducted over 20 days, therefore,
the presentation of oxidizing bacteria understandably might be slow.
Secondly, a part of ammonium mass was pumped and kept to the denitrifying
columns in several days before returning the nitrifying reservoir. This might
lead to reduce ammonium concentration in the nitrification system. As a
result, the efficiency of nitrifying columns was affected. The total
denitrification flow rate of 4.5 ml min-1 was very low. Furthermore, the
volume of a denitrifying column was 6.37 L, while flow rates were 1.5, 1.2
and 1.5 ml min-1 for Group 1, 2 and 3 respectively. As a result, it required 3
days to replace all the water in Group 2 and 3, meanwhile 6 days was required
for Group 1.
Finally, total organic carbon was considered as a main factor affecting growth
of nitrifiers. A large amount of total organic carbon was washed out from
barley straw in the denitrification system and it was returned to the
nitrification system (Figure 3.11). This carbon source may have suppressed
the nitrification process. van Den Akker et al. (2010) demonstrated the
impact of high concentrations of organic carbon on the performance of the
nitrifying trickling filter. They found that if organic carbon was of a greater
load than 5.5 mg sBOD5 L-1, the entire filter bed of the nitrification system
was severely inhibited.
Denitrifiers development
The results shown from Figure 3.5 to Figure 3.8 reveal that bacteria in
denitrifying columns developed well. Influent nitrate in each column was
transferred to nitrogen gas and effluent nitrate could not be found in effluent
points. However, nitrite was still found at effluent points of all columns. This
finding suggests that it might require more time to develop bacteria in the
denitrification system to completely remove nitrate and nitrite.

63
4.2. Nitrification performances
The performances of the nitrification system was evaluated in two steps. In
the first step, the nitrification was primarily defined as its capacity to
converting ammonium to nitrate and nitrite. This step was conducted in the
first stage of Experimental Phase 1. Based on this primary calculation, the
average maximum capacity of the nitrification system was determined in the
next step which was presented as Experimental Phase 2.
As mentioned above, in order to basically define nitrifying capacity, 150 mg
NH4-N was added to 35 L of water in the nitrifying reservoir. The initial
ammonium concentration was 4.3 mg NH4-N L-1. The results showed in
Figure 3.12 indicated that after one day, ammonium concentration in the
reservoir significantly reduced to 1.9 mg NH4-N L-1. In the next day, this
value was 0.034 mg NH4-N L-1 and no ammonium was found in the following
days. These ammonium concentrations were not original values because
water in the nitrifying reservoir was diluted by return flows 4.2 ml min-1 (6.05
L day-1) from the denitrification system. The original ammonium
concentration values at the nitrifying reservoir were 2.3 mg NH4-N L-1 and
0.04 mg NH4-N L-1 for the first and second day respectively. They were
defined as Equation 4.1 below (Doucette 1997).
2 21
1
C xVC
V (Eq. 4.1)
V1 = V - Vd (Eq. 4.2)
Where C1 is original ammonium concentration at the measure time (mg NH4-
N L-1); C2 is diluted ammonium concentration at the measure time (mg NH4-
N L-1); V1 is original water volume in the nitrifying reservoir (V1 = 28.95 L)
and is defined as Equation 4.2; V2 is diluted volume of water in the nitrifying
reservoir (V2 = 35 L); V is initial volume of water in the nitrifying reservoir

64
(V = V2 = 35L); Vd is volume of water pumped to the denitrification per day
Vd = 6.05 L.
The converted rate of ammonium in the first day was 2.0 mg NH4-N L-1 and
this figure was 2.26 mg NH4-N L-1 in the second day. Basically, the average
converted rate of ammonium in the nitrification system was 2.13 mg NH4-N
L-1 day-1. It was equal to a mass of 75 mg NH4-N converted per day by the
system as a whole. The data analysis of ammonium showed that no
ammonium was detected in denitrification columns during the stage.
The data in Figure 4.1 indicated that most of ammonium mass was converted
to nitrate and nitrite in the first two days. In the first day, 1.36 mg NO3-N
L-1 was formed in comparison with 0.2 mg NO2-N L-1. The remaining
ammonium concentration was 1.9 mg NH4-N L-1. The total values of
ammonium, nitrate and nitrite concentration was 3.46 mg L-1. This
concentration was diluted by return flow from the denitrification system,
therefore it is necessary to convert to original value by Equation 4.1 and 4.2.
As a result the total original concentration of ammonium, nitrate and nitrite
was 4.18 mg L-1 compared to 4.3 mg L-1 in the influent. It is obvious to
recognize that 2.8% (0.12 mg L-1) of influent mass was unaccounted for after
one day. The deficient mass could be explained by a small amount of nitrate
and nitrite were pumped to the denitrification system and were converted to
nitrogen gas. Similarly, the decline of total ammonium, nitrate and nitrite in
following days can also be explained in the same way.
However, in day 2, the original total values of ammonium, nitrate and nitrite
concentration was nearly 4.45 mg L-1 (diluted concentration value was 3.68
mg L-1). This number was 3.5% higher than the initial value 4.3 mg L-1. In
reality, it is not simple to obtain 100% mass balance in complex experimental
systems, various factors could affect experimental results.

65
Figure 4.1. Ammonium, nitrate and nitrite in the nitrifying reservoir during
the first stage of Experimental Phase 1 under following conditions:
Nitrification hydraulic rate of 0.3 L min-1, denitrification hydraulic rate of 4.5
ml min-1, recirculation flow, and initial ammonium nitrogen of 4.3 mg NH4-
N L-1
Based on the primary capacity of the nitrification system, the next step was
conducted as Experimental Phase 2. The selected ammonium mass was 150
mg NH4-N day-1 which was twice that compared to the initial value of 75 mg
NH4-N day-1. It was selected because the loss of ammonium mass could be
higher when a part of the ammonium was pumped to denitrifying columns.
The converted ammonium masses were calculated based on Equation 4.3
below and their results were presented in Figure 4.2. The results indicated
that in the first two days, converted ammonium masses were unusual. While
144 mg NH4-N was converted in the first day, this figure was only 20mg
NH4-N in the second day. In the following days converted ammonium masses
fluctuated around the average value which was nearly 83 mg NH4-N per day.
Mc = Min – Mout (Eq. 4.3)
0.0
0.5
1.0
1.5
2.0
2.5
3.0
3.5
4.0
4.5
5.0
0 1 2 3 4 5 6 7
Conc
entr
atio
n (m
g/L)
Time (days)
Influent NH4 -N influent NO3 -N Influent NO2 -N

66
Mout = Ci.Vi (Eq. 4.4)
Where Mc is daily mass of ammonium was converted (mg); Min is total daily
input ammonium mass (mg); Mout is total daily output ammonium mass (mg)
and Mout is measured as Equation 3.7; Ci and Vi are daily ammonium
concentrations and volumes of each nitrifying and denitrifying columns,
which were shown as Figure 3.22.
Figure 4.2. Daily average converted ammonium mass 1 under following
conditions: Nitrification hydraulic rate of 0.3 L min-1, denitrification
hydraulic rate of 4.5 ml min-1, recirculation flow, and initial ammonium
nitrogen of 4.3 mg NH4-N L-1
Figure 4.3 shows the total converted ammonium mass during 13 days of the
Experimental Phase 2. During this phase, 1650 mg NH4-N was added to the
system, of which nearly 1077 mg NH4-N was converted to nitrate and nitrite,
with only 573 mg NH4-N remaining. The average ammonium removal rate
was 83 mg NH4-N day-1. It corresponds to 0.2 mg NH4-N L-1 h-1. Although
this rate was higher than that in the Experimental Phase 1, it was not
considered overly high. In a study, Mai et al. (2016) achieved ammonia
0
20
40
60
80
100
120
140
160
1 2 3 4 5 6 7 8 9 10 11 12 13
Conc
entr
atio
n (m
g)
Time (days)Daily converted NH4-N mass Average daily converted NH4-N mass

67
removal rate of 0.44 mg NH4-N L-1 h-1. The pilot in their study was quite
similar to the nitrification system in this study, however, installation of
nitrifying columns was parallel rather than in series as in this study. The
ammonium conversion rate in the study could not achieve a higher level
because the external energy source for nitrifying bacteria was limited. Figure
3.25 indicates that inorganic carbon concentration during Phase 2 was lower
than 1.1 mg L-1. This concentration was very low and, as a result, it could
inhibit the nitrification process (Guisasola et al. 2007; Kimura, Isaka &
Kazama 2011). Therefore, the average maximum ammonium conversion rate
achieved 83 mg NH4-N per day.
Figure 4.3. Defining total converted ammonium mass 1 under following
conditions: Nitrification hydraulic rate of 0.3 L min-1, denitrification
hydraulic rate of 4.5 ml min-1, recirculation flow, and initial ammonium
nitrogen of 4.3 mg NH4-N L-1
144 164262
337421
505610
690765 831
907993
1077
0
200
400
600
800
1000
1200
1400
1600
1800
1 2 3 4 5 6 7 8 9 10 11 12 13
Conc
entr
atio
n (m
g)
Time (days)
Total converted NH4-N mass Total imput NH4-N massTotal remain NH4-N mass

68
4.3. Denitrification performances
Denitrification capacity
The primary average capacity of the denitrification system was defined to be
approximately 0.62 mg NO3-N L-1 day-1 in the Experimental Phase 1. The
result was calculated based on the second stage of the Experimental Phase 1
(21/06/2016 to 27/06/2016). As shown in Figure 4.4, initial total ammonia
nitrogen including ammonium, nitrate and nitrite during this period
fluctuated around 70 mg day-1. After a day, this number significantly reduced
to around 40 mg day-1. This reduction was caused by the removal of nitrate
from the denitrification system. This system removed daily over 30 mg NO3-
N. The nitrate removal rate was only a primary value because it was
calculated based on the denitrification flow rate 4.2 ml min-1. The rate could
change if nitrate concentration or flow rate was not stable (Canto et al. 2008;
Karanasios et al. 2010; Liu et al. 2013; Wang et al. 2013). This theory is in
line with previous studies. For example, Park, Choi and Pak (2005)
conducted a denitrification study with an initial nitrate concentration in the
range of 20 mg NO3-N L-1 to 150 mg NO3-N L-1. Their results revealed that
the nitrate removal rate depended on initial nitrate concentration. The
removal rate increased when nitrate loading increased. Similarly, the change
in nitrate removal rate was observed in a study by Park et al. (2005) where
the initial nitrate concentration changed from 20 mg NO3-N L-1 to over 490
mg NO3-N L-1.

69
Figure 4.4. Total ammonia nitrogen (TAN) and nitrate removal mass 1 under
following conditions: Nitrification hydraulic rate of 0.3 L min-1,
denitrification hydraulic rate of 4.5 ml min-1, recirculation flow, and initial
ammonium nitrogen of 0.5 mg NH4-N L-1 day-1
Although influent nitrate concentration at the end of Phase 2 was quite high
an approximately 6.0 mg NO3-N L-1, in an attempt to achieve nitrate at
effluent points, indicative of the maximum denitrification rate, of denitrifying
columns, denitrification flow rates increased three times from 1.5, 1.2 and
1.5 ml min-1 to 4.5, 3.6 and 4.5 ml min-1 for group 1, 2 and 3 respectively.
However after four days of the Experimental Phase 3, no nitrate or nitrite
were detected at effluent points of the denitrifying columns. This result
demonstrated that the capacity of the denitrification was much higher, and
the finding is in agreement with previous studies which revealed that the
efficiency of denitrification systems was high. These studies found that large
amount of nitrate (approximately 13 mg L-1) could be converted to nitrogen
gas in a short time (Kaplan et al. 1987; Kim et al. 2010; Schmidt & Clark
2012).
31.88 32.4527.93
33.61 30.38 27.9431.48
0
10
20
30
40
50
60
70
80
8 9 10 11 12 13 14
Conc
entr
atio
n (m
g)
Time (days)
Nitrate removal mass Initial TAN Final TAN

70
Figure 4.5 below presents trends in concentration of influent ammonium and
nitrate at the nitrifying reservoir. It is clear that while ammonium
concentration had an increasing trend during the time, nitrate concentration
which was produced from influent ammonium was on a continual decline.
Ammonium concentration increased from over 10 mg NH4-N L-1 to nearly
15 mg NH4-N L-1 in four days. Conversely, nitrate concentration decreased
by approximately 1.6 mg NO3-N L-1 from 3.2 mg NO3-N L-1 to 1.6 mg NO3-
N L-1. From the data, it could be inferred that the ammonium removal rate
reached maximum capacity and, therefore, could not produce more nitrate.
Meanwhile, nitrate mass could disappear in next several days. Therefore, a
decision was made to stop the system and change the method for defining the
maximum capacity of the denitrification system.
Figure 4.5. Ammonium and nitrate in the nitrifying reservoir under
following conditions: hydraulic rate of 0.3 L min-1, denitrification hydraulic
rate of 12.6 ml min-1, recirculation flow, and ammonium nitrogen of 4 mg
NH4-N L-1
0
2
4
6
8
10
12
14
16
18
1 2 3 4
Conc
entr
atio
n (m
g/L)
Time (days)Influent NH4 -N influent NO3 -N
Linear (Influent NH4 -N) Linear (influent NO3 -N)

71
Accordingly, the nitrification system which was applied to provide nitrate to
the denitrification system by converting ammonium to nitrate was stopped.
An external nitrate source was utilized as influent nitrate to the denitrifying
columns. In addition, the denitrification flow rates were increased 10 times
and the sampling time was changed from daily to hourly. All changes were
made to ensure that nitrate could be found at effluent points of the
denitrification system and, as a result, effluent nitrate was detected from the
denitrification columns, indicating saturation of the denitrification capacity
of the columns (Figure 3.27).
Total nitrate removal mass was calculated based on Equation 4.3 and 4.4 in
which ammonium mass was replaced by nitrate mass. The results are shown
in Figure 4.4 below. Input nitrate mass was 800 mg NO3-N, and after 24
hours this mass remained 84 mg NO3-N. Consequently, 716 mg NO3-N was
converted to nitrogen gas in a day at a total flow rate was 42 ml min-1. It
equates to a nitrate removal rate of approximately 11 mg NO3-N L-1 h-1. The
efficiency of the denitrification system was contributed to by the capacity of
three Groups of denitrifying columns. Group 1 with denitrifying column 1
and 2 accounted for over 43%of the total nitrate removal mass. Group 2 and
3 contributed nearly 22 and 35%respectively (Figure 4.5). The efficiency of
Group 1 was highest because it combined two denitrifying columns while
Group 2 and 3 only had one column.

72
Figure 4.4. Total converted and remaining nitrate in a day of the
denitrification system in Experimental Phase 3 under following conditions:
hydraulic rate of 42 ml min-1, recirculation flow, and initial ammonium
nitrogen of 22.86 mg NO3-N L-1
Figure 4.5. Nitrate removal mass of groups in the denitrification system in
Experimental Phase 3 under following conditions: hydraulic rate of 42 ml
min-1, recirculation flow, and initial ammonium nitrogen of 22.86 mg
NO3-N L-1
0
100
200
300
400
500
600
700
800
900
2pm 4pm 6pm 8pm 10pm 12pm 2am 4am 6am 8am 10am 12pm 2pm
Conc
entr
atio
n (m
g/L)
Time (days)Total converted NO3-N mass Total remain NO3-N mass
43.3%
21.9%
34.8%
0%
10%
20%
30%
40%
50%
60%
70%
80%
90%
100%
Group 1 Group 2 Group 3
Nitr
ate
rem
oval
mas
s

73
Organic carbon and spongy iron
Organic carbon is considered to be one of the most important factors
controlling the denitrification rate. It directly influences the heterotrophic
process which accounts for the majority of denitrifiers in the experiment
(Knowles 1982). In order to serve organic carbon for denitrifiers bacteria,
barley straw was utilized in the experiment. The changes in total organic
carbon during the whole time of the experiment is shown in Figure 4.6. It
should be noted that all of the water in the nitrification and denitrification
systems was replaced at the end of Commissioning Phase and Experimental
Phase 1. During the Commissioning phase the concentrations of total organic
carbon in each denitrifying column were very high and these concentrations
significantly reduced after 10 days of the Phase. In general, it reduced around
2.5 times from around 800 mg L-1 to over 300 mg L-1. The high total organic
carbon concentrations in denitrifying columns could be caused by wash out
of the soluble components of barley straw. The components were washed out
when barley straw in the columns was first immersed in water (Holmes, Plant
& Water 2010).
Total organic carbon concentrations in Column 1 and 4 immediately reached
the highest value at the first day, while Column 2 and 3 achieved the highest
concentration in the following day. Column 2 was installed in series with
Column 1, effluent flow of Column 1 containing high total organic carbon
concentration was the influent flow to Column 2. As a result, the
concentration of total organic carbon in Column 2 increased and took time to
reach the highest value. In addition, the total organic carbon concentration in
this column was maintained higher than that in other columns during the
Experiment. In terms of total organic carbon in Column 3, its flow rate was
lower than other columns and this could be a reason for taking longer to reach
the highest TOC concentration.

74
In Phase 1, the concentrations of total organic carbon in columns changed in
range from 75 mg L-1 to over 200 mg L-1. These values were higher than
those in Phase 2 and 3 which were between approximately 20 mg L-1 and
nearly 140 mg L-1. This difference could be explained by the changes of
influent ammonium concentration. While total ammonium mass added to the
system in Phase 1 was only 360 mg NH4-N, this number in Phase 2 and 3
was 2050 mg NH4-N. The increase of ammonium concentration led to an
increased nitrate concentration. As a result, more organic carbon was utilized
to convert nitrate to nitrogen gas in the denitrification system. Based on the
performance of the denitrification system, it could be seen that barley straw
was a good external carbon source for denitrifiers. This result is in line with
other studies of Holmes, Plant and Water (2010), Hashemi et al. (2010) and
Zhou (2010).
In the previous studies, spongy iron was evaluated as a suitable material for
deoxygenation, which can assist in enhancing the denitrification rate (Huang
et al. 2015; Liu et al. 2013). Dissolved oxygen is removed by spongy iron via
chemical reduction process as Equation 4.5 (Della Rocca, Belgiorno & Meriç
2007).
2Fe0 + O2 + 2H2O → 2Fe2+ + 4OH- (Eq. 4.5)
Based on the results indicating the benefits of utilizing spongy iron, the
Experiment applied spongy iron into the denitrification system to remove
dissolved oxygen. As mentioned above, 20 g of spongy iron was added to
each of Column 2, 3 and 4. However, to re-evaluate and compare its
effectiveness in the system, Column 1 was free of spongy iron. The changes
in dissolved oxygen during the whole experimental time is shown in Figure
4.7. It can be seen from the graph that the performance of spongy iron was
quite good in the Commissioning Phase. Dissolved oxygen concentrations in
denitrifying columns reduced from average 3.6 mg L-1 to over 1.2 mg L-1.
The Figure 4.7 also indicates that dissolved oxygen concentration in columns
75
with spongy iron was lower than that in Column 1 without spongy iron.
However, the dissolved oxygen concentration significantly increased in the
first 8 days of Phase 1 and reached about 4.5 mg L-1 on average before
slightly declining until the end of this phase. The trend of changes in
dissolved oxygen in Phase 1, 2 and 3 was not as clearly shown. Although
dissolved oxygen concentrations in columns with spongy iron were still
lower than that in Column 1 without spongy iron, the differences were not
great. In short, the effectiveness of spongy iron in this study was limited. This
could have been caused by the limited quantity of spongy iron employed.
Leading to the suggestion that it might require more spongy iron to reduce
and maintain low dissolved oxygen concentration in the denitrification
system.

76
Figure 4.6. Change in total organic carbon in the denitrification system during whole experiment under following conditions:
recirculation flow; hydraulic rate of 1.5, 1.2 and 1.5 ml min-1 for Group 1, 2 and 3 respectively in the first three experimental
phases, hydraulic rate of 4.5, 3.6 and 4.5 ml min-1 for Group 1, 2 and 3 respectively in the last Phase; temperature of 20 –
21°C; and pH of 4.4 – 6.6
0
100
200
300
400
500
600
700
800
900
1000
1 2 3 4 5 6 7 8 9 10 11 12 13 14 15 16 17 18 19 20 21 22 23 24 25 26 27 28 29 30 31 32 33 34 35 36 37 38 39 40 41
Conc
entr
atio
n (m
g/L)
Time (days)TOC of D1 TOC of D2 TOC of D3 TOC of D4
Phase 1 Phase 2 Phase 3
Commissioning phase

77
Figure 4.7. Change in dissolved oxygen in the denitrification system during whole experiment under following conditions:
recirculation flow; hydraulic rate of 1.5, 1.2 and 1.5 ml min-1 for Group 1, 2 and 3 respectively in the first three phases,
hydraulic rate of 4.5, 3.6 and 4.5 ml min-1 for Group 1, 2 and 3 respectively in the last Phase; temperature of 20 – 21°C; pH
of 4.4 – 6.6; barley straw and spongy iron in Column 2, 3 and 4; and only barley straw in Column 1
0
1
2
3
4
5
6
7
8
1 2 3 4 5 6 7 8 9 10 11 12 13 14 15 16 17 18 19 20 21 22 23 24 25 26 27 28 29 30 31 32 33 34 35 36 37 38 39 40 41
Conc
entr
atio
n (m
g/L)
Time (days)
DO of D1 DO of D2 DO of D3 DO of D4
Phase 1 Phase 2 Phase 3Commissioning phase

78
5. Integration of nitrification and denitrification model
5.1. Scenario
The public water utility supplying drinking water is required to build a water
treatment plant for a small rural town with a population of 1,000 people. The
standard water usage is 150 L day-1 per person and the total water supply
demand of the town is 150 m3 d-1. Treated water must always meet the
requirements of national drinking water standards and guidelines. The water
source is pumped from a bore located near the river (Figure 5.1) which flows
through a cultivated field.
Figure 5.1. Location of water source supplying the water treatment plant
Initial water analysis results from the bore reveals that, in general, the water
quality satisfies requirements of raw water for a water treatment plant.
However, ammonium and nitrate were detected in water samples with the
ammonium concentration being around 3 mg NH4 L-1 (2.5 mg NH4-N L-1)
and the value of nitrate being approximately 200 mg NO3 L-1 (45.2 mg NO3-
N L-1). Both ammonium and nitrate concentration values exceed the
standards in the national guidelines. In detail, the average value of
ammonium is over 6 times higher than the guideline value of 0.5 mg NH4
L-1 (0.41 mg NH4-N L-1), while nitrate concentration is nearly 4 times above
River
Bore

79
with the national standard safety value of < 50 mg NO3 L-1 (11.3 mg NO3-N
L-1). The initial investigations indicate that poor agricultural activities are a
main reason leading to ammonium and nitrate contamination. Although there
are positive changes in agricultural activities in the field, there is a likelihood
of ammonium and nitrate contamination still occurring in the near future.
Therefore, units for removing ammonium and nitrate is required in the water
treatment plant.
5.2. Hypotheses
In order to calculate the dimensions of decontamination units removing
ammonium and nitrate in the water source, several hypotheses are proposed
based on results of the laboratory study reported here including:
(1) Relationship between ammonium concentration and nitrification is
linear, in which nitrification is a mathematical function of
ammonium concentration. Nitrification rate is proportional to
polypropylene media surface area.
(2) Relationship between nitrate concentration and denitrification is
linear, in which denitrification is a mathematical function of nitrate
concentration. Denitrification rate is proportional to weight of barley
straw.
(3) A nitrogen mass balance is maintained during nitrification and
denitrification, subsequent differences in the total mass of soluble N
is assumed to be due to loss of N2 via denitrification.
As mentioned, results of Experimental Phase 2 revealed that the average
ammonium removal rate of the nitrification system was 83 mg NH4-N d-1,
while 4.88 m2 of polypropylene media was utilized for the removal of this
ammonium amount. It corresponds with an ammonium unit surface removal
of 17 mg NH4-N m-2 day-1. Based on this unit surface removal of ammonium

80
a mathematical relationship between ammonium removal mass per day and
media surface area was developed and is shown in Figure 5.2. Similarly, the
Experimental Phase 3 indicated that 716 mg NO3-N day-1 was removed by
three groups of the denitrification system, in which, 43, 22 and 35% of total
nitrate removal mass were contributed by Group 1, 2 and 3 respectively.
Although Group 1 accounts for 43% removal, the highest efficiency belonged
to Group 3 with 35% because Group 1 is comprised of two columns. The
relationship between nitrate removal mass and barley straw mass was
developed based on the highest efficiency of Group 3 (Figure 5.2). From the
figure, it can be seen that in order to remove 1 mg NO3-N day-1, it requires
0.8 g of barley straw. Accordingly, Figure 5.2 can be used to define necessary
media polypropylene volume and barley straw mass once the
ammonium/nitrate concentration is known.
Figure 5.2. Relationship among loading Ammonium/Nitrate mass, media
and barley straw
0
500
1000
1500
2000
2500
3000
3500
4000
4500
0
50
100
150
200
250
300
350
400
450
0.0 0.5 1.0 1.5 2.0 2.5 3.0 3.5 4.0 4.5 5.0
Barle
y st
raw
(g)
Med
ia (m
2)
Ammonium/nitrate mass (g/day)
Media (m2) Barley straw (g)
y = 800x
y = 59x

81
5.3. Ammonium and nitrate removal units
Nitrification unit
Nitrification rate and percentage nitrification closely depend on ammonium
surface load and hydraulic surface load. If these factors change, the efficiency
of the nitrification system could significantly increase or decline (van den
Akker 2008). Hence the necessary polypropylene media volume for the
nitrification system was calculated by two different methods including
ammonium surface load and hydraulic surface load methods.
a. Ammonium surface load method
Total ammonium nitrogen mass loaded to the nitrification system is defined
as Equation 5.1 below.
C = Q x C0 = 375 (g NH4-N day-1) (Eq. 5.1)
Where C is total ammonium nitrogen mass per day (g NH4-N day-1); Q is
total water supply demand of the town (Q = 150 m3); C0 is initial ammonium
nitrogen concentration (C0 = 2.5 mg NH4-N L-1).
The plastic media area required to remove ammonium from the water source
is 20,059 m2 (Equation 5.2) below. It corresponds to approximately 92 m3 of
plastic media which has a surface area of 240 m2 m-3. This result is similar to
the result referred from Figure 5.2.
2M
asl
CA 20,509 (m )
M (Eq. 5.2)
Where AM is the necessary area of plastic media for ammonium removal
(m2); Masl is mass of ammonium nitrogen surface load achieved in the
Experiment (Masl = 17 mg NH4-N m-2 day-1).

82
Based on the required plastic media volume, the primary inside dimensions
of the nitrification unit are 2.9 m in height and 7.0 m in diameter. The height
of plastic media is 2.4 m which equals the total height of media in
experimental nitrifying columns. The overall height of the nitrification tank
would include an additional 0.3 m at the top of the column to reduce
overspray and 0.2 m at the bottom of the nitrification tank used to collect
water before pumping to denitrification system; overall height would
therefore be about 2.9 m. The irrigation rate of the nitrification tank is 3.9
m-3 m-2 day-1 (Equation 3.2).
b. Hydraulic surface load method
The plastic media area required to remove ammonium in water source is 1667
m2 and calculated as Equation 5.3 below. It corresponds to approximately 7
m3 of plastic media which has surface are is 240 m2 m-3.
2M1
s
QA 1,667 (m )
Q (Eq. 5.3)
Where AM1 is the necessary area of plastic media for ammonium nitrogen
removal (m2); Q is total water supply demand of the town (Q = 150 m3); Qs
is hydraulic surface load of the Experiment (Qs = 0.09 L m-2 day-1).
The primary inside dimensions of the nitrification unit are calculated based
on required polypropylene media volume of 7 m3. Its dimensions are 2.9 m
in height and 2 m in diameter. Height of plastic media is 2.4 m which equals
to total height of media in experimental nitrifying columns. An additional 0.3
m collar to prevent overspray from the top of the filter and 0.2 m at the bottom
of the nitrification tank was used to collect water before pumping to
denitrification system. The irrigation rate of the nitrification tank is nearly 48
m-3 m-2 day-1 and it is calculated as Equation 3.2. Meanwhile, ammonium
surface load is approximately 225 mg NH4-N m-2 day-1 as Equation 5.4
below.

83
asl1M1
CM 225
A (mg NH4-N m-2 day-1) (Eq. 5.4)
Where Masl1 is mass of ammonium nitrogen surface load per day (mg NH4-N
m-2 day-1); C is total ammonium nitrogen mass per day (C = 375 g day-1); AM1
is required plastic media area for ammonium nitrogen removal (AM1 = 1,667
m2).
It can be seen from this data that the required polypropylene media volume
is very different between the two methods described. While the ammonium
nitrogen surface load method required up to 92 m3 of media, this number in
the hydraulic surface load method is only 7 m3. Furthermore, results in each
method has limitations. In the former method, although removal rate of
ammonium nitrogen 17 mg NH4-N m-2 day-1 is consistent with the
Experimental phase results, its irrigation rate is around 13 times lower than
that in the experiment. Meanwhile, in the latter method, the irrigation rate is
quite similar to the experimental value, however, the ammonium nitrogen
surface load is over 13 times higher than that in the experimental result. In
order to obtain good results in the nitrification process, a larger nitrification
unit which has dimensions with 2.9 m in height and 7 m in diameter is
selected for the water treatment plant.
Denitrification unit
Total nitrate nitrogen including nitrate in water source 45.2 mg NO3-N L-1
and nitrate converted from ammonium nitrogen 2.5 mg NO3-N L-1 was 47.7
mg NO3-N L-1. Total nitrate nitrogen needed to be removed is 7,155 g NO3-
N day-1 and it is defined as Equation 5.5 below.
CN = Q x CN0 = 7,155 (g NO3-N day-1) (Eq. 5.5)
Where CN is total nitrate nitrogen mass per day (g NO3-N L-1); Q is total
water supply demand of the town (Q = 150 m3); C0 is the initial nitrate
nitrogen concentration in water source (C0 = 47.7 mg NO3-N L-1).

84
Based on the relationship between nitrate concentration and barley straw
mass (Figure 5.2), it could be inferred that in order to remove 7,155 g NO3-
N day-1, it requires 5,724 kilogram of barley straw. Moreover, barley straw
density is indicated to be 112 kg m-3 in the study of Lerner and Goode (2000).
Therefore, the required volume of barley straw is about 51 m3. The primary
inside dimensions of the denitrification unit are 7 m in length, 3.7m in width
and 1.8 m in height, within which the height of barley straw is 1.5 m. The
freeboard of the denitrification tank is 0.3 m. The denitrification tank is
covered to limit the dissolution of oxygen into water in this tank. The
retention time in the denitrification tank is 8.2 hours, while this number is
over 7 hours in denitrifying Column 3, which was selected to build a
relationship between nitrate nitrogen concentration and barley straw mass.
Consequently, in order to remove 3 mg NH4 L-1 (2.5 mg NH4-N L-1) and 200
mg NO3 L-1 (45.2 mg NO3-N L-1) in 150 m3 water per day, nitrification and
denitrification units need to be built in the water treatment plant. The
dimensions of the nitrification tank are 2.9 m in height and 7.0 m in diameter,
while the dimensions of the denitrification tank are 7 m in length, 3.7m in
width and 1.8 m in height. Total polypropylene media volume is 92 m3 and
barley straw mass is 5,724 kilograms. Nitrification and denitrification units
are installed after the bore and before other units of the water treatment plant.
5.4. Limitation
Although a model which integrates nitrification and denitrification systems
was described in item 5.3 above, it is only a concept or beginning of the
design which needs to be developed further before application in the field.
There are several limitations of both nitrification and denitrification systems
which should be considered to improve the model quality, such as utilization
of recirculation flow and experimental time.

85
Firstly, utilization of recirculation flow could be a main reason leading to low
capacity of the nitrification system. Only 17 mg NH4-N m-2 day-1 were
removed by nitrifying columns in the Experiment and this result might be
quite low and under its real capacity. A number of previous studies showed
that the capacity of nitrification is quite high from 300 to 1000 NH4-N m-2
day-1 in comparison with the results of the experiment (Timmons &
Summerfelt 1998; Tucker & Hargreaves 2004). Similarly, in a study about
removal of ammonia by biological nitrification in a fixed film reactor, van
den Akker (2008) also indicated that a maximum nitrification rate can be
achieved between 800 and 1000 mg NH4-N m-2 day-1. Low nitrification
capacity in the experiment led to significantly increasing the polypropylene
media volume. As a result, dimensions of the nitrification tank are greater.
The main reason for limited nitrification capacity could be total organic
carbon in recirculation of the denitrification flow. The analysis of results
revealed that total organic carbon in effluent flows of the denitrification
system are quite high from around 50 mg L-1 to nearly 900 mg L-1.
Meanwhile, negative effects of organic carbon on the nitrification process
have been reported in many researches (Fdz-Polanco et al. 2000; Gupta &
Gupta 2001; Jie et al. 2009; Ling & Chen 2005; Okabe et al. 1996). Parker
and Richards (1986) concluded that nitrification is prohibited if organic
carbon concentration is greater than 20 mg sBOD5 L-1. Similarly, van den
Akker (2008) and van Den Akker et al. (2010) indicated that percentage
nitrification is a function of organic carbon load. It can achieve 90 to 100 %
of nitrification if the organic load is under 4 mg sBOD5 L-1. And this number
will decline if organic carbon concentration increases over 5.5 mg sBOD5
L-1.
In addition, the experiment was conducted within a short period of time
(25/05/2016 to 7/08/2016), therefore, its results might be limited. For
example, nitrification bacteria did not reach maximum capacity because they

86
require more time for their development. Verstraete, Vanstaen and Voets
(1977) and Vallés-Morales et al. (2004) reported that it requires up to 100
days for nitrification bacteria to develop and achieve stability. When the
development of bacteria is stable, percentage nitrification and nitrification
rate are notably increased. Furthermore, the nitrate and nitrite removal ability
of the denitrification system was only evaluated in limited time conditions
rather than over a long period. This evaluation may be not offer definitive
evaluation of performance. Furthermore, the study did not indicate how long
before barley straw remained active and effective and how often barley straw
replacement should occur. Several studies concluded that it requires at least
14 days to activate barley straw and 30 days to make it effective. According
to research, the effective period of barley straw is from 4 to 6 months (Barrett,
Littlejohn & Curnow 1999; Holmes, Plant & Water 2010). Therefore,
increasing period of observation to further determine the capacity and
longevity of barley straw should be considered for further study.
5.5. Future improvement
In order to improve the reliability of the integration of nitrification with
denitrification model, further research should be conducted with a larger
scale pilot and should consider utilization of single pass loading and an
expansion of the experimental time period. Indeed, results from a larger scale
pilot systems are more precise than those from smaller scale pilot systems
(Leon, Davis & Kraemer 2011). In reality, larger scale pilots more accurately
reflect the characteristics of the full scale systems.
In terms of flow, a single pass loading could assist in eliminating the effects
of total organic carbon from recirculation of denitrification flow which
contains a huge amount of organic carbon from barley straw. When the
effects of organic carbon are removed from the denitrification system,
nitrification rate and percentage nitrification results will be determined more

87
accurately. Additionally, a variety of hydraulic surface loads should be
deployed because this could enhance the accuracy of the relationships among
ammonium/nitrate mass, polypropylene media volume and barley straw mass
(Figure 5.2). This is a necessary precursor for integration of nitrification with
denitrification systems.
Furthermore, the experimental time should be increased so that analysis
results from nitrification and denitrification systems are more precise. With
a suitable length of experimental time, the nitrifying bacteria could achieve
more stable development, while necessary information about barley straw,
such as active time and longevity, would also be more accurately determined.

88
6. Conclusion
In conclusion, this study indicated that the nitrification system can remove
83 mg NH4-N day-1 with 4.88 m2 of polypropylene media. This corresponds
to 17 mg NH4-N m-2 day-1 of ammonium nitrogen removal per unit surface
area of the filter. While, 716 mg NO3-N was eliminated by the denitrification
system, Column 1 and 2 accounted for over 43% of the total nitrate nitrogen
removal mass. These figures were nearly 22% and 35% contributed to by
Column 3 and 4 respectively. Based on the experimental results and several
hypotheses, the relationship among ammonium/nitrate mass, polypropylene
media volume and barley straw mass was established (Figure 5.2). This graph
is a useful tool to measure the required polypropylene media surface area in
the nitrification system and barley straw mass in the denitrification system
when the initial ammonium/nitrate mass removal is pre-defined.
Furthermore, the application of this graph can enable the development of
suitable water treatment model for integrating a nitrification unit and a
denitrification unit that can efficiently remove ammonium and nitrate from
surface water and groundwater.

89
References
2H Plastic Australia n.d, Structured polypropylene fill packs, viewed 16 August 2016, <http://www.2h.com.au/products87f1.html?ProdID=7>.
Abbas, G, Zheng, P, Wang, L, Li, W, Shahzad, K, Zhang, H, Hashmi, MZH, Zhang, J & Zhang, M 2014, 'Ammonia Nitrogen Removal by Single-stage Process: A Review.(Report)', Journal of the Chemical Society of Pakistan, vol. 36, no. 4.
Angelopoulos, K, Spiliopoulos, I, Mandoulaki, A, Theodorakopoulou, A & Kouvelas, A 2009, 'Groundwater nitrate pollution in northern part of Achaia Prefecture', Desalination, vol. 248, no. 1, pp. 852-8.
Aslan, Ş & Türkman, A 2005, 'Combined biological removal of nitrate and pesticides using wheat straw as substrates', Process Biochemistry, vol. 40, no. 2, pp. 935-43.
Barrett, P, Littlejohn, J & Curnow, J 1999, 'Long-term algal control in a reservoir using barley straw', in Biology, Ecology and Management of Aquatic Plants, Springer, pp. 309-13.
Boller, M, Gujer, W & Tschui, M 1994, 'Parameters affecting nitrifying biofilm reactors', Water Science and Technology, vol. 29, no. 10-11, pp. 1-11.
Bryan, NS 2011, Nitrite and Nitrate in Human Health and Disease, Nutrition and Health, Totowa : Springer, Totowa.
Cam, PD, Lan, NTP, Smith, GD & Verma, N 2008, 'Nitrate and bacterial contamination in well waters in Vinh Phuc province, Vietnam', Journal of water and health, vol. 6, no. 2, p. 275.
Canto, C, Ratusznei, S, Rodrigues, J, Zaiat, M & Foresti, E 2008, 'Effect of ammonia load on efficiency of nitrogen removal in an SBBR with liquid-phase circulation', Brazilian Journal of Chemical Engineering, vol. 25, no. 2, pp. 275-89.
Cecen, F & Gönenç, I 1992, 'Nitrification–Denitrification of High-Strength Nitrogen Wastes in Two Up-Flow Submerged Filters', Water Science and Technology, vol. 26, no. 9-11, pp. 2225-8.
Chang, CC, Tseng, SK & Huang, HK 1999, 'Hydrogenotrophic denitrification with immobilized Alcaligenes eutrophus for drinking water treatment', Bioresource Technology, vol. 69, no. 1, pp. 53-8.

90
Chen, H, Liu, S, Yang, F, Xue, Y & Wang, T 2009, 'The development of simultaneous partial nitrification, ANAMMOX and denitrification (SNAD) process in a single reactor for nitrogen removal', Bioresource Technology, vol. 100, no. 4, pp. 1548-54.
Chen, S, Ling, J & Blancheton, J-P 2006, 'Nitrification kinetics of biofilm as affected by water quality factors', Aquacultural engineering, vol. 34, no. 3, pp. 179-97.
Conrad, R 1996, 'Soil microorganisms as controllers of atmospheric trace gases (H2, CO, CH4, OCS, N2O, and NO)', Microbiological reviews, vol. 60, no. 4, pp. 609-40.
Cruikshank, CL & Gilles, D 2007, 'Temperature modeling and control for biological wastewater treatment design', Proceedings of the Water Environment Federation, vol. 2007, no. 7, pp. 120-32.
Della Rocca, C, Belgiorno, V & Meriç, S 2007, 'Heterotrophic/autotrophic denitrification (HAD) of drinking water: prospective use for permeable reactive barrier', Desalination, vol. 210, no. 1, pp. 194-204.
Devlin, J, Eedy, R & Butler, B 2000, 'The effects of electron donor and granular iron on nitrate transformation rates in sediments from a municipal water supply aquifer', Journal of Contaminant Hydrology, vol. 46, no. 1, pp. 81-97.
Doucette, LJ 1997, Mathematics for the Clinical Laboratory, W.B. Saunders Company.
El Midaoui, A, Elhannouni, F, Taky, M, Chay, L, Sahli, MAM, Echihabi, L & Hafsi, M 2002, 'Optimization of nitrate removal operation from ground water by electrodialysis', Separation and Purification Technology, vol. 29, no. 3, pp. 235-44.
Fdz-Polanco, F, Mendez, E, Uruena, M, Villaverde, S & Garcıa, P 2000, 'Spatial distribution of heterotrophs and nitrifiers in a submerged biofilter for nitrification', Water Research, vol. 34, no. 16, pp. 4081-9.
Fernández-Nava, Y, Marañón, E, Soons, J & Castrillón, L 2010, 'Denitrification of high nitrate concentration wastewater using alternative carbon sources', Journal of hazardous materials, vol. 173, no. 1, pp. 682-8.
Furukawa, K, Ike, A, Ryu, S-L & Fujita, M 1993, 'Nitrification of NH 4- N polluted sea water by immobilized acclimated marine nitrifying sludge (AMNS)', Journal of Fermentation and Bioengineering, vol. 76, no. 6, pp. 515-20.

91
Furukawa, K, Lieu, P, Tokitoh, H & Fujii, T 2006, 'Development of single-stage nitrogen removal using anammox and partial nitritation (SNAP) and its treatment performances', Water Science and Technology, vol. 53, no. 6, pp. 83-90.
Gerardi, MH 2003, Nitrification and denitrification in the activated sludge process, John Wiley & Sons.
Ghafari, S, Hasan, M & Aroua, MK 2008, 'Bio-electrochemical removal of nitrate from water and wastewater—a review', Bioresource Technology, vol. 99, no. 10, pp. 3965-74.
Gönenç, IE & Harremöes, P 1985, 'Nitrification in rotating disc systems—I: Criteria for transition from oxygen to ammonia rate limitation', Water Research, vol. 19, no. 9, pp. 1119-27.
Guisasola, A, Petzet, S, Baeza, JA, Carrera, J & Lafuente, J 2007, 'Inorganic carbon limitations on nitrification: Experimental assessment and modelling', Water Research, vol. 41, no. 2, pp. 277-86.
Gupta, A & Gupta, S 2001, 'Simultaneous carbon and nitrogen removal from high strength domestic wastewater in an aerobic RBC biofilm', Water Research, vol. 35, no. 7, pp. 1714-22.
Hashemi, SE, Heidarpour, M, Mostafazadeh-Fard, B, Madani, A, Mousavi, S-F, Gheysari, M & Shirvani, M 2010, 'Nitrate removal of drainage water with barley straw as a bioreactor filter', in 9th International Drainage Symposium held jointly with CIGR and CSBE/SCGAB Proceedings, 13-16 June 2010, Québec City Convention Centre, Quebec City, Canada, p. 1.
Henry, JG & Heineke, GW 1996, 'Environmental science and engineering', Environment International, vol. 6, no. 22, p. 764.
Henze, M 2008, Biological wastewater treatment: principles, modelling and design, IWA publishing.
Hippen, A, Rosenwinkel, K-H, Baumgarten, G & Seyfried, CF 1997, 'Aerobic deammonification: a new experience in the treatment of waste waters', Water Science and Technology, vol. 35, no. 10, pp. 111-20.
Hocaoglu, SM, Insel, G, Cokgor, EU & Orhon, D 2011, 'Effect of low dissolved oxygen on simultaneous nitrification and denitrification in a membrane bioreactor treating black water', Bioresource Technology, vol. 102, no. 6, pp. 4333-40.

92
Holmes, J, Plant, OWWR & Water, CH 2010, 'Barley Straw: A Natural Algae Inhibitor', in 4th Annual WIOA NSW Water Industry Engineers & Operators Conference, pp. 33-9.
Huang, G, Huang, Y, Hu, H, Liu, F, Zhang, Y & Deng, R 2015, 'Remediation of nitrate–nitrogen contaminated groundwater using a pilot-scale two-layer heterotrophic–autotrophic denitrification permeable reactive barrier with spongy iron/pine bark', Chemosphere, vol. 130, pp. 8-16.
Jenicek, P, Svehla, P, Zabranska, J & Dohanyos, M 2004, 'Factors affecting nitrogen removal by nitritation/denitritation', Water Science and Technology, vol. 49, no. 5-6, pp. 73-9.
Jie, H, Daping, L, Qiang, L, Yong, T, Xiaohong, H, Xiaomei, W, Xudong, L & Ping, G 2009, 'Effect of organic carbon on nitriffication efficiency and community composition of nitrifying bioffilms', Journal of Environmental Sciences, vol. 21, no. 3, pp. 387-94.
Jubany, I, Carrera, J, Lafuente, J & Baeza, JA 2008, 'Start- up of a nitrification system with automatic control to treat highly concentrated ammonium wastewater: Experimental results and modeling', Chemical Engineering Journal, vol. 144, no. 3, pp. 407-19.
Kaplan, DL, Riley, PA, Pierce, J & Kaplan, AM 1987, 'Denitrification of high nitrate loads—Efficiencies of alternative carbon sources', International biodeterioration, vol. 23, no. 4, pp. 233-48.
Karanasios, K, Vasiliadou, I, Pavlou, S & Vayenas, D 2010, 'Hydrogenotrophic denitrification of potable water: a review', Journal of hazardous materials, vol. 180, no. 1, pp. 20-37.
Kim, D, Ryu, D, Go, M, Chang, D, Han, S, Hur, J, Chung, B, Kim, B & Jin, YH 2010, 'Nitrogen removal in a high-efficiency denitrification/oxic filter treatment system for advanced treatment of municipal wastewater', World Academy of Science, Engineering and Technology, vol. 48, pp. 13-5.
Kim, Y-S, Nakano, K, Lee, T-J, Kanchanatawee, S & Matsumura, M 2002, 'On-site nitrate removal of groundwater by an immobilized psychrophilic denitrifier using soluble starch as a carbon source', Journal of bioscience and bioengineering, vol. 93, no. 3, pp. 303-8.
Kimura, Y, Isaka, K & Kazama, F 2011, 'Effects of inorganic carbon limitation on anaerobic ammonium oxidation ( anammox) activity', Bioresource Technology, vol. 102, no. 6, pp. 4390-4.
93
Knobeloch, L, Salna, B, Hogan, A, Postle, J & Anderson, H 2000, 'Blue babies and nitrate-contaminated well water', Environmental health perspectives, vol. 108, no. 7, p. 675.
Knowles, R 1982, 'Denitrification', Microbiological reviews, vol. 46, no. 1, p. 43.
Kuai, L & Verstraete, W 1998, 'Ammonium removal by the oxygen-limited autotrophic nitrification-denitrification system', Applied and environmental microbiology, vol. 64, no. 11, pp. 4500-6.
Kumazawa, K 2002, 'Nitrogen fertilization and nitrate pollution in groundwater in Japan: Present status and measures for sustainable agriculture', Nutrient Cycling in Agroecosystems, vol. 63, no. 2-3, pp. 129-37.
Lájer, K 2012, 'Ammonium removal by nitrification in drinking water treatment', J. AM. water works Assoc, vol. 10, pp. 47-53.
Leon, AC, Davis, LL & Kraemer, HC 2011, 'The role and interpretation of pilot studies in clinical research', Journal of psychiatric research, vol. 45, no. 5, pp. 626-9.
Lerner, K & Goode, PW 2000, Building Officials Guide to Straw Bale Construction, California straw building Association.
Lewandowski & Boltz, ZJ 2011, Biofilms in Water and Wastewater Treatment.
Liljedahl, V 2014, 'Nitrogen removal in process water from the Gerum tunnel', Master of Science thesis, Chalmers University of Technology.
Ling, J & Chen, S 2005, 'Impact of organic carbon on nitrification performance of different biofilters', Aquacultural engineering, vol. 33, no. 2, pp. 150-62.
Liptak, BG & Liu, D 1997, Environmental engineers' handbook, 2nd ed. edn, Boca Raton, Fla. : Lewis Publishers, Boca Raton, Fla.
Liu, F, Huang, G, Fallowfield, H, Guan, H, Zhu, L & Hu, H 2013, Study on Heterotrophic-Autotrophic Denitrification Permeable Reactive Barriers (HAD PRBs) for In Situ Groundwater Remediation, Springer Science & Business Media.
Luk, G & Au-Yeung, W 2002, 'Experimental investigation on the chemical reduction of nitrate from groundwater', Advances in environmental research, vol. 6, no. 4, pp. 441-53.

94
Mai, L, van den Akker, B, Du, J, Kookana, RS & Fallowfield, H 2016, 'Impact of exogenous organic carbon on the removal of chemicals of concern in the high rate nitrifying trickling filters', Journal of Environmental Management, vol. 174, pp. 7-13.
Matějů, V, Čižinská, S, Krejčí, J & Janoch, T 1992, 'Biological water denitrification—a review', Enzyme and Microbial Technology, vol. 14, no. 3, pp. 170-83.
Mohseni-Bandpi, A, Elliott, D & Zazouli, MA 2013, Biological nitrate removal processes from drinking water supply-a review, 2052-336X.
Moreno, B, Gómez, M, González-López, J & Hontoria, E 2005, 'Inoculation of a submerged filter for biological denitrification of nitrate polluted groundwater: a comparative study', Journal of hazardous materials, vol. 117, no. 2, pp. 141-7.
Noda, N, Kaneko, N, Mikami, M, Kimochi, Y, Tsuneda, S, Hirata, A, Mizuochi, M & Inamori, Y 2004, 'Effects of SRT and DO on N2O reductase activity in an anoxic-oxic activated sludge system', Water Science and Technology, vol. 48, no. 11-12, pp. 363-70.
Nyerges, G & Stein, LY 2009, 'Ammonia cometabolism and product inhibition vary considerably among species of methanotrophic bacteria', FEMS microbiology letters, vol. 297, no. 1, pp. 131-6.
Okabe, S, Oozawa, Y, Hirata, K & Watanabe, Y 1996, 'Relationship between population dynamics of nitrifiers in biofilms and reactor performance at various C: N ratios', Water Research, vol. 30, no. 7, pp. 1563-72.
Okey, RW & Albertson, OE 1989, 'Diffusion's role in regulating rate and masking temperature effects in fixed-film nitrification', Journal (Water Pollution Control Federation), pp. 500-9.
Pan, S-H 2007, Autotrophic denitrification of groundwater in a granular sulfur-packed up-flow reactor, ProQuest.
Park, HI, Choi, Y-J & Pak, D 2005, 'Autohydrogenotrophic denitrifying microbial community in a glass beads biofilm reactor', Biotechnology letters, vol. 27, no. 13, pp. 949-53.
Park, HI, kun Kim, D, Choi, Y-J & Pak, D 2005, 'Nitrate reduction using an electrode as direct electron donor in a biofilm-electrode reactor', Process Biochemistry, vol. 40, no. 10, pp. 3383-8.
Parker, DS & Richards, T 1986, 'Nitrification in trickling filters', Journal (Water Pollution Control Federation), pp. 896-902.

95
Pearce, P & Williams, S 1999, 'A Nitrification Model for Mineral‐Media Trickling Filters', Water and Environment Journal, vol. 13, no. 2, pp. 84-92.
Poquillon, P & Petit, J 1989, 'Practical basis of nitrification in aquaculture waste-water', Aquaculture — A biotechnology in progress, pp. 1115-23.
Prosser, J 1989, 'Autotrophic nitrification in bacteria', Adv. Microbiol. Physiol, vol. 30, pp. 125-81.
Rittmann, BE, Huck, PM & Bouwer, EJ 1989, 'Biological treatment of public water supplies', Critical Reviews in Environmental Science and Technology, vol. 19, no. 2, pp. 119-84.
Robertson, W, Vogan, J & Lombardo, P 2008, 'Nitrate Removal Rates in a 15‐Year‐Old Permeable Reactive Barrier Treating Septic System Nitrate', Groundwater Monitoring & Remediation, vol. 28, no. 3, pp. 65-72.
Rusten, B, Hem, LJ & Ødegaard, H 1995, 'Nitrogen removal from dilute wastewater in cold climate using moving-bed biofilm reactors', Water Environment Research, vol. 67, no. 1, pp. 65-74.
Saliling, WJB, Westerman, PW & Losordo, TM 2007, 'Wood chips and wheat straw as alternative biofilter media for denitrification reactors treating aquaculture and other wastewaters with high nitrate concentrations', Aquacultural engineering, vol. 37, no. 3, pp. 222-33.
Salvestrin, H & Hagare, P 2009, 'Removal of nitrates from groundwater in remote indigenous settings in arid Central Australia', Desalination and Water Treatment, vol. 11, no. 1-3, pp. 151-6.
Schmidt, CA & Clark, MW 2012, 'Efficacy of a denitrification wall to treat continuously high nitrate loads', Ecological Engineering, vol. 42, pp. 203-11.
Sharma, B & Ahlert, RC 1977, 'Nitrification and nitrogen removal', Water Research, vol. 11, no. 10, pp. 897-925.
Shrimali, M & Singh, K 2001, 'New methods of nitrate removal from water', Environmental pollution, vol. 112, no. 3, pp. 351-9.
Sliekers, AO, Third, K, Abma, W, Kuenen, J & Jetten, M 2003, 'CANON and Anammox in a gas-lift reactor', FEMS microbiology letters, vol. 218, no. 2, pp. 339-44.
Soares, M 2000, 'Biological denitrification of groundwater', in Environmental Challenges, Springer, pp. 183-93.

96
Soares, MIM & Abeliovich, A 1998, 'Wheat straw as substrate for water denitrification', Water Research, vol. 32, no. 12, pp. 3790-4.
Strauss, EA & Lamberti, GA 2002, 'Effect of dissolved organic carbon quality on microbial decomposition and nitrification rates in stream sediments', Freshwater Biology, vol. 47, no. 1, pp. 65-74.
Sudarno, U, Bathe, S, Winter, J & Gallert, C 2010, 'Nitrification in fixed-bed reactors treating saline wastewater', Applied microbiology and biotechnology, vol. 85, no. 6, pp. 2017-30.
Symons, JM & Carswell, J 1977, 'Ozone, chlorine dioxide, and chloramines as alternatives to chlorine for disinfection of drinking water: state-of-the-art', in Ozone, chlorine dioxide, and chloramines as alternatives to chlorine for disinfection of drinking water: state-of-the-art, EPA.
Tchobanoglous, G, Burton, FL, Stensel, HD, Metcalf, amp & Eddy 2003, Wastewater engineering : treatment and reuse, 4th ed. edn, Boston : McGraw-Hill, Boston.
Thomas, KL, Lloyd, D & Boddy, L 1994, 'Effects of oxygen, pH and nitrate concentration on denitrification by Pseudomonas species', FEMS microbiology letters, vol. 118, no. 1-2, pp. 181-6.
Timmons, MB & Summerfelt, ST 1998, 'Application of fluidized sand bed biofilters to aquaculture. In: Libey, G.S., Timmons, M.B. (Eds.), Recent Advances in Aquaculture Engineering; Proceedings of the Second International Conference on Recirculating Aquaculture', VA, pp. 342-54.
Tucker, CS & Hargreaves, JA 2004, Biology and culture of channel catfish, vol. 34, Elsevier.
Umezawa, Y, Hosono, T, Onodera, S-i, Siringan, F, Buapeng, S, Delinom, R, Yoshimizu, C, Tayasu, I, Nagata, T & Taniguchi, M 2008, 'Sources of nitrate and ammonium contamination in groundwater under developing Asian megacities', Science of The Total Environment, vol. 404, no. 2–3, pp. 361-76.
Vallés-Morales, M, Mendoza-Roca, J, Bes-Pií, A & Iborra-Clar, A 2004, 'Nitrogen removal from sludge water with SBR process: start-up of a full-scale plant in the municipal wastewater treatment plant at Ingolstadt, Germany', Water Science and Technology, vol. 50, no. 10, pp. 51-8.
Van Benthum, W, Van Loosdrecht, M & Heijnen, J 1997, 'Control of heterotrophic layer formation on nitrifying biofilms in a biofilm airlift

97
suspension reactor', Biotechnology and bioengineering, vol. 53, no. 4, pp. 397-405.
van den Akker, B 2008, Removal of ammonia from drinking water by biological nitrification in a fixed film reactor, Flinders University, School of Medicine.
van den Akker, B, Holmes, M, Cromar, N & Fallowfield, H 2008, 'Application of high rate nitrifying trickling filters for potable water treatment', Water Research, vol. 42, no. 17, pp. 4514-24.
—— 2010, 'The impact of organic carbon on the performance of a high rate nitrifying trickling filter designed to pre-treat potable water', Water Science & Technology, vol. 61, no. 7.
Van Rijn, J, Tal, Y & Schreier, HJ 2006, 'Denitrification in recirculating systems: theory and applications', Aquacultural engineering, vol. 34, no. 3, pp. 364-76.
Vayenas, DV & Lyberatos, G 1994, 'A novel model for nitrifying trickling filters', Water Research, vol. 28, no. 6, pp. 1275-84.
Verstraete, W & Alexander, M 1973, 'Heterotrophic nitrification in samples of natural ecosystems', Environmental science & technology, vol. 7, no. 1, pp. 39-42.
Verstraete, W, Vanstaen, H & Voets, J 1977, 'Adaptation to nitrification of activated sludge systems treating highly nitrogenous waters', Journal (Water Pollution Control Federation), pp. 1604-8.
Villaverde, S, Garcia-Encina, P & Fdz-Polanco, F 1997, 'Influence of pH over nitrifying biofilm activity in submerged biofilters', Water Research, vol. 31, no. 5, pp. 1180-6.
Volokita, M, Abeliovich, A & Soares, MIM 1996, 'Denitrification of groundwater using cotton as energy source', Water Science and Technology, vol. 34, no. 1-2, pp. 379-85.
Wall, D 2013, Nitrogen in Waters: Forms and Concerns, Minnesota Pollution Control Agency, US.
Wang, LK, Shammas, NK & Hung, Y-T 2010, Advanced biological treatment processes, vol. 9, Springer Science & Business Media.
Wang, R, Feng, Q, Liao, T, Zheng, X, Butterbach-Bahl, K, Zhang, W & Jin, C 2013, 'Effects of nitrate concentration on the denitrification potential of a

98
calcic cambisol and its fractions of N2, N2O and NO', Plant and soil, vol. 363, no. 1-2, pp. 175-89.
Ward, BB & Jensen, MM 2014, 'The Microbial Nitrogen Cycle', Frontiers in Microbiology, vol. 5.
Ward, MH, DeKok, TM, Levallois, P, Brender, J, Gulis, G, Nolan, BT & VanDerslice, J 2005, 'Workgroup report: Drinking-water nitrate and health-recent findings and research needs', Environmental health perspectives, pp. 1607-14.
Watson, S, Valois, F & Waterbury, J 1981, The family Nitrobacteraceae. In the Prokaryotes: A Handbooks on Habits, Isolation, and Identification of Bacteria vol. Vol. I Eds, Springer-Verlag, New York.
Wett, B & Rauch, W 2003, 'The role of inorganic carbon limitation in biological nitrogen removal of extremely ammonia concentrated wastewater', Water Research, vol. 37, no. 5, pp. 1100-10.
WHO 2008, Guidelines for Drinking-water Quality, 3rd edn, vol. 1, Geneva.
Wiesmann, U 1994, 'Biological nitrogen removal from wastewater', Biotechnics/wastewater, pp. 113-54.
Windey, K, De Bo, I & Verstraete, W 2005, 'Oxygen-limited autotrophic nitrification–denitrification (OLAND) in a rotating biological contactor treating high-salinity wastewater', Water Research, vol. 39, no. 18, pp. 4512-20.
Wu, G, Zheng, D & Xing, L 2014, 'Nitritation and N2O Emission in a Denitrification and Nitrification Two-Sludge System Treating High Ammonium Containing Wastewater', Water, vol. 6, no. 10, pp. 2978-92.
Wyffels, S, Pynaert, K, Boeckx, P, Verstraete, W & Van Cleemput, O 2003, 'Identification and quantification of nitrogen removal in a rotating biological contactor by 15 N tracer techniques', Water Research, vol. 37, no. 6, pp. 1252-9.
Yang, GC & Lee, H-L 2005, 'Chemical reduction of nitrate by nanosized iron: kinetics and pathways', Water Research, vol. 39, no. 5, pp. 884-94.
Zanetti, L, Frison, N, Nota, E, Tomizioli, M, Bolzonella, D & Fatone, F 2012, 'Progress in real-time control applied to biological nitrogen removal from wastewater. A short- review', Desalination, vol. 286, pp. 1-7.

99
Zhang, H, Hashmi, MZ, Zhang, J & Zhang, M 2014, 'Ammonia Nitrogen Removal by Single-stage Process: A Review', J. Chem. Soc. Pak, vol. 36, no. 4, p. 775.
Zhang, TC & Bishop, PL 1996, 'Evaluation of substrate and pH effects in a nitrifying biofilm', Water Environment Research, vol. 68, no. 7, pp. 1107-15.
Zhang, TC & Lampe, DG 1999, 'Sulfur: limestone autotrophic denitrification processes for treatment of nitrate-contaminated water: batch experiments', Water Research, vol. 33, no. 3, pp. 599-608.
Zhou, J 2010, Inhibitory Effect of Decomposing Barley Straw on Algal Growth in Water and Wastewater, Champaign, IL: Illinois Sustainable Technology Center.