Embed Size (px)
Citation preview
Connection Assets
• The definition of connection assets needs to match the following documents– OATS– TWRG– Connection Charging Policy– TRANSCO/PSALM Application– Draft Determination
• The ERC has a significant concern that the provisions under these documents shall be consistent
• As defined in the following slides

Connection Assets: TWRG• Regulated Transmission Services…
– (d) until the commencement of the Second Regulatory Period, Transmission Connection Services;
• Transmission Connection Services– (a) the provision of capability at a Connection Point to deliver electricity to or
take electricity from the Connection Point;– (b) the conveyance of electricity:
• (i) from the User System or Equipment of a Customer to the Connection Point; or
• (ii) from the Connection Point to the User System or Equipment of a Customer;
• Transmission Connection Assets– The components of the Grid used to provide Transmission Connection Services
• Connection Point– The point of connection of a User System or Equipment to the Grid.
• User System– User System as defined in the Grid Code. (from TWRG)– Refers to a System owned and operated by a User of the Grid or Distribution
System (from Grid Code)
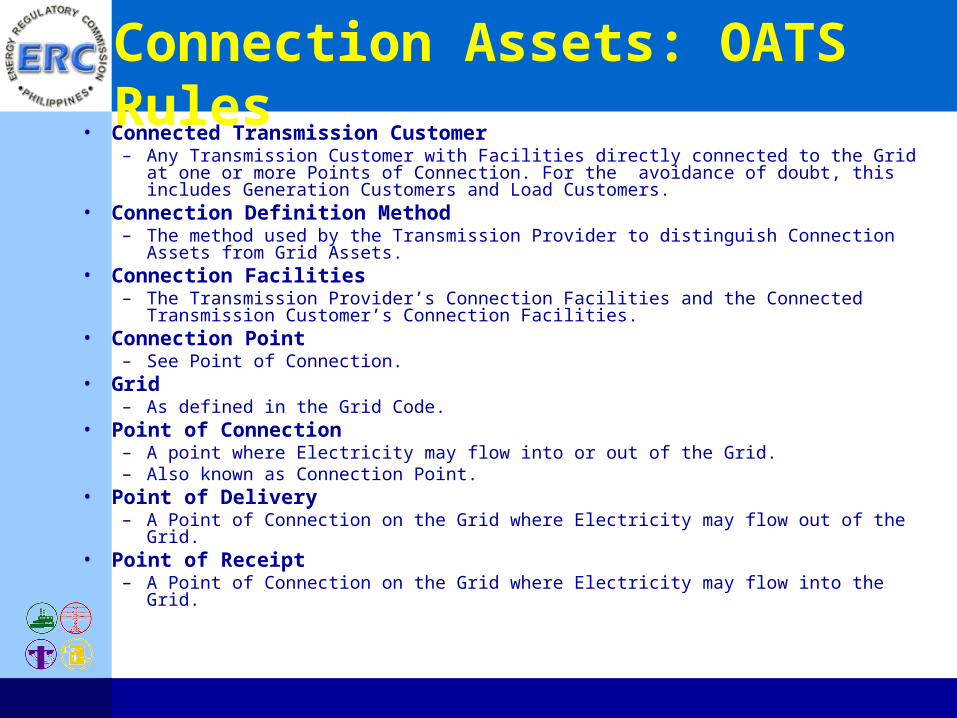
Connection Assets: OATS Rules• Connected Transmission Customer
– Any Transmission Customer with Facilities directly connected to the Grid at one or more Points of Connection. For the avoidance of doubt, this includes Generation Customers and Load Customers.
• Connection Definition Method– The method used by the Transmission Provider to distinguish Connection Assets from
Grid Assets.• Connection Facilities
– The Transmission Provider’s Connection Facilities and the Connected Transmission Customer’s Connection Facilities.
• Connection Point– See Point of Connection.
• Grid– As defined in the Grid Code.
• Point of Connection– A point where Electricity may flow into or out of the Grid.– Also known as Connection Point.
• Point of Delivery – A Point of Connection on the Grid where Electricity may flow out of the Grid.
• Point of Receipt– A Point of Connection on the Grid where Electricity may flow into the Grid.

Connection Assets:Connection Charging Policy (Aug 2005)
• Connection Assets are those assets that are put in place for the primary purpose of connecting a customer. These assets may be bypassed or removed from the network without affecting any customer except those that are directly connected to it. Even though transmission power flows on portions of these assets, that is just the consequence of connecting the customer to the Grid.
• TransCo will also consider the inclusion of those assets defined as Subtransmission Assets by the ERC in its Order of 17 October 2003. To the extent possible, TransCo shall treat all Subtransmission Assets covered by the ERC Order as Connection Assets until such time that the assets are sold.
Connection Assets:TRANSCO/PSALM Application
• TRANSCO/PSALM – claims that it is consistent with its proposed Connection Charging Policy dated August 2005
• TRANSCO/PSALM claim that these assets either directly benefit a particular user or “a specified group of users”
• SKM et al – appears to have implemented “shallow connection” and “unshared” assets following its classification in the RAB

Connection Assets – Draft Determination
• To use SKM definition as implicitly provided in its spreadsheet on substation assets.

RAB Outcome
• Table 5.8
• Table 5.9
ERC Draft DeterminationRolled Forward Asset Base
2004 2005 2006 2007 2008 2009 2010 RABo Real Peso Millions 110,277 104,934 102,381 100,918 99,412 96,970RegDepnt Real Peso Millions (4,595) (4,530) (4,391) (4,279) (4,155) (4,065)Capext Real Peso Millions 778 2,999 3,715 3,602 2,367 1,105Capex RegDepnt Real Peso Millions 0 (24) (94) (187) (280) (347)Disposalst Real Peso Millions (1,526) (998) (693) (642) (374) (574)RABc Real Peso Millions 110,277 104,934 102,381 100,918 99,412 96,970 93,091
2004 2005 2006 2007 2008 2009 2010 Inflation Index
Index from Inflation assumption 1.00 1.05 1.10 1.15 1.20 1.26 1.31
Return of Capital (Depreciation) - Real Peso Millions 4,595.2 4,554.0 4,485.0 4,465.7 4,434.5 4,411.7Return of Capital (Depreciation) - Nominal Peso Millions 4,811.2 4,996.9 5,157.4 5,371.4 5,568.6 5,772.7

Weighted Average Cost of Capital
David Dawson
ERC Regulatory Expert
WACC (a)
• Follow TWRG
• Recognize differences between TRANSCO Independent Expert and TWRG
• Review values for parameters separately
• Summary follows mid-point analysis
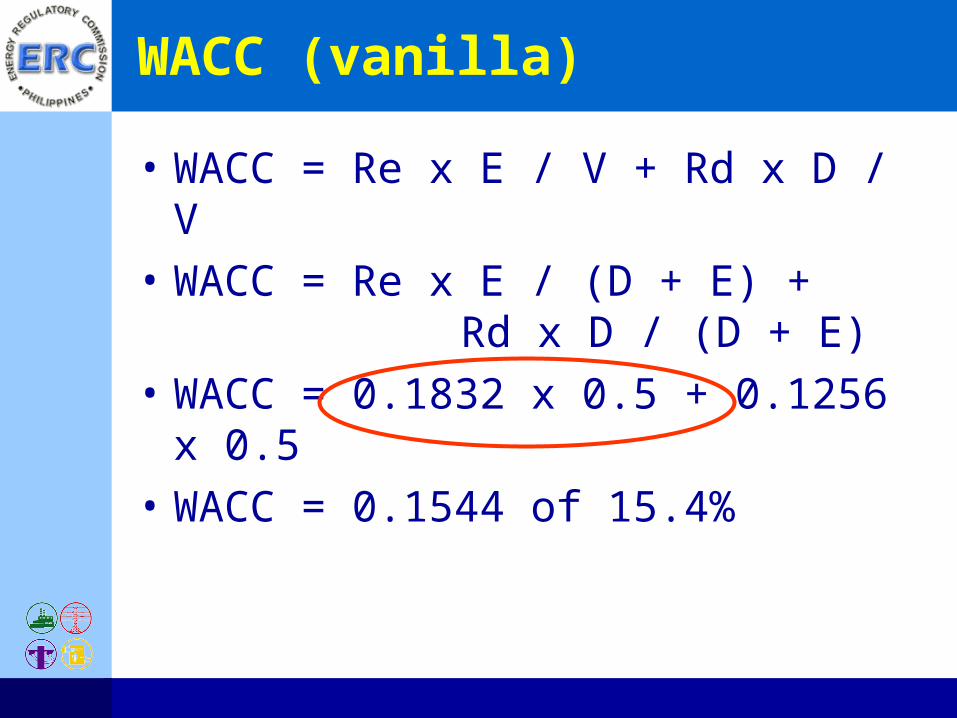
WACC (vanilla)
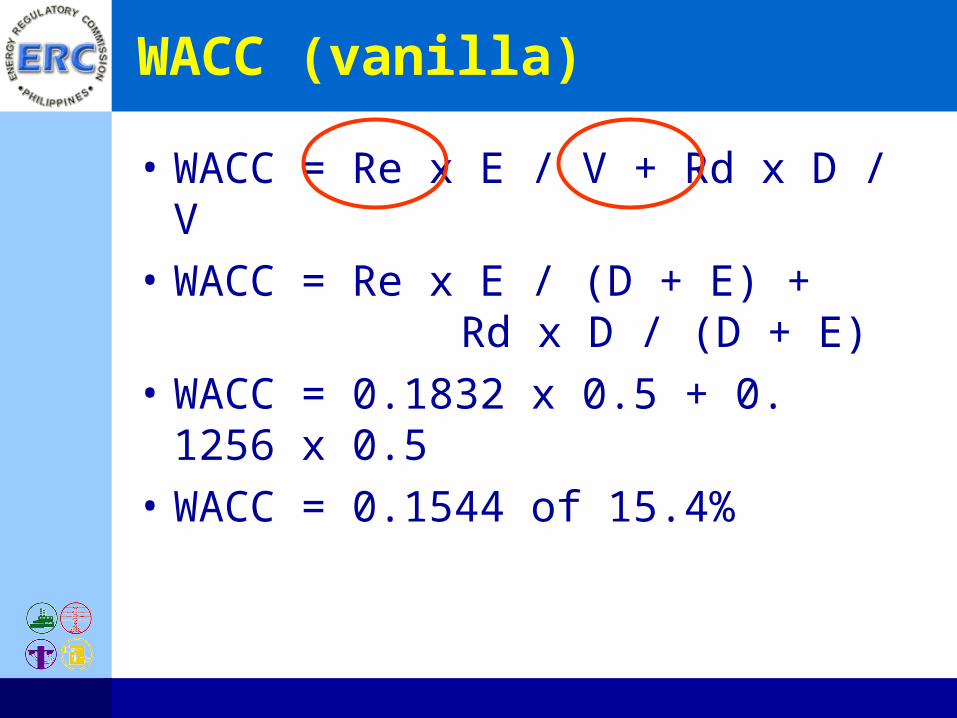
• WACC = Re x E / V + Rd x D / V
• WACC = Re x E / (D + E) + Rd x D / (D + E)
• WACC = 0.1832 x 0.5 + 0. 1256 x 0.5
• WACC = 0.1544 of 15.4%
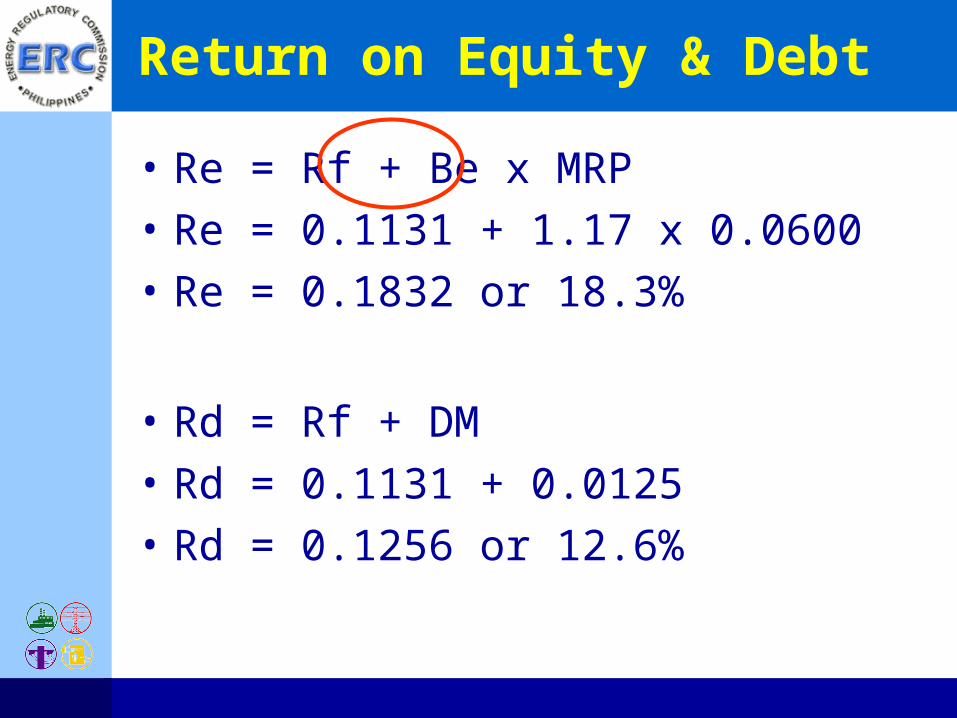
Return on Equity & Debt
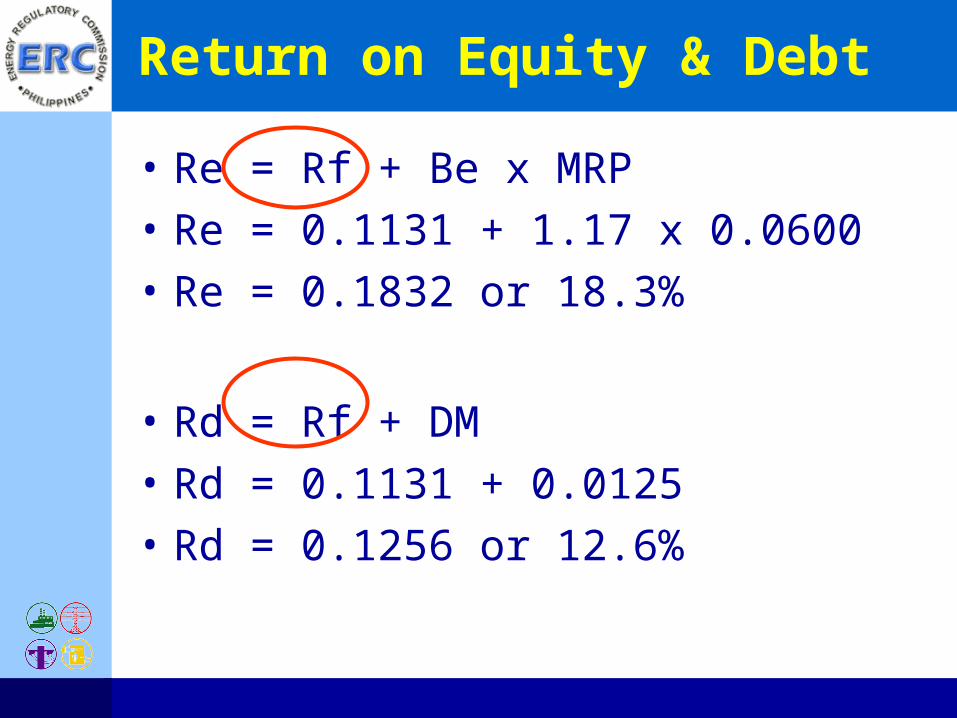
• Re = Rf + Be x MRP
• Re = 0.1131 + 1.17 x 0.0600
• Re = 0.1832 or 18.3%
• Rd = Rf + DM
• Rd = 0.1131 + 0.0125
• Rd = 0.1256 or 12.6%

Risk Free Rate (a)
• Two measures explored:– Internal measure using Philippine
Treasury Bonds– External measure using US Treasury
Bonds
• Internal:
• Use Philippines 10y Treasury Bond for August 2005
• Rf = 0.1173 or 11.7%
Risk Free Rate (b)
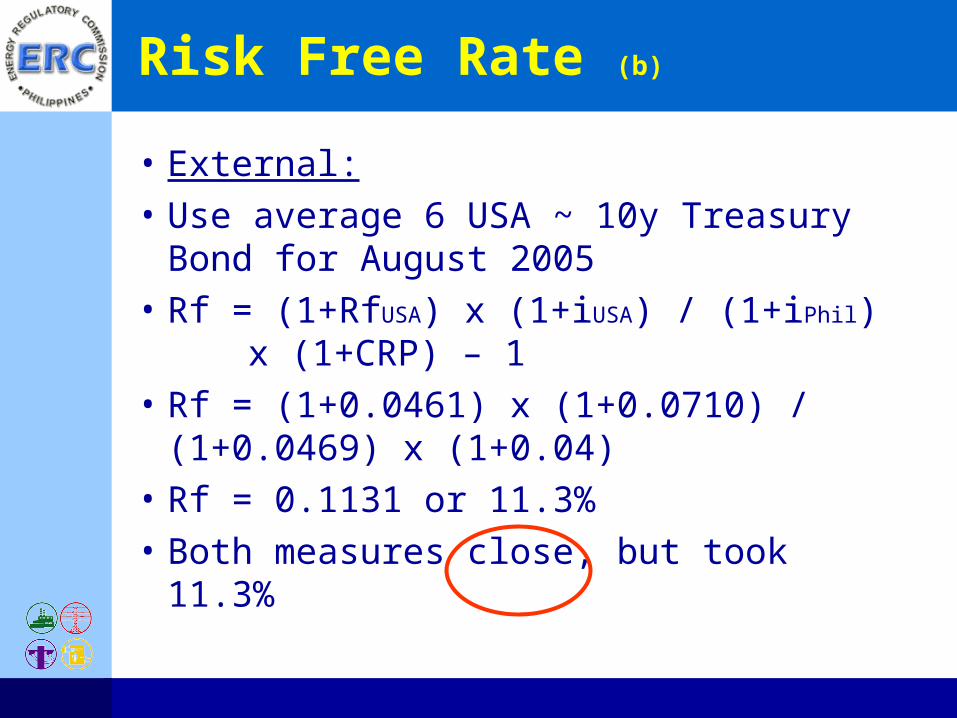
• External:
• Use average 6 USA ~ 10y Treasury Bond for August 2005
• Rf = (1+RfUSA) x (1+iUSA) / (1+iPhil) x (1+CRP) – 1
• Rf = (1+0.0461) x (1+0.0710) / (1+0.0469) x (1+0.04)
• Rf = 0.1131 or 11.3%
• Both measures close, but took 11.3%

Inflation Rates
• Spread for “long-term” average versus “spot” average is similar
• Spot data better matches bond data which is average spot as well
CPI Measure Average Spot (5 Days) Long –term Average
Philippines CPI 7.10% 4.71%
USA CPI 4.69% 2.40%
Delta (Philippines less USA)
2.41% 2.31%
Table 6.1 : Inflation Differences between the Philippines and the USA (% pa)
CRP (a)
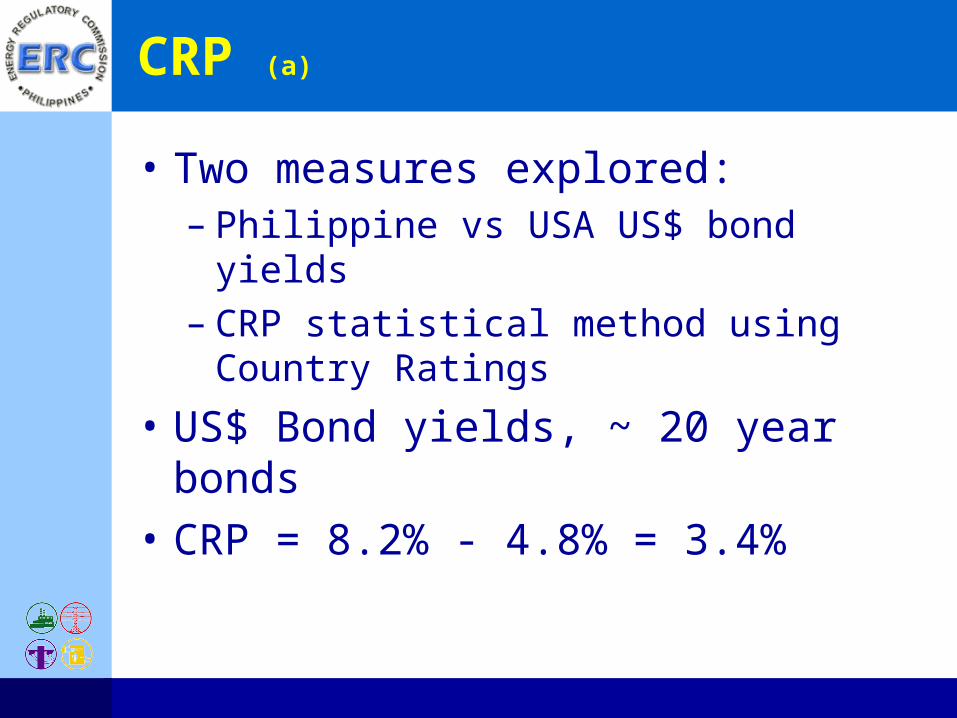
• Two measures explored:– Philippine vs USA US$ bond yields– CRP statistical method using Country
Ratings
• US$ Bond yields, ~ 20 year bonds
• CRP = 8.2% - 4.8% = 3.4%
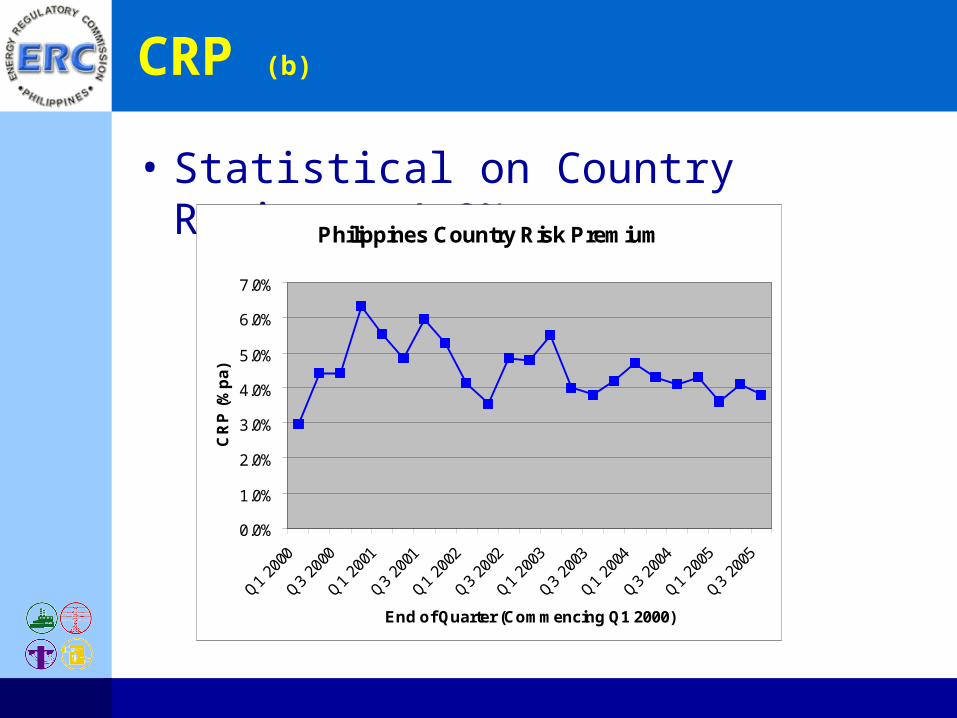
CRP (b)
• Statistical on Country Rating = 4.0%Philippines Country Risk Premium
0.0%
1.0%
2.0%
3.0%
4.0%
5.0%
6.0%
7.0%
Q1 20
00
Q3 20
00
Q1 20
01
Q3 20
01
Q1 20
02
Q3 20
02
Q1 20
03
Q3 20
03
Q1 20
04
Q3 20
04
Q1 20
05
Q3 20
05
End of Quarter (Commencing Q1 2000)
CR
P (%
pa)
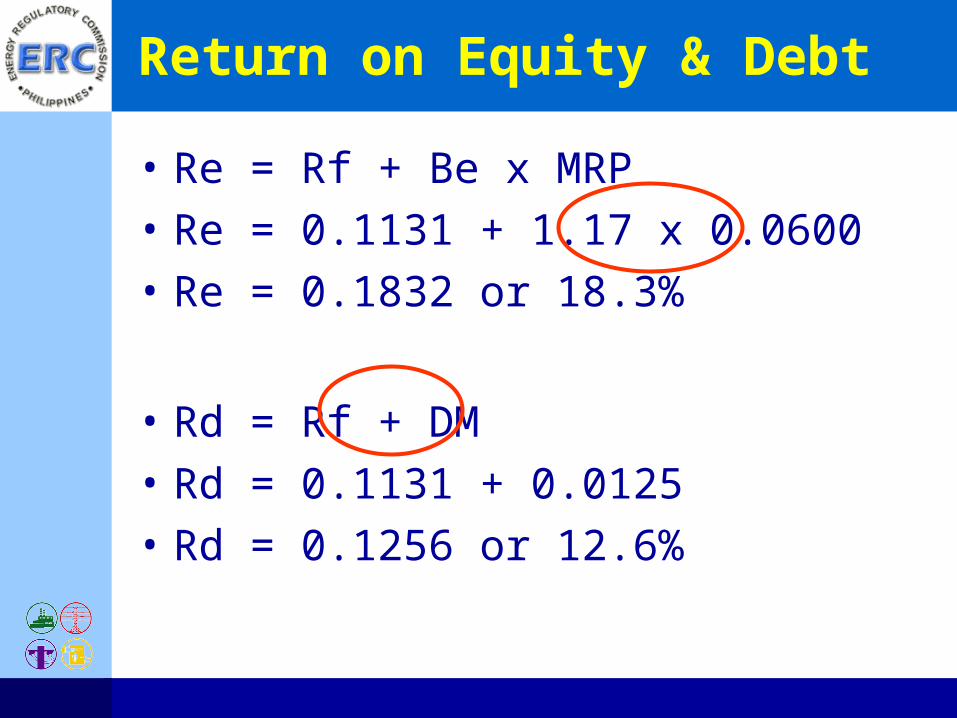
Return on Equity & Debt
• Re = Rf + Be x MRP
• Re = 0.1131 + 1.17 x 0.0600
• Re = 0.1832 or 18.3%
• Rd = Rf + DM
• Rd = 0.1131 + 0.0125
• Rd = 0.1256 or 12.6%

Beta
• Followed TWRG
• Equity Beta average of 5 transcos and 5 distribution businesses
• Ba = Be / [1+(1-Te) x D/E] for Market
• Ba = 0.58
• Be = Ba x (1+D/E) for TRANSCO
• Be = 1.17
Return on Equity & Debt
• Re = Rf + Be x MRP
• Re = 0.1131 + 1.17 x 0.0600
• Re = 0.1832 or 18.3%
• Rd = Rf + DM
• Rd = 0.1131 + 0.0125
• Rd = 0.1256 or 12.6%
WACC (vanilla)
• WACC = Re x E / V + Rd x D / V
• WACC = Re x E / (D + E) + Rd x D / (D + E)
• WACC = 0.1832 x 0.5 + 0.1256 x 0.5
• WACC = 0.1544 of 15.4%
Return on & of Capital
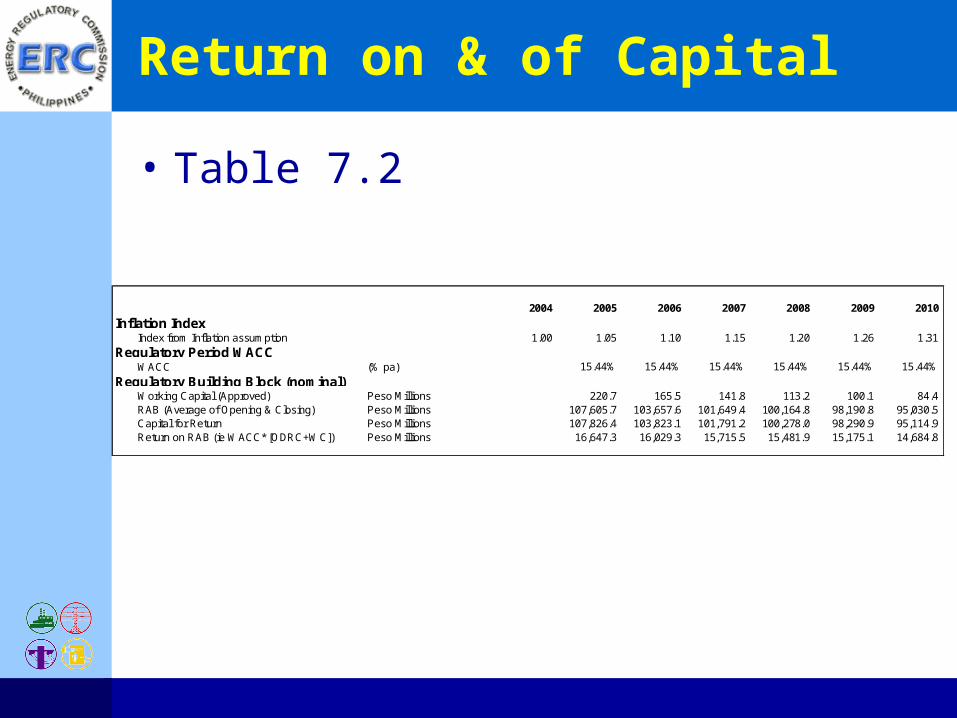
• Table 7.2
2004 2005 2006 2007 2008 2009 2010
Inflation IndexIndex from Inflation assumption 1.00 1.05 1.10 1.15 1.20 1.26 1.31
Regulatory Period WACCWACC (% pa) 15.44% 15.44% 15.44% 15.44% 15.44% 15.44%
Regulatory Building Block (nominal)Working Capital (Approved) Peso Millions 220.7 165.5 141.8 113.2 100.1 84.4RAB (Average of Opening & Closing) Peso Millions 107,605.7 103,657.6 101,649.4 100,164.8 98,190.8 95,030.5Capital for Return Peso Millions 107,826.4 103,823.1 101,791.2 100,278.0 98,290.9 95,114.9Return on RAB (ie WACC* [ODRC+WC]) Peso Millions 16,647.3 16,029.3 15,715.5 15,481.9 15,175.1 14,684.8
Lawrence Luczon Engineer II
Performance Incentive Scheme
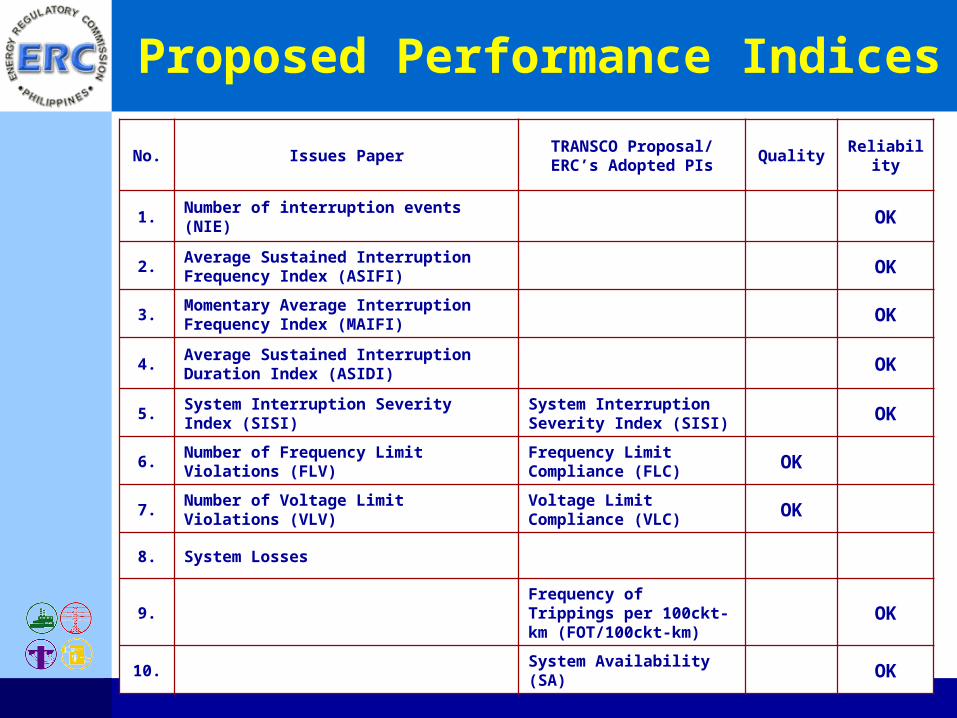
Proposed Performance Indices
No. Issues PaperTRANSCO Proposal/ERC’s Adopted PIs
Quality Reliability
1. Number of interruption events (NIE) OK
2.Average Sustained Interruption Frequency Index (ASIFI) OK
3.Momentary Average Interruption Frequency Index (MAIFI) OK
4.Average Sustained Interruption Duration Index (ASIDI) OK
5. System Interruption Severity Index (SISI)System Interruption Severity Index (SISI) OK
6.Number of Frequency Limit Violations (FLV)
Frequency Limit Compliance (FLC) OK
7. Number of Voltage Limit Violations (VLV)Voltage Limit Compliance (VLC) OK
8. System Losses
9.Frequency of Trippings per 100ckt-km (FOT/100ckt-km)
OK
10. System Availability (SA) OK

Performance Indices %
1.System Interruption Severity Index (SISI)
30
2.Frequency of Tripping per 100 ckt-km (FOT/100ckt-km)
25
3. System Availability (SA) 25
4. Frequency Limit Compliance (FLC) 10
5. Voltage Limit Compliance (VLC) 10
TransCo Proposed Weightings

ERC Proposed Weightings
PI WeightingsWeightings by Grid
Luzon Visayas Mindanao Total
SISI 45% 20% 50% 30% 100%
FOT 25% 32% 29% 39% 100%
SA 10% 34% 33% 33% 100%
FLC 10% 34% 33% 33% 100%
VLC 10% 29% 36% 35% 100%
Total 100%
Note: Weightings by Grid - based on proportional average performance from 2000-2004 with higher proportion given to a bad performing grid
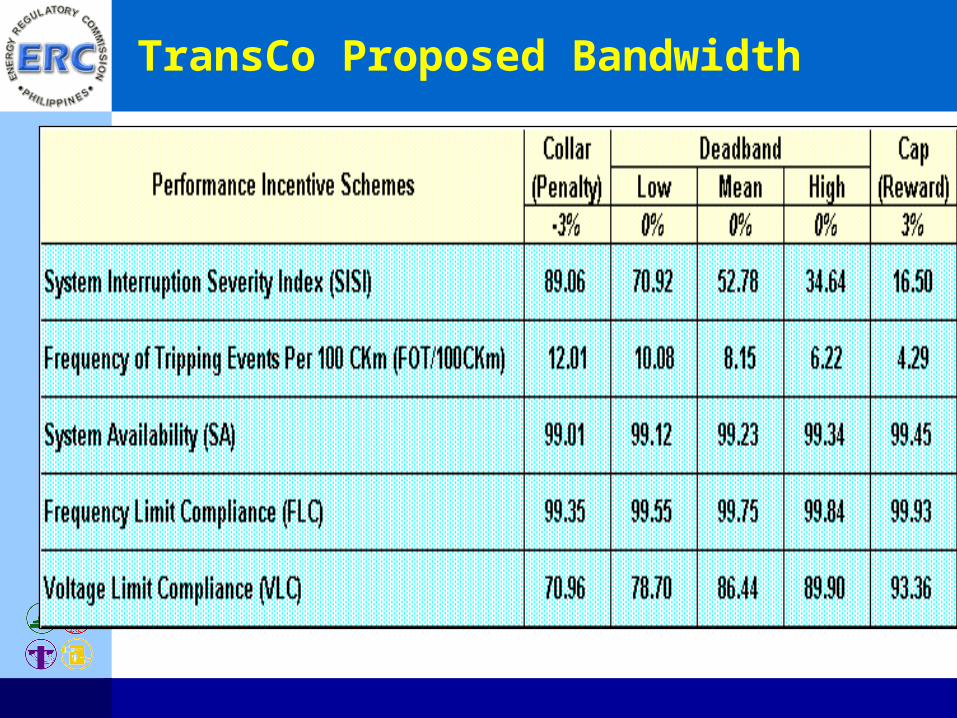
TransCo Proposed Bandwidth
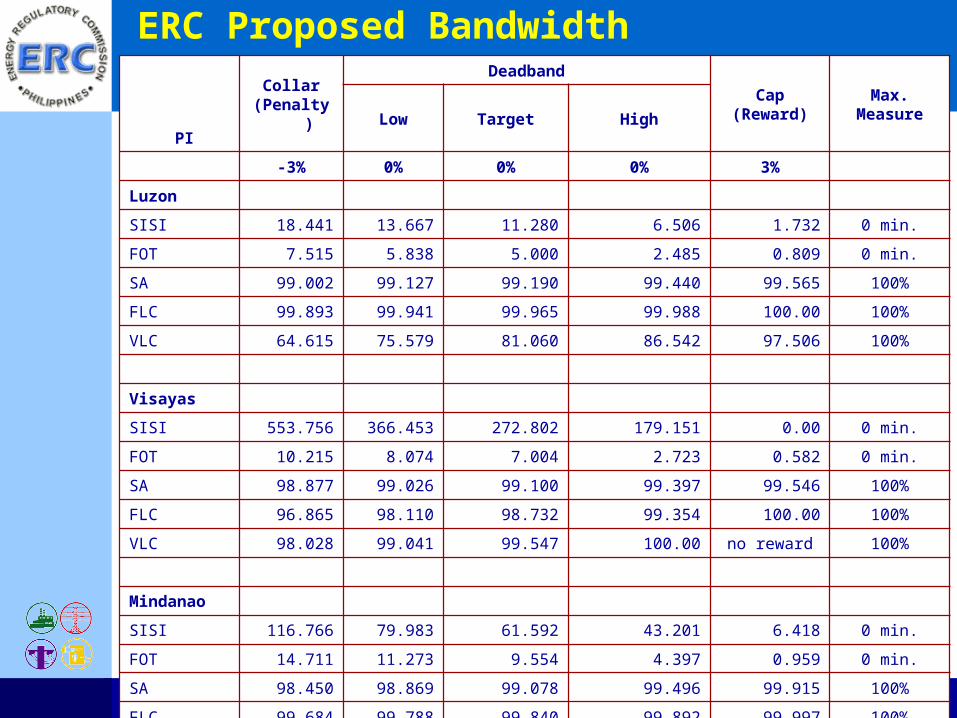
ERC Proposed Bandwidth
PI
Collar(Penalty)
DeadbandCap
(Reward)Max.
MeasureLow Target High
-3% 0% 0% 0% 3%
Luzon
SISI 18.441 13.667 11.280 6.506 1.732 0 min.
FOT 7.515 5.838 5.000 2.485 0.809 0 min.
SA 99.002 99.127 99.190 99.440 99.565 100%
FLC 99.893 99.941 99.965 99.988 100.00 100%
VLC 64.615 75.579 81.060 86.542 97.506 100%
Visayas
SISI 553.756 366.453 272.802 179.151 0.00 0 min.
FOT 10.215 8.074 7.004 2.723 0.582 0 min.
SA 98.877 99.026 99.100 99.397 99.546 100%
FLC 96.865 98.110 98.732 99.354 100.00 100%
VLC 98.028 99.041 99.547 100.00 no reward 100%
Mindanao
SISI 116.766 79.983 61.592 43.201 6.418 0 min.
FOT 14.711 11.273 9.554 4.397 0.959 0 min.
SA 98.450 98.869 99.078 99.496 99.915 100%
FLC 99.684 99.788 99.840 99.892 99.997 100%
VLC 96.936 97.926 98.421 98.915 99.905 100%
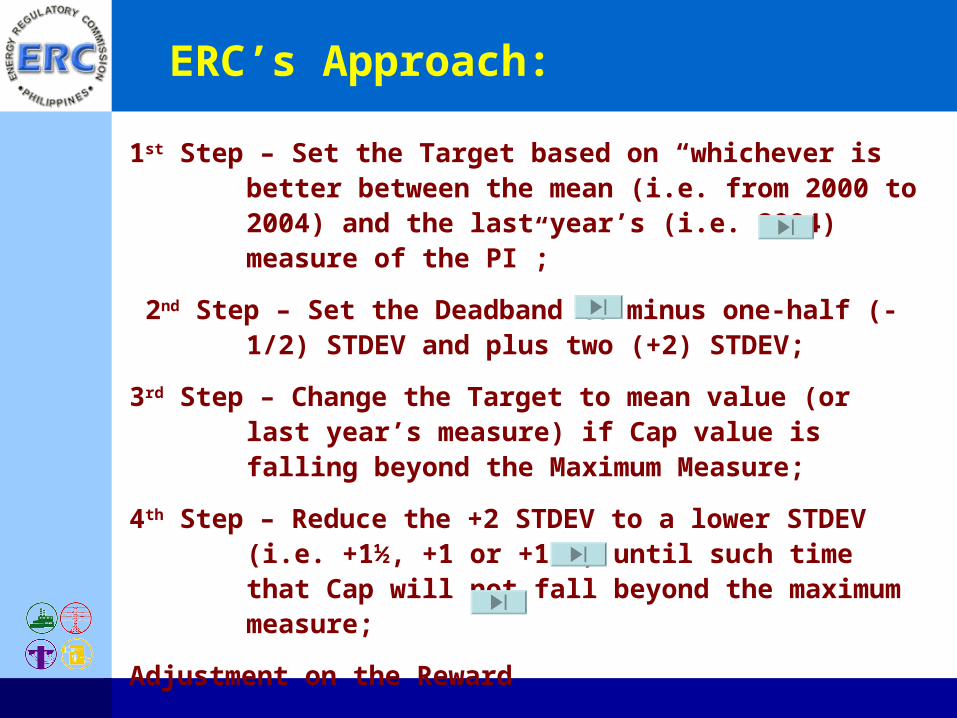
ERC’s Approach:
1st Step – Set the Target based on “whichever is better between the mean (i.e. from 2000 to 2004) and the last year’s (i.e. 2004) measure of the PI”;
2nd Step – Set the Deadband to minus one-half (-1/2) STDEV and plus two (+2) STDEV;
3rd Step – Change the Target to mean value (or last year’s measure) if Cap value is falling beyond the Maximum Measure;
4th Step – Reduce the +2 STDEV to a lower STDEV (i.e. +1½, +1 or +1/2) until such time that Cap will not fall beyond the maximum measure;
Adjustment on the Reward
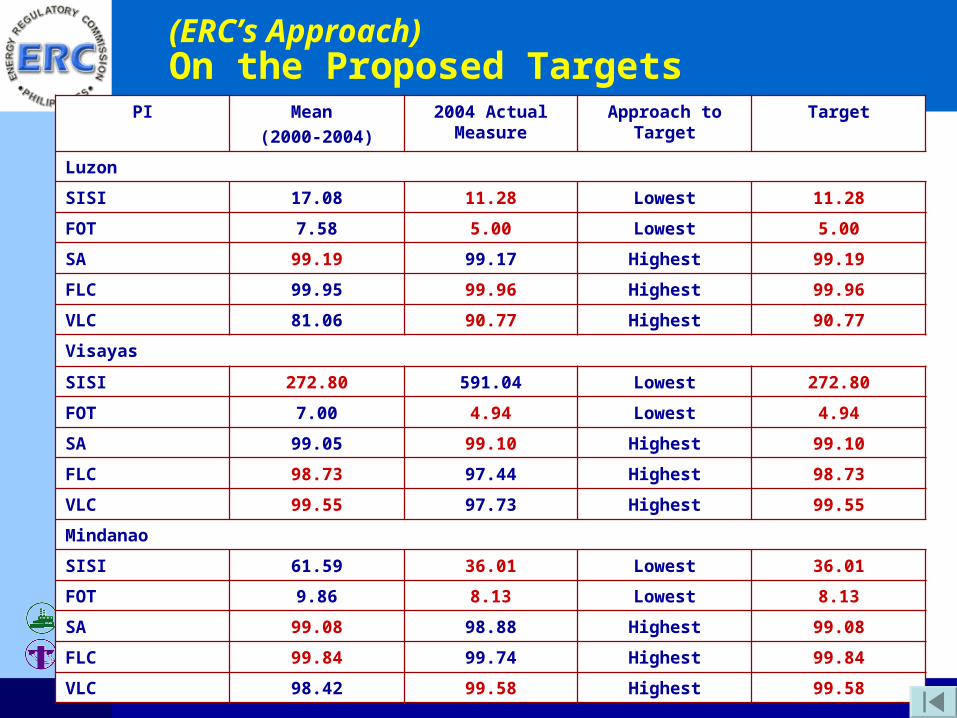
(ERC’s Approach) On the Proposed Targets
PI Mean
(2000-2004)
2004 Actual Measure
Approach to Target
Target
Luzon
SISI 17.08 11.28 Lowest 11.28
FOT 7.58 5.00 Lowest 5.00
SA 99.19 99.17 Highest 99.19
FLC 99.95 99.96 Highest 99.96
VLC 81.06 90.77 Highest 90.77
Visayas
SISI 272.80 591.04 Lowest 272.80
FOT 7.00 4.94 Lowest 4.94
SA 99.05 99.10 Highest 99.10
FLC 98.73 97.44 Highest 98.73
VLC 99.55 97.73 Highest 99.55
Mindanao
SISI 61.59 36.01 Lowest 36.01
FOT 9.86 8.13 Lowest 8.13
SA 99.08 98.88 Highest 99.08
FLC 99.84 99.74 Highest 99.84
VLC 98.42 99.58 Highest 99.58
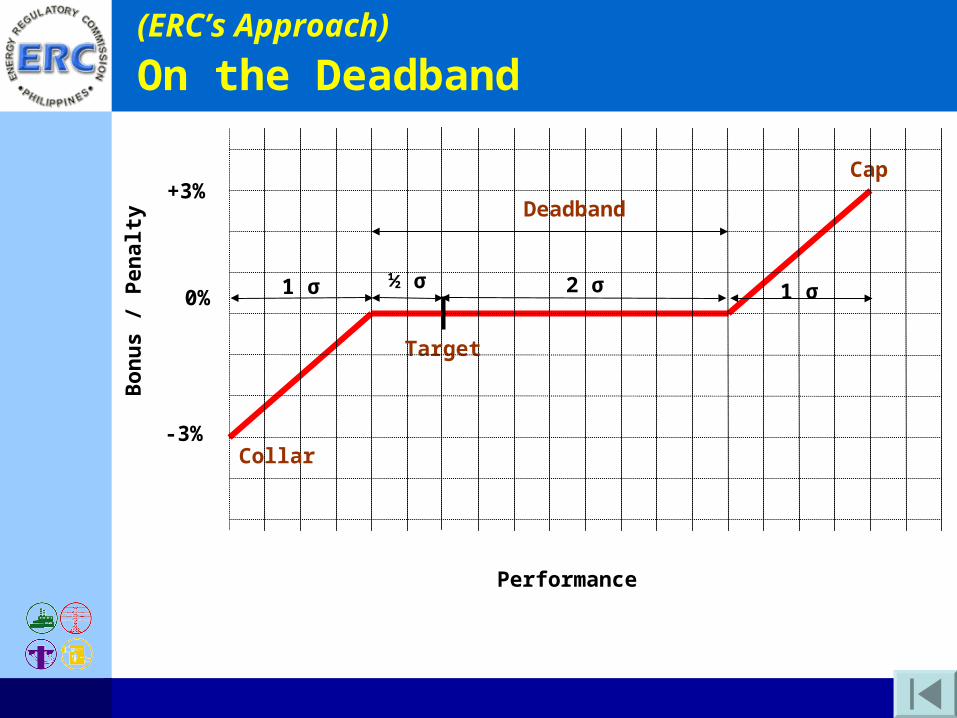
(ERC’s Approach)
0%
-3%
+3%
Target
Cap
2 σ½ σ 1 σ
Performance
1 σ
Collar
Deadband
Bon
us /
Pen
alt
y
On the Deadband

ERC’s Proposed Standard Deviation:
PICollar
(Penalty)
DeadbandCap (Rewar
d)
Max. MeasureLow Target High
-3% 0% 0% 0% 3%
Luzon
SISI 1 STDEV 1/2 STDEV Target 1 STDEV 1 STDEV 0 min.
FOT 1 STDEV 1/2 STDEV Target 1½ STDEV 1 STDEV 0 min.
SA 1 STDEV 1/2 STDEV Target 2 STDEV 1 STDEV 100%
FLC 1 STDEV 1/2 STDEV Target 1/2 STDEV <1 STDEV 100%
VLC 1 STDEV 1/2 STDEV Mean 1/2 STDEV 1 STDEV 100%
Visayas
SISI 1 STDEV 1/2 STDEV Target 1/2 STDEV <1 STDEV 0 min.
FOT 1 STDEV 1/2 STDEV Mean 2 STDEV 1 STDEV 0 min.
SA 1 STDEV 1/2 STDEV Target 2 STDEV 1 STDEV 100%
FLC 1 STDEV 1/2 STDEV Target 1/2 STDEV <1 STDEV 100%
VLC 1 STDEV 1/2 STDEV Target <1/2 STDEV no reward 100%
Mindanao
SISI 1 STDEV 1/2 STDEV Mean 1/2 STDEV 1 STDEV 0 min.
FOT 1 STDEV 1/2 STDEV Mean 1½ STDEV 1 STDEV 0 min.
SA 1 STDEV 1/2 STDEV Target 1 STDEV 1 STDEV 100%
FLC 1 STDEV 1/2 STDEV Target 1/2 STDEV 1 STDEV 100%
VLC 1 STDEV 1/2 STDEV Mean 1/2 STDEV 1 STDEV 100%
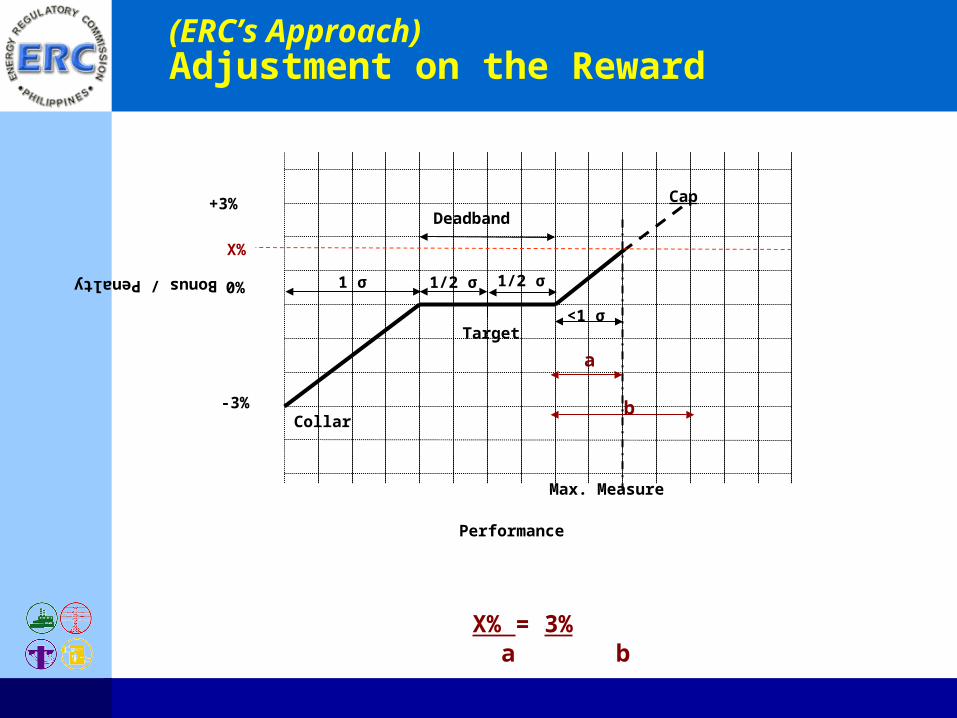
(ERC’s Approach) Adjustment on the Reward
0%
-3%
+3%
Target
Cap
1/2 σ1/2 σ
<1 σ
Performance
Bonus / Penalty 1 σ
Collar
Deadband
Max. Measure
X% = 3% a b
X%
a
b
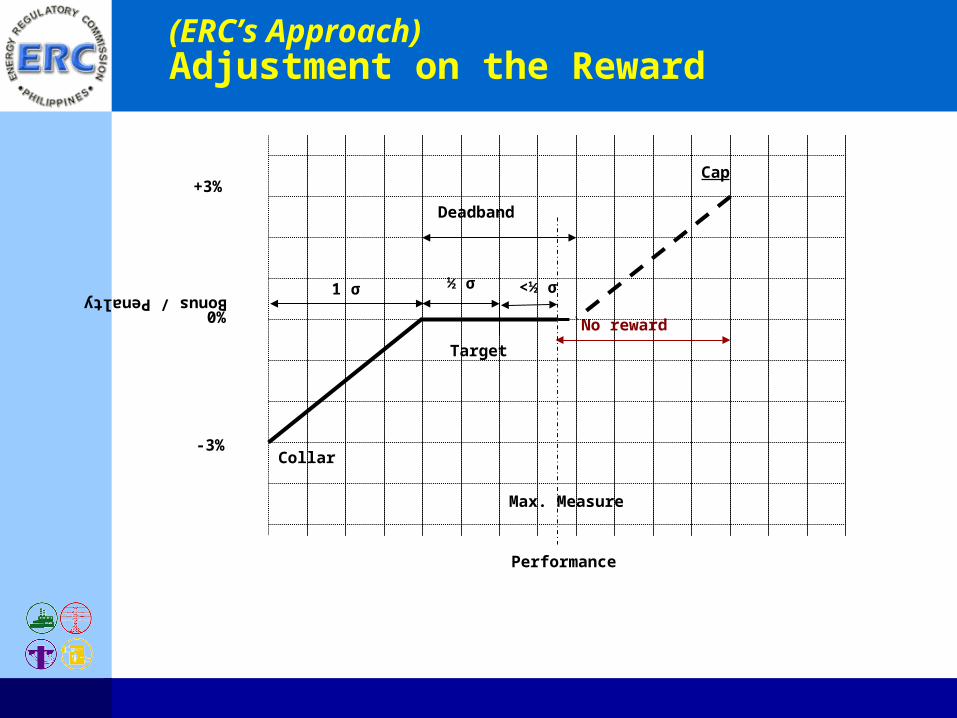
0%
-3%
+3%
Target
Cap
<½ σ½ σ
No reward
Performance
Bonus / Penalty 1 σ
Collar
Deadband
Max. Measure
(ERC’s Approach) Adjustment on the Reward

END OF PRESENTATION