Embed Size (px)
Citation preview
Copyright © 2008 by the McGraw-Hill Companies, Inc. All rights reserved.
McGraw-Hill/IrwinManagerial Economics, 9e
Managerial Economics ThomasMauriceninth edition
Copyright © 2008 by the McGraw-Hill Companies, Inc. All rights reserved.
McGraw-Hill/IrwinManagerial Economics, 9e
Managerial Economics ThomasMauriceninth edition
Chapter 7
Demand Estimation & Forecasting
Managerial EconomicsManagerial Economics
7-2
Direct Methods of Demand Estimation
• Consumer interviews• Range from stopping shoppers to speak with
them to administering detailed questionnaires
• Potential problems Selection of a representative sample, which is a
sample (usually random) having characteristics that accurately reflect the population as a whole
Response bias, which is the difference between responses given by an individual to a hypothetical question and the action the individual takes when the situation actually occurs
Inability of the respondent to answer accurately
Managerial EconomicsManagerial Economics
7-3
Direct Methods of Demand Estimation• Market studies & experiments
• Market studies attempt to hold everything constant during the study except the price of the good
• Lab experiments use volunteers to simulate actual buying conditions
• Field experiments observe actual behavior of consumers
Managerial EconomicsManagerial Economics
7-4
Empirical Demand Functions
• Demand equations derived from actual market data
• Useful in making pricing & production decisions
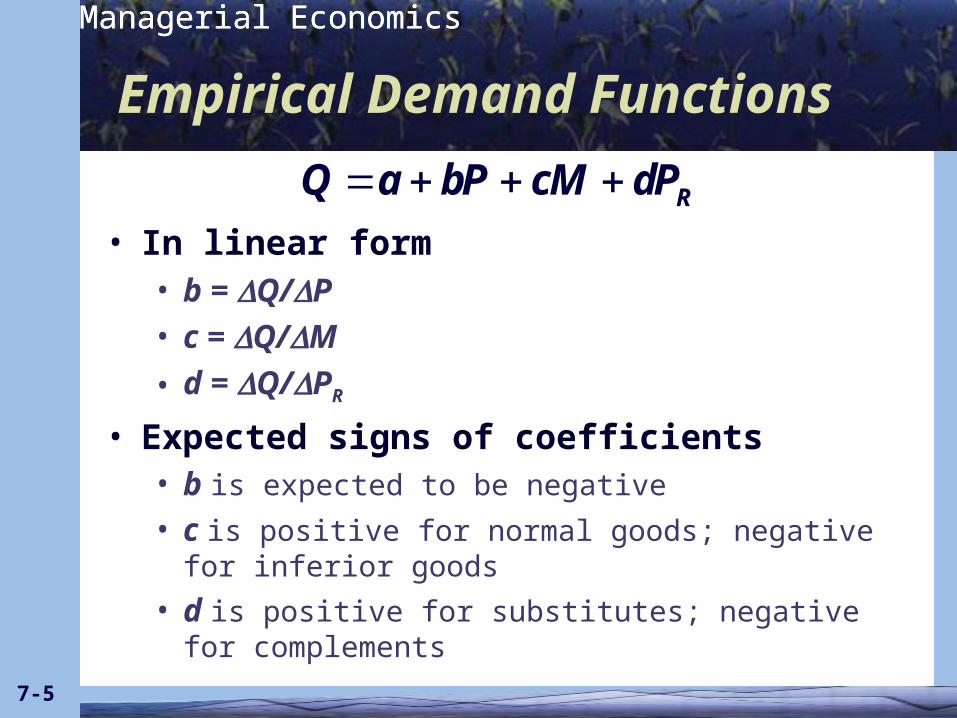
• In linear form, an empirical demand function can be specified as
RQ a bP cM dP where is quantity demanded, is the price of the goodor service, is consumer income, & is the price of somerelated good
R
Q PM P
R
Managerial EconomicsManagerial Economics
7-5
Empirical Demand Functions
• In linear form• b = Q/P
• c = Q/M
• d = Q/PR
• Expected signs of coefficients• b is expected to be negative
• c is positive for normal goods; negative for inferior goods
• d is positive for substitutes; negative for complements
RQ a bP cM dP
Managerial EconomicsManagerial Economics
7-6
Empirical Demand Functions
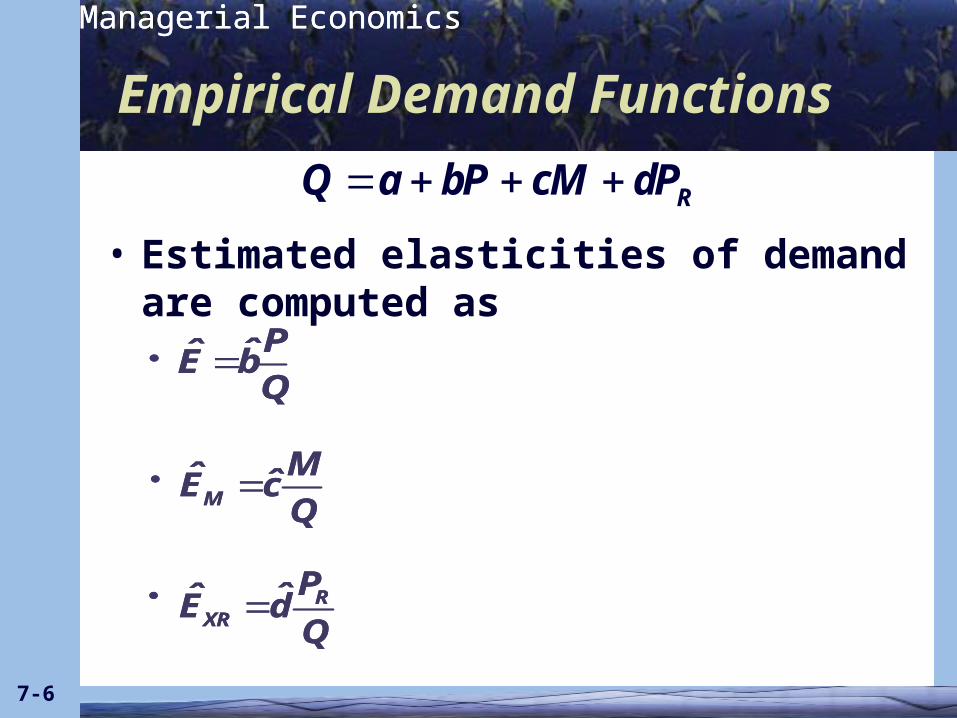
• Estimated elasticities of demand are computed as
RQ a bP cM dP
PˆE bQ
PˆE bQ
M
Mˆ ˆE cQ
M
Mˆ ˆE cQ
RXR
PˆE dQ
RXR
PˆE dQ
Managerial EconomicsManagerial Economics
7-7
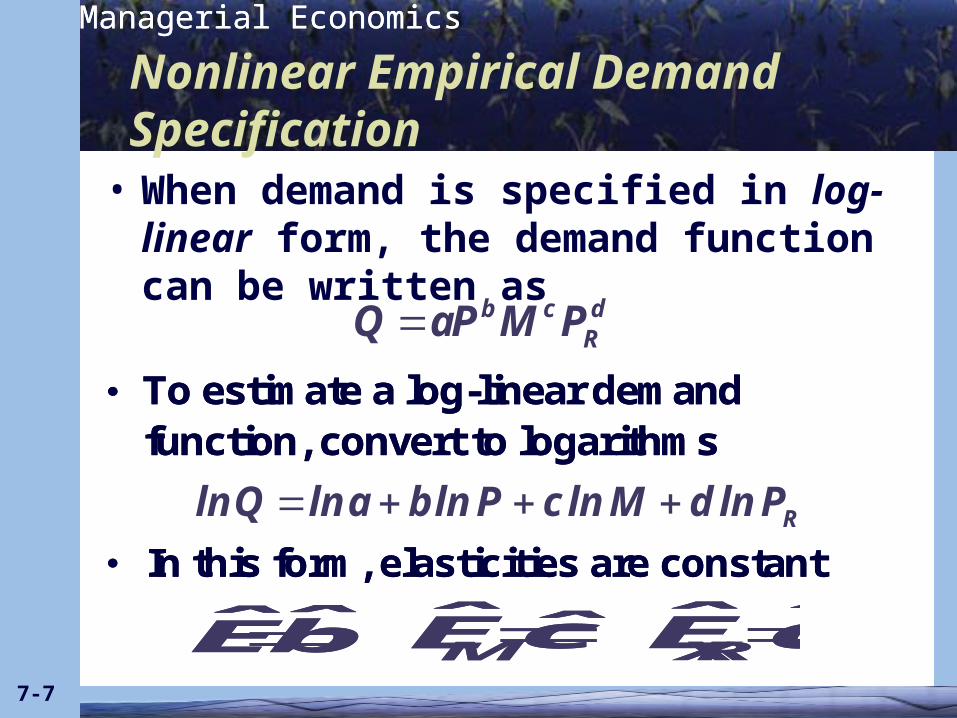
Nonlinear Empirical Demand Specification• When demand is specified in log-linear
form, the demand function can be written as
b c dRQ aP M P
To estimate a log-linear demandfunction, convert to logarithms
To estimate a log-linear demandfunction, convert to logarithms
RlnQ lna b ln P c ln M d ln P In this form, elasticities are constant In this form, elasticities are constant
ˆEb MˆEc XR
ˆEdˆEb MˆEc XR
ˆEd
Managerial EconomicsManagerial Economics
7-8
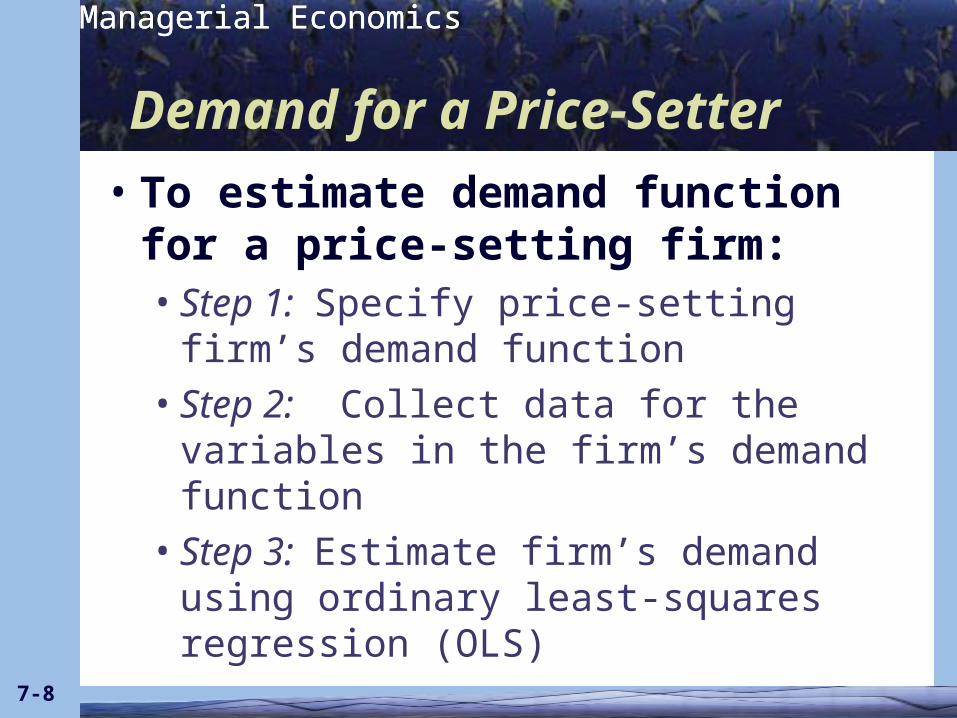
Demand for a Price-Setter
• To estimate demand function for a price-setting firm:• Step 1: Specify price-setting firm’s
demand function• Step 2: Collect data for the
variables in the firm’s demand function
• Step 3: Estimate firm’s demand using ordinary least-squares regression (OLS)
Managerial EconomicsManagerial Economics
7-9
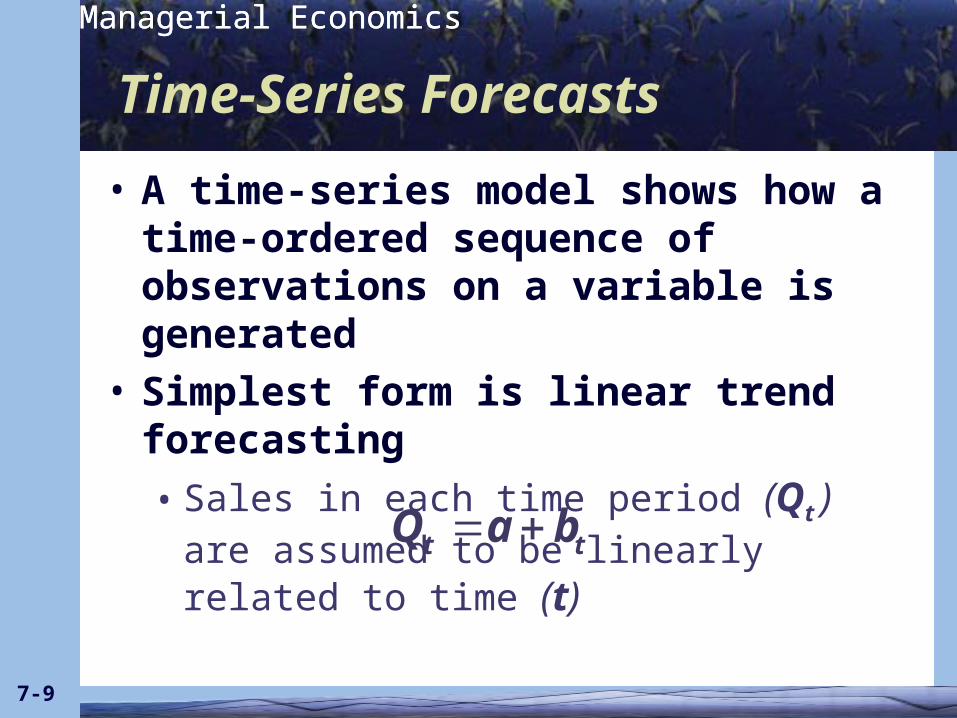
Time-Series Forecasts
• A time-series model shows how a time-ordered sequence of observations on a variable is generated
• Simplest form is linear trend forecasting
• Sales in each time period (Qt ) are assumed to be linearly related to time (t)
t tQ a b
Managerial EconomicsManagerial Economics
7-10
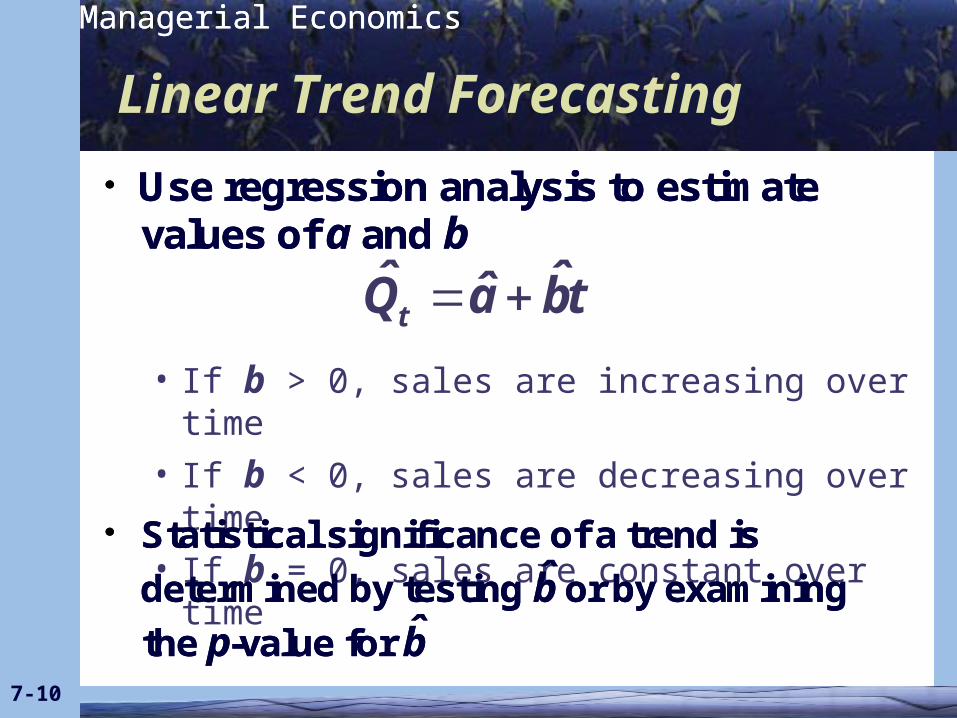
Linear Trend Forecasting
• If b > 0, sales are increasing over time
• If b < 0, sales are decreasing over time
• If b = 0, sales are constant over time
a bUse regression analysis to estimatevalues of and
a bUse regression analysis to estimatevalues of and
tˆ ˆˆQ a bt
bˆp b
Statistical significance of a trend is
determined by testing or by examining
the -value for
bˆp b
Statistical significance of a trend is
determined by testing or by examining
the -value for
Managerial EconomicsManagerial Economics
7-11
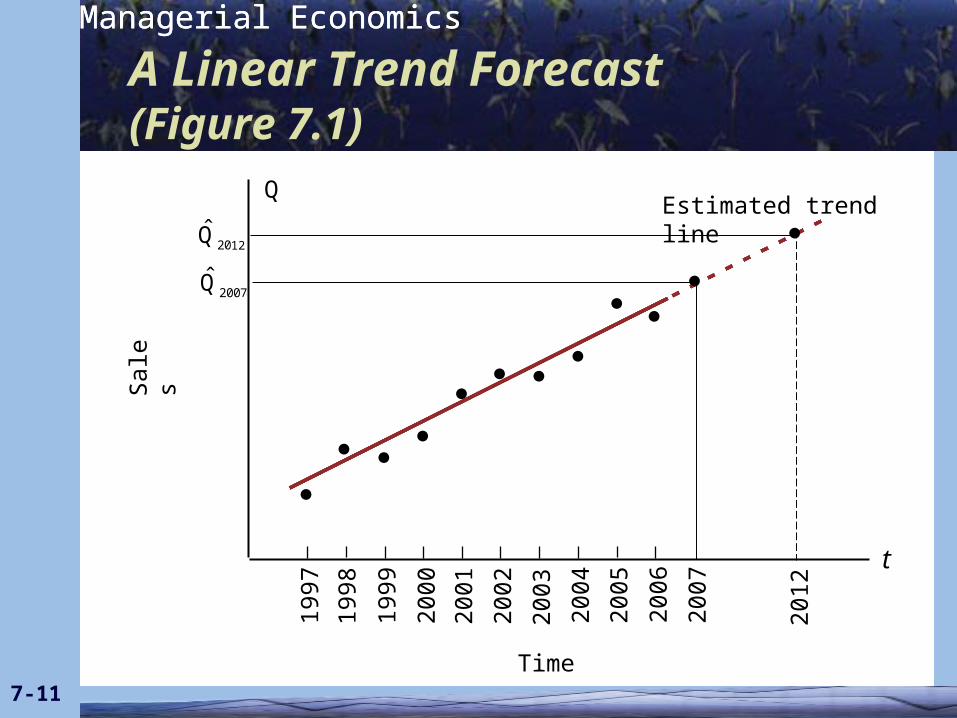
Estimated trend line
A Linear Trend Forecast(Figure 7.1)
Sale
s
Time
Q
t
199
7
199
8
199
9
200
0
200
1
200
2
200
3
200
4
200
5
200
6
2004Q
200
7
7
201
2
2009Q 12
Managerial EconomicsManagerial Economics
7-12
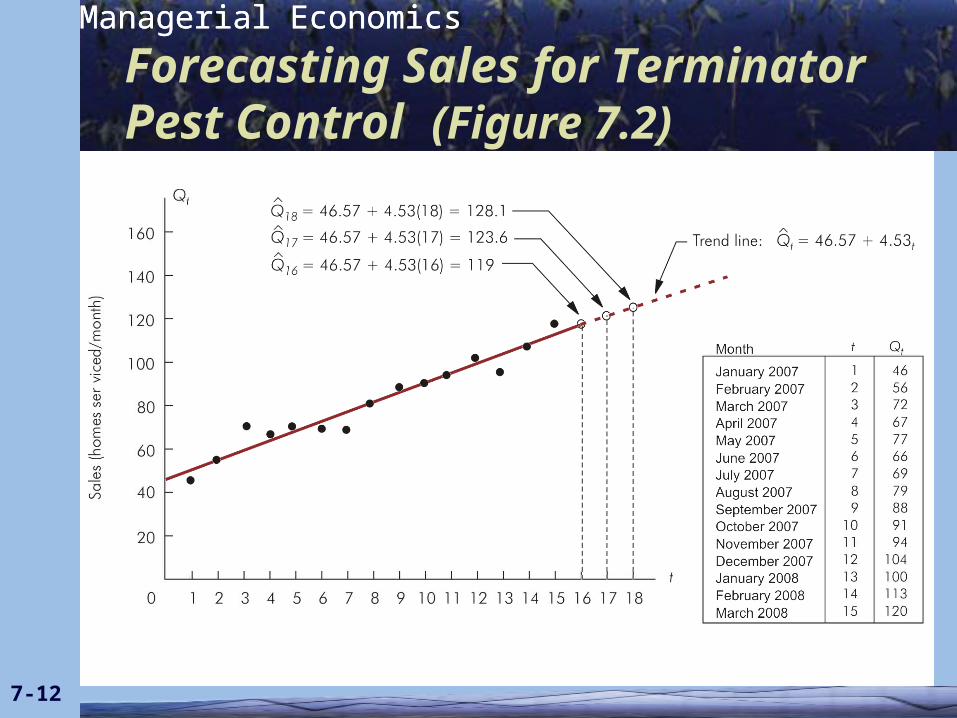
Forecasting Sales for Terminator Pest Control (Figure 7.2)
Managerial EconomicsManagerial Economics
7-13
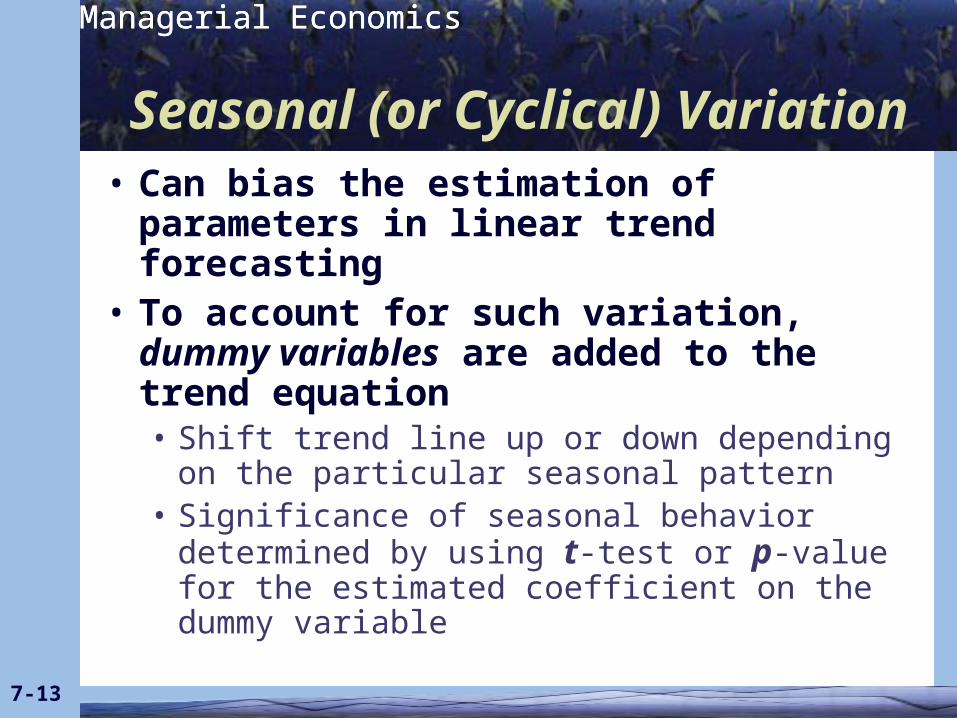
Seasonal (or Cyclical) Variation• Can bias the estimation of parameters
in linear trend forecasting• To account for such variation, dummy
variables are added to the trend equation• Shift trend line up or down depending on
the particular seasonal pattern• Significance of seasonal behavior
determined by using t-test or p-value for the estimated coefficient on the dummy variable
Managerial EconomicsManagerial Economics
7-14
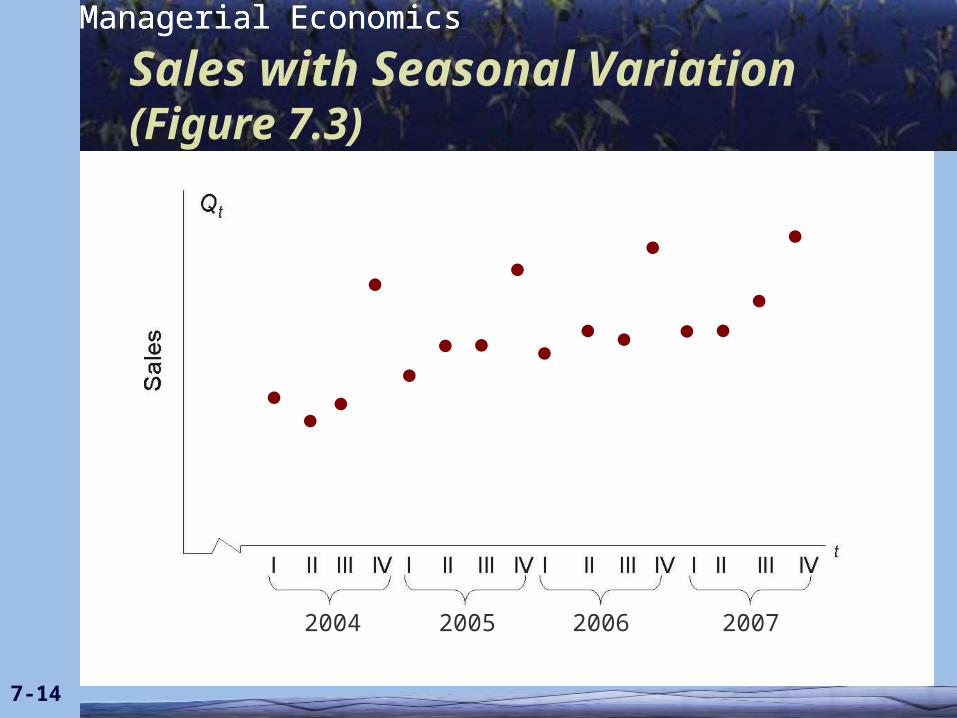
Sales with Seasonal Variation(Figure 7.3)
2004 2005 2006 2007
Managerial EconomicsManagerial Economics
7-15
Dummy Variables
• To account for N seasonal time periods• N – 1 dummy variables are added
• Each dummy variable accounts for one seasonal time period• Takes value of 1 for observations
that occur during the season assigned to that dummy variable
• Takes value of 0 otherwise
Managerial EconomicsManagerial Economics
7-16
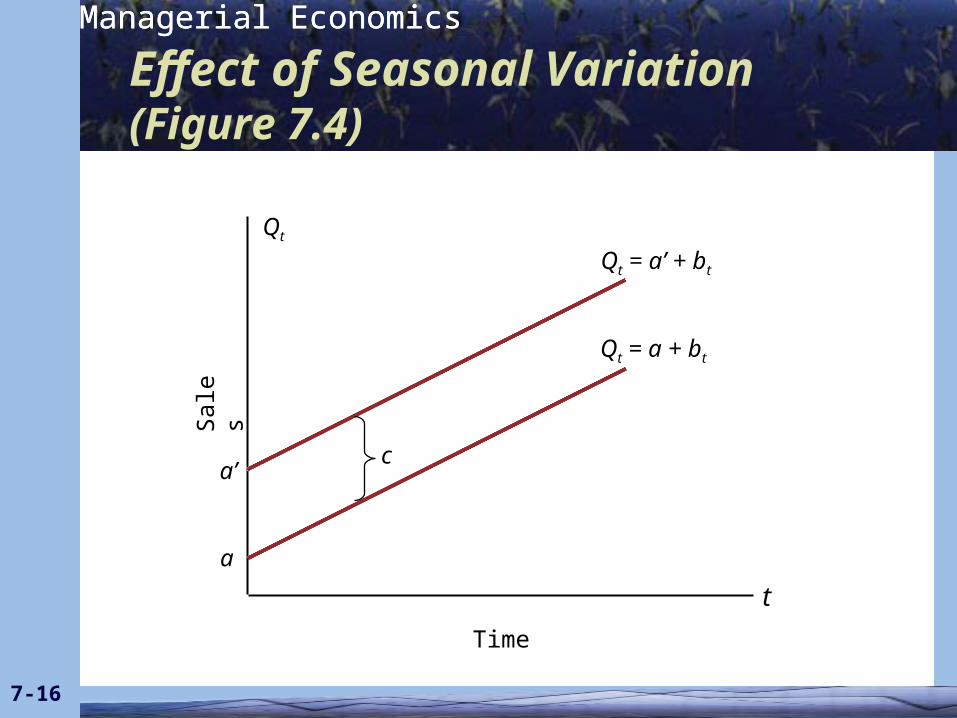
Effect of Seasonal Variation(Figure 7.4)
Sale
s
Time
Qt
t
Qt = a’ + bt
a’
a
Qt = a + bt
c
Managerial EconomicsManagerial Economics
7-17
Some Final Warnings
• The further into the future a forecast is made, the wider is the confidence interval or region of uncertainty
• Model misspecification, either by excluding an important variable or by using an inappropriate functional form, reduces reliability of the forecast
• Forecasts are incapable of predicting sharp changes that occur because of structural changes in the market