Embed Size (px)
Citation preview
Seventh Northwest Conservation and Electric Power Plan
nwcouncil.org/7thplan 7-1
CHAPTER 7: ELECTRICITY DEMAND FORECAST
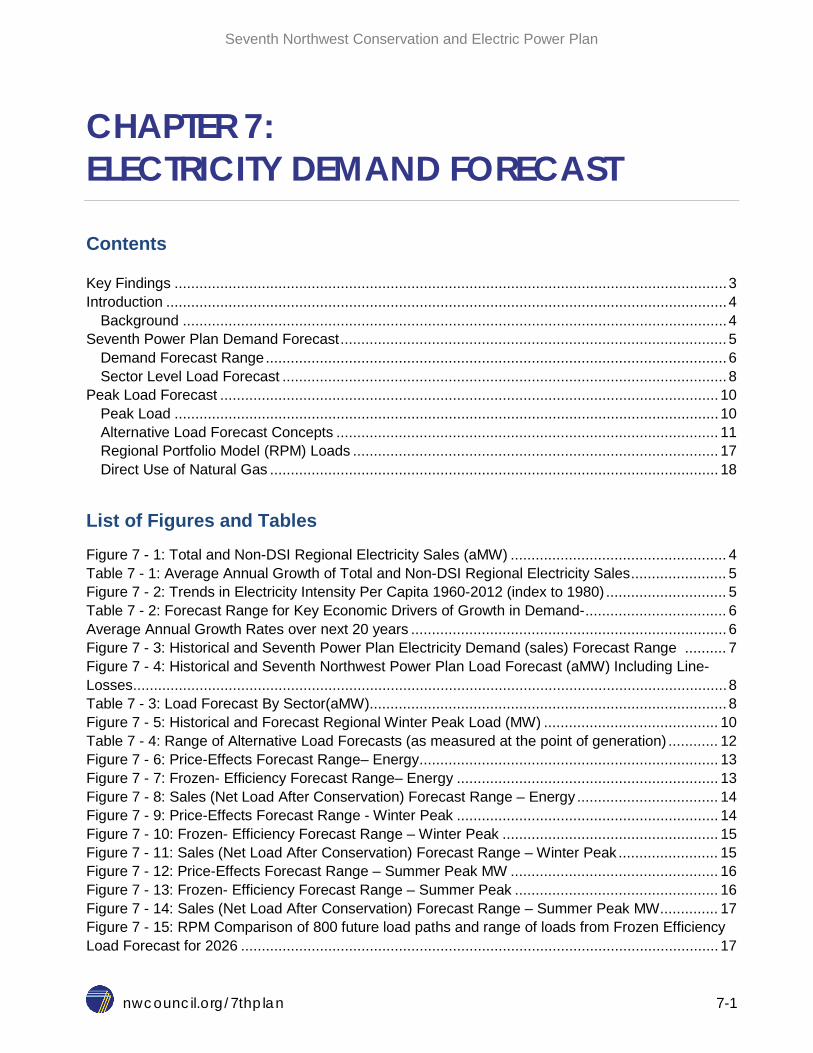
Contents Key Findings ..................................................................................................................................... 3 Introduction ....................................................................................................................................... 4
Background ................................................................................................................................... 4 Seventh Power Plan Demand Forecast ............................................................................................. 5
Demand Forecast Range ............................................................................................................... 6 Sector Level Load Forecast ........................................................................................................... 8
Peak Load Forecast ........................................................................................................................ 10 Peak Load ................................................................................................................................... 10 Alternative Load Forecast Concepts ............................................................................................ 11 Regional Portfolio Model (RPM) Loads ........................................................................................ 17 Direct Use of Natural Gas ............................................................................................................ 18
List of Figures and Tables
Figure 7 - 1: Total and Non-DSI Regional Electricity Sales (aMW) .................................................... 4 Table 7 - 1: Average Annual Growth of Total and Non-DSI Regional Electricity Sales ....................... 5 Figure 7 - 2: Trends in Electricity Intensity Per Capita 1960-2012 (index to 1980) ............................. 5 Table 7 - 2: Forecast Range for Key Economic Drivers of Growth in Demand- .................................. 6 Average Annual Growth Rates over next 20 years ............................................................................ 6 Figure 7 - 3: Historical and Seventh Power Plan Electricity Demand (sales) Forecast Range .......... 7 Figure 7 - 4: Historical and Seventh Northwest Power Plan Load Forecast (aMW) Including Line-Losses ............................................................................................................................................... 8 Table 7 - 3: Load Forecast By Sector(aMW) ...................................................................................... 8 Figure 7 - 5: Historical and Forecast Regional Winter Peak Load (MW) .......................................... 10 Table 7 - 4: Range of Alternative Load Forecasts (as measured at the point of generation) ............ 12 Figure 7 - 6: Price-Effects Forecast Range– Energy ........................................................................ 13 Figure 7 - 7: Frozen- Efficiency Forecast Range– Energy ............................................................... 13 Figure 7 - 8: Sales (Net Load After Conservation) Forecast Range – Energy .................................. 14 Figure 7 - 9: Price-Effects Forecast Range - Winter Peak ............................................................... 14 Figure 7 - 10: Frozen- Efficiency Forecast Range – Winter Peak .................................................... 15 Figure 7 - 11: Sales (Net Load After Conservation) Forecast Range – Winter Peak ........................ 15 Figure 7 - 12: Price-Effects Forecast Range – Summer Peak MW .................................................. 16 Figure 7 - 13: Frozen- Efficiency Forecast Range – Summer Peak ................................................. 16 Figure 7 - 14: Sales (Net Load After Conservation) Forecast Range – Summer Peak MW .............. 17 Figure 7 - 15: RPM Comparison of 800 future load paths and range of loads from Frozen Efficiency Load Forecast for 2026 ................................................................................................................... 17

Chapter 7: Electricity Demand Forecast
nwcouncil.org/7thplan 7-2
The forecast for the Bonneville Power Administration’s load and resource obligations is presented in Chapter 5.
Throughout this chapter the demand forecast is presented as a range. This is done to reinforce the fact that the future is uncertain. The Council’s planning process does not use a single deterministic future to drive the analysis. Rather, the stochastic variation introduced in the Regional Portfolio Model tests a wide range of future uncertainties in load, fuel prices etc.
Chapter 7: Electricity Demand Forecast
nwcouncil.org/7thplan 7-3
KEY FINDINGS Pacific Northwest consumers used 19,400 average megawatts or 170 million megawatt-hours of electricity in 2013. Without development of conservation beyond that projected to result from changes in retail electricity prices, the Council forecasts regional electricity demand will grow between 21,000 and 24,000 average megawatts by 2035.1 Regional demand is expected to increase by 2,200 to 4,800 average megawatts from 2015 to 2035 with an annual increase of 110 to 240 average megawatts per year. This translates to a growth rate of 0.5 to 1.0 percent per year. The regional peak load for power, which typically occurs in winter, is forecast to grow from 30,000 to 31,000 megawatts in 2015 to 32,000 to 36,000 megawatts by 2035. This equates to an average annual growth rate of 0.4 to 0.8 percent. Cost-effective efficiency improvements identified in this Seventh Power Plan are anticipated to meet most if not all of this projected growth.
The slow pace of growth in electricity demand is unprecedented. Lower forecast growth in demand is due to projected significant improvements in federal appliance standards and to a much lesser extent, the growth in distributed generation at customer sites (e.g. roof-top solar photovoltaics [PV]. After accounting for the impact of new cost-effective conservation that should be developed over this period, the need for additional generation is forecast to be quite small compared to historical experience. While annual electricity demand is forecast to grow slowly, summer-peak demand continues to grow and may equal winter-peak demand possibly even as early as during the period of this twenty-year plan.
Unlike most of the rest of the nation, the Northwest has historically been a winter-peaking power system. However, largely due to the increased use of air conditioning, the difference between winter- and summer-peak loads is forecast to shrink over time. Assuming normal weather conditions, winter-peak demand in the Seventh Power Plan is projected to grow from 30,000 to 31,000 megawatts in 2015 to around 32,000 to 36,000 megawatts by 2035. Summer-peak demand is forecast to grow faster than winter peak. Summer peak is forecast to grow from 27,000 to 28,000 megawatts in 2015 to 31,000 to 34,000 megawatts by 2035. The average annual growth rate for winter-peak demand is forecast to be 0.4 to 0.8 percent per year while the annual growth rate for summer-peak demand is forecast to grow at a slightly faster pace of 0.7 to 1.0 percent per year. As a result, by 2035 the gap between summer-peak load and winter-peak load will have narrowed considerably from about 3,000 megawatts to between 1,000 to 2000 megawatts.
1 Throughout this chapter the amount of electricity used by consumers is referred to as either electricity demand or sales. Electricity load refers to the amount of electricity produced at generation facilities and includes transmission and distribution system losses.
Chapter 7: Electricity Demand Forecast
nwcouncil.org/7thplan 7-4
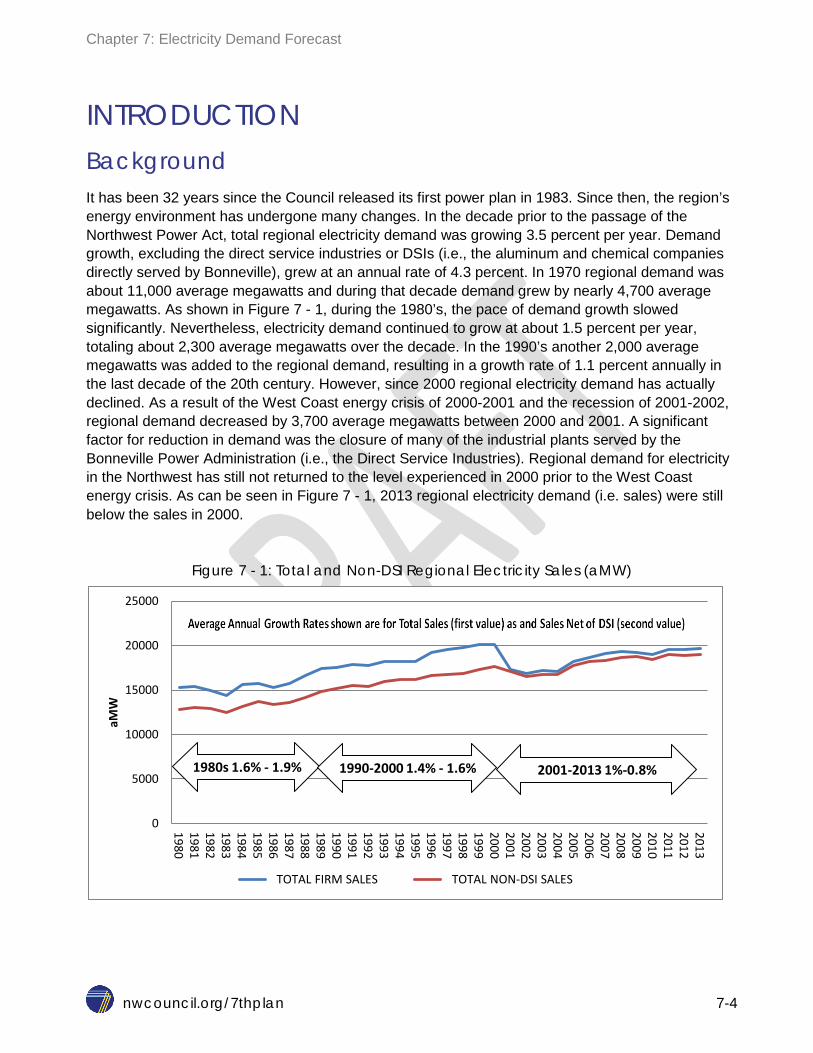
INTRODUCTION Background It has been 32 years since the Council released its first power plan in 1983. Since then, the region’s energy environment has undergone many changes. In the decade prior to the passage of the Northwest Power Act, total regional electricity demand was growing 3.5 percent per year. Demand growth, excluding the direct service industries or DSIs (i.e., the aluminum and chemical companies directly served by Bonneville), grew at an annual rate of 4.3 percent. In 1970 regional demand was about 11,000 average megawatts and during that decade demand grew by nearly 4,700 average megawatts. As shown in Figure 7 - 1, during the 1980’s, the pace of demand growth slowed significantly. Nevertheless, electricity demand continued to grow at about 1.5 percent per year, totaling about 2,300 average megawatts over the decade. In the 1990’s another 2,000 average megawatts was added to the regional demand, resulting in a growth rate of 1.1 percent annually in the last decade of the 20th century. However, since 2000 regional electricity demand has actually declined. As a result of the West Coast energy crisis of 2000-2001 and the recession of 2001-2002, regional demand decreased by 3,700 average megawatts between 2000 and 2001. A significant factor for reduction in demand was the closure of many of the industrial plants served by the Bonneville Power Administration (i.e., the Direct Service Industries). Regional demand for electricity in the Northwest has still not returned to the level experienced in 2000 prior to the West Coast energy crisis. As can be seen in Figure 7 - 1, 2013 regional electricity demand (i.e. sales) were still below the sales in 2000.
Figure 7 - 1: Total and Non-DSI Regional Electricity Sales (aMW)
0
5000
10000
15000
20000
25000
1980 1981 1982 1983 1984 1985 1986 1987 1988 1989 1990 1991 1992 1993 1994 1995 1996 1997 1998 1999 2000 2001 2002 2003 2004 2005 2006 2007 2008 2009 2010 2011 2012 2013
aMW
TOTAL FIRM SALES TOTAL NON-DSI SALES
1980s 1.6% - 1.9% 1990-2000 1.4% - 1.6% 2001-2013 1%-0.8%
Chapter 7: Electricity Demand Forecast
nwcouncil.org/7thplan 7-5
Table 7 - 1: Average Annual Growth of Total and Non-DSI Regional Electricity Sales
Annual Growth Total Sales Non DSI
1970-1979 4.1% 5.2% 1980-1989 1.5% 1.7% 1990-1999 1.1% 1.5% 2000-2007 -0.8% 0.5% 2007-2013 0.5% 0.6%
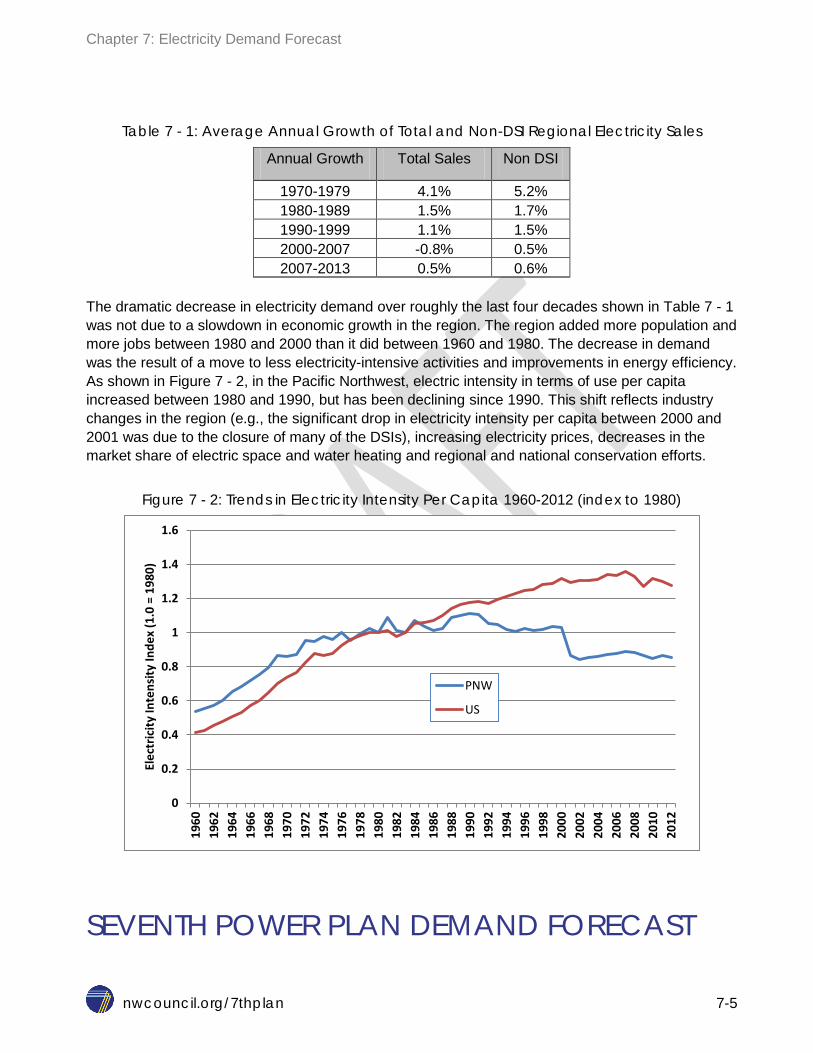
The dramatic decrease in electricity demand over roughly the last four decades shown in Table 7 - 1 was not due to a slowdown in economic growth in the region. The region added more population and more jobs between 1980 and 2000 than it did between 1960 and 1980. The decrease in demand was the result of a move to less electricity-intensive activities and improvements in energy efficiency. As shown in Figure 7 - 2, in the Pacific Northwest, electric intensity in terms of use per capita increased between 1980 and 1990, but has been declining since 1990. This shift reflects industry changes in the region (e.g., the significant drop in electricity intensity per capita between 2000 and 2001 was due to the closure of many of the DSIs), increasing electricity prices, decreases in the market share of electric space and water heating and regional and national conservation efforts.
Figure 7 - 2: Trends in Electricity Intensity Per Capita 1960-2012 (index to 1980)
SEVENTH POWER PLAN DEMAND FORECAST
0
0.2
0.4
0.6
0.8
1
1.2
1.4
1.6
1960
19
62
1964
19
66
1968
19
70
1972
19
74
1976
19
78
1980
19
82
1984
19
86
1988
19
90
1992
19
94
1996
19
98
2000
20
02
2004
20
06
2008
20
10
2012
Elec
tric
ity In
tens
ity In
dex
(1.0
= 1
980)
PNW
US
Chapter 7: Electricity Demand Forecast
nwcouncil.org/7thplan 7-6
The Pacific Northwest consumed 19,600 average megawatts or 172 million megawatt-hours of electricity in 2013. Without the development of conservation beyond that projected to result from changes in retail electricity prices, the Council forecasts regional electricity demand to grow to 21,000 to 24,000 average megawatts by 2035. After accounting for distribution and transmission system losses, regional loads, measured at the generation site, are expected to increase by 2,200 to 4,800 average megawatts between years 2015 and 2035. This translates to an average increase of 110 to 240 average megawatts per year or a growth rate of 0.5 to 1.0 percent per year. The regional peak load for power, which typically occurs in winter, is forecast to grow from 30,000 to 31,000 megawatts in 2015 to around 32,000 to 36,000 megawatts by 2035. This equates to an average annual growth rate of 0.4 to 0.8 percent.
Unlike most of the rest of the nation, the Northwest has historically been a winter-peaking power system. However, largely due to the increased use of air conditioning, the difference between winter- and summer-peak loads is forecast to shrink over time. Assuming normal weather conditions, winter-peak demand is projected to grow from 30,000 to 31,000 megawatts in 2015 to 32,000 to 36,000 megawatts by 2035. Summer-peak demand is forecast to grow faster than Winter peak demand. Summer peak demand is forecast from 27,000 to 28,000 megawatts in 2015, to 31,000 to 34,000 megawatts by 2035. The average annual growth rate for winter-peak demand is forecast to grow at 0.4 to 0.8 percent per year while the annual growth rate for summer-peak demand is forecast to grow at a slightly faster pace of 0.7 to 1.0 percent per year. As a result, by 2035 the gap between summer-peak load and winter-peak load will have narrowed considerably from about 3,000 megawatts to 1,000 - 2000 megawatts.
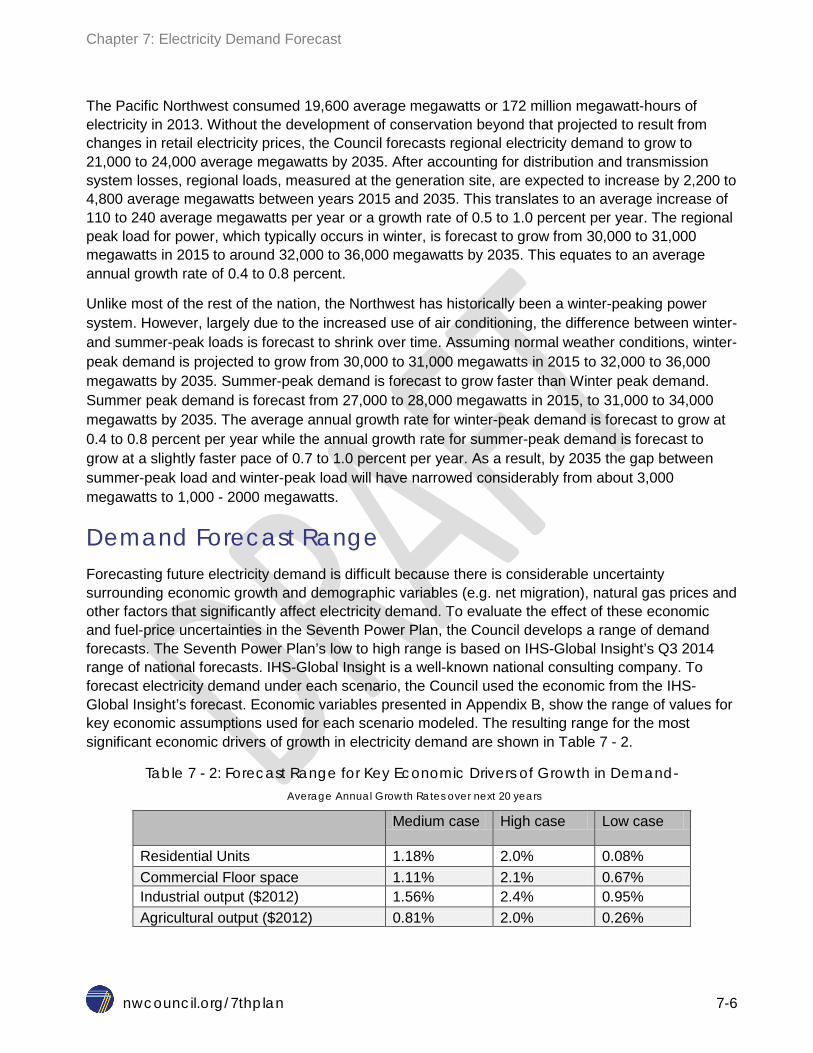
Demand Forecast Range Forecasting future electricity demand is difficult because there is considerable uncertainty surrounding economic growth and demographic variables (e.g. net migration), natural gas prices and other factors that significantly affect electricity demand. To evaluate the effect of these economic and fuel-price uncertainties in the Seventh Power Plan, the Council develops a range of demand forecasts. The Seventh Power Plan’s low to high range is based on IHS-Global Insight’s Q3 2014 range of national forecasts. IHS-Global Insight is a well-known national consulting company. To forecast electricity demand under each scenario, the Council used the economic from the IHS-Global Insight’s forecast. Economic variables presented in Appendix B, show the range of values for key economic assumptions used for each scenario modeled. The resulting range for the most significant economic drivers of growth in electricity demand are shown in Table 7 - 2.
Table 7 - 2: Forecast Range for Key Economic Drivers of Growth in Demand- Average Annual Growth Rates over next 20 years
Medium case High case Low case
Residential Units 1.18% 2.0% 0.08% Commercial Floor space 1.11% 2.1% 0.67% Industrial output ($2012) 1.56% 2.4% 0.95% Agricultural output ($2012) 0.81% 2.0% 0.26%
Chapter 7: Electricity Demand Forecast
nwcouncil.org/7thplan 7-7
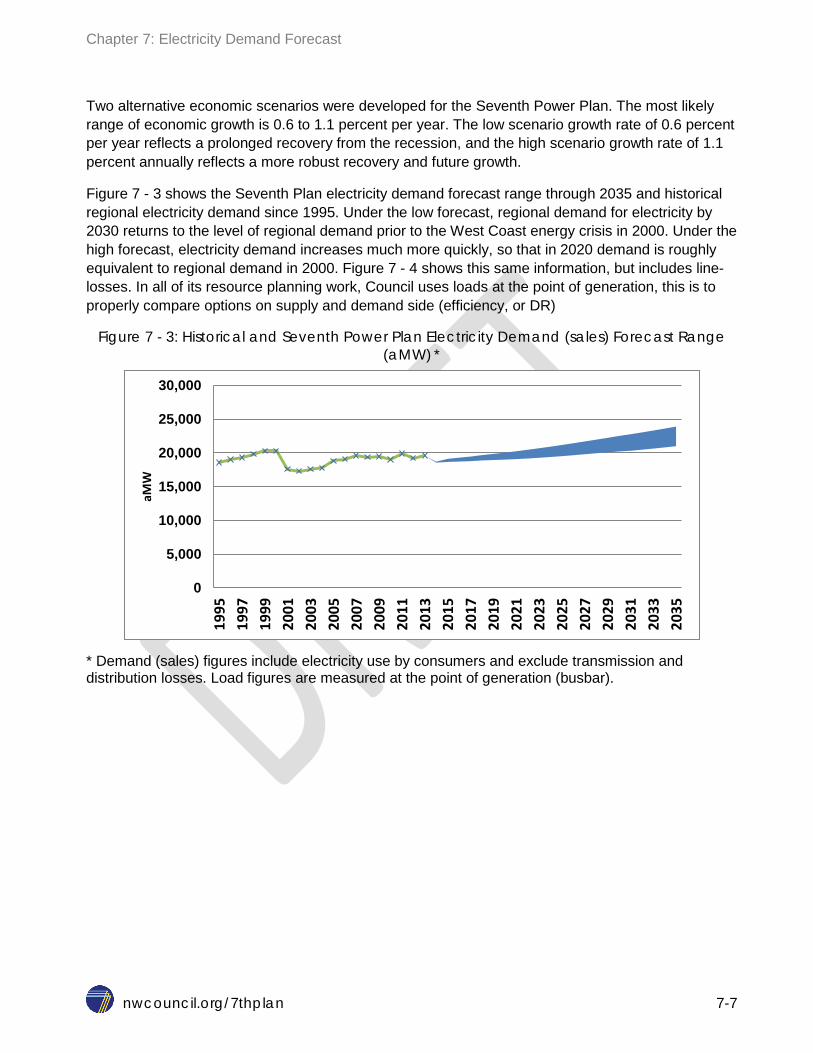
Two alternative economic scenarios were developed for the Seventh Power Plan. The most likely range of economic growth is 0.6 to 1.1 percent per year. The low scenario growth rate of 0.6 percent per year reflects a prolonged recovery from the recession, and the high scenario growth rate of 1.1 percent annually reflects a more robust recovery and future growth.
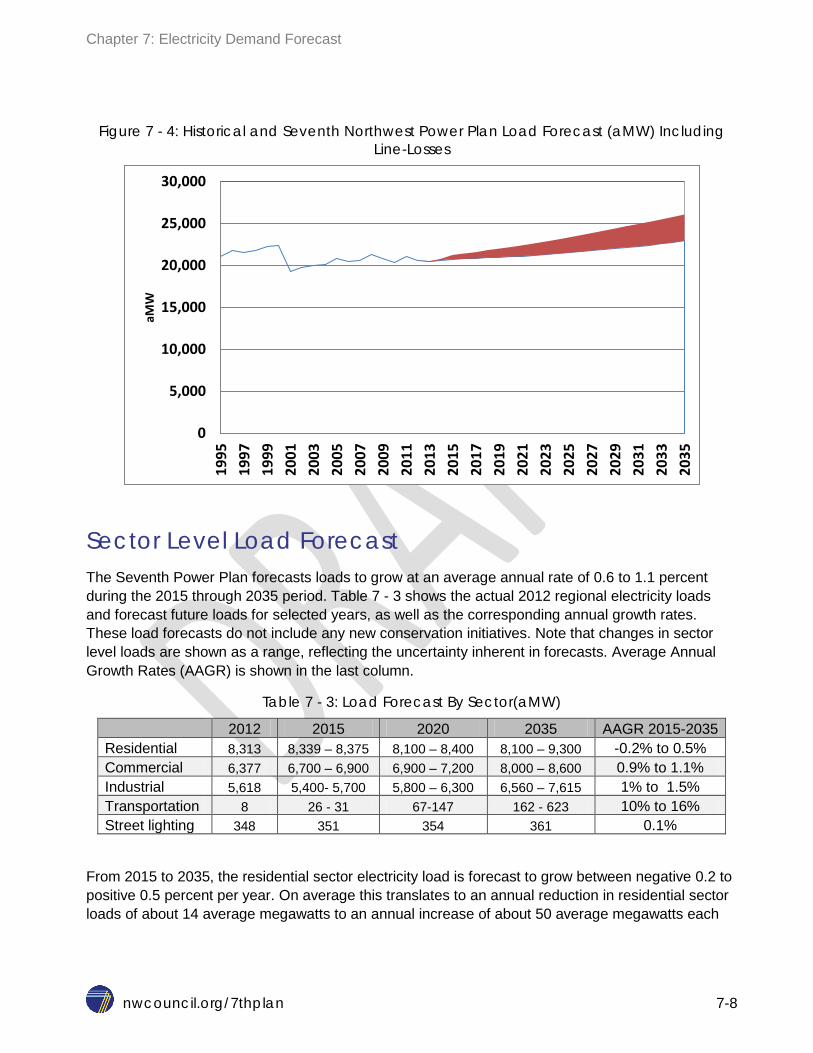
Figure 7 - 3 shows the Seventh Plan electricity demand forecast range through 2035 and historical regional electricity demand since 1995. Under the low forecast, regional demand for electricity by 2030 returns to the level of regional demand prior to the West Coast energy crisis in 2000. Under the high forecast, electricity demand increases much more quickly, so that in 2020 demand is roughly equivalent to regional demand in 2000. Figure 7 - 4 shows this same information, but includes line-losses. In all of its resource planning work, Council uses loads at the point of generation, this is to properly compare options on supply and demand side (efficiency, or DR)
Figure 7 - 3: Historical and Seventh Power Plan Electricity Demand (sales) Forecast Range (aMW) *
* Demand (sales) figures include electricity use by consumers and exclude transmission and distribution losses. Load figures are measured at the point of generation (busbar).
0
5,000
10,000
15,000
20,000
25,000
30,000
1995
19
97
1999
20
01
2003
20
05
2007
20
09
2011
20
13
2015
20
17
2019
20
21
2023
20
25
2027
20
29
2031
20
33
2035
aMW
Chapter 7: Electricity Demand Forecast
nwcouncil.org/7thplan 7-8
Figure 7 - 4: Historical and Seventh Northwest Power Plan Load Forecast (aMW) Including Line-Losses
Sector Level Load Forecast The Seventh Power Plan forecasts loads to grow at an average annual rate of 0.6 to 1.1 percent during the 2015 through 2035 period. Table 7 - 3 shows the actual 2012 regional electricity loads and forecast future loads for selected years, as well as the corresponding annual growth rates. These load forecasts do not include any new conservation initiatives. Note that changes in sector level loads are shown as a range, reflecting the uncertainty inherent in forecasts. Average Annual Growth Rates (AAGR) is shown in the last column.
Table 7 - 3: Load Forecast By Sector(aMW)
2012 2015 2020 2035 AAGR 2015-2035 Residential 8,313 8,339 – 8,375 8,100 – 8,400 8,100 – 9,300 -0.2% to 0.5% Commercial 6,377 6,700 – 6,900 6,900 – 7,200 8,000 – 8,600 0.9% to 1.1% Industrial 5,618 5,400- 5,700 5,800 – 6,300 6,560 – 7,615 1% to 1.5% Transportation 8 26 - 31 67-147 162 - 623 10% to 16% Street lighting 348 351 354 361 0.1%
From 2015 to 2035, the residential sector electricity load is forecast to grow between negative 0.2 to positive 0.5 percent per year. On average this translates to an annual reduction in residential sector loads of about 14 average megawatts to an annual increase of about 50 average megawatts each
0
5,000
10,000
15,000
20,000
25,000
30,000
1995
19
97
1999
20
01
2003
20
05
2007
20
09
2011
20
13
2015
20
17
2019
20
21
2023
20
25
2027
20
29
2031
20
33
2035
aMW
Chapter 7: Electricity Demand Forecast
nwcouncil.org/7thplan 7-9
year. Modest growth in the residential sector reflects substantial reductions in load due to federal standards, increased on-site solar PV generation, as well as slower growth in home electronics.
Commercial sector electricity loads are forecast to grow by 0.9 to 1.1 percent per year between 2015 and 2035. This translates to a commercial sector load increase from 6,700 to 6,900 average megawatts in 2015 to 8,000-8,600 average megawatts by 2035. The slower commercial sector load growth, compared to the Sixth Power Plan is due to the presence of federal standards, slower growth in new floor space, and greater efficiency in lighting technology, primarily from using solid state lighting (i.e., LEDs). On average, this sector adds 64 to 85 average megawatts per year to regional electricity loads.
Industrial sector loads are forecast to grow 1.0 to 1.5 percent annually. Industrial loads are forecast to grow from 5,400 to 5,700 average megawatts in 2015 to 6,500 to 7,600 average megawatts by 2035. This translates to 55 to 95 average megawatts per year. Industrial loads in the Northwest have been slow to return to levels experienced before the West Coast energy crisis. The resource-based industries (e.g. pulp and paper) are being replaced with high-tech industries. For example, one segment of the industrial sector that has experienced significant growth is that of custom data centers. Although these businesses do not manufacture a tangible product, they are typically classified as industrial customers because of the amount of electricity they use. The Council’s estimates show that there are currently 350 to 450 average megawatts of connected load for these businesses. Loads from these data centers are forecast to increase to 400 and 900 megawatts by 2035.
In the Seventh Power Plan, Direct Service Industries (DSI) load is assumed to be around 700-800 average megawatts for the forecast period. Although the portion of Alcoa's Wenatchee aluminum smelter that is served from non-Bonneville sources is not technically a DSI (it is not served by Bonneville), that load is included in the DSI category in the Seventh Power Plan to permit comparison with prior plans.
Electricity load from the transportation sector is expected to grow substantially as the number of plug-in electric (all electric or hybrid electric) vehicles increases. The Council’s Seventh Power Plan projects loads in this sector to increase from 8 average megawatts in 2015, to 160-620 average megawatts by 2035.
Distributed solar or “rooftop solar” using photovoltaic (PV) panels is a relatively new entry into the energy market in the Northwest. Deep declines in PV module prices, availability of third-party financing and other financial incentives have resulted in significant increases in the installation of these distributed generators during the past five years. The Council estimates that by 2015 there will be over 110 average megawatts of Alternating Current (AC) nameplate capacity installed in the region, generating the equivalent of about 17 to 18 average megawatts of energy and providing about 18 MW of summer peak load reduction.2 In the Seventh Power Plan, the Council has incorporated the impact of market-driven rooftop solar power generation into its long term forecast
2 For a more detail discussion of sector-level sales and loads please see Appendix E. Council staff is currently re-examining peak impact of the installed PV.
Chapter 7: Electricity Demand Forecast
nwcouncil.org/7thplan 7-10
model. Therefore, the load forecasts shown for each sector are net of the on-site generation from solar PV. The contribution to system average and system peak from solar PV installs is estimated taking into account coincident factors of mapped solar generation and system load. System average monthly energy and monthly peak loads include the contribution from market-driven rooftop solar PV. The Council projects that by 2035, generation from rooftop solar units could be over 100 average megawatts, with installed capacity of over 500 MW (AC).
A more detailed discussion of rooftop solar PV generation appears in Appendix E- Demand Forecast.
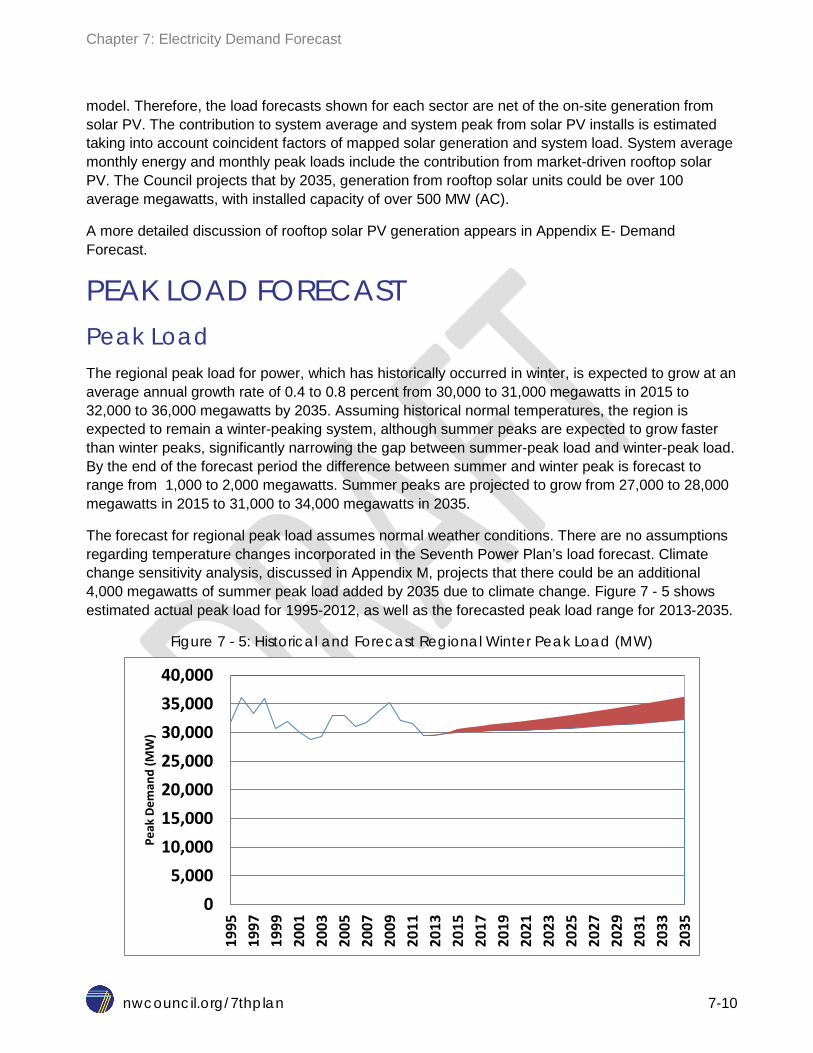
PEAK LOAD FORECAST Peak Load The regional peak load for power, which has historically occurred in winter, is expected to grow at an average annual growth rate of 0.4 to 0.8 percent from 30,000 to 31,000 megawatts in 2015 to 32,000 to 36,000 megawatts by 2035. Assuming historical normal temperatures, the region is expected to remain a winter-peaking system, although summer peaks are expected to grow faster than winter peaks, significantly narrowing the gap between summer-peak load and winter-peak load. By the end of the forecast period the difference between summer and winter peak is forecast to range from 1,000 to 2,000 megawatts. Summer peaks are projected to grow from 27,000 to 28,000 megawatts in 2015 to 31,000 to 34,000 megawatts in 2035.
The forecast for regional peak load assumes normal weather conditions. There are no assumptions regarding temperature changes incorporated in the Seventh Power Plan’s load forecast. Climate change sensitivity analysis, discussed in Appendix M, projects that there could be an additional 4,000 megawatts of summer peak load added by 2035 due to climate change. Figure 7 - 5 shows estimated actual peak load for 1995-2012, as well as the forecasted peak load range for 2013-2035.
Figure 7 - 5: Historical and Forecast Regional Winter Peak Load (MW)
0 5,000
10,000 15,000 20,000 25,000 30,000 35,000 40,000
1995
19
97
1999
20
01
2003
20
05
2007
20
09
2011
20
13
2015
20
17
2019
20
21
2023
20
25
2027
20
29
2031
20
33
2035
Peak
Dem
and
(MW
)
Chapter 7: Electricity Demand Forecast
nwcouncil.org/7thplan 7-11
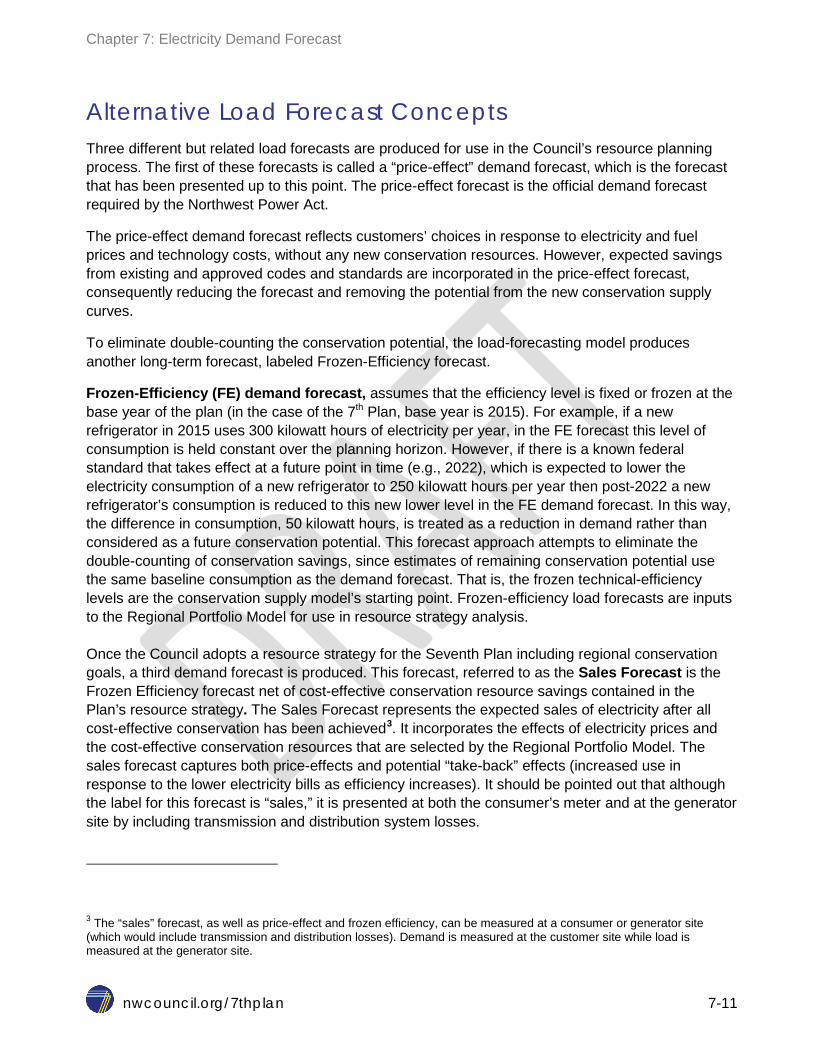
Alternative Load Forecast Concepts Three different but related load forecasts are produced for use in the Council’s resource planning process. The first of these forecasts is called a “price-effect” demand forecast, which is the forecast that has been presented up to this point. The price-effect forecast is the official demand forecast required by the Northwest Power Act.
The price-effect demand forecast reflects customers’ choices in response to electricity and fuel prices and technology costs, without any new conservation resources. However, expected savings from existing and approved codes and standards are incorporated in the price-effect forecast, consequently reducing the forecast and removing the potential from the new conservation supply curves.
To eliminate double-counting the conservation potential, the load-forecasting model produces another long-term forecast, labeled Frozen-Efficiency forecast.
Frozen-Efficiency (FE) demand forecast, assumes that the efficiency level is fixed or frozen at the base year of the plan (in the case of the 7th Plan, base year is 2015). For example, if a new refrigerator in 2015 uses 300 kilowatt hours of electricity per year, in the FE forecast this level of consumption is held constant over the planning horizon. However, if there is a known federal standard that takes effect at a future point in time (e.g., 2022), which is expected to lower the electricity consumption of a new refrigerator to 250 kilowatt hours per year then post-2022 a new refrigerator’s consumption is reduced to this new lower level in the FE demand forecast. In this way, the difference in consumption, 50 kilowatt hours, is treated as a reduction in demand rather than considered as a future conservation potential. This forecast approach attempts to eliminate the double-counting of conservation savings, since estimates of remaining conservation potential use the same baseline consumption as the demand forecast. That is, the frozen technical-efficiency levels are the conservation supply model’s starting point. Frozen-efficiency load forecasts are inputs to the Regional Portfolio Model for use in resource strategy analysis.
Once the Council adopts a resource strategy for the Seventh Plan including regional conservation goals, a third demand forecast is produced. This forecast, referred to as the Sales Forecast is the Frozen Efficiency forecast net of cost-effective conservation resource savings contained in the Plan’s resource strategy. The Sales Forecast represents the expected sales of electricity after all cost-effective conservation has been achieved3. It incorporates the effects of electricity prices and the cost-effective conservation resources that are selected by the Regional Portfolio Model. The sales forecast captures both price-effects and potential “take-back” effects (increased use in response to the lower electricity bills as efficiency increases). It should be pointed out that although the label for this forecast is “sales,” it is presented at both the consumer’s meter and at the generator site by including transmission and distribution system losses.
3 The “sales” forecast, as well as price-effect and frozen efficiency, can be measured at a consumer or generator site (which would include transmission and distribution losses). Demand is measured at the customer site while load is measured at the generator site.
Chapter 7: Electricity Demand Forecast
nwcouncil.org/7thplan 7-12
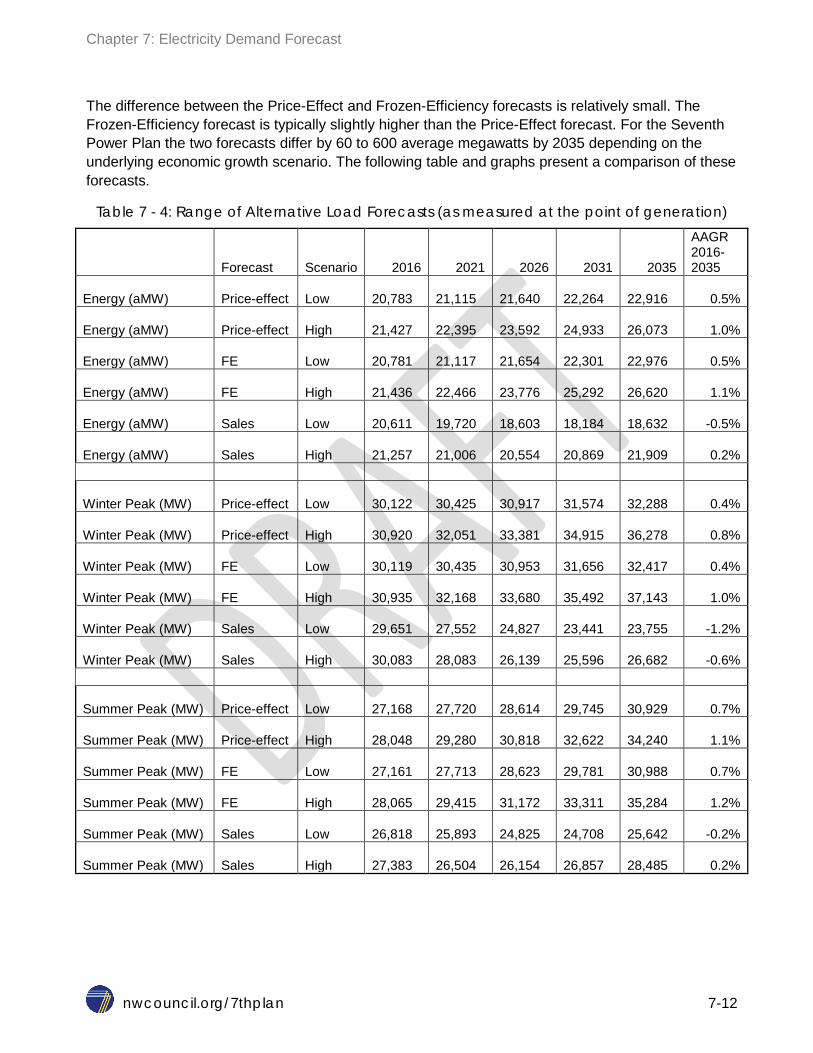
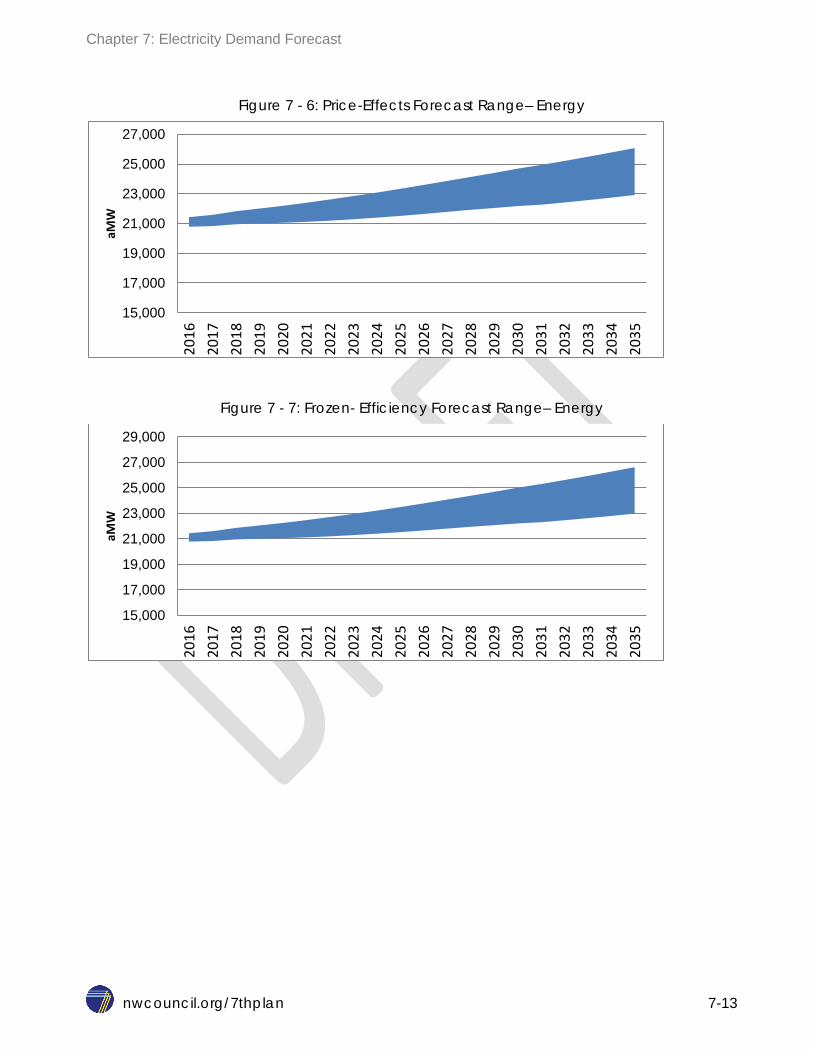
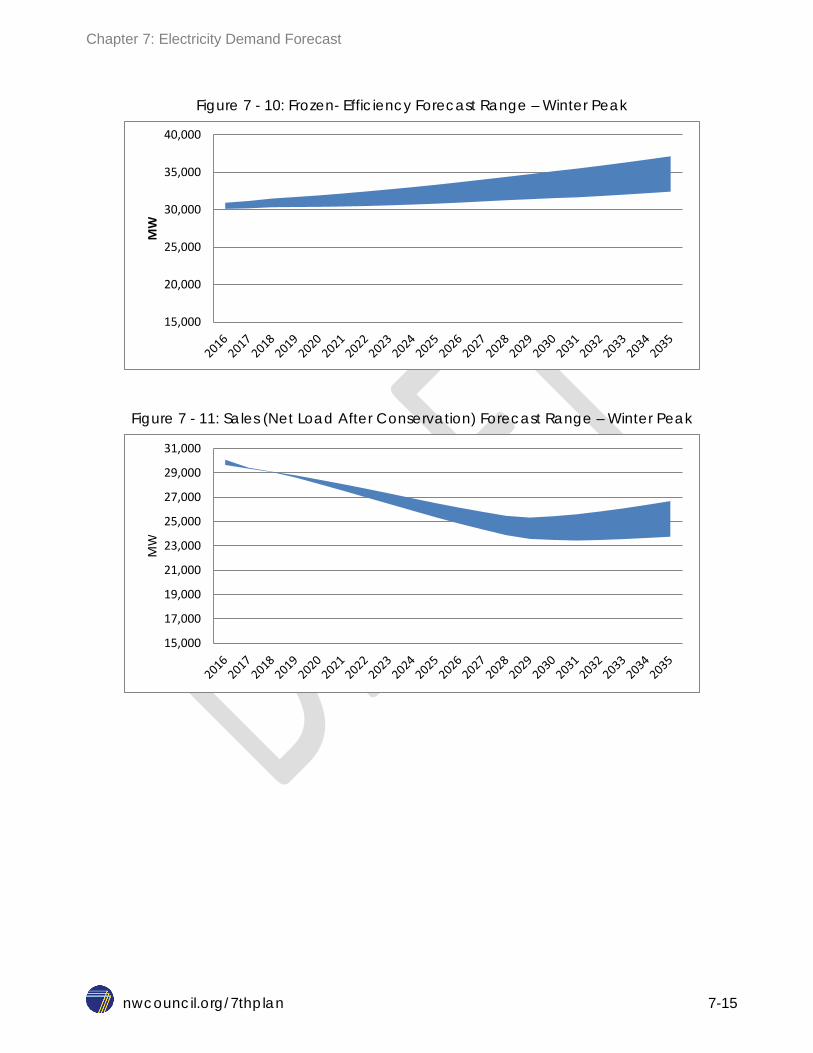
The difference between the Price-Effect and Frozen-Efficiency forecasts is relatively small. The Frozen-Efficiency forecast is typically slightly higher than the Price-Effect forecast. For the Seventh Power Plan the two forecasts differ by 60 to 600 average megawatts by 2035 depending on the underlying economic growth scenario. The following table and graphs present a comparison of these forecasts.
Table 7 - 4: Range of Alternative Load Forecasts (as measured at the point of generation)
Forecast Scenario 2016 2021 2026 2031 2035
AAGR 2016-2035
Energy (aMW) Price-effect Low 20,783
21,115
21,640
22,264
22,916 0.5%
Energy (aMW) Price-effect High 21,427
22,395
23,592
24,933
26,073 1.0%
Energy (aMW) FE Low 20,781
21,117
21,654
22,301
22,976 0.5%
Energy (aMW) FE High 21,436
22,466
23,776
25,292
26,620 1.1%
Energy (aMW) Sales Low 20,611
19,720
18,603
18,184
18,632 -0.5%
Energy (aMW) Sales High 21,257
21,006
20,554
20,869
21,909 0.2%
Winter Peak (MW) Price-effect Low 30,122
30,425
30,917
31,574
32,288 0.4%
Winter Peak (MW) Price-effect High 30,920
32,051
33,381
34,915
36,278 0.8%
Winter Peak (MW) FE Low 30,119
30,435
30,953
31,656
32,417 0.4%
Winter Peak (MW) FE High 30,935
32,168
33,680
35,492
37,143 1.0%
Winter Peak (MW) Sales Low 29,651
27,552
24,827
23,441
23,755 -1.2%
Winter Peak (MW) Sales High 30,083
28,083
26,139
25,596
26,682 -0.6%
Summer Peak (MW) Price-effect Low 27,168
27,720
28,614
29,745
30,929 0.7%
Summer Peak (MW) Price-effect High 28,048
29,280
30,818
32,622
34,240 1.1%
Summer Peak (MW) FE Low 27,161
27,713
28,623
29,781
30,988 0.7%
Summer Peak (MW) FE High 28,065
29,415
31,172
33,311
35,284 1.2%
Summer Peak (MW) Sales Low 26,818
25,893
24,825
24,708
25,642 -0.2%
Summer Peak (MW) Sales High 27,383
26,504
26,154
26,857
28,485 0.2%
Chapter 7: Electricity Demand Forecast
nwcouncil.org/7thplan 7-13
Figure 7 - 6: Price-Effects Forecast Range– Energy
Figure 7 - 7: Frozen- Efficiency Forecast Range– Energy
15,000
17,000
19,000
21,000
23,000
25,000
27,000
2016
20
17
2018
20
19
2020
20
21
2022
20
23
2024
20
25
2026
20
27
2028
20
29
2030
20
31
2032
20
33
2034
20
35
aMW
15,000
17,000
19,000
21,000
23,000
25,000
27,000
29,000
2016
20
17
2018
20
19
2020
20
21
2022
20
23
2024
20
25
2026
20
27
2028
20
29
2030
20
31
2032
20
33
2034
20
35
aMW
Chapter 7: Electricity Demand Forecast
nwcouncil.org/7thplan 7-14
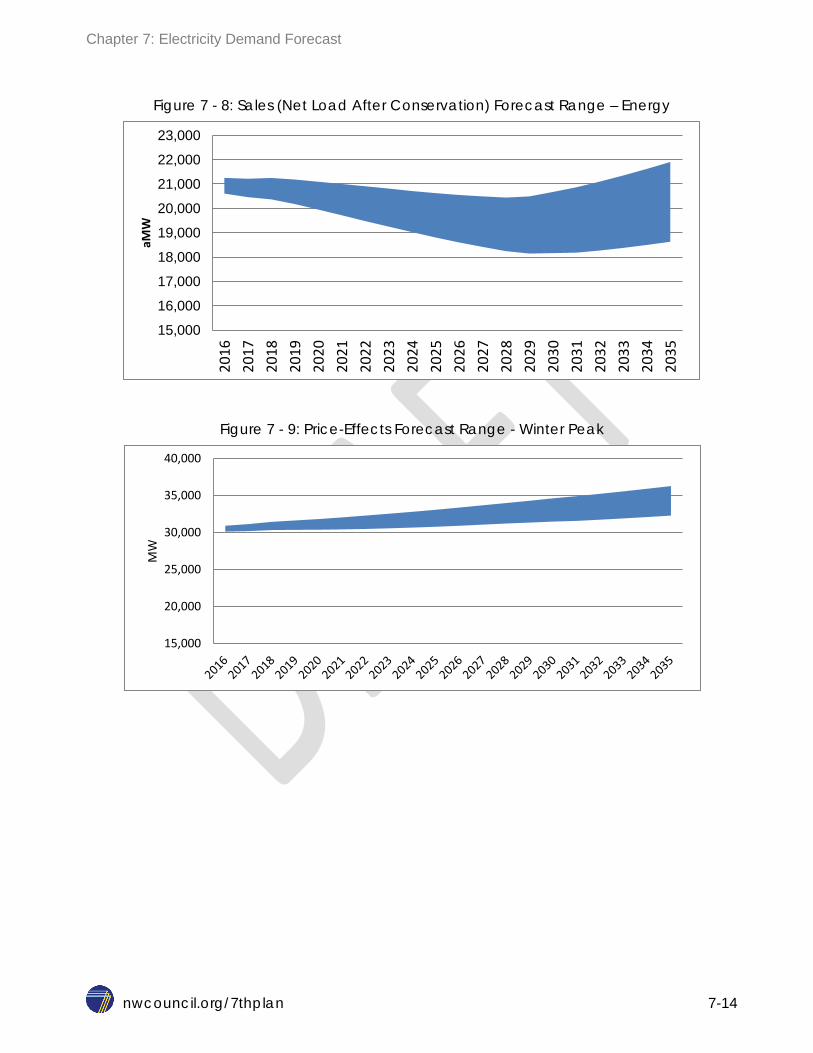
Figure 7 - 8: Sales (Net Load After Conservation) Forecast Range – Energy
Figure 7 - 9: Price-Effects Forecast Range - Winter Peak
15,000
16,000
17,000
18,000
19,000
20,000
21,000
22,000
23,000
2016
20
17
2018
20
19
2020
20
21
2022
20
23
2024
20
25
2026
20
27
2028
20
29
2030
20
31
2032
20
33
2034
20
35
aMW
15,000
20,000
25,000
30,000
35,000
40,000
MW
Chapter 7: Electricity Demand Forecast
nwcouncil.org/7thplan 7-15
Figure 7 - 10: Frozen- Efficiency Forecast Range – Winter Peak
Figure 7 - 11: Sales (Net Load After Conservation) Forecast Range – Winter Peak
15,000
20,000
25,000
30,000
35,000
40,000 M
W
15,000
17,000
19,000
21,000
23,000
25,000
27,000
29,000
31,000
MW
Chapter 7: Electricity Demand Forecast
nwcouncil.org/7thplan 7-16
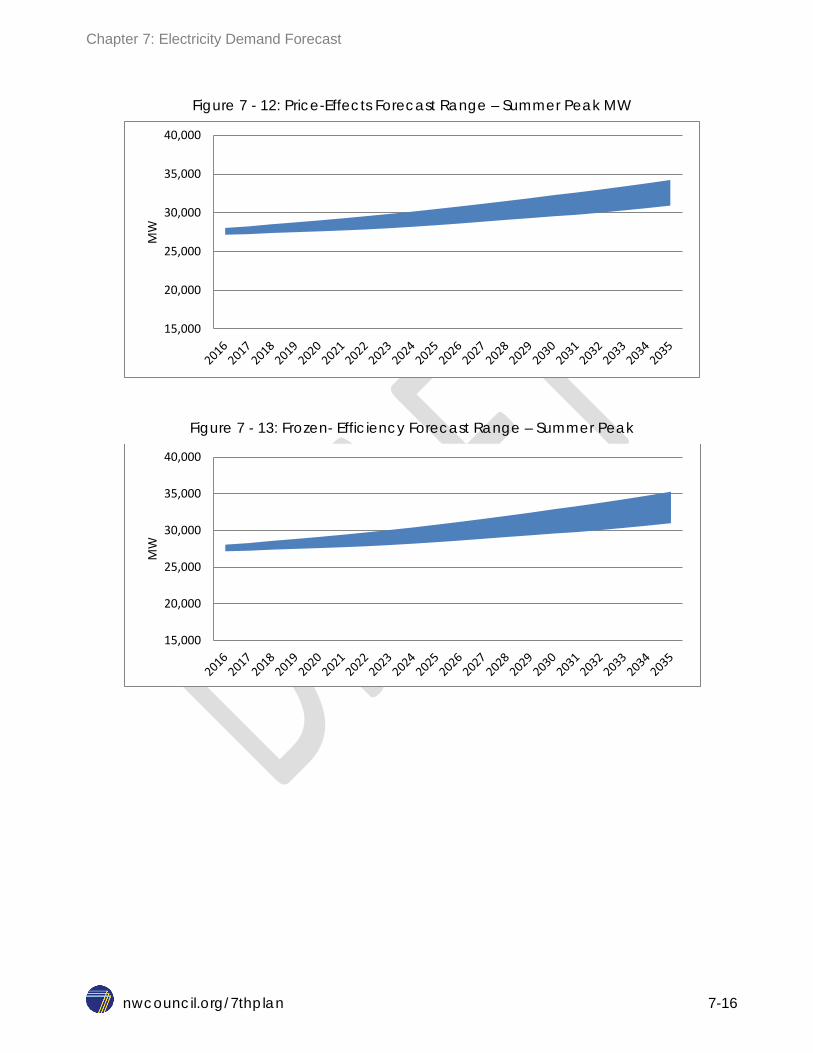
Figure 7 - 12: Price-Effects Forecast Range – Summer Peak MW
Figure 7 - 13: Frozen- Efficiency Forecast Range – Summer Peak
15,000
20,000
25,000
30,000
35,000
40,000 M
W
15,000
20,000
25,000
30,000
35,000
40,000
MW
Chapter 7: Electricity Demand Forecast
nwcouncil.org/7thplan 7-17
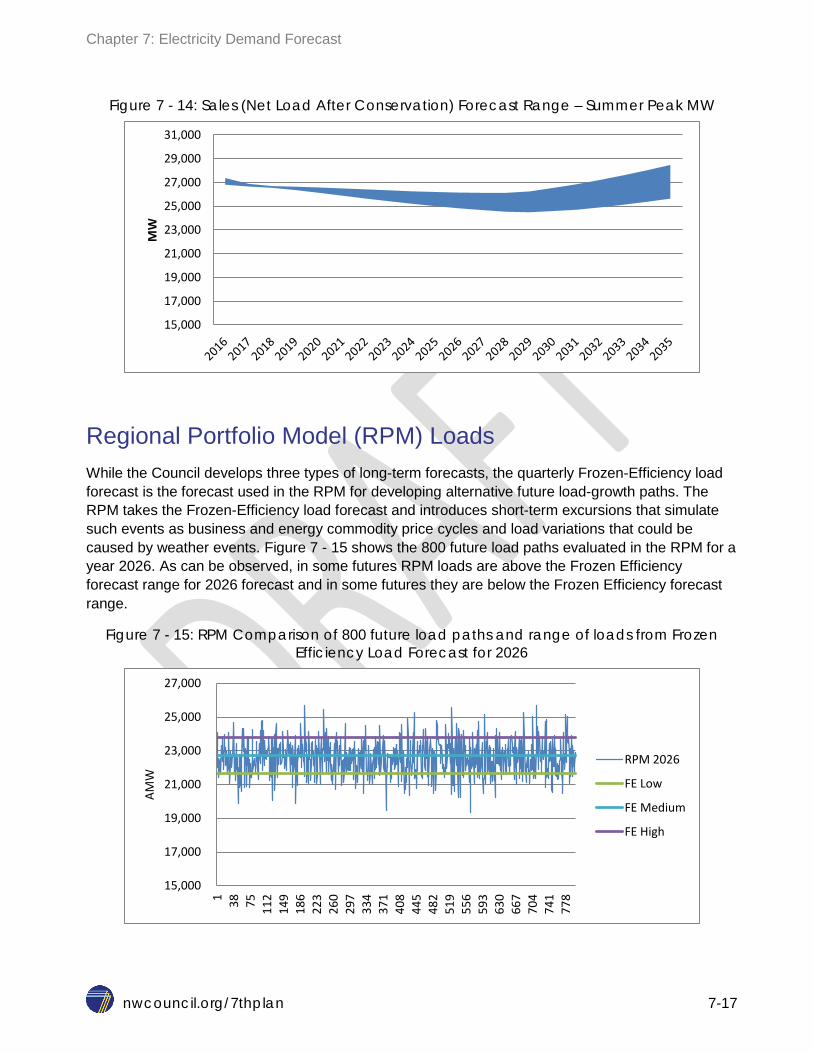
Figure 7 - 14: Sales (Net Load After Conservation) Forecast Range – Summer Peak MW
Regional Portfolio Model (RPM) Loads While the Council develops three types of long-term forecasts, the quarterly Frozen-Efficiency load forecast is the forecast used in the RPM for developing alternative future load-growth paths. The RPM takes the Frozen-Efficiency load forecast and introduces short-term excursions that simulate such events as business and energy commodity price cycles and load variations that could be caused by weather events. Figure 7 - 15 shows the 800 future load paths evaluated in the RPM for a year 2026. As can be observed, in some futures RPM loads are above the Frozen Efficiency forecast range for 2026 forecast and in some futures they are below the Frozen Efficiency forecast range.
Figure 7 - 15: RPM Comparison of 800 future load paths and range of loads from Frozen Efficiency Load Forecast for 2026
15,000
17,000
19,000
21,000
23,000
25,000
27,000
29,000
31,000 M
W
15,000
17,000
19,000
21,000
23,000
25,000
27,000
1 38
75
112
149
186
223
260
297
334
371
408
445
482
519
556
593
630
667
704
741
778
AMW
RPM 2026
FE Low
FE Medium
FE High
Chapter 7: Electricity Demand Forecast
nwcouncil.org/7thplan 7-18
A more refined method for estimating the single hour peak values was created to provide the RPM with expected hourly peak for each quarter. This methodology consisted of using the average quarterly weather normalized energy from the long-term model and the hourly temperature sensitive load multiplier from the Council’s short-term model and running a Monte Carlo simulation on the loads under the weather conditions of the past 86 year (1929-2013) to create an expected hourly load for each quarter. The process used to convert the Frozen Efficiency forecast to the specific 800 futures used in the RPM is discussed in more detail in Chapter 15 and in Appendix L.
Direct Use of Natural Gas As part of developing the 7th Power Plan, the Council evaluated whether or not a direct intervention in the markets where natural gas is thermodynamically or economically more efficient, would be necessary. In Appendix N of this plan, the Council presents findings on the economics of direct use of natural gas to displace electrical residential space and/or water heating. The Council performed an updated analysis (discussed in Appendix N) that focused on one of the eight market segments identified in the Council’s 2012 assessment as providing both consumers and the region with economic benefits through conversion from electricity to natural gas.
The updated analysis estimates the share of single family homes with electric water heating and natural gas space heating that would find economic benefits by conversion to natural gas water heating when their existing water heater requires replacement. Two estimates were made. The first, which is comparable to the Council’s 2012 analysis, assumes that in all cases the most economical (i.e. lowest life cycle cost) water heating fuel type would be selected. The second case, assumes that consumers would not always select the lowest cost option due to other “non-economic” barriers to conversion. This case found that fewer, but still a significant share, of households would alter their existing water heating fuel. Moreover, based on historical fuel selection trends it appears that natural gas continues to gain space and water heating market share while electricity’s share of these end uses continues to decrease. The Council’s analysis concluded that market mechanisms are operating efficiently and that no market intervention is needed. Further details on the 7th Power Plan Direct Use of Natural Gas can be found in Appendix N.