Embed Size (px)
Citation preview

Chapter 2Chapter 2
Research Methods inResearch Methods in Organizational Psychology Organizational Psychology
SOP6669SOP6669
Dr. SteveDr. Steve

Methods:Methods: ExperimentExperiment / Quasi-Experiment / Quasi-Experiment Questionnaire/SurveyQuestionnaire/Survey Naturalistic ObservationNaturalistic Observation Case StudyCase Study Meta-AnalysisMeta-Analysis
Research MethodsResearch Methods

Research MethodsResearch MethodsExperimentExperiment
Study conducted in a contrived environmentStudy conducted in a contrived environment BenefitsBenefits::
Provides more safety Provides more safety Cause and effect relationshipsCause and effect relationships
• Manipulate I.V. (e.g., leadership sManipulate I.V. (e.g., leadership style)tyle)• MMeasure D.V. (e.g., task performance)easure D.V. (e.g., task performance)• Control extraneous variables (e.g., experience)Control extraneous variables (e.g., experience)
DisadvantagesDisadvantages:: Time consumingTime consuming
Quasi-Experiment – not rQuasi-Experiment – not randomized or unable to andomized or unable to manipulate IV (e.g., gender)manipulate IV (e.g., gender)

Self-report to obtain data on attitudes/behaviors Self-report to obtain data on attitudes/behaviors conducted by phone, mail, interviews, electronicallyconducted by phone, mail, interviews, electronically
BenefitsBenefits:: Can collect a large quantity of dataCan collect a large quantity of data
DisadvantagesDisadvantages:: Accuracy of reportingAccuracy of reporting Representativeness of sampleRepresentativeness of sample Return rateReturn rate
Research MethodsResearch MethodsQuestionnaire/SurveyQuestionnaire/Survey

Observe overt behaviors over timeObserve overt behaviors over time Systematic sampling at various timesSystematic sampling at various times Representative sampleRepresentative sample
BenefitsBenefits:: Use to generate hypothesesUse to generate hypotheses
DisadvantagesDisadvantages:: Experimenter biasExperimenter bias ObtrusivenessObtrusiveness Frequency of behavior occurringFrequency of behavior occurring
Research MethodsResearch MethodsNaturalistic ObservationNaturalistic Observation
In depth view of past events using interviews and In depth view of past events using interviews and archival records archival records
BenefitsBenefits:: Detailed account of why particular event occurredDetailed account of why particular event occurred
Disadvantages:Disadvantages: Little generalizabilityLittle generalizability
Research MethodsResearch MethodsCase StudyCase Study

Meta-analysisMeta-analysis – statistical procedure that – statistical procedure that combines the results of many independent combines the results of many independent research findings on a single topicresearch findings on a single topic
Used to estimate true relationshipUsed to estimate true relationship Measures effect size of findingsMeasures effect size of findings Uses archival dataUses archival data
Data AnalysisData AnalysisMeta-analysisMeta-analysis

Descriptive vs. Inferential StatisticsDescriptive vs. Inferential Statistics Descriptive stats merely describe dataDescriptive stats merely describe data
FrequencyFrequency Central tendencyCentral tendency VariabilityVariability
Inferential stats used to test hypothesesInferential stats used to test hypotheses T-TestT-Test Analysis of varianceAnalysis of variance CorrelationCorrelation RegressionRegression Non-parametricsNon-parametrics
Research StepsResearch StepsStatistical AnalysisStatistical Analysis

Data AnalysisData AnalysisCentral TendencyCentral Tendency
1. Mean – average: X = ∑X / NMean = 72 / 8 = 9
2. Median – middle score (when placed in order)- use when outliers exaggerate the meanMedian = 8.5
3. Mode – most often occurring scoreMode = 6
_example scores = 5, 6, 6, 8, 9, 10, 11, 17
* In a normal distribution, Mean = Median = Mode

RangeRange - distance between highest and lowest - distance between highest and lowest score score (Range = High score – Low score)(Range = High score – Low score) Range = 17 – 5 = 12Range = 17 – 5 = 12
Standard DeviationStandard Deviation – average distance from the – average distance from the meanmean S= S= Σ(x – x)Σ(x – x)22 / / n – 1n – 1
Data AnalysisData AnalysisVariabilityVariability
S = (5-9) 2 + (6-9) 2 + (6-9) 2 + (8-9) 2 + (9-9) 2 + (10-9) 2 + (11-9) 2 + (17-9) 2 / 7S = 3.85

02468
101214161820
Fre
quen
cy65-74
75-84
85-94
95-104
105-114
115-124
125-134
135-144
145-154
155-164
IQ Scores
0
5
10
15
20
25
30
Fre
quen
cy
250-259
260-269
270-279
280-289
290-299
300-309
310-319
320-329
330-339
340-349
Weight (lbs) of NFL Lineman
02468
101214161820
Fre
quen
cy
65-66
67-68
69-70
71-72
73-74
75-76
77-78
79-80
81-82
82-83
84-85
Professional Golf Scores
Positively Skewed Distribution Negatively Skewed Distribution
Normal orBell-shapedDistribution
Data AnalysisSkewed Frequency Distributions

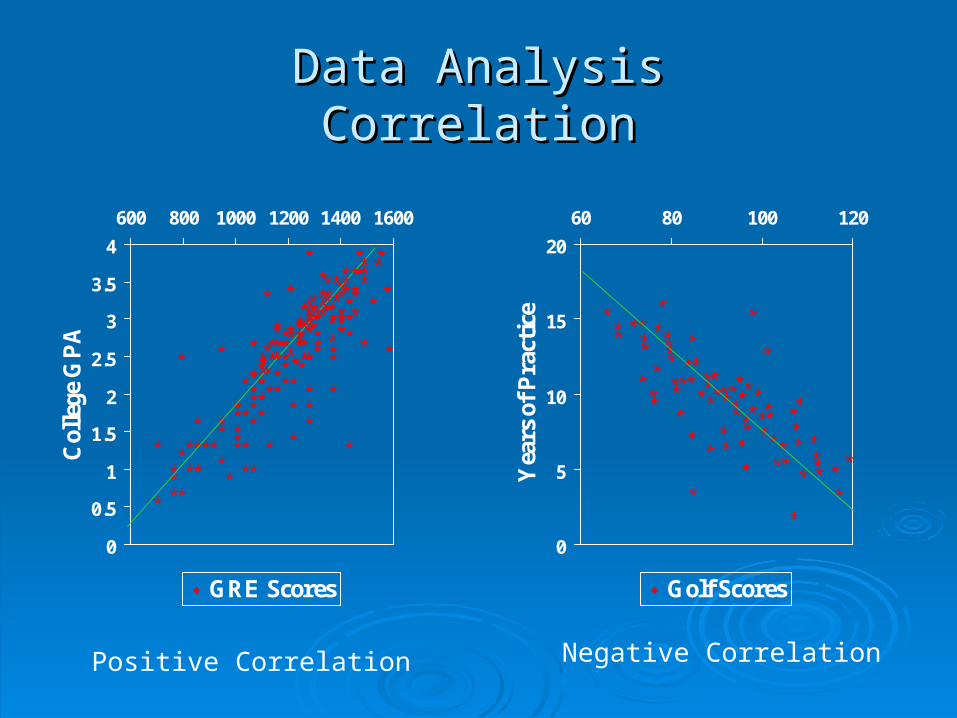
Correlation ( r )Correlation ( r ) – Degree of relationship – Degree of relationship between two variablesbetween two variables Used for predictionUsed for prediction Cannot be used to infer causationCannot be used to infer causation Range from –1 to +1Range from –1 to +1 Negative r – as one variable increases the other Negative r – as one variable increases the other
decreasesdecreases Positive r – as one variable increases so does the Positive r – as one variable increases so does the
otherother Zero r – no relationship between the two variablesZero r – no relationship between the two variables
Data AnalysisData AnalysisCorrelationCorrelation
rr AA BB CC
AA 1.01.0
BB .40.40 1.01.0
CC .20.20 .09.09 1.01.0
Data AnalysisData AnalysisCorrelationCorrelation
Positive Correlation Negative Correlation
0
5
10
15
20
60 80 100 120
Yea
rs o
f P
ract
ice
Golf Scores
**
*
*
**
***
**
* *
**
*
*
**
***
**
***
*
*
**
***
**
**
*
*
**
***
**
*
**
*
*
**
***
**
*
**
*
*
**
***
**
*
*
*
**
*
0
0.5
1
1.5
2
2.5
3
3.5
4
600 800 1000 1200 1400 1600
Col
lege
GP
A
GRE Scores
**
* *
*
***
** *
**
*
*
* *
*
***
** *
**
*
* *
*
***
** *
**
* *
*
***
** *
**
*
* *
*
***
** *
**
*
* *
*
***
** *
**
*
*
***
*
**
**
**
*****
*
*
**
**
**
*****
***
**
**
*****
**
**
**
*****
*
**
**
**
*****
*
**
**
**
*****
*
*
***
*
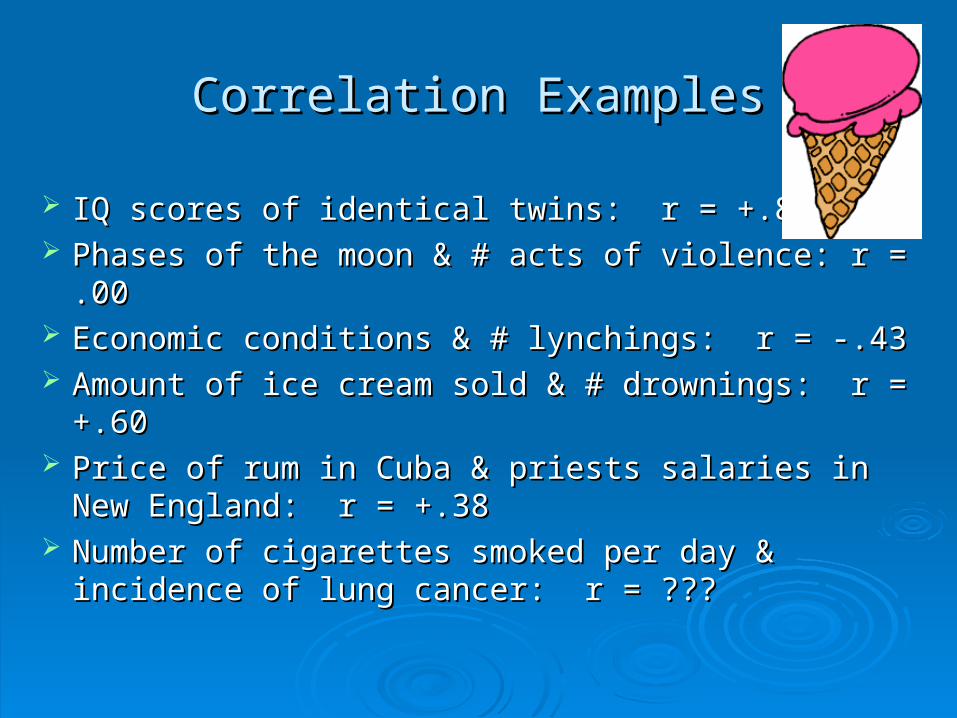
IQ scores of identical twins: r = +.86IQ scores of identical twins: r = +.86 Phases of the moon & # acts of violence: r = .00Phases of the moon & # acts of violence: r = .00 Economic conditions & # lynchings: r = -.43Economic conditions & # lynchings: r = -.43 Amount of ice cream sold & # drownings: r = +.60Amount of ice cream sold & # drownings: r = +.60 Price of rum in Cuba & priests salaries in New Price of rum in Cuba & priests salaries in New
England: r = +.38England: r = +.38 Number of cigarettes smoked per day & incidence Number of cigarettes smoked per day & incidence
of lung cancer: r = ???of lung cancer: r = ???
Correlation ExamplesCorrelation Examples
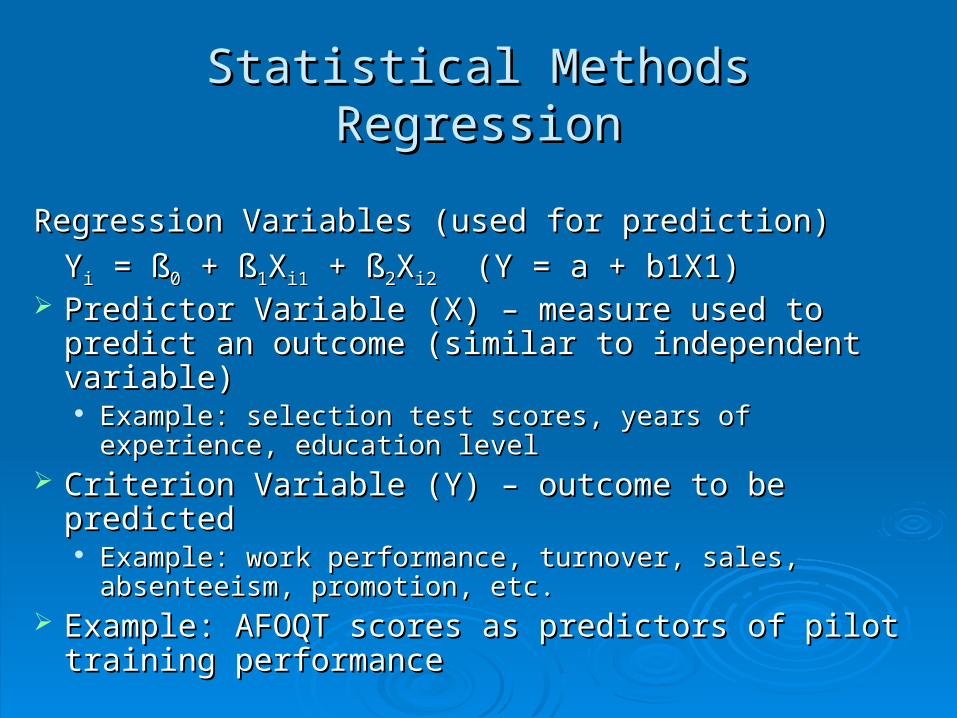
Regression Variables (used for prediction)Regression Variables (used for prediction)
YYii = = ßß00 + + ßß11XXi1i1 + + ßß22XXi2i2 (Y = a + b1X1) (Y = a + b1X1) Predictor Variable (X) – measure used to predict Predictor Variable (X) – measure used to predict
an outcome (similar to independent variable)an outcome (similar to independent variable) Example: selection test scores, years of experience, Example: selection test scores, years of experience,
education leveleducation level Criterion Variable (Y) – outcome to be predictedCriterion Variable (Y) – outcome to be predicted
Example: work performance, turnover, sales, Example: work performance, turnover, sales, absenteeism, promotion, etc.absenteeism, promotion, etc.
Example: Example: AFOQT scores as predictors of pilot AFOQT scores as predictors of pilot training performancetraining performance
Statistical MethodsStatistical MethodsRegressionRegression

Statistical Pitfalls:Statistical Pitfalls:BiasBias
Representative SamplingRepresentative Sampling Selecting a sample that parallels the populationSelecting a sample that parallels the population Might use covariates to account for differencesMight use covariates to account for differences
Statistical AssumptionsStatistical Assumptions ANOVA assumes a normal distribution and ANOVA assumes a normal distribution and
independenceindependence• LLack of normality is only minor problem, but may ack of normality is only minor problem, but may
want to identify distribution shape and whywant to identify distribution shape and why• Observations may not be independent, may need to Observations may not be independent, may need to
aggregate (e.g., class instead of student)aggregate (e.g., class instead of student)

Statistical Pitfalls:Statistical Pitfalls:Errors in MethodologyErrors in Methodology
Statistical Power – probabStatistical Power – probability of detecting a true ility of detecting a true difference of a particular sizedifference of a particular size Type I error – falsely reject null hypothesis when a true Type I error – falsely reject null hypothesis when a true
difference does not exidifference does not existst Type II error – fail to reject null hypothesis when a true Type II error – fail to reject null hypothesis when a true
difference does existdifference does exist Power affected byPower affected by
• Sample sizeSample size• Effect size (e.g., Cohen’s D)Effect size (e.g., Cohen’s D)• Type I error rate selected (alpha)Type I error rate selected (alpha)• Variability of sample Variability of sample
(F ratio = var between group / var within group)(F ratio = var between group / var within group)

Statistical Pitfalls:Statistical Pitfalls:Errors in MethodologyErrors in Methodology
Multiple Comparisons – if you compare enough Multiple Comparisons – if you compare enough variables, will find a relationship by chance alonevariables, will find a relationship by chance alone Bonferroni correction – family-wise adjustment Bonferroni correction – family-wise adjustment
(alpha = .05 / #comparisons)(alpha = .05 / #comparisons) ReplicateReplicate Cross-validate (holdout sample)Cross-validate (holdout sample)
Measurement Errors Measurement Errors ReliabilityReliability: Consistency of Measure: Consistency of Measure ValidityValidity: Measures what it was designed to measure: Measures what it was designed to measure

Statistical Pitfalls:Statistical Pitfalls:Problems with InterpretationProblems with Interpretation
Confusion over significanceConfusion over significance P value does not reflect effect size – could P value does not reflect effect size – could
have a small effect, but a lot of powerhave a small effect, but a lot of power Precision vs. AccuracyPrecision vs. Accuracy
More decimals not necessarily more accurateMore decimals not necessarily more accurate CausalityCausality
Correlations are not causal, but ANOVA may Correlations are not causal, but ANOVA may not be eithernot be either

Statistical Pitfalls:Statistical Pitfalls:Problems with InterpretationProblems with Interpretation
GraphsGraphs May not provide accurate portrayal of dataMay not provide accurate portrayal of data
81
81.5
82
82.5
83
83.5
84
Group A Group B
Score
0
20
40
60
80
100
Group A Group B
Score

Always think critically about the research you readAlways think critically about the research you read Who were the participants in the study?Who were the participants in the study? How strong of a relationship was found?How strong of a relationship was found? Was it causal or correlational?Was it causal or correlational? Was it a field study or laboratory study?Was it a field study or laboratory study? How was data collected and analyzed?How was data collected and analyzed? Do you agree with the conclusions based on the Do you agree with the conclusions based on the
analyses provided?analyses provided?
ResearchResearchCritical ThinkingCritical Thinking
Ethical Principles of ResearchEthical Principles of Research
Privacy:Privacy: Participants have the right to limit the amount of information they Participants have the right to limit the amount of information they
reveal about themselves. If they decide to withdraw from the reveal about themselves. If they decide to withdraw from the experiment at any time, they have the right to do soexperiment at any time, they have the right to do so
Confidentiality:Confidentiality: Participants have the right to decide to whom they reveal Participants have the right to decide to whom they reveal
confidential information. By ensuring confidentiality, researchers confidential information. By ensuring confidentiality, researchers may be able to obtain more honest responsesmay be able to obtain more honest responses
Protection from Deception:Protection from Deception: Deception can only be used if the value of the research must Deception can only be used if the value of the research must
outweigh the harm imposed on participants and the outweigh the harm imposed on participants and the phenomenon cannot be measured any other wayphenomenon cannot be measured any other way