Embed Size (px)
Citation preview
California Energy Commission
STAFF REPORT
Big Data and Distribution Resource Planning Market Study September 2021 | CEC-200-2021-007
California Energy Commission
Tom Flynn Erik Lyon Hilary Poore Primary Authors
Hilary Poore Project Manager
Amanda Poletti Office Manager DATA INTEGRATION AND POLICY OFFICE
Aleecia Gutierrez Deputy Director ENERGY ASSESSMENTS DIVISION Drew Bohan Executive Director
DISCLAIMER
Staff members of the California Energy Commission (CEC) prepared this report. As such, it does not necessarily represent the views of the CEC, its employees, or the State of California. The CEC, the State of California, its employees, contractors, and subcontractors make no warrant, express or implied, and assume no legal liability for the information in this report; nor does any party represent that the uses of this information will not infringe upon privately owned rights. This report has not been approved or disapproved by the CEC nor has the Commission passed upon the accuracy or adequacy of the information in this report.

i
ABSTRACT This report presents the datasets and analytical tools that can be used to support cost-effective distributed energy resource (DER) planning, necessary for California to meet its clean energy goals. The study consisted of two key research tasks: a market assessment of firms able to analyze large volumes of data, and an evaluation of datasets relevant to DER analysis. The report presents findings related to 1) data, analytics, and information access; 2) economics and value, which focuses on how DERs are compensated for the related services; and 3) emerging trends, which include findings related to the impact of transportation electrification on the future grid needs and planning.
Keywords: Big data, analytics, distributed energy resources, DER, distribution resource planning, electrification, differential privacy, reliability, resiliency, advanced metering infrastructure, AMI, electric vehicle, transportation electrification
Please use the following citation for this report:
Lyon, Erik, Tom Flynn, and Hilary Poore. 2021. Big Data and Distribution Resource Planning Market Study. California Energy Commission. Publication Number: CEC-200-2021-007.

ii
iii
TABLE OF CONTENTS Page
Abstract ............................................................................................................................ i
Table of Contents ............................................................................................................. iii
List of Tables ................................................................................................................... iv
Executive Summary .......................................................................................................... 1
CHAPTER 1: Introduction .................................................................................................. 3
Distribution Investment Deferral Framework Background .................................................. 5
CHAPTER 2: Big Data Analytical Firm Market Assessment ..................................................... 8
Market Assessment Research Questions ........................................................................... 8
Firms Offering DER Siting Optimization Services ............................................................... 8
Kevala Analytics......................................................................................................................................................... 9
Integral Analytics ....................................................................................................................................................... 9
GridLab-D ................................................................................................................................................................. 9
Recurve .................................................................................................................................................................... 9
Vistar Energy ........................................................................................................................................................... 10
Firm Capabilities Comparison ........................................................................................ 10
Detailed Market Assessment Results .............................................................................. 11
Data, Analytics, and Information .............................................................................................................................. 11
Small Customer-Sited DERs Are a Largely Untapped Distribution Resource .................................................................. 12
Consumer Privacy and Market Appraisal Are Not Mutually Exclusive ............................................................................ 13
Customer Energy and Cost-Savings Potential Is Invisible to DER Providers .................................................................. 14
Coordination Remains a Barrier to Multitechnology DER Packages .............................................................................. 15
Transparent Accounting Methods Are Critical for DER Measurement and Verification .................................................... 16
Economics and Value ............................................................................................................................................... 17
Deferral Value Alone Is Insufficient to Drive Optimal DER Deployment ........................................................................ 17
Time- and Location-Dependent Energy Value Is Foundational to the Value Stack ......................................................... 18
Forecast Certainty Metric Limits Deferral Opportunities .............................................................................................. 19
Emerging Trends ..................................................................................................................................................... 21
Unmanaged Transportation Electrification Could Disrupt Grid Planning and Operations ................................................ 21
Electrification Load Growth May Preclude Some Distribution Deferral Opportunities ..................................................... 22
iv
CHAPTER 3: Datasets Relevant to DER Planning and Siting Optimization ............................. 24
Identification of Datasets .............................................................................................. 24
Key Dataset Findings .................................................................................................... 26
Advanced Metering Infrastructure Data Identified as Highest Priority Data Source ....................................................... 26
Data Included in the DIDF Focuses Exclusively on Distribution Deferral Value ............................................................. 26
Significant EV Data Are Required to Inform Distribution Load Forecasting ................................................................... 26
Data Catalog ............................................................................................................... 26
CHAPTER 4: Conclusions and Recommendations ............................................................... 27
Big Data Analytical Firm Market Assessment ................................................................... 27
Datasets Relevant to DER Planning ................................................................................ 29
APPENDIX A: Acronyms, Abbreviations, and Glossary ....................................................... A-1
APPENDIX B: Market Assessment Interview Guide ............................................................ B-1
LIST OF TABLES Page
Table 1: Firm Capabilities and Characteristics .................................................................... 10
Table 2: Datasets Identified as Relevant for DER Planning and Siting Optimization .............. 25
1
EXECUTIVE SUMMARY The California Energy Commission (CEC) is studying how distributed energy resources (DERs) are being used and how the performance of these resources contributes to meeting California’s clean energy goals while maintaining reliability and fair, reasonable costs for electricity.
DERs — such as solar, batteries, electric vehicles with managed charging, and energy efficiency — are being used by Californians at a growing pace to reduce energy costs. The increased use of DERs provides broad benefits to the grid, including a reduced need for fossil fuel based generation and traditional transmission and distribution infrastructure upgrades, such as power lines and substations.
The widespread use of DERs may also result in challenges for grid planners and operators, such as the uncertainty in how DERs will perform, or when and how they will be used by customers. Furthermore, DERs can pose an equity issue when they are adopted predominately by wealthier customers who then pay less for maintaining the existing infrastructure, leaving an additional cost burden on customers that cannot afford DERs.
DER policy analysis requires a detailed understanding of DER performance, including how diverse weather patterns, customer types, DER types, and DER behaviors affect performance. Analysis of this type requires access to “big data” — that is, extensive and granular datasets such as data collected through smart meters that track energy consumption multiple times per hour, and sophisticated models that use the data to identify trends, predict future outcomes, and aid in resource planning.
As part of an ongoing CEC effort to analyze these datasets to inform policy, a CEC research team performed a study on how the datasets can be used to inform the California Public Utilities Commission’s Distribution Investment and Deferral Framework. This framework seeks to maximize ratepayer savings by identifying and deploying cost-effective DERs instead of investing in additional distribution wires and related infrastructure.
This report presents the datasets and analytical tools that can be used to support cost-effective DER planning, necessary for California to meet its clean energy goals. The study consisted of two key research tasks: a market assessment of firms able to analyze the volumes of data, and an evaluation of datasets relevant to DER analysis.
The market assessment revealed three categories of findings:
• Data, Analytics, and Information: Access to data remains a barrier to increasing the number of third-party and customer-sited DERs, particularly smaller, behind-the-meter resources that provide beneficial services to the grid. Advanced metering infrastructure data are instrumental to understanding the potential benefits of increasing DERs in the market. While accessing these datasets raises privacy concerns, algorithms that add artificial “noise” to data, known as differential privacy, hold significant potential to address these concerns.
• Economics and Value: While big data are the focus of this report, representatives from the interviewed firms emphasized barriers and opportunities related to the
2
compensation for the services DERs provide to energy markets. Policies enabling “value stacking,” or the ability for DERs to tap multiple revenue streams for multiple services, such as compensating DERs for both energy value and distribution investment deferral value, could provide significant support in this area.
• Emerging Trends: The role of electricity is expected to grow as California decarbonizes its economy. In particular, the growth of electric vehicles and associated electricity demand may challenge historical approaches to distribution grid management and planning if not managed. Data regarding electric vehicle adoption, charging, and travel behaviors is necessary to plan distribution infrastructure investments appropriately.
The CEC intends to use the lessons learned in this report to further analyze DER performance. The CEC is collecting advanced metering infrastructure data and will use these data, as well as DER adoption data (for example, customer-sited solar and storage), to evaluate the performance of DERs over the last three years, corresponding to the period of the CEC’s data collection. After understanding how DERs are performing, the CEC will conduct modeling to understand how greater DER deployment can be achieved in a way that benefits customers equitably and provides reliability for the grid.
3
CHAPTER 1: Introduction
Customer bill savings and resilience to power outages have been driving forces for electricity customers adopting distributed energy resources (DERs). Lowering energy use by making efficiency upgrades (for example, more energy-efficient appliances) and installing rooftop solar has expanded because of technology improvements and decreased costs. Moreover, customers are seeing value in installing energy storage to make the most of their solar generation and provide power when there are grid outages, such as public safety power shutoffs.
Customer solar has grown substantially in recent years. While there was slow growth in the early days of the industry, the greatest increase has been since 2016, with California adding 1,300–1,400 MW of behind-the-meter (BTM) solar photovoltaic (PV) annually. By the end of 2020, there was 11,000 MW of installed BTM capacity in California. The CEC estimates that more than 18,000 GWh of electricity was produced by BTM PV systems in 2020. Projections in the 2020 Integrated Energy Policy Report Update (IEPR Update) for the Mid Electricity Demand case is for over 23,000 MW of BTM PV by 2030. BTM energy storage is also picking up in the state, and expectations are for substantial growth. The 2020 IEPR Mid Electricity Demand case projects growth from an installed BTM storage capacity of 550 MW in 2020 to 2,500 MW by 2030.
The growth in DER deployment has resulted in tangible benefits for customers; however, the impacts on the overall grid are not as well understood. For example, many DERs are individually managed resources and there is little information available to predict how owners will use the resources to manage their load. The lack of information makes it more difficult to manage the grid for reliability, as it is harder to match other generation resources with load to create a balanced system. This can be particularly challenging for grid operators during summer peaks, when an accurate accounting of resources is critical.
Demand response (DR) has been a critical resource for the state for more than twenty years. DR, the ability to curtail individual loads to help meet peak demand, remains difficult to accurately predict and confirm the resulting load reduction. This challenge becomes even more critical during periods of extremely high loads, such as the west-wide heat event that contributed to the August 2020 rolling blackouts. During this event, and the subsequent heat wave in September 2020, it was not possible to confirm whether the DR resources were performing as expected or were falling short of expectations. In the Root Cause Analysis prepared by the CEC, the California Public Utilities Commission (CPUC), and the California
Bailey, Stephanie, Nicholas Fugate, and Heidi Javanbakht. 2021. Final 2020 Integrated Energy Policy Report Update, Volume III: California Energy Demand Forecast Update. California Energy Commission. Publication Number: CEC-100-2020-001-V3-CMF.
4
Independent System Operator (CAISO) to address the rolling blackout, each energy institution committed to actions to improve DR as a resource for the state.
All forms of DER adoption have thus far been by more affluent customers in the state. As a result of reducing their loads, they pay less to maintain the existing grid infrastructure. This places a greater burden on less affluent customers who cannot afford to implement many DERs without incentives. As a result, infrastructure maintenance costs are pushed to customers who cannot implement DERs to reduce their load.
Optimized DER deployment could provide the benefit of deferring or eliminating certain infrastructure upgrades by taking load off circuits and reducing congestion. The CPUC has an ongoing proceeding to coordinate distribution planning and DER deployment to better plan for infrastructure upgrades. This effort is conducted in support of the distribution investment deferral framework (DIDF), the goal of which is to maximize ratepayer savings by identifying and deploying cost-effective DERs.
The CEC and CPUC are coordinating efforts to better understand how DERs are performing on the grid and evaluating policy options that will enable DER to provide value to customers equitably and support grid reliability. CEC and CPUC recognize that a critical path in this process is to take advantage of the large volumes of data available through smart meters. A first step in this process is to evaluate how this data could be used to inform DER policy development.
Evaluating the data fits well within the CEC’s overall strategy for DER analytics. The CEC is in the process of expanding analytical capabilities to deepen the state’s understanding of DER performance and to be able to evaluate the benefits and challenges of expanding DER deployment. These analyses are critical for the state to ensure reliability of the grid with DER growth and to understand how DERs fit into the overall clean energy goals for the state. These analyses will inform transmission and distribution infrastructure planning, rate structures that support lower customer bills, and potential for greenhouse gas emissions reductions.
Critical to supporting these analyses is to have detailed customer data for DER performance. The CEC is in the process of collecting advanced metering infrastructure (AMI) data from PG&E, SCE, SDG&E, SMUD and LADWP. This unprecedented aggregation of data presents a unique opportunity to understand how customers are using DERs and how environmental conditions, such as weather or wildfire smoke, affect performance when combined with individual customer deployment information. Properly utilized, this data could help the state understand how to optimize grid infrastructure to meet reliability and other customer benefits.
This report, and the research study it is based on, is centered on the data and analytical tools that can defer the need for traditional “wires” upgrades on the electric distribution system to achieve ratepayer savings and support other policy goals. The primary objectives of this research were to identify datasets, analytical tools, and organizations that can support optimal
California Independent System Operator, California Public Utilities Commission, and California Energy Commission. 2021. Final Root Cause Analysis: Mid-August 2020 Extreme Heat Wave.
5
deployment of DERs in the context of electric distribution grid deferral. The study consisted of two key research tasks:
1. Market assessment of big data analytical firm capabilities: To accomplish this task, the CEC research team identified and interviewed organizations or firms that employ big data analytics that can be used to identify and mobilize additional DER deployment opportunities. While the initial intent of this research was to identify private sector firms offering these services, the CEC research team also interviewed non-profit and governmental entities offering comparable services. The findings resulting from these interviews are discussed in Chapter 2.
2. Identification and evaluation of datasets relevant for DER analysis: The CEC research team identified as many datasets as possible that may be relevant or helpful to DER planning and siting optimization. These datasets go beyond those already used by the investor-owned utilities (IOUs) in producing their Grid Needs Assessment (GNA) and Distribution Deferral Opportunity Report (DDOR) submissions. The results of this effort are covered in Chapter 3.
Finally, this study makes recommendations for improving DIDF outcomes regarding the identification and mobilization of DER opportunities for distribution deferral. These recommendations are summarized in Chapter 4.
Distribution Investment Deferral Framework Background In 2018, the CPUC issued a decision (D.18-02-004) in its distribution resources plan (DRP) proceeding (R.14-08-013), laying out a number of elements of the DIDF. The decision established the distribution planning advisory group consisting of the IOUs, CPUC staff, an independent professional engineer technical consultant, non-market participants, and DER market providers. The decision directed each of the IOUs to file a GNA and a DDOR each year to identify distribution grid deficiencies, planned traditional distribution investments, and opportunities for DER alternatives. The decision also directed the IOUs to develop a central DRP data access portal by which users can view circuit maps including GNA and DDOR data. The DIDF is a process to identify opportunities for third-party DERs to cost-effectively defer or avoid traditional IOU distribution infrastructure investments that are planned to mitigate forecasted deficiencies of the distribution system. According to the CPUC, “the DIDF represents California’s first permanent marketplace for third party-owned DERs to provide services to the IOUs’ distribution grids.”3 The main goal of the DIDF is to capture all potential deferral opportunities that carry a high likelihood of being cost-effective to maximize the ratepayer benefits of DERs. The GNA and DDOR are the major annual deliverables of the DIDF, due in August each year. The GNA is a report of all distribution grid deficiencies (needs) and wires solutions identified in the annual distribution planning process. The DDOR identifies the planned investments to
3 CPUC Decision 18-02-004
6
address the needs and the subset of those that may be deferrable by DERs. At the end of each year, the IOUs are to file an advice letter at the conclusion of the Distribution Planning Advisory Group (DPAG) process recommending the distribution deferral projects to go immediately out for solicitation. The GNA identifies four distribution deficiencies and associated services required to address them. These services include distribution capacity, voltage support, reliability, and resiliency services, defined as follows:
• Distribution capacity: Load-modifying or supply services that DERs provide via the dispatch of power output for generators or reduction in load that is capable of reliably and consistently reducing net loading on desired distribution infrastructure.
• Voltage support: Substation and/or feeder-level dynamic voltage management services provided by an individual resource and/or aggregated resources capable of dynamically correcting excursions outside voltage limits as well as supporting conservation voltage reduction strategies in coordination with utility voltage/reactive power control systems.
• Reliability (Back-tie): Load-modifying or supply services capable of providing a fast reconnection and availability of excess reserves to reduce demand when restoring customers during abnormal configurations.
• Resiliency: Providing microgrid services. The DDOR report includes all planned traditional “wires” distribution investments to address the deficiencies identified in the GNA, as well as a subset identified as potentially deferrable by DERs. The number of planned investments identified may be less than the number of grid needs identified because one planned investment may mitigate several distribution service needs. For example, PG&E’s 2019 GNA identified 215 substation, feeder, and line section planned investments to mitigate 6,994 grid needs (797 distribution grid capacity, 6,153 voltage support, 44 reliability, and no resiliency needs). To develop the shortlist of candidate deferral opportunities, two screens are applied to the planned investments list:
• Technical: Identify the distribution services that DERs can provide to potentially defer a planned investment.
• Timing: Ensure that cost-effective DER solutions can be procured with sufficient time to fully deploy and begin commercial operation in advance of the forecast need date.
Applying the screens to the 215 planned investments in PG&E’s 2019 GNA, for example, resulted in 18 candidate deferral opportunities. Three prioritization metrics are then applied to the shortlist of candidate deferral opportunities These metrics are intended to provide a relative indication of the following:
4 See D.16-12-036 in the Integrated Distributed Energy Resource (IDER) Proceeding.
7
• Cost-effectiveness: Likelihood that DERs can cost-effectively defer a planned investment.
• Forecast Certainty: Likelihood that the forecast grid need will materialize. • Market Assessment: Likelihood that DERs can be sourced that will successfully meet
the DER distribution service requirements. For example, after applying the prioritization metrics to the 18 candidate deferral opportunities in its 2019 DDOR, PG&E identified 88 MW of candidate deferral opportunities. Of these:
• 18.5 MW were Tier 1 (relatively likely to be deferrable). • 2.9 MW were Tier 2 (unlikely to be successfully deferred now). • 66.9 MW were Tier 3 (not likely a DER deferral solution can successfully be sourced).
To help provide context for this study and inform our findings, the CEC research team audited and participated in the CPUC’s 2020–21 DPAG, which is a part of the DIDF process.
8
CHAPTER 2: Big Data Analytical Firm Market Assessment
Chapter 2 summarizes the market assessment of firms providing big data analytical services for DER siting, deployment, and distribution grid deferral. The market assessment consisted of in-depth interviews with such firms, supplemented with publicly available firm information, to document the capabilities of the firms to support distribution investment deferral with DERs. This chapter includes the research questions for this effort, a summary of the firms interviewed, detailed findings, and associated recommendations.
Market Assessment Research Questions The market assessment explored a number of specific questions and allowed flexibility for interviewees to guide the conversation to areas they found important. (See Appendix B for the complete interview guide.) The specific research topics and questions included:
1. History of firm and interest in DER optimization: Why did the firm enter the market? What was its motivation? What unsolved problem is the firm trying to solve?
2. Barriers: What are the biggest challenges or bottlenecks to DER deployment? How can they be addressed?
3. Approach to DER modeling: How do firms define “optimal” DER deployment? Are tools descriptive (identify trends and relationships in existing data), predictive (make forecasts), or prescriptive (provide recommendations)? How do they model future uncertain events? How do firms balance interpretability with predictive power in models?
4. Software development: What are the key features of the tools and current states of development? What are the user interfaces of these tools?
5. Key datasets and data needs: What data do firms have and use? What data would be useful, but firms have not been able to access? How do firms handle confidential data or personally identifiable information?
6. DIDF feedback: If interviewees are familiar with the DIDF, do they have specific feedback or suggestions?
Firms Offering DER Siting Optimization Services The CEC team conducted in-depth interviews with five firms providing analytical services relevant to DER siting, planning, and optimization. These firms included Kevala Analytics, Integral Analytics, GridLab-D, Recurve, and Vistar Energy. In addition to the firms interviewed, Demand Side Analytics, Oracle Utilities, Opus One, and General Electric were identified as firms offering big data analytics services relevant to DERs. The research team was unable to reach these firms. The five firms included in the market assessment are described below.
9
Kevala Analytics Kevala is a grid-scale analytics company with a proprietary web-based user interface called “Grid Assessor.” The platform is designed for “technical grid planners and programs and rate designers” to model a wide range of scenarios and assumptions. Key features including outputting CYME power flow models for distribution planners and grid engineers and using computer vision algorithms to identify distribution grid infrastructure when utility data are lacking or incorrect. Kevala has contracts with the CEC and the CPUC.
Integral Analytics Integral is a grid-scale analytics company with a proprietary web-based user interface with modules related to grid planning and modeling. The first, DSMore, was designed as a cost-effectiveness calculator with “hourly load shape analysis by customer over market conditions and overall weather conditions.” LoadSEER was developed as a transmission and distribution (T&D) avoided cost calculator for energy efficiency and demand response investments, modeling DSMore results out up to 30 years. The iDROP module is an “economic dispatching engine that also has optimal power flow” to model how controllable DERs would operate at least cost given distribution grid constraints. Integral has contracts with California’s electric investor-owned utilities (IOUs).
GridLab-D GridLab-D is an open-source, grid-scale analytics platform with a command-line interface. GridLab-D originated from the Pacific Northwest National Laboratory to study “new approaches to distributed energy resources that could support investment deferral of capacity” investments. The Stanford Linear Accelerator (SLAC) National Laboratory took over this project to support other technology focused DER research. SLAC has a partnership with Hitachi to “deploy the technology for commercial operation,” such as developing a user interface known as the GridLab-D Open Workspace (GLOW). Representatives from SLAC and Hitachi participated in the interview, but the platform is referred to as “GridLab-D.” A key distinction between GridLab-D and the others is that GridLab-D is an agent-based platform, meaning the results are aggregations of many simulated decisions of individuals, DERs, and others. That is, “the point of the agent-based simulators was to allow us to define agents that had technical capabilities, economic capabilities, regulatory relevance, and that related to demographics, weather, tariffs, and revenue modeling.” GridLab-D was funded in part by CEC Electric Program Investment Charge grants.
Recurve Recurve provides open-source methods for calculating hourly BTM DER savings or generation. Recurve set out to conduct accurate and automatic measurement and verification (M&V) of monthly energy savings from energy efficiency measures. As the importance of customer load shapes has grown with higher penetration of DERs (particularly solar), Recurve’s focus has shifted to hourly savings and generation M&V to reflect the time-varying value of electricity and DER services. Recurve focuses on meter-level analysis, where it takes a statistical or actuarial approach to understanding DER potential and measured value. Recurve offers paid data management and analytics services that leverage its core open-source products.
10
Vistar Energy Vistar created the Xerohome tool, which models DER payback for the single-family residential (SF Res) market only. The results of Xerohome are based on the EnergyPlus engineering-based building-energy-use model. The customer-centric tool is perhaps least similar to the others included in the assessment. However, Vistar’s goal is to scale DERs within the residential market using big data, which to date has faced significant barriers to large-scale penetration.
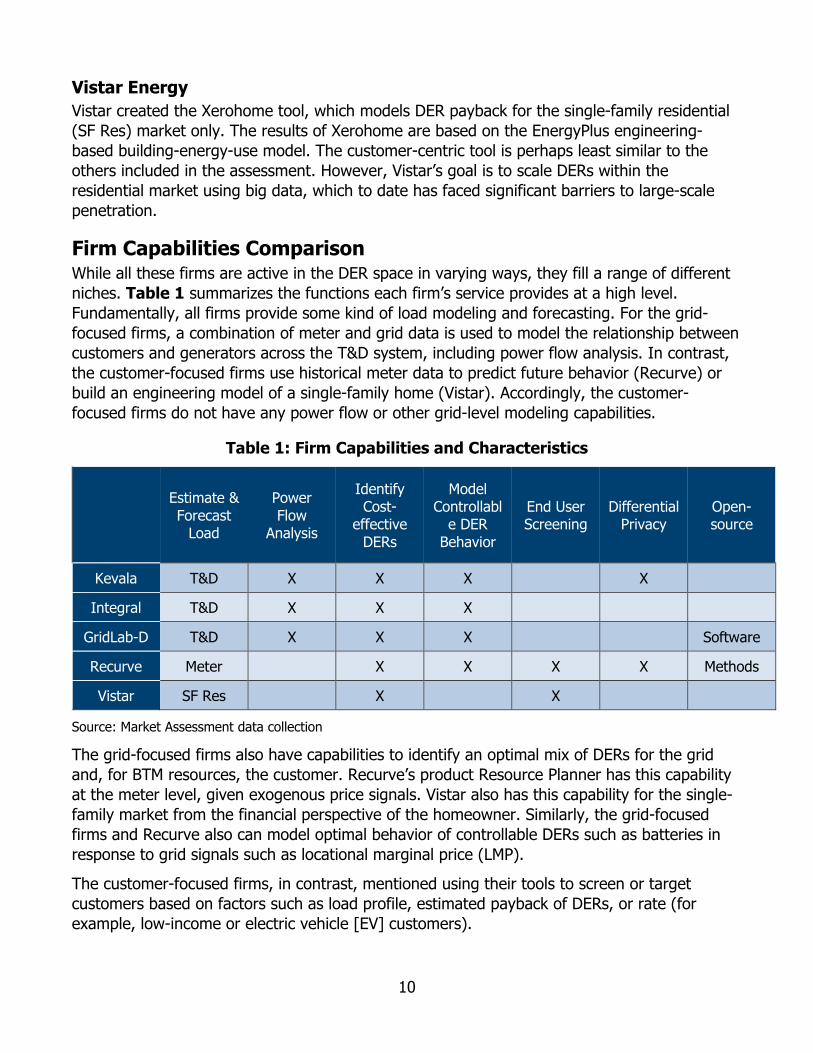
Firm Capabilities Comparison While all these firms are active in the DER space in varying ways, they fill a range of different niches. Table 1 summarizes the functions each firm’s service provides at a high level. Fundamentally, all firms provide some kind of load modeling and forecasting. For the grid-focused firms, a combination of meter and grid data is used to model the relationship between customers and generators across the T&D system, including power flow analysis. In contrast, the customer-focused firms use historical meter data to predict future behavior (Recurve) or build an engineering model of a single-family home (Vistar). Accordingly, the customer-focused firms do not have any power flow or other grid-level modeling capabilities.
Table 1: Firm Capabilities and Characteristics
Estimate & Forecast
Load
Power Flow
Analysis
Identify Cost-
effective DERs
Model Controllabl
e DER Behavior
End User Screening
Differential Privacy
Open-source
Kevala T&D X X X X
Integral T&D X X X
GridLab-D T&D X X X Software
Recurve Meter X X X X Methods
Vistar SF Res X X
Source: Market Assessment data collection
The grid-focused firms also have capabilities to identify an optimal mix of DERs for the grid and, for BTM resources, the customer. Recurve’s product Resource Planner has this capability at the meter level, given exogenous price signals. Vistar also has this capability for the single-family market from the financial perspective of the homeowner. Similarly, the grid-focused firms and Recurve also can model optimal behavior of controllable DERs such as batteries in response to grid signals such as locational marginal price (LMP).
The customer-focused firms, in contrast, mentioned using their tools to screen or target customers based on factors such as load profile, estimated payback of DERs, or rate (for example, low-income or electric vehicle [EV] customers).
11
Kevala and Recurve stressed the importance of statistical methods known as differential privacy. At the core, differential privacy involves adding random variation, or “noise,” to a dataset such that no individual in the original dataset can be identified in the modified one, yet the overall dataset retains the same key characteristics as the original. Additional discussion of the applications of differential privacy to energy data can be found in the detailed findings.
Finally, the GridLab-D software package and key methods used by Recurve are open source. Open source refers to computer code that is freely available for anyone to use and inspect on their own, among other properties. These components were funded by public agencies, so the intellectual property is considered a public resource. Recurve, however, is a for-profit company, and although open-source tools are a core part of its business model, it provides related analytics for revenue. Similarly, Hitachi is developing the commercial user interface GLOW, and Recurve offers data management and consulting services. While Recurve and Hitachi’s services are both available for a fee, it may also be possible for state agencies to leverage these open-source tools entirely with internal resources, rather than contracting out for software, analysis, or consulting services or a combination.
Detailed Market Assessment Results This section includes detailed results from the interview with DER analytics firms, with findings grouped thematically into three groups: Data, Analytics, and Information; Economics and Value; and Emerging Trends. The first includes findings directly related to the study research objectives, which big data analytics can address directly. The second includes findings related to supporting DER financial viability, for which analytical approaches are not directly applicable, but interviewees stressed as important for improving DIDF and DER outcomes. The final section relates to electrification, or replacing direct-combustion vehicles and appliances with electric ones, that may complicate traditional planning by increasing electric demand.
Each finding is followed by an associated recommendation and brief description. This section includes excerpts from interviews, which have been edited and condensed for length and clarity.
Data, Analytics, and Information The results in this subsection relate to identifying optimal, or least-cost solutions, for DERs through acquisition of data, application of analytics, and providing access to information. Expanding distribution deferral opportunities will require allowing a broader set of smaller, BTM, or customer-sited DERs or a combination. However, doing so presents several challenges related to quantifying potential grid benefits of DERs, identifying appropriate customers to host DERs, and measuring outcomes to incentivize high performance at low cost. As such, big data analytical approaches are well suited to addressing barriers to deploying these DERs and taking advantage of their opportunities. Integral framed the need for a diverse set of DERs, rather than a single, large DER opportunity:
You have to have an integrated mix — you don’t want to lose this [distribution deferral opportunity] because you keep trying to use solar to replace a transformer. You’re never going to win that because the transformer isn’t subject
12
to clouds or nighttime. But with the combination of energy efficiency, load control, battery, and PV, then you can talk about it.
The following findings include additional detail on barriers and opportunities related to expanding the set of DERs.
Small Customer-Sited DERs Are a Largely Untapped Distribution Resource Customer-sited DERs, particularly energy efficiency measures, have long been considered a low-cost alternative to traditional generation resources and can contribute significantly to local distribution grid needs. If small, customer-sited DERs, including residential and small commercial BTM resources, are to compete in the distribution deferral market, they will have to reach scale not only to meet the magnitude of the grid need, but to reliably produce the energy savings or generation needed. Recurve explained this concept as a portfolio approach:
It’s about assets that perform incredibly consistently at the portfolio level. They’re based on individuals, but we’re betting on the virtual power plant, which is a portfolio. We just need to break free of an engineering-based approach at the core — it’s still there, but that’s not the way you forecast.
Take the example of building insulation as an energy efficiency measure, which can serve as a capacity resource because it reduces electric demand for cooling during peak periods. However, relying on insulation on a home or building to provide capacity services runs the risk of the building occupant running another electric appliance when the demand reduction is needed and overloading distribution infrastructure. Across many such homes, in contrast, this risk is greatly reduced. Recurve refers to this approach as an “actuarial” or risk-management approach. Integral framed their approach similarly:
The goal is to manage risk on the distribution grid. … We’re not trying to collect personal information or say, “You’re going to buy a green Tesla next month.”
While small, customer-sited DERs can provide significant distribution grid services, doing so faces several barriers and soft costs related to identifying customers with the most potential for grid benefits, customer acquisition, and measuring BTM outcomes. In particular, a high penetration of customers within a small section of the distribution grid (for example, those being served by a particular substation or feeder) must be reached to meet the grid need and reduce performance risk.
Accordingly, the DDOR market assessment metric deliberately favors deferral opportunities for planned investments serving fewer, larger customers to reduce these costs, which has the effect of precluding small customer-sited DER types from participating. However, these soft cost barriers are well-suited to be addressed by big data approaches, which are addressed in the subsequent findings.
Recommendation: Use a Portfolio Approach to Manage Performance Risk. Allow smaller DERs to participate in the market by scaling up to meet the magnitude of grid needs and reduce performance risk of many small BTM DERs. The Clean Energy Customer Incentive and Standard Offer Contract deferral tariffs recently passed under the Integrated
13
Distributed Energy Resources (IDER) proceeding are broadly consistent with this recommendation, and the CEC supports these and similar arrangements.
Consumer Privacy and Market Appraisal Are Not Mutually Exclusive All interviewees, including those from customer- and grid-focused firms, stressed the centrality of AMI data for gaining customer insights and developing a robust market around DERs and distribution deferral. At the same time, they stressed the importance of maintaining privacy for end-use customers. Recurve summarized this tension:
There is no way decarbonization happens without access to AMI data — and there is no way we should use that data in a way that undermines customer expectations of privacy.
To resolve this tension, Recurve and Kevala advocated for the use of differential privacy. Differential privacy involves adding random variation or “noise” to a dataset such that no individual in the original dataset can be identified in the modified or proxy dataset, yet the overall dataset retains the same key characteristics as the original. Kevala explains:
To preserve privacy by not revealing AMI data we use artificial intelligence to create a proxy value that matches the observed patterns of energy consumption but doesn’t reveal an individual customer's energy consumption.
For example, consider a dataset including one year of hourly energy consumption for all residential and small commercial meters on a circuit with an identified grid need. An appropriate differential privacy algorithm would create a proxy dataset with roughly the same average and total consumption, distribution of peak demands, and other features, yet meters in the original data could not be identified by inspecting or analyzing the proxy data. This transformation would allow third parties to assess the overall market in the grid need area — for example, how many customers could benefit from which DER types — without, according to Recurve, “exposing or even knowing whether or not any given customer is part of that aggregation.”
Kevala stressed that different applications of differential privacy are required for different use cases:
When you apply differential privacy to energy data, it is essential that it be applied in the context whatever the end use will be. There is a high risk that differential privacy would significantly harm the quality of the price formation or analytics relative to power flow that you might get if you take it from one area where it was applied and apply it to another.
That is, it is not possible to create a single universal “differentially private dataset,” but smaller sets of differentially private data can be created for individual use cases, such as for homes on a circuit after a specific grid need is identified.
5 Golestani, Naseem, Robert Peterson, Keishaa Austin, Gabriel Petlin, and Jonathan Frost. Distributed Energy Resources Deferrral Tariff and Request for Offer Streamlining. 2020. California Public Utilities Commission. https://docs.cpuc.ca.gov/PublishedDocs/Efile/G000/M357/K712/357712628.PDF.
14
Differential privacy is a particularly appealing approach for the type of small DERs distributed among many residential or small commercial customers that are inherently more challenging to integrate into distribution deferral projects as described above. The challenge exists because the more individuals in the population, the less statistical noise needs to be added to maintain privacy. A small number of large commercial and industrial customers, in contrast, would likely be better served by traditional outreach.
Identifying the overall market potential for DERs is the first step toward targeting specific customers to host BTM DERs.
Recommendation: Apply Differential Privacy to Provide Insights Into Market Potential Without Compromising Customer Privacy For identified grid needs, generate, and make proxy datasets available for consumption and distribution grid conditions that retain the characteristics of the underlying data while protecting customer privacy. Different applications will require varying degrees of differential privacy at different levels of granularity, so create the appropriate proxy data for each task.
Customer Energy and Cost-Savings Potential Is Invisible to DER Providers Enabling a larger array of customer-sited DERs also requires identifying the specific customers and corresponding DER solutions with the greatest potential value. Vistar and Recurve, the customer-focused firms, explained how their platforms could be used to screen customers for this purpose. Vistar’s Xerohome platform models various DERs and estimates the payback period to the customer for each single-family home. For example, this process would allow a utility or program implementer to see “homes where the payback is less than five years” for some measure and “send mailers about a certain program.”
Recurve takes a different approach to the same end. The approach is agnostic to the building type and instead uses key load characteristics from AMI data — particularly temperature sensitivity — to screen customers at the meter level. As an example, Recurve described a potential query: “Give me the 25 percent of my highest peak load consumers who are residents in this area, who are CARE customers, and who don’t have solar panels.” Recurve’s method essentially identifies customers who are most costly to serve and correspondingly are most likely to have the most potential for shared savings. Unlike Vistar, however, the platform does not make prescriptive recommendations.
While utilities and their implementers may be able to directly screen and target customers based on AMI consumption data, making these data available directly to third parties presents a potential invasion of consumer privacy. Utilities, however, can connect DER providers to customers without exposing customer data.
In contrast to AMI data, which are deemed confidential and personally identifiable information, Recurve’s methods are open source. As such, these methods are inherently transparent and independently reproducible, making them appealing for a number of DER-related analytics, including M&V and to connect DER providers and aggregators to potential host customers.
Recurve’s screening capabilities are based on its open-source methods, so they can be applied to private test data differentially to build confidence and understanding with the knowledge they will be applied in the same way to real data. That is, a firm might identify the
15
“customers” of interest in a differentially private dataset using these methods, and the utility can connect the firm to actual customers with the corresponding characteristics.
For example, an HVAC company might select minimum parameters for high temperature sensitivity to identify those with inefficient air-conditioning systems and maximum values for low temperature sensitivity to screen out those who already have efficient systems. Once satisfied with the results in the proxy data, the aggregator could request the utility include the firm on a program bill insert for customers who meet those same criteria. No customer energy consumption data or contact information would ever be shared with the provider, but the provider would be able to target customers with the confidence that the utility is reaching out only to customers with sufficient potential to host valuable DERs.
A similar approach could be taken using an approach like Vistar’s that would allow firms to make a similar request based on payback for specific measures or technologies. A proprietary method to calculating payback or a similar financial metric, however, may not be as appealing to firms if they cannot test and understand the methods underlying the results. Such a financial analysis, however, could be included in an open-source package that could provide additional information to DER providers.
Recommendation: Combine Proxy Data With Open-Source Methods to Allow Utilities to Connect High-Potential Customers With DER Providers Use open-source methods for modeling customer consumption characteristics that can be applied to real and proxy data. DER providers can test these models on proxy data to identify characteristics of high-potential customers and utilities can identify actual customers with the corresponding characteristics. Through utility communication, such as bill inserts or newsletters, utilities can connect DER providers with those high-potential customers.
Coordination Remains a Barrier to Multitechnology DER Packages Using big data approaches to identify market potential and candidate hosts for DER types will likely identify a range of DER solutions, both in front of meter (IFOM) and hosted by a range of customer types. This optimal, or least-cost, mix will not be used if providers cannot coordinate to bid in these resources, as Integral explained:
Who sells batteries and PV and does load control and has an army of people to do insulation? That takes a lot of coordination to put that together and it may be hard to find vendors who are going to offer it. So maybe the DIDF evolves into the language of “this is what we need” in terms of what the DER mix would be, not just the capacity amount.
Integral argued that a tool like its DER Optimizer, which “does a joint optimization over the forecast period” of solar, batteries, demand response, and energy efficiency, is needed to identify the specific technologies required to address the grid need, rather than just the grid need itself.
Other interviewees, however, cautioned against an overly prescriptive approach to soliciting proposals. Recurve argued, “You have to pay for outcomes so you can let the market innovate,” as opposed to offering incentives for specific solutions. Indeed, an optimization algorithm is only as good as the associated assumptions and will unlikely be able to account
16
for innovative business models and technology that exist throughout the market. In the context of distribution deferral, however, a purely technology-agnostic, results-based solicitation approach may not address the coordination issue identified by Integral.
A middle ground between these two perspectives that may address the coordination issue, while enabling innovation is a default or reference portfolio of DERs. Policy makers, using a platform like Integral’s DER Optimizer, could include the modeled optimal set of DERs in a request for proposal (RFP). Aggregators could use the reference portfolio to identify partner firms, then adjust the specific DERs proposed based on these firms’ collective capabilities and costs.
Recommendation: Facilitate Packages of DER Technologies to Meet Grid Needs Provide reference packages of DER technologies to bring firms offering differing services together. Allow for bidders to adjust these defaults to encourage innovation.
Transparent Accounting Methods Are Critical for DER Measurement and Verification IFOM DERs are straightforward to meter and compensate for their time- and location-dependent value. BTM resources, in contrast, are not directly observable to the grid, regardless of whether the resource is a decrease in demand or an increase in supply. To address this problem, programs and tariffs require a way to measure the timing and magnitude of a resource’s contribution to the grid. Recurve explains they developed this concept in the context of energy efficiency:
The cornerstone of any market is you have to have a product, and the product of energy efficiency is a derived value — it’s a calculation. You can’t pay for performance unless you’ve agreed on how to calculate it in a consistent way.
Recurve’s approach to this type of accounting problem is making accounting methods open source. Recurve, among others, developed such a set of methods known as CalTRACK that estimates hourly changes in energy consumption caused by energy efficiency and demand response interventions. The current iteration, CalTRACK 2.0, includes support for meter-level savings and portfolio-level load shape M&V.
Makings these methods open source is important for two complementary reasons. First, Recurve explains, they are “transparent” so that providers and aggregators can understand and trust ahead of time that the methods will reward delivering actual grid value (or, if not, raise concerns). Second, they are “reproducible,” so providers can independently verify that methods were applied appropriately after the fact.
Furthermore, because open-source M&V methods are agreed to ahead of time, providers can monitor outcomes and make course corrections if necessary:
6 CalTRACK was started under the CPUC I collaboration with PG&E. CEC is among the funders of CalTRACK 1.0 and 2.0.
17
It turns into what you would call integrated M&V. An ex-post evaluation happens in real time during the deployment of the program, so that you can have actionable information and continuously optimize.
Because grid needs are defined temporally (and spatially), M&V methods must be designed to estimate DER outcomes at different times. Recurve started out measuring monthly energy savings but has moved toward an hourly savings model approach to accommodate the daily cycles of electric demand.
M&V is often considered the last step in a DER or other demand-side management program; once installed and operational, implementers and evaluators check to see how actual generation or savings measured up to expected. Recurve has a different outlook: M&V processes are crucial for defining how a portfolio of DERs will be evaluated and, hence, define the incentives DER providers face, making M&V processes the first step a DER provider needs to consider.
Recommendation: Use Open-Source Methods for Measurement and Verification Apply the open-source CalTRACK 2.0 M&V methods to assess hourly performance of BTM DERs transparently and reproducibly and build a market for DER outcomes based on these contributions on an hourly basis. In particular, use these methods to assess the performance of DER during conditions predicted to trigger grid needs for distribution grid deferral evaluation.
Economics and Value The interviewees all mentioned that information was a barrier to DER deployment. Yet they also identified a suite of challenges related to how DERs are compensated and stressed that big data analytics cannot directly address these fundamental issues. This section details these findings.
Deferral Value Alone Is Insufficient to Drive Optimal DER Deployment DERs often have the potential to provide value (revenue or savings) to many different parties. These may include DER owners or hosts, utilities, other ratepayers, and society more broadly in the case of pollution reduction. Interviewees generally agreed that if DERs can only tap one of these value streams for revenue, namely savings from distribution deferral, many potentially competitive DER solutions would not financially viable. Integral explained this barrier:
I’ve been trying to sell DERs as a capacity value for a long time and it is tough. Without the energy value, without the resiliency value, without the carbon value, it’s really hard.
Interviewees frequently referred to this concept of multiple value streams and associated revenue streams as the “value stack.” Recurve described unlocking the value stack as a way to drive desired policy outcomes, explaining that policies like tariffs and programs can “pay for the value of time and locational efficiency across all of the stacked values: capacity, energy, T&D [deferral], and ancillary services.”
18
Interviewees expressed that while it may be possible to access a given layer of the value stack individually, it remains difficult to access all of them together. For example, Kevala explained:
The value that the resource can deliver is not being fully captured in a single proceeding. DIDF needs to expand to be able to reflect this value stack more appropriately, or some other mechanism needs to exist.
Among the values that DERs have not been able to tap sufficiently or consistently are system capacity, ancillary services, avoided T&D line losses, avoided local pollution (particularly in disadvantaged communities), and externalities associated with greenhouse gas emissions. Some of these require no action to include into the stack, such as the tariff savings that would encourage a retail customer to pay a provider to host a DER. Some might simply require access to existing markets, such as ancillary services. Still others require an explicit treatment, such as financial incentives, avoided transmission costs, and externalities. Furthermore, DERs must be allowed to access each of these value streams to be compensated proportionately to the value they provide.
Recommendation: Facilitate Revenue Generation From the Full DER Value Stack, in Addition to Distribution Deferral DERs need access to several revenue streams aligned with actual value provided to achieve optimal deployment. Consider the distribution investment deferral value captured through the DIDF as one value in the broader stack. These may include customer payments, time-dependent energy value (through customer or aggregator exposure to LMPs), and shadow prices for local or global externalities or both, among others. Integrate the DIDF proceeding with others that DERs can tap for revenue and allow DERs to generate revenue commensurate with each service they provide. Ensure these changes do not allow DERs to be overcompensated for any given value, consistent with existing incrementality policies.
Time- and Location-Dependent Energy Value Is Foundational to the Value Stack The energy value, mentioned by Integral and Kevala, emerged as a key value within the stack. This value is reflected in the locational marginal price (LMP). To unlock this value, customers or DER aggregators need to be exposed to the LMP. Integral explained:
We never believed in tariff arbitraging for each customer individually based on their [TOU or other non-dynamic] tariff. We believe that if you run least cost on the forward market, that’s where the rates should be least cost. That’s the goal that we all do that together to drive prices down.
For retail customers, this could be as straightforward as providing a retail tariff based on the day-ahead hourly LMP. As GridLab-D noted, “We often miss opportunities because our tariffs do not incentivize the behavior that's actually needed.” Many variations of dynamic and real-time pricing are possible, but it is beyond the scope of this report to prescribe a specific tariff design. However, a retail tariff that more closely reflects LMP is likely among the most powerful price signals to encourage DER adoption. Distribution investment deferral value can then be “stacked” on top of the time and locational value of energy.
19
However, retail customers need not be exposed to real-time or other dynamic pricing to unlock the same value. In principle, DER aggregators could also be exposed to wholesale LMPs by allowing them to earn wholesale prices from hourly behind-the-meter generation or savings from DER portfolios in the same way a merchant generator is compensated, while allowing retail customers to remain on prescriptive time-of-use rates. Recurve strongly cautioned against exposing retail customers to time-varying pricing and instead advocated for the approach of “sending a real-time wholesale price signal to third-party [aggregators] that would dispatch DERs accordingly.”
In a similar fashion to reducing DER performance risk for distribution investment deferral, shifting the energy price signal from consumers to aggregators lowers financial risk that retail customers would otherwise face. Staff does not argue that customers should be precluded from exposure to LMP for those that are willing to take on the risk (and reward) of volatile energy prices, but does find Recurve’s approach a useful alternative to allow the price signal to offer incentives for DERs without requiring customers to do so.
Recommendation: Provide LMP-Based Tariff Options for DER Aggregators and Retail Customers Create pathways for DER providers and retail customers to benefit from the variable energy value of electricity. Allow DER providers to earn the wholesale market price for BTM savings in much the same way generators participate and award their DER aggregations the generation or savings calculated by the CalTRACK 2.0 methods. This approach unlocks the value of energy while shielding end-use customers from the risk of volatile prices.
For retail customers who are willing to take on the risk and reward, create an opt-in tariff that largely reflects the LMP. Any LMP metric may be used, but some, such as day-ahead hourly, may be preferable for retail customers for day-ahead predictability. The tariff may also include fixed charges, small volumetric, capacity, or LMP multiplier charges or a combination to support efficient cost recovery.
Forecast Certainty Metric Limits Deferral Opportunities Forecast certainty is one of three prioritization metrics applied to the list of deferral opportunities identified in the DDOR. While this metric has not been defined prescriptively, the following explanation was provided as justification:
Grid needs/projects with a higher likelihood of materializing should be prioritized over those with a lower likelihood of materializing. … In general, grid needs that are nearer-term and/or driven by multiple customers are more certain than needs that are longer-term and/or driven by relatively few customers.
As this explanation suggests, likelihood (that is, probability) is linked with the time frame of the expected need. Both probability and time frame are important concerns regarding uncertain future events. Integral noted that it is impossible to predict all grid needs perfectly:
Maybe you’re going to “defer” something that does not end up happening. But you can do it in a systematically least cost way that has multiple benefits.
20
That is, the fact that some grid needs will not materialize should not stop policy makers from considering the possibility of that future cost. One key part of the systematic, least-cost approach implied by Integral is expected value of a future cost: the product of the cost of the asset and the related probability. Higher probability grid needs have higher expected value of investment cost and would carry a commensurate level of incentive.
Similarly, Kevala noted the metric tends to ignore needs further in the future:
Only looking out five years is a serious problem if there’s a billion dollars of value associated with a transmission constraint that is being planned in year number ten. As a result, you have an explicit split in quantification of value that is being taken off of the table that’s not letting these resources obtain the penetration levels that they need.
Like probability, the distance into the future can also be handled systematically. Instead of qualitatively prioritizing based on the expected time frame, policy makers can discount future costs into present value. As a grid needs appears on the planning horizon, the present value of that grid will be small. As the need becomes closer, the present value will likewise increase.
Expected and present values are compatible and can be applied together to calculate systematically the value of future uncertain avoided costs. Doing so will flexibly value such future needs, which can update as needs come closer to the present and more data are available to understand whether the need will indeed materialize. It also may also create opportunities for DERs to ramp up to meet needs by expanding the window over which they can be deployed. During this time, policy makers and utilities can make course corrections, either procuring additional DERs as needs become more likely or pausing if the need is met.
Recommendation: Calculate and Make Public the Expected Present Value for Wider Array of Deferral Opportunities Currently, the deferral value, or “cost cap,” is determined only for bid evaluation rather than the upfront evaluation of deferral opportunities. Require utilities to calculate and make publicly available the estimated deferral value for future grid needs in the DDOR. Apply systematic estimates of the probability of grid needs materializing using the best available information to generate the expected value and discount the anticipated cost into present value using accepted methods such as the real economic carrying charge. Present value will start small as when grid needs are far in the future (and highly uncertain), and increase over time, providing a ramp-up period to install DERs, measure outcomes, and adjust as necessary. Making this information public can create more opportunities for third parties to bid innovative DER solutions while retaining the incentive for providers to compete on price.
Furthermore, require the IOUs to include opportunities with considerable uncertainty and further into the future, rather than allow them to constrain grid needs in a way that may filter viable projects out of the deferral opportunity list. For example, SDG&E’s 2019 and 2020 filings included no planned investments that would pass the timing screen. The IOUs could be required to include investments for all grid needs with a 25 percent or higher probability of materializing within the next 10 years (or similar). Taking this approach, the list of deferral opportunities presented by each IOU is likely to be more inclusive.
21
Emerging Trends The following findings relate to recent technological and policy trends, particularly the electrification of transportation and (to a lesser extent) other loads such as space heating. Accordingly, the implications of these findings are less immediate and require tracking over time.
Unmanaged Transportation Electrification Could Disrupt Grid Planning and Operations As Californians increase adoption of EVs, the increased charging load is expected to massively impact patterns of overall electric consumption and the grid planning and operations needed to supply them while maintaining reliability. Other loads, such as space heating, may also have critical impacts, such as increased winter peak loads. Transportation electrification, however, is widely believed to be the biggest disruptor over the next few decades. All three grid-focused interviewees all agreed on the importance of granularly tracking EV adoption and operations for future grid forecasting and planning.
Integral called the emergence of EVs the most significant impact to the electric grid “compared to anything else since the air conditioner,” which drives summer peak loads in California. Kevala similarly referred to EV charging as likely “the single largest factor impacting the grid [and] not only the state’s, but the world’s carbon goals.”
These firms reached the same conclusion that, according to Integral, “there’s going to be a big need for electric vehicle tracking.” Kevala expanded on this idea, saying “being granular in terms of both their time and their location is probably the most important component,” referring to a suite of spatial and temporal data regarding where and when EVs charge, how fast they charge, and how far they travel in between charges. Kevala illustrated with an example:
If you assume that a given workplace charging location takes a generic charge profile and you haven’t actually accounted how far the vehicles traveled to get there, you have no idea what their dwell time would be, or whether Level 3 [DC fast charger] or Level 2 [dedicated 240V charger] or Level 1 [standard 120V charger] would be necessary, and [depending on the assumptions] you’ll get radically different views about the shape of that load that is driving the need for wires-based solutions.
The grid-focused firms also shared similar perspectives on the data required to track EVs with the necessary granularity. In addition to EV registration data (that is, where EVs are likely to charge overnight at homes and businesses) and charger data, they identified location services data as crucial to understanding and modeling EV charging behavior. Location services data are the same type of data collected from cell phones, which has been used to track travel and other spatial patterns anonymously. GridLab-D explained:
We've been looking at using location services data to develop better load profiles for electric vehicle charging because we know where people are going, we know when they're going, where their cars are at particular points in time, and so we
22
know as the fraction of electric vehicles increases, we can have a pretty good idea of what to expect in terms of charging needs.
Kevala pointed out that the challenge of meeting EV charging loads “is going to the single largest driver of grid needs and upgrades — and therefore value that DERs can capture.” That is, the additional challenge makes DER solutions all the more valuable, if they are implemented appropriately. Kevala highlighted the associated opportunity and risk:
Those resources [DERs] are going to be much more valuable and we have to implement mechanisms for ensuring that they can be tied discretely to operational planning needs for utilities, or we are going to end up failing at the electrification of transportation and meeting our carbon goals.
EVs have significant potential to contribute to a decarbonized economy, but to manage them, policy makers, utility planners, and DER providers will need granular data on where EVs are being adopted, charged, and driven.
Recommendation: Track Electric Vehicle Adoption and Behavior Spatially and Temporally To manage electric demand growth from EVs, information regarding adoption, travel, and charging is needed. Coordinate with the CEC to conduct analysis EV adoption data (such as the vehicle registration information provided by the California Department of Motor Vehicles) and data collected under CEC’s Electric Vehicle Supply Equipment Title 20 regulations. If possible, obtain anonymized EV location services data to incorporate into electric grid planning exercises. In addition, it may be useful for transportation electrification impacts that drive planned investments, such as charging infrastructure, to be identified in the IOU DIDF filings such that these investments can be evaluated, and transportation electrification impacts can be tracked over time to improve grid planning.
Electrification Load Growth May Preclude Some Distribution Deferral Opportunities Electricity is almost certain to play a growing role in California’s economy and climate plans, driven by electrification of transportation (see above) and other end-use loads such as space heating and cooking. Given this increased role in California’s energy systems, many components of the distribution system may need to be upgraded to accommodate the growing load, even with a significant deployment of appropriate DERs.
Integral suggested addressing this reality by co-optimizing DER and traditional distribution grid “wires” infrastructure. To illustrate, it provided the example of an area with a planned commercial Level 3 EV charging station:
If there’s a circuit or substation that is going to be growing so fast and you have a bunch of [needed distribution] projects, you’re probably not going to be able to defer those. It may actually be more beneficial for climate and the economics to increase capacity and DERs: to do both.
For example, perhaps the added load triggers grid needs on the primary and secondary distribution systems. The increase in load has a larger impact on the secondary system directly
23
serving the customer and is unlikely to be deferred. The relative increase on the primary distribution system, however, is much smaller and serves a larger pool of customers and sites that can be tapped for DERs. In this case, the optimal solution could be to upgrade the secondary distribution system while deferring upgrades to the primary.
Adding “wires” infrastructure to serve new load may also increase the hosting capacity for other DERs such as solar with storage, which could often directly serve the new load and coordinate its own generation, charging, and discharging with that of the new load. Meeting only the emerging grid need without considering and coordinating with other DER opportunities and value streams could result in missed opportunities for managing costs across the distribution grid.
Recommendation: Study Potential Benefits of DER and “Wires” Combined Solutions To the extent traditional investments cannot be deferred, study potential opportunities to co-optimize these with DERs. In particular, consider the deferral opportunities on the primary and secondary distribution systems independently. Even if greater capacity or other infrastructure is needed, DERs can be strategically deployed to help meet and manage new loads or other grid needs. Furthermore, building out the distribution system can increase hosting capacity for additional DERs. This approach to distribution is relatively novel and may require further study to implement.
24
CHAPTER 3: Datasets Relevant to DER Planning and Siting Optimization
Chapter 3 summarizes datasets identified as relevant to distribution investment deferral with DERs, key findings related to these datasets, and a description of the accompanying data catalog.
Identification of Datasets This section summarizes the datasets identified as relevant or helpful to DER planning and siting optimization. Many applicable datasets are already known through CPUC proceedings such as the DRP. These include, for example, datasets associated with DIDF filings such as the GNA, DDOR, Interconnection Capacity Analysis (ICA), and Locational Net Benefits Analysis (LNBA). Many others are known through other CPUC proceedings or programs such as the Self-Generation Incentive Program (SGIP), California Solar Initiative (CSI), and DR programs, to name a few.
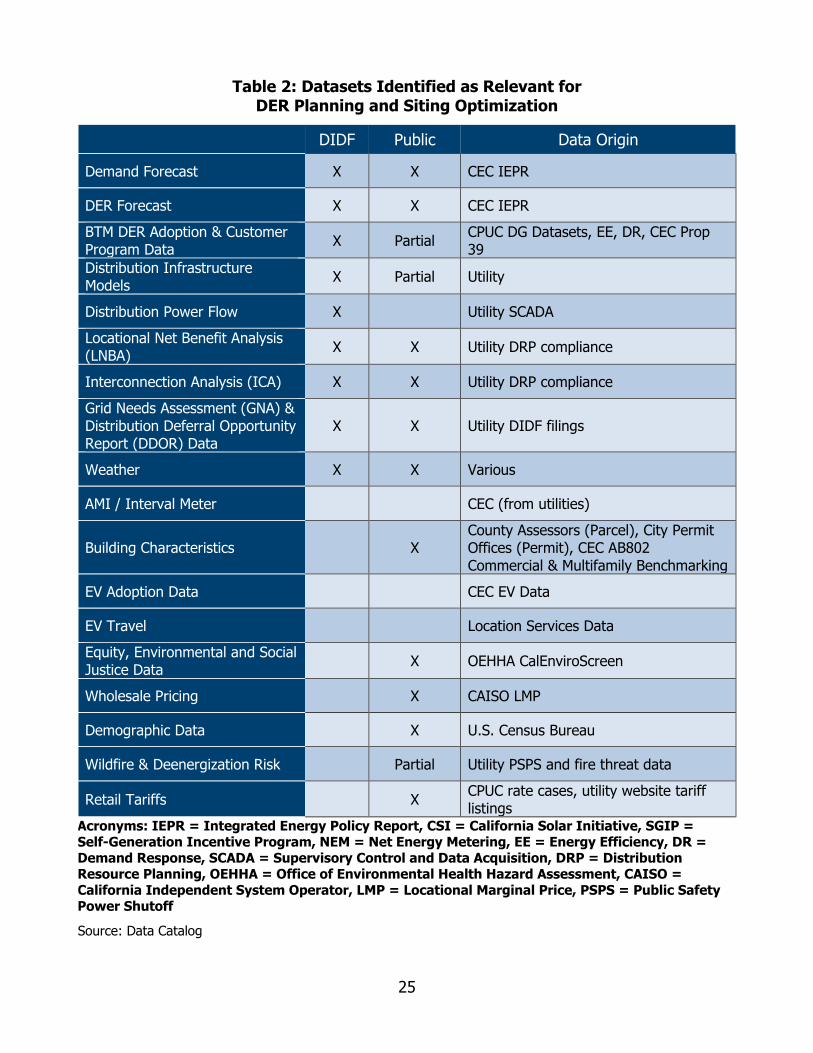
Beyond such known datasets, a broader search was conducted to identify other datasets that may contain additional relevant information. Such information includes all descriptors of distribution system facilities or equipment (such as distribution planning power flow models and wildfire management plans), customer load information (actual and forecast), DER facilities or equipment (launched and planned), electric vehicle (EV) infrastructure, and geospatial distribution infrastructure data, among others. In short, any dataset containing information about the distribution grid, customer demand, or customer supply was identified as important to DER planning and siting optimization. Further, feedback from DER analytics firms, captured in the market assessment (Chapter 2), helped inform the datasets included in this section. Table 2 presents the datasets identified as important to DER planning and siting optimization or used in the DIDF.
25
Table 2: Datasets Identified as Relevant for DER Planning and Siting Optimization
DIDF Public Data Origin
Demand Forecast X X CEC IEPR
DER Forecast X X CEC IEPR BTM DER Adoption & Customer Program Data X Partial CPUC DG Datasets, EE, DR, CEC Prop
39 Distribution Infrastructure Models X Partial Utility
Distribution Power Flow X Utility SCADA Locational Net Benefit Analysis (LNBA) X X Utility DRP compliance
Interconnection Analysis (ICA) X X Utility DRP compliance Grid Needs Assessment (GNA) & Distribution Deferral Opportunity Report (DDOR) Data
X X Utility DIDF filings
Weather X X Various
AMI / Interval Meter CEC (from utilities)
Building Characteristics X County Assessors (Parcel), City Permit Offices (Permit), CEC AB802 Commercial & Multifamily Benchmarking
EV Adoption Data CEC EV Data
EV Travel Location Services Data Equity, Environmental and Social Justice Data X OEHHA CalEnviroScreen
Wholesale Pricing X CAISO LMP
Demographic Data X U.S. Census Bureau
Wildfire & Deenergization Risk Partial Utility PSPS and fire threat data
Retail Tariffs X CPUC rate cases, utility website tariff listings
Acronyms: IEPR = Integrated Energy Policy Report, CSI = California Solar Initiative, SGIP = Self-Generation Incentive Program, NEM = Net Energy Metering, EE = Energy Efficiency, DR = Demand Response, SCADA = Supervisory Control and Data Acquisition, DRP = Distribution Resource Planning, OEHHA = Office of Environmental Health Hazard Assessment, CAISO = California Independent System Operator, LMP = Locational Marginal Price, PSPS = Public Safety Power Shutoff
Source: Data Catalog
26
Key Dataset Findings Findings from the evaluation of datasets relevant for DER planning include the following:
Advanced Metering Infrastructure Data Identified as Highest Priority Data Source AMI data, also known as “interval meter data,” are likely to be the most valuable data source not already used in the DIDF. In particular, when paired with LMP and customer tariff data, AMI data can unlock BTM DERs by identifying customers with the greatest potential to deliver cost savings to end-use customers and the grid.
See “Consumer Privacy and Market Appraisal Are Not Mutually Exclusive,” “Customer Energy and Cost-Savings Potential Is Invisible to DER Providers,” and related recommendations for working with AMI and maintaining privacy.
Data Included in the DIDF Focuses Exclusively on Distribution Deferral Value The datasets used in the DIDF proceeding capture deferral value of DERs at the exclusion of other potential values. DERs can deliver multiple services and capture the associated revenue streams, so analysis of DER potential must include data related to those additional values.
See “Deferral Value Alone Is Insufficient to Drive Optimal DER Deployment” and associated recommendation.
Significant EV Data Are Required to Inform Distribution Load Forecasting Granular data on EV adoption, charging, and travel behavior will be required to forecast, manage, and plan for a high transportation electrification future. Datasets to support high EV penetration include adoption, charging behavior, and location services data. Location services data include anonymous locations from GPS and cellular data that are used in both mobile devices and EVs. Such data, however, have been reported as prohibitively expensive.
See “Unmanaged Transportation Electrification Could Disrupt Grid Planning and Operations” and associated recommendation.
Data Catalog Datasets identified as valuable for the optimal siting and deployment of DERs are compiled into a data catalog, including information and characteristics about the datasets identified. Examples of the information captured are data origin, confidentiality, DER siting optimization uses, barriers to use, timeframe, update frequency, and level of detail or analysis. Moreover, when relevant, the data catalog includes contact information of the CEC or CPUC staff responsible for that dataset.
27
CHAPTER 4: Conclusions and Recommendations
This chapter summarizes the conclusions and corresponding recommendations presented in Chapters 2 and 3. The recommendations are intended for CPUC consideration over varying time frames.
Big Data Analytical Firm Market Assessment Three categories of conclusions were identified in the market assessment (Chapter 2): Data, Analytics, and Information, Economics and Value, and Emerging Trends. These findings and associated recommendations include:
1. Conclusion: Small Customer-Sited DERs Are a Largely Untapped Distribution Resource. Expanding the amount and type of DERs to support deferral requires including smaller, residential, or BTM resources or a combination, which individually can exhibit volatility. Recommendation: Use a Portfolio Approach to Manage Performance Risk. Large portfolios of smaller DERs, including energy efficiency and other BTM resources, can reliably deliver value to the distribution grid. Recent deferral tariff proposals from the CPUC align with this approach. Big data analytics can be leveraged to help providers and aggregators use these resources.
2. Conclusion: Consumer Privacy and Market Appraisal Are Not Mutually Exclusive. Analyzing datasets such as AMI is crucial for identifying opportunities for DERs to compete but raises privacy concerns. These concerns, however, can be addressed while still making use of the data. Recommendation: Apply Differential Privacy to Provide Insights Into Market Potential Without Compromising Customer Privacy Create proxy datasets of grid or AMI data or both using differential privacy that allow DER providers to assess the market potential of customers served by equipment with a projected grid need.
3. Conclusion: Customer Energy and Cost-Savings Potential Is Invisible to DER Providers. To increase penetration of DERs, providers must be able to identify and target high-value customers to keep costs down and DER performance up without compromising customer privacy. Recommendation: Combine Proxy Data With Open-Source Methods to Allow Utilities to Connect High-Potential Customers With DER Providers Open-source methods like CalTRACK can be applied to proxy data by DER providers and to actual data by utilities, allowing DER providers to connect with the types of customers they can best serve without compromising customer privacy.
4. Conclusion: Coordination Remains a Barrier to Multitechnology DER Packages. Optimal DER solutions will often comprise a suite of technologies, requiring multiple providers to cooperate. Recommendation: Facilitate Packages of DER Technologies to Meet Grid
28
Needs The IOUs could provide reference DER portfolios to DIDF participants and allow firms to adjust packages or provide other options to encourage innovation.
5. Conclusion: Transparent Accounting Methods Are Critical for DER Measurement and Verification. A consistent method to measure hourly BTM performance is needed to encourage desired policy outcomes. Recommendation: Use Open-Source Methods for Measurement and Verification. Apply CalTRACK’s open-source M&V methods, which are transparent, independently verifiable, and reduce M&V costs.
6. Conclusion: Deferral Value Alone Is Insufficient to Drive Optimal DER Deployment. DERs can provide several value streams but must be compensated appropriately. Recommendation: Facilitate Revenue Generation From the Full DER Value Stack, in Addition to Distribution Deferral. Distribution investment deferral avoided costs should be considered just one value of a larger stack. Current programs and proceedings, including retail tariffs, should allow DERs to access other revenue streams commensurate with value they provide.
7. Conclusion: Time- and Location-Dependent Energy Value Is Foundational to the Value Stack. Allowing DER owners and providers to earn the full energy value for BTM DERs can unlock their potential, especially when combined with deferral value. As electricity is a fundamentally time- and location-dependent good, accounting for the associated LMP is critical. Recommendation: Provide LMP-Based Tariff Options for DER Aggregators and Retail Customers Develop an opt-in retail tariff that reflects the general contours of wholesale LMPs and allow aggregators to earn wholesale LMPs for BTM DERs through CalTRACK-verified savings.
8. Conclusion: Forecast Certainty Metric Limits Deferral Opportunities. A qualitative metric screens out deferral opportunities that are less likely or expected far in the future, rather than valuing those opportunities accordingly. Distribution investment deferrals that are far in the future or relatively unlikely still have a present value. Recommendation: Calculate and Make Public the Expected Present Value for Wider Array of Deferral Opportunities Estimate and account for the probability of forecast grid needs and discount the resulting expected avoided cost into present value, including those that are less certain and over five years out. Require IOUs to make these values public.
9. Conclusion: Unmanaged Transportation Electrification Could Disrupt Grid Planning and Operations. Understanding where, when, and how EVs charge will be key to forecasting, planning for, and managing their growing load. Recommendation: Track Electric Vehicle Adoption and Behavior Spatially and Temporally Coordinate with CEC to integrate EV adoption, electric vehicle supply equipment, and, if possible, EV location services data into distribution planning functions. Assess options for making this data or insights derived from it available to
29
DER providers. In addition, consider flagging all grid needs and planned investments driven by transportation electrification in the future GNA and DDOR filings.
10. Conclusion: Electrification Load Growth May Preclude Some Distribution Deferral Opportunities. Electrification of transportation and other loads may require “wires” distribution investments. Recommendation: Study Potential Benefits of DER and “Wires” Combined Solutions. Explore opportunities to co-optimize DERs with distribution upgrades that expand capacity.
Datasets Relevant to DER Planning The CEC identified several important datasets for DER planning, including many that are not directly used in the GNA or DDOR analyses. Findings from the evaluation of datasets relevant for DER planning (Chapter 3) include the following:
11. Conclusion: Advanced Metering Infrastructure Data Identified as Highest Priority Data Source. AMI data are generally agreed to be the most important data type for unlocking BTM resource potential but are largely not in use. Recommendation: See Conclusion 2, “Consumer Privacy and Market Appraisal Are Not Mutually Exclusive,” and Conclusion 3 “Customer Energy and Cost-Savings Potential Is Invisible to DER Providers.”
12. Data Included in the DIDF Focuses Exclusively on Distribution Deferral Value. Optimal deployment of DERs requires integrated analysis of all possible value streams. Recommendation: See Conclusion 6, “Deferral Value Alone Is Insufficient to Drive Optimal DER Deployment.”
13. Conclusion: Significant EV Data Are Required to Inform Distribution Load Forecasting. EV registration, charging, and location data are crucial for managing growing EV load. Additional work will be needed to understand how and to what extent location and charging data can be made available. Recommendation: See Conclusion 9, “Unmanaged Transportation Electrification Could Disrupt Grid Planning and Operations,” and Conclusion 10, “Electrification Load Growth May Preclude Some Distribution Deferral Opportunities.”
This report focuses on datasets and analytical tools that can support cost-effective deferral of distribution grid infrastructure investments, but many of the findings are broadly applicable to DER and energy policy and can be applied to future research and policy development. Large amounts of data, paired with advanced analytics, or big data, are necessary to understand what drives DER adoption and behavior across diverse customer types, technologies, and weather conditions, to name a few. The CEC and CPUC will continue to study DER adoption and performance to date and analyze different DER policy frameworks to enable further growth in meeting the state’s clean energy goals, while maintaining value and reliability for all customers.
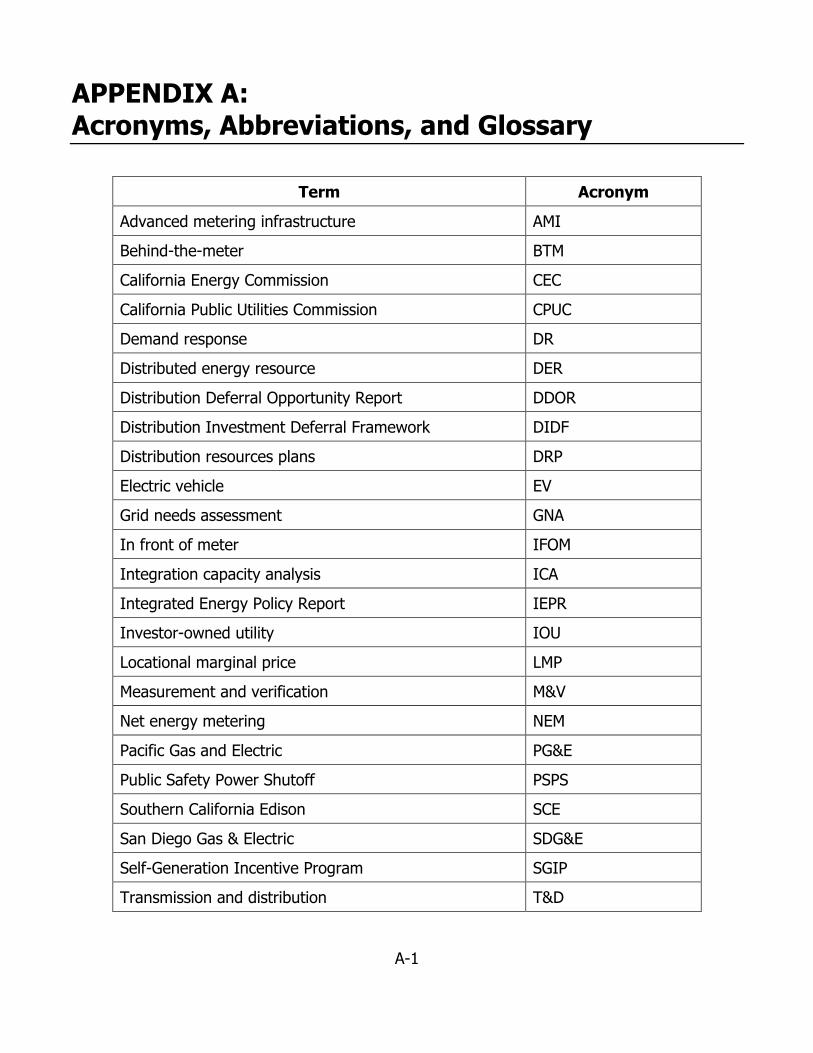
A-1
APPENDIX A: Acronyms, Abbreviations, and Glossary
Term Acronym
Advanced metering infrastructure AMI
Behind-the-meter BTM
California Energy Commission CEC
California Public Utilities Commission CPUC
Demand response DR
Distributed energy resource DER
Distribution Deferral Opportunity Report DDOR
Distribution Investment Deferral Framework DIDF
Distribution resources plans DRP
Electric vehicle EV
Grid needs assessment GNA
In front of meter IFOM
Integration capacity analysis ICA
Integrated Energy Policy Report IEPR
Investor-owned utility IOU
Locational marginal price LMP
Measurement and verification M&V
Net energy metering NEM
Pacific Gas and Electric PG&E
Public Safety Power Shutoff PSPS
Southern California Edison SCE
San Diego Gas & Electric SDG&E
Self-Generation Incentive Program SGIP
Transmission and distribution T&D
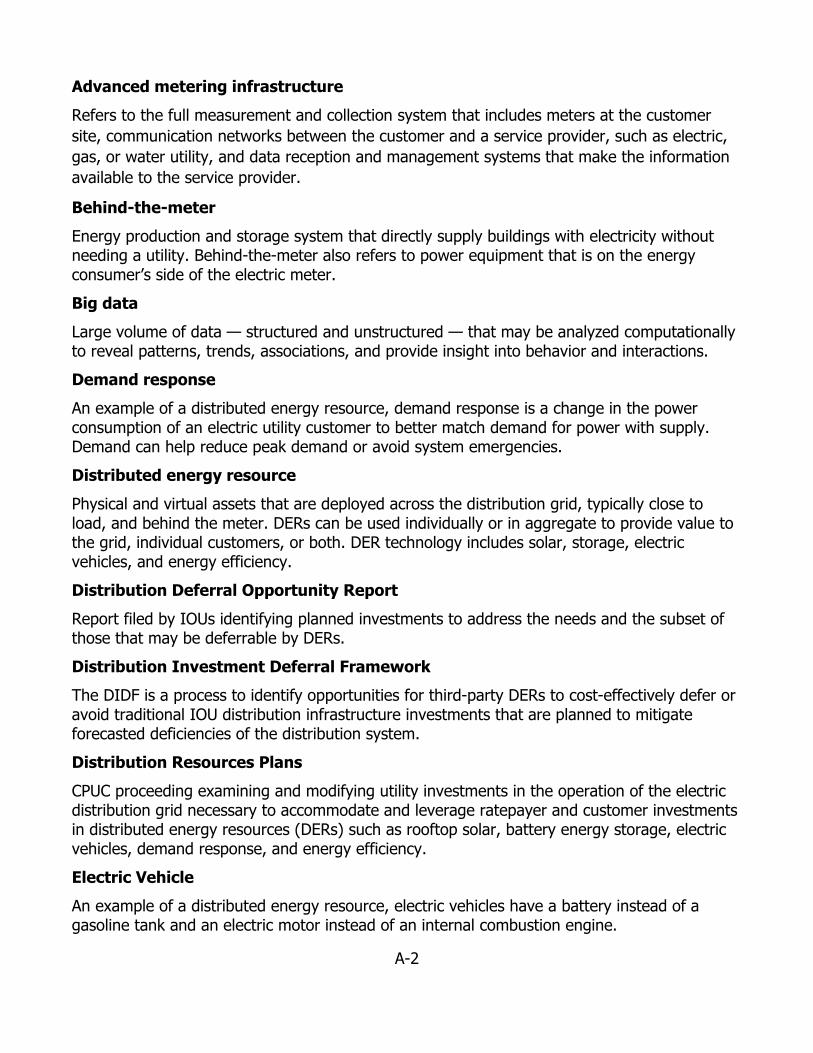
A-2
Advanced metering infrastructure Refers to the full measurement and collection system that includes meters at the customer site, communication networks between the customer and a service provider, such as electric, gas, or water utility, and data reception and management systems that make the information available to the service provider.
Behind-the-meter Energy production and storage system that directly supply buildings with electricity without needing a utility. Behind-the-meter also refers to power equipment that is on the energy consumer’s side of the electric meter. Big data Large volume of data — structured and unstructured — that may be analyzed computationally to reveal patterns, trends, associations, and provide insight into behavior and interactions. Demand response An example of a distributed energy resource, demand response is a change in the power consumption of an electric utility customer to better match demand for power with supply. Demand can help reduce peak demand or avoid system emergencies. Distributed energy resource Physical and virtual assets that are deployed across the distribution grid, typically close to load, and behind the meter. DERs can be used individually or in aggregate to provide value to the grid, individual customers, or both. DER technology includes solar, storage, electric vehicles, and energy efficiency. Distribution Deferral Opportunity Report Report filed by IOUs identifying planned investments to address the needs and the subset of those that may be deferrable by DERs. Distribution Investment Deferral Framework The DIDF is a process to identify opportunities for third-party DERs to cost-effectively defer or avoid traditional IOU distribution infrastructure investments that are planned to mitigate forecasted deficiencies of the distribution system. Distribution Resources Plans CPUC proceeding examining and modifying utility investments in the operation of the electric distribution grid necessary to accommodate and leverage ratepayer and customer investments in distributed energy resources (DERs) such as rooftop solar, battery energy storage, electric vehicles, demand response, and energy efficiency. Electric Vehicle An example of a distributed energy resource, electric vehicles have a battery instead of a gasoline tank and an electric motor instead of an internal combustion engine.
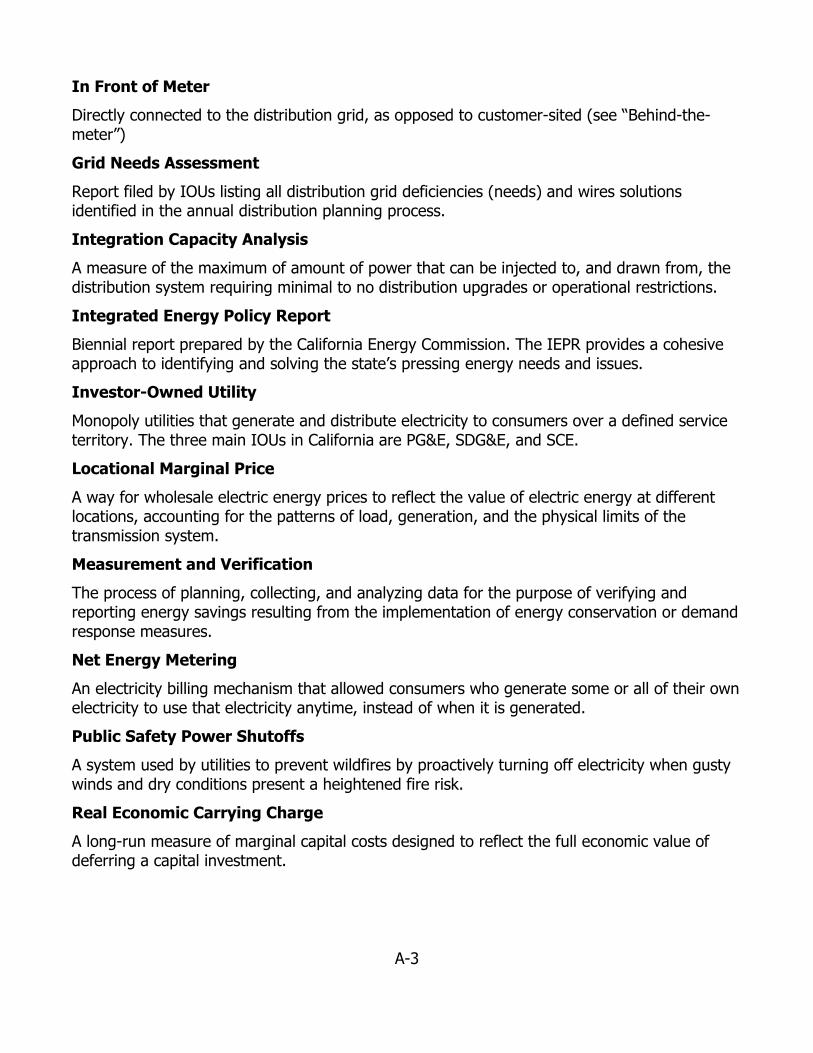
A-3
In Front of Meter Directly connected to the distribution grid, as opposed to customer-sited (see “Behind-the-meter”) Grid Needs Assessment Report filed by IOUs listing all distribution grid deficiencies (needs) and wires solutions identified in the annual distribution planning process. Integration Capacity Analysis A measure of the maximum of amount of power that can be injected to, and drawn from, the distribution system requiring minimal to no distribution upgrades or operational restrictions. Integrated Energy Policy Report Biennial report prepared by the California Energy Commission. The IEPR provides a cohesive approach to identifying and solving the state’s pressing energy needs and issues. Investor-Owned Utility Monopoly utilities that generate and distribute electricity to consumers over a defined service territory. The three main IOUs in California are PG&E, SDG&E, and SCE. Locational Marginal Price A way for wholesale electric energy prices to reflect the value of electric energy at different locations, accounting for the patterns of load, generation, and the physical limits of the transmission system. Measurement and Verification The process of planning, collecting, and analyzing data for the purpose of verifying and reporting energy savings resulting from the implementation of energy conservation or demand response measures. Net Energy Metering An electricity billing mechanism that allowed consumers who generate some or all of their own electricity to use that electricity anytime, instead of when it is generated. Public Safety Power Shutoffs A system used by utilities to prevent wildfires by proactively turning off electricity when gusty winds and dry conditions present a heightened fire risk. Real Economic Carrying Charge A long-run measure of marginal capital costs designed to reflect the full economic value of deferring a capital investment.
A-4
Self-Generation Incentive Program Program at CPUC that provides incentives to support existing, new, and emerging distributed energy resources. SGIP provides rebates for qualifying distributed energy resources installed on the customer’s side of the utility meter. Transmission and Distribution The different stages of carrying electricity over poles and wires from generators to an electricity consumer. The primary distinction between the two is the voltage level at which electricity moves in each stage. Transmission and distribution lines make up what is commonly called “the grid”. Transmission moves bulk electricity from generation sites over long distances to substations closer to areas with demand for electricity. Distribution is the delivery stage of electrical power from generation to consumer. Electrification The process of powering appliances, vehicles, and other energy end uses by electricity by changing over from a different energy source, which typically relies on the direct combustion of fuels. Value Stacking The bundling of grid applications or services for DERs to improve financial viability by creating multiple revenue streams.
B-1
APPENDIX B: Market Assessment Interview Guide
• Introduction: We are researching data and analytics tools that can support optimal deployment of distributed energy resources, or DERs, within the context of electric distribution grid investment deferral. This process is known as DIDF. The goal of the DIDF is to identify and deploy all cost-effective opportunities to avoid or defer planned investments. An additional goal is to create transparency in the distribution planning process by providing data that facilitates optimal customer siting of DERs.
o Before we begin, may we record this conversation? • Firm Background: Can you start by telling us a bit about your firm and its capabilities to
support optimal DER deployment? o How do your tools support DER siting optimization? o Why/how did your firm get into the DER business? o How do you define optimal DER deployment? o What are the main barriers to DER deployment that you see? Are barriers technical,
regulatory, policy, or other? Which of these does your firm address? • Software Details: Next, I’d like to dig into the specifics of your software tools and
services. o What stage of development is/are your firm’s tool(s)?
What are the current limitations of your tool? What features are you planning to add in the future?
o How do clients access your analytics platform? What is the user interface? Web-based, desktop app, GUI, script, and so on. Can clients run their own analyses or are your firm’s staff required?
o What customer training or support do you provide customers? Describe your business model for support.
o To what extent does your tool analyze secondary distribution grid needs and impacts?
• Analytics Approach: We’d like to know a little more about your firm’s approach to modeling.
o Data analysis tends to fall into categories of descriptive, predictive, and prescriptive. How does your tool align with these categories?
o Tell us about your approach to modeling in your tool. Are models intended to be interpretable or strictly predictive? Do models output forecasts (predictive) or projections (scenario-based)?
o How does your tool handle the intersection of technical, economic, regulatory, demographic, and other inputs?
• Key Datasets: Now we’ll move onto the types of data your firm uses or could use. o What are the key datasets your firm already uses, and how are they analyzed? o Do you have a “wish list” of data, and if so, what is at the top of the list?
Of these, which are most difficult to obtain? What are the barriers to retrieval?
B-2
o Other than the ones you’ve mentioned already, can you think of any other data that would be valuable for optimizing DERs for distribution investment deferral? Which datasets have the highest need for granularity? How so (temporally,
geographically)? Which can be aggregated? What data is needed to identify emerging trends? (for example,
electrification, EV adoption, behind-the-meter solar, COVID-19 new normal) How do you prioritize data to ingest into your tools, models, and analyses?
Availability vs. value? o How does your firm handle confidential, proprietary, or otherwise sensitive data? o In developing analytical tools, to what extent were you limited by the data that was
available? Did you develop these tools without regard for available data? Has data
availability limited the analytics performed by the tools? Was there any data you developed or collected yourself?
• Identifying opportunities to defer planned investments: The DIDF process begins with the Grid Needs Assessment (GNA), which identifies four grid deficiencies or “needs”: capacity, reliability, resiliency, and volt/VAR (voltage support and reactive power). From this list of needs, a corresponding list of planned traditional distribution investments is developed.
o Given a list of planned investments, what would you need identify opportunities to bid DERs that are cost-competitive with traditional investments? Reliability of forecasts? Additional value streams? Regulatory changes?
o The DIDF has been described as “California’s first permanent marketplace for third party-owned DERs to provide services to the IOUs’ distribution grids.” What is needed to develop a competitive market that DERs could successfully
participate in? o Virtually all DERs identified to date have addressed capacity needs.
Can DERs serve the other needs? If so, what are some potential needs, or need areas and how can we identify those DER opportunities?
How can existing grid needs be better defined (for example, resiliency)? • Other: What questions did we miss?
o Are there questions we should have asked that you would like to respond to? Or do you have any questions for us?