Embed Size (px)
Citation preview

California IOU Codes and Standards Program: OverviewOctober 11, 2010California Energy Commission, Staff Workshop
Docket No. 09-AAER-2; RE: 2010 Rulemaking proceedings Phase II on Appliance Efficiency Regulations
Presentation by: Pat Eilert, Pacific Gas and Electric Company

22
One IOU Statewide Program with Four Subprograms
Subprogram Activity
Appliance Standards
• Title 20: Develop Codes And Standards Enhancement (CASE) studies to document cost effectiveness and feasibility. Participate in public process.
• US DOE: Review and analyze US DOE public documents, conduct research, and develop comments.
Building Codes• Develop Title 24 CASE studies and support public process.• Engage in national standards activities that affect California.
Compliance Enhancement Support
• Outreach, education and training to industry groups engaged in compliance with building and appliance regulations.
Reach Codes: Local Government Ordinances
• Develop cost-effectiveness analyses in support of local government adoption of ordinances beyond Title 24 and support CEC approval.
2

33
Codes and standards have helped stabilize per capita electricity consumption
Sources: Analysis of EIA, US Census, and CEC data. See appendix for detailed sources
•C&S have contributed to relatively flat per capita electricity consumption in California since 1974•California leads the nation at nearly half the US average
44
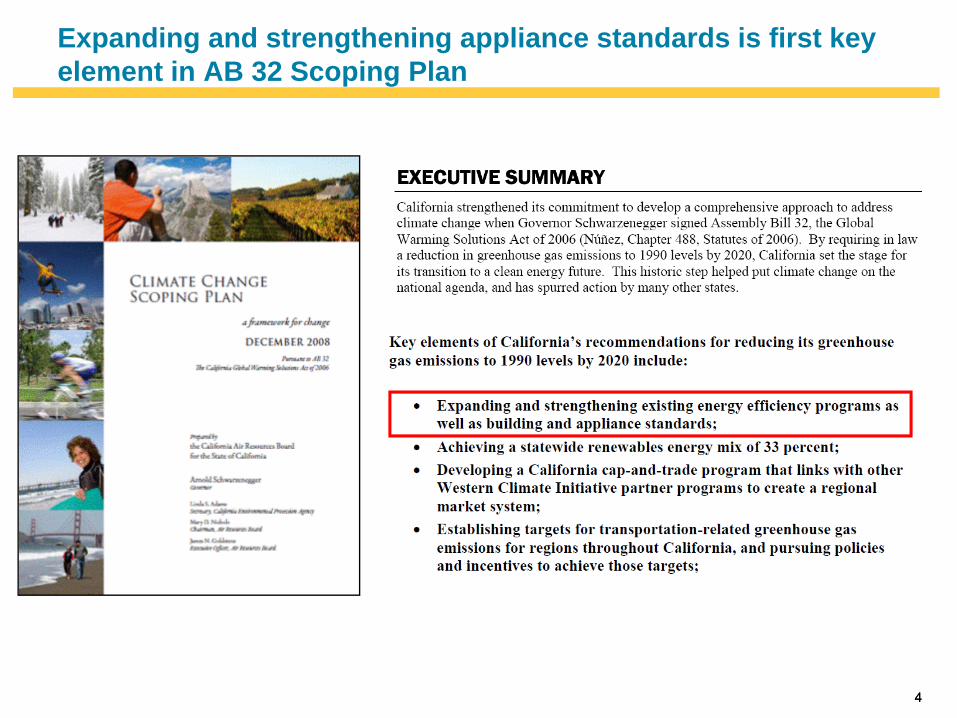
Expanding and strengthening appliance standards is first key element in AB 32 Scoping Plan

5
Meeting AB 32 electricity goals requires savings beyond “Committed” and “Uncommitted” IEPR Scenarios
Notes: Committed = Savings relative to AB32 baseline embedded in the 2009 Integrated Energy Policy Report Adopted Demand Forecast. Uncommitted = CEC savings scenarios (low, mid, and high) incremental to IEPR Demand Forecast. Savings are not “firm” or “locked-in” yet. Source: Analysis based on CEC 2009 IEPR.
Per capita electricity needs to drop 7% (or roughly 500 kWh/year per person) by 2020 to reach AB 32 energy efficiency goal.

66
California Long Term Energy Efficiency Strategic Plan: Vision, Goals, and “Big Bold Initiatives”
New Title 20 Proposals address strategic visions
New Title 20 Proposals
necessary for first two goals

77
Addressing Plug Load and Other Load Growth is a Critical Pathway
Source: Annual Energy Outlook 2010. Energy Information Administration. 2010 to 2030 population growth projected at 20%.
Note: Residential miscellaneous includes small electric devices, video and audio equipment, game consoles, coffee makers, and other uses. Commercial non-PC office equipment includes servers and mainframe computers. Commercial miscellaneous includes video displays, medical equipment, and other equipment.

88
California Long Term Energy Efficiency Strategic Plan:Specific Goals and Strategies
Source: http://www.californiaenergyefficiency.com/docs/CA_longterm_EE_Strategic%20Plan.pdf

99
Job creation in the energy sector
Notes:1/One job-year (or ‘‘full-time equivalent’’ FTE job) is full time employment for one person for a duration of 1 year.2/Values are averages across reviewed studies. Energy Efficiency range is 0.17 to 0.59 job-years/GWH3/The majority of jobs created from energy efficiency are from induced employment which accounts for the expenditure-induced effects in the general economy due to the economic activity and spending of direct and indirect employees, e.g. non industry jobs created such as teachers, grocery store clerks, and postal workers. When discussing energy efficiency, a large portion of the induced jobs are the jobs created by the household savings due to the energy efficiency measures. See appendix for job definitions. Values are for net job gains which take into account the job losses from less electric generation. 4/Source: Max Wei, Shana Patadia, and Daniel M.Kammen. Putting renewables and energy efficiency to work: How many jobs can the clean energy industry generate in the US? Energy Policy 38 (2010) 919–931.
“Non-fossil fuel technologies (renewable energy, EE, low carbon) create more jobs per unit energy than coal and natural gas”
-Recent study from Hass School of Business and the Energy and Resources Group, UC, Berkeley
10
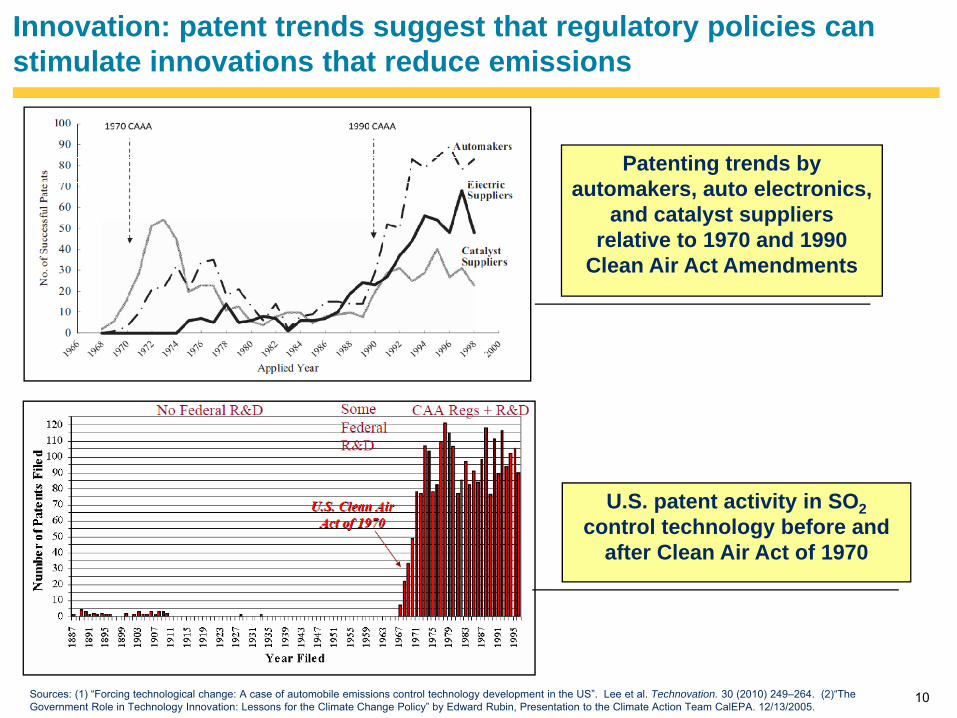
Innovation: patent trends suggest that regulatory policies can stimulate innovations that reduce emissions
U.S. patent activity in SO2control technology before and
after Clean Air Act of 1970
Patenting trends by automakers, auto electronics,
and catalyst suppliers relative to 1970 and 1990
Clean Air Act Amendments
Sources: (1) “Forcing technological change: A case of automobile emissions control technology development in the US”. Lee et al. Technovation. 30 (2010) 249–264. (2)“The Government Role in Technology Innovation: Lessons for the Climate Change Policy” by Edward Rubin, Presentation to the Climate Action Team CalEPA. 12/13/2005.

1111
APPENDIX

1212
Sources for Per Capita Energy Consumption
Population data▪ 1960 – 2009 (Historic)
– US Census, 1960-1990: http://www.census.gov/popest/archives/1980s/80s_st_totals.html
– US Census, 1990-2000: http://www.census.gov/popest/archives/1990s/ST-99-03.txt– US Census, 2000-2010: http://www.census.gov/popest/states/NST-ann-est.html
▪ 2010 – 2020 (Forecast)– EIA, Table 20 http://www.eia.doe.gov/oiaf/aeo/aeoref_tab.html– CEC: http://www.energy.ca.gov/2009publications/CEC-200-2009-012/index.html
Electricity Consumption▪ 1960 – 2009 (Historic)
– EIA: http://www.eia.gov/emeu/states/_seds_updates.html– EIA: http://www.eia.gov/state/SEP_MoreConsump.cfm
▪ 2010 – 2020 (Forecast)– CEC: http://www.energy.ca.gov/2009publications/CEC-200-2009-012/index.html– EIA, Table 2 http://www.eia.doe.gov/oiaf/aeo/aeoref_tab.html
1313
Job Creation Definitions
The definitions of direct, indirect, and induced jobs vary widely by study. Wei et al describes the definitions and usage of these categories as follows.
Direct employment includes those jobs created in the design, manufacturing, delivery, construction/installation, project management and operation and maintenance of the different components of the technology, or power plant, under consideration. This data can be collected directly from existing facilities and manufacturers in the respective phases of operation.
Indirect employment refers to the ‘‘supplier effect’’ of upstream and downstream suppliers. For example, the task of installing wind turbines is a direct job, whereas manufacturing the steel that is used to build the wind turbine is an indirect job.
Induced employment accounts for the expenditure-induced effects in the general economy due to the economic activity and spending of direct and indirect employees, e.g. non industry jobs created such as teachers, grocery store clerks, and postal workers. When discussing energy efficiency, a large portion of the induced jobs are the jobs created by the household savings due to the energy efficiency measures.
Source: Max Wei, Shana Patadia, and Daniel M. Kammen. Putting renewables and energy efficiency to work: How many jobs can the clean energy industry generate in the US? Energy Policy 38 (2010) 919–931.