Embed Size (px)
Citation preview

CAFE CBA – Draft Baseline Results
Paul Watkiss and Steve Pye, AEA Technology EnvironmentMike Holland, EMRCFintan Hurley, IOM

Update on Progress
Phase 1 = development and baseline
Draft final methodology completed early July 2004
2nd Stakeholder consultation workshop mid July 2004
Peer review August – September 2004
Alan Krupnick, Bart Ostro, Keith Bull
First application to baseline November 2004
Impacts (WG) today, valuation to follow later
Revised methodology report mid November 2004 (for SG 18th)
Application to scenario December onwards

Benefits Model Framework
Bring analysis of different impacts together – quantification and valuation – stock at risk, functions, values
Based around GIS
Take pollution concentration output from RAINS directly, though some additional work with EMEP data for additional pollutants
Work at 50 km2 resolution, with potential for higher resolution
Transparent framework – easy to update
Extended sensitivity analysis
Complemented by extended-CBA (qualitative) for some categories

Health Benefits Considered
Aim to undertake a HIA
Includes impacts with high confidence but also new impacts
Deaths brought forward from ozone
Chronic mortality from fine particulates (PM2.5) primary and secondary
Respiratory hospital admissions (ozone) and (PM10)
Restricted activity days (PM2.5) minor RAD (PM2.5, ozone)
Infant and childhood mortality (PM2.5)
Chronic bronchitis (PM2.5 chronic morbidity)
Respiratory symptoms in adults and in children (PM10)
Some additional impacts to finalise + sensitivity
RAINS +
CBA
CBA

Health Benefits Approach
% change in background rates with pollution increment
Issues with data collection for rates, especially in NMS
Issues with definitions between countries
Number of cases per 100,000 people per pollution increment
Based on original studies and rates
Run for baselines with and without climate measures
2000, 2010, 2020, where available 4 met years (22)

PM Baseline Impacts - RHA
2000 2010 2020

0
2000
4000
6000
8000
10000
12000A
ustr
ia
Bel
gium
Den
mar
k
Fin
land
Fra
nce
Ger
man
y
Gre
ece
Irel
and
Italy
Luxe
mbo
urg
Net
herla
nds
Por
tuga
l
Spa
in
Sw
eden U
K
Cze
ch R
ep
Est
onia
Hun
gary
Latv
ia
Lith
uani
a
Mal
ta
Pol
and
Slo
vaki
a
Slo
veni
a
BL_2000 BL_2010 BL_2020
PM and Respiratory Hospital Admission by EU country in 2000, 2010, 2020
EU25 49000/year in 2000 falling to 31000/year in 2020
PM Baseline Impacts - RHA

Baseline Infant Mortality Rates
2000 2010 2020

PM Baseline Impacts – Infant Mortality
2000 2010 2020

0
20
40
60
80
100A
ustr
ia
Bel
gium
Den
mar
k
Fin
land
Fra
nce
Ger
man
y
Gre
ece
Irel
and
Italy
Luxe
mbo
urg
Net
herla
nds
Por
tuga
l
Spa
in
Sw
eden U
K
Cze
ch R
ep.
Est
onia
Hun
gary
Latv
ia
Lith
uani
a
Mal
ta
Pol
and
Slo
vaki
a
Slo
veni
a
BL_2000 BL_2010 BL_2020
PM Baseline Impacts – Infant Mortality
PM and Infant (1-12 months) mortality by EU country in 2000, 2010, 2020
EU25 530/year in 2000 falling to 260/year in 2020
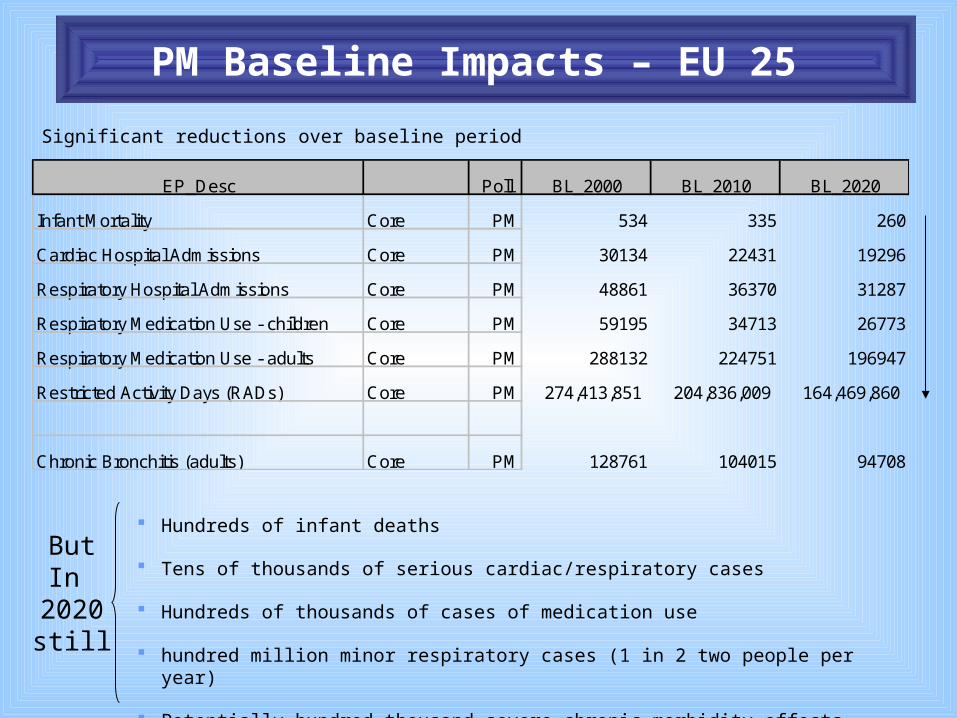
Significant reductions over baseline period
Hundreds of infant deaths
Tens of thousands of serious cardiac/respiratory cases
Hundreds of thousands of cases of medication use
hundred million minor respiratory cases (1 in 2 two people per year)
Potentially hundred thousand severe chronic morbidity effects
PM Baseline Impacts – EU 25
EP_Desc Poll BL_2000 BL_2010 BL_2020
Infant Mortality Core PM 534 335 260
Cardiac Hospital Admissions Core PM 30134 22431 19296
Respiratory Hospital Admissions Core PM 48861 36370 31287
Respiratory Medication Use - children Core PM 59195 34713 26773
Respiratory Medication Use - adults Core PM 288132 224751 196947
Restricted Activity Days (RADs) Core PM 274,413,851 204,836,009 164,469,860
Chronic Bronchitis (adults) Core PM 128761 104015 94708
ButIn
2020still

Ozone Baseline Impacts – RHA
2000 2010 2020

0
2000000
4000000
6000000
8000000
10000000
12000000
14000000A
ustr
ia
Bel
gium
Den
mar
k
Fin
land
Fra
nce
Ger
man
y
Gre
ece
Irel
and
Italy
Luxe
mbo
urg
Net
herla
nds
Por
tuga
l
Spa
in
Sw
eden
Uni
ted
Kin
gdom
Cze
ch R
epub
lic
Est
onia
Hun
gary
Latv
ia
Lith
uani
a
Mal
ta
Pol
and
Slo
vaki
a
Slo
veni
a
BL_2000 BL_2010 BL_2020
Ozone (SOM35) Baseline Impacts – mRAD
ozone and minor restricted activity day by EU country in 2000, 2010, 2020
56 million to 39 million EU25

Ozone Baseline Impacts – EU25
Mostly significant reductions over baseline period
Tens of thousands of deaths brought forward
Tens of thousands of serious cardiac/respiratory cases
Tens of millions of minor respiratory cases
EP_Desc Analysis_type Poll BL_2000 BL_2010 BL_2020
Acute Mortality Core O3 22032 19606 18861
Respiratory Hospital Admissions Core O3 13203 10979 9789
Minor Restricted Activity Days (MRADs) Core O3 55,909,387 46,167,934 38,649,878

Sensitivity Analysis
Also calculated
Chronic mortality PM, expressed in numbers of deaths (now part of Core analysis)
Acute mortality PM
Sensitivity of ozone effects with no threshold
EP_Desc Poll BL_2000 BL_2010 BL_2020
Asthma consultations (0-14) Sensitivity PM 139701 81923 63184
Asthma consultations (15-64) Sensitivity PM 238369 177930 142866
Asthma consultations (65+) Sensitivity PM 103430 97049 115143
MRADs Sensitivity PM 21,612,782 16,858,562 14,772,984

Next Steps
Remaining issues
PM10 vs PM2.5 metric and conversion
Data on background rates
Some remaining functions (both sensitivity vs. core)

Valuation
Total economic cost from air pollution in 2000, 2010, 2020
For acute morbidity, annual rates directly assessed from impacts
For chronic effects, note not an annual effect
Move towards a new sustained pollution level – total benefits for the population over future years
Consistent with standard economic analysis – discount benefits in future years (e.g. consistent with accidents in transport)
Evidence from NewExt shows that people do discount, in relation to willingness to pay for a change in risk of death now vs. later

Man-Made and Natural Environment
Damage to buildings – corrosion and soiling
Crops
Ecosystems
Cultural Heritage
Other (visibility)
Social (employment, deprivation/inequality)
Ancillary (greenhouse gas emissions)
Economic (employment/growth)
Quantified and monetised
impact pathway
Extended CBA
Outside coreanalysis

Stock at Risk – e.g. Wheat

Next Steps
Valuation of materials
Some minor amendments from ICP materials (April next year)
Crops – flux based approach based on Defra work
Finalised March next year
Interim position – quantify using existing data and approaches

Conclusions
Methodology peer review and agreed – into model (GIS benefit tool)
Demonstrated working model on benefits
Linked to RAINS output – demonstrated models work together to provide consistent outputs and analysis
Draft analysis of baseline complete – benefits (physical units)
Initial conclusions - move from mortality to morbidity will be significant in terms of the ‘evidence for health and air pollution’ – numbers of cases in millions
Next steps
Incorporation of EMEP transfer matrix data for all pollutants (additional to those needed in RAINS)
Valuation – how much does air pollution cost the EU each year?
Scenario analysis

Presentation of the results
Quantification of costs with uncertainties (RAINS)
Quantification of impacts (RAINS/ALPHA2)
Monetisation of impacts where possible
Initial comparison of costs and benefits
Extended CBA
Uncertainty analysis for benefits Bias analysis Statistical analysis Sensitivity analysis
Further comparison of costs and benefits Uncertainties GEM-E3 outputs, competitiveness, employment

Quantified impacts
Region
EU25
EU15
New Member States
UNECE
Individual countries
Economic basis
By scenario
Marginal

Quantification of impacts
EP_Desc Poll BL_2000 BL_2010 BL_2020
Infant Mortality Core PM 534 335 260
Cardiac Hospital Admissions Core PM 30134 22431 19296
Respiratory Hospital Admissions Core PM 48861 36370 31287
Respiratory Medication Use - children Core PM 59195 34713 26773
Respiratory Medication Use - adults Core PM 288132 224751 196947
Restricted Activity Days (RADs) Core PM 274,413,851 204,836,009 164,469,860
Chronic Bronchitis (adults) Core PM 128761 104015 94708

Initial comparison of costs and benefits
Are model estimate benefits > model estimate costs?
What is the ratio of costs to benefits?
Is this likely to change much when uncertainties are accounted for?

Extended CBA
Previously called ‘MCA’, ‘modified MCA’
Purpose
Raise profile and understanding of unquantified impacts
Are these effects so important that they would change views on the balance of costs and benefits?
Improve understanding of the impacts that we do quantify

Questions addressed through theExtended CBA
What is…
…acute mortality?
…chronic bronchitis?
…eutrophication?
…etc.
How important are effects in the broader European context
…health effects caused by pollution vs. total effects?
…visible injury on crops from ozone exposure?
…pollution damage to Europe’s cultural heritage?

Extended CBA and chronic bronchitis
Definition of impact: Bronchitis is an inflammation of the bronchi, the air passages connecting the windpipe (trachea) with the sacs of the lung (alveoli) where oxygen is taken up by the blood. This inflammation causes excessive phlegm (or mucus) production and swelling of the bronchial walls, resulting in cough and the expectoration of phlegm. Chronic bronchitis is defined to be the occurrence of chronic cough or chronic phlegm for at least three months of the year, for at least two years.
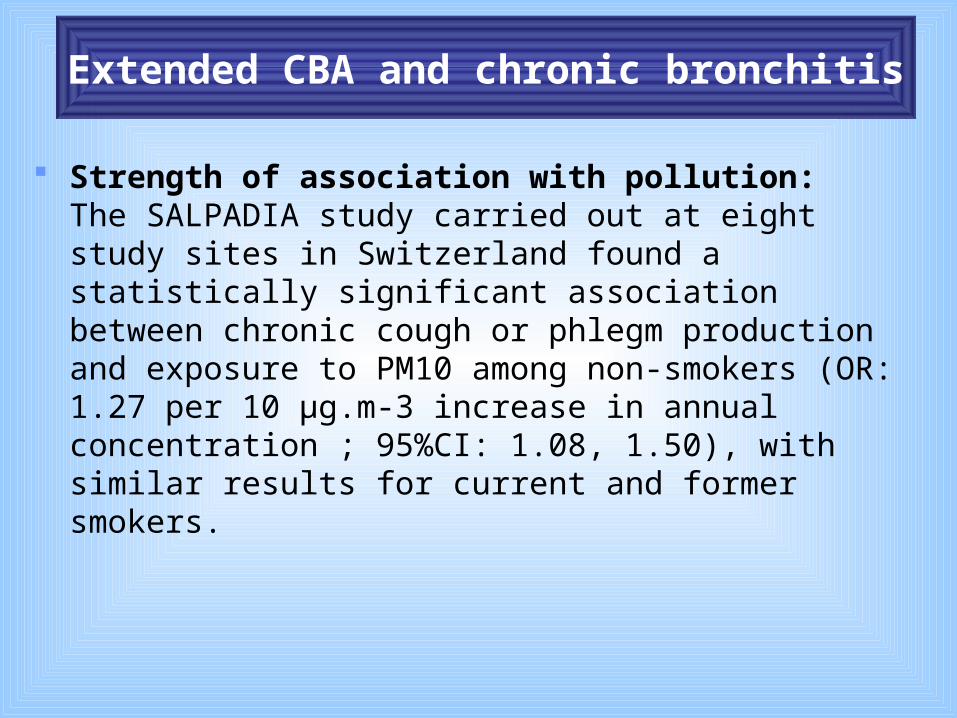
Extended CBA and chronic bronchitis
Strength of association with pollution: The SALPADIA study carried out at eight study sites in Switzerland found a statistically significant association between chronic cough or phlegm production and exposure to PM10 among non-smokers (OR: 1.27 per 10 μg.m-3 increase in annual concentration ; 95%CI: 1.08, 1.50), with similar results for current and former smokers.

Extended CBA and chronic bronchitis
Treatment of impact: There is no cure for chronic bronchitis, and treatment is primarily aimed at reducing irritation in the bronchial tubes. Chest infections are common in those with chronic bronchitis, and these can be treated with antibiotics. In addition, bronchodilator drugs may be prescribed to help relax and open up air passages in the lungs.
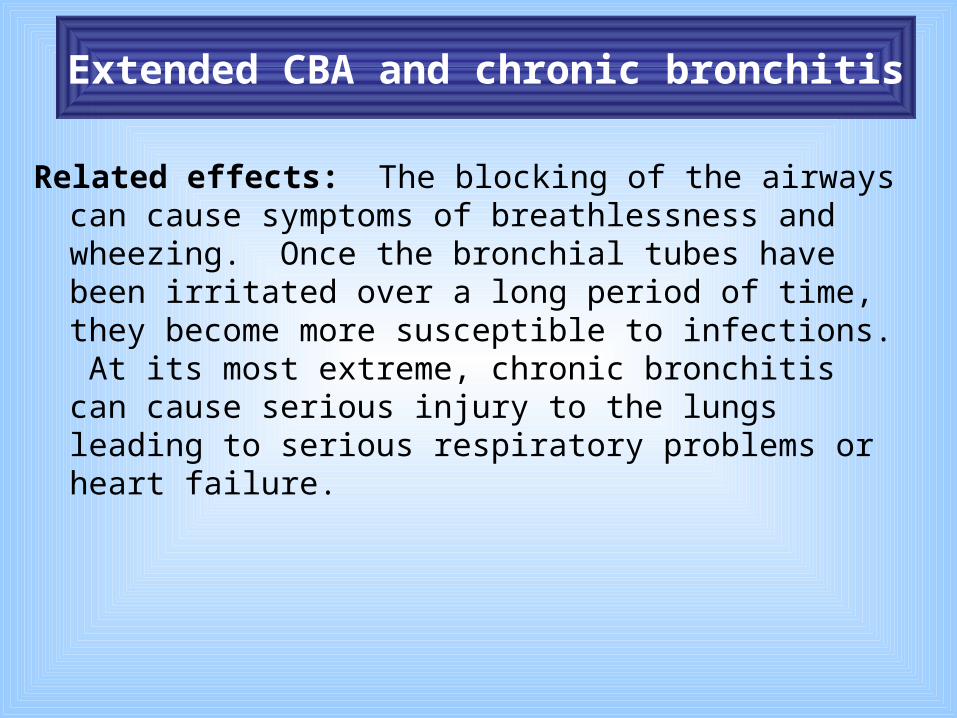
Extended CBA and chronic bronchitis
Related effects: The blocking of the airways can cause symptoms of breathlessness and wheezing. Once the bronchial tubes have been irritated over a long period of time, they become more susceptible to infections. At its most extreme, chronic bronchitis can cause serious injury to the lungs leading to serious respiratory problems or heart failure.

Extended CBA and chronic bronchitis
Frequency of occurrence of impact: Information from the ‘Global Burdens of Disease’ study estimates an annual incidence of chronic obstructive pulmonary disease (approximately equivalent to chronic bronchitis) in the WHO Europe sub-region of 770,000 in a population of 877,866,000; which is a rate of 88 per 100,000.

What this would give us…
A nice description of impacts
Mix of quantitative and qualitative data
Buried at the back of a long report
How do we draw attention to the things that we cannot monetise?
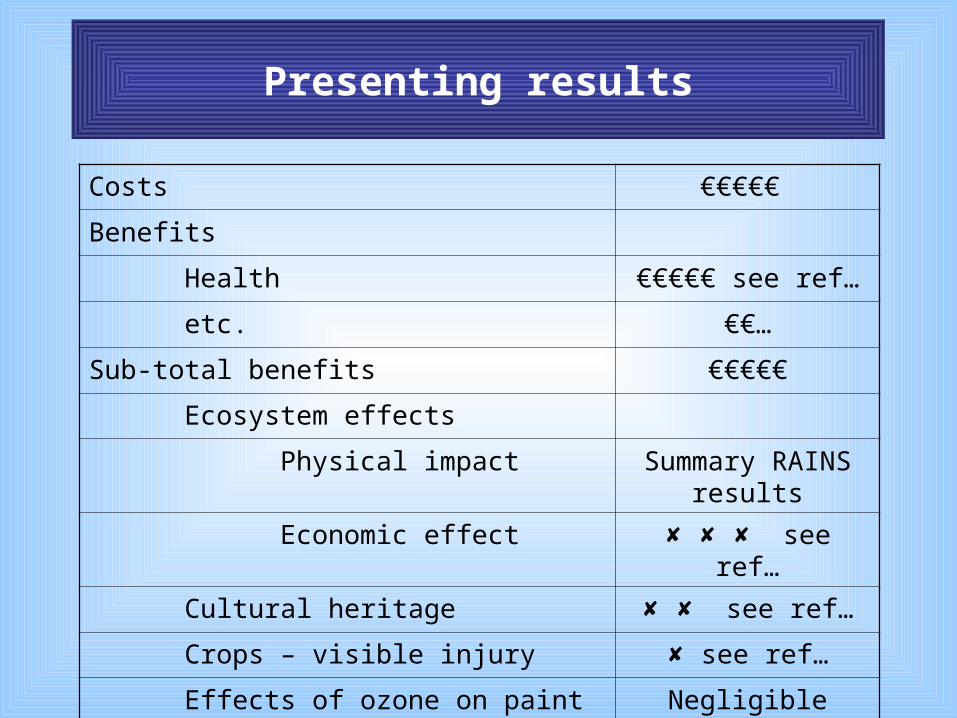
Presenting results
Costs €€€€€
Benefits
Health €€€€€ see ref…
etc. €€…
Sub-total benefits €€€€€
Ecosystem effects
Physical impact Summary RAINS results
Economic effect see ref…
Cultural heritage see ref…
Crops – visible injury see ref…
Effects of ozone on paint Negligible

Key
Considered likely to have a significant effect at the European scale
May have a significant effect at the European scale
May have a significant effect locally, but not Europe-wide
Negligible Unlikely to be important at national or local scales

Conclusions on the role of the Extended CBA
Can integrate some impacts with CBA much better than previously
Improves understanding
Provides decision makers with a structure from which to factor their own weightings on damage to cultural heritage, ecosystems and other impacts into the CBA

Dealing with uncertainty
Variety of techniques
Extended CBA
Bias analysis
Statistical analysis
Sensitivity analysis

Bias analysis
Source of bias Effect
Omission of eutrophication impacts ---
Omission of acidification impacts ---
Omission of organic aerosol --
Use of health functions from western Europe --?
Use of incidence data from all Europe ++?
Effect of EU subsidy on world crop prices +
Limited availability of crop - ozone flux data +/-
…

Statistical analysis
To use @RISK
Account for uncertainty through the chain of quantification
Concentrate on the impacts that contribute most to total benefits

Sensitivity analysis
Again, focused on effects that contribute most to benefits, particularly mortality
Functions used
Baseline rates
Valuation procedure
Discounting

Summary
Much work has gone into refinement of methods for air pollution CBA including presentation and interpretation of outputs
Methodology has been extensively peer reviewed
More extensive framework than previously used
Unquantified effects
Description of uncertainties and their effects