Embed Size (px)
Citation preview

BIOACCUMULATION OF TRACE ELEMENTS BY BIVALVES IN THE ALTAMAHA
RIVER SYSTEM
by
W. AARON SHOULTS-WILSON
(Under the Direction of Marsha C. Black)
ABSTRACT
Trace elements occur naturally within the Earth’s crust but human activity can introduce
them into aquatic environments, resulting in elevated concentrations, potentially leading to
toxicity. The purpose of this dissertation was to evaluate a biomonitor approach for assessing
trace elements in the Altamaha River system. First, bioaccumulation of trace elements in the
Asian clam, Corbicula fluminea, was compared to that of the co-occurring native mussel, Elliptio
hopetonensis. Corbicula was shown to accumulate higher concentrations of several potentially
toxic trace elements (As, Cd, Cu and Hg) than E. hopetonensis. When compared across sites,
concentrations of As, Cd, Cu, Hg and Pb were correlated between the two species, supporting
Corbicula’s suitability as an indicator of concentrations in E. hopetonensis. A wider survey of
bioaccumulation using only Corbicula found significant sources of Cd, Cr, Cu, Hg and Zn within
the Altamaha system. Controlling for natural variation in environmental and individual
parameters eliminated some statistical significance in this survey. Site location in the watershed,
dissolved oxygen, sediment composition, concentrations of elements in the sediment and
organism length and condition were factors that influenced trace element bioaccumulation.
Finally, E. hopetonensis shells were sectioned and the trace element profiles of annuli were

analyzed using laser ablation inductively coupled plasma-mass spectrometry (LA ICP-MS). Mn
was found to accumulate in the shell in a seasonal manner. Using Mn profiles to compare shells
from the same site aligned peaks in Pb concentration were between shells. This indicates that
freshwater bivalve shells could serve as archives of the local environment. Overall, these
findings elucidate some of the aspects needed for a successful and informative biomonitoring
program for trace metals using freshwater bivalves, as well as suggesting some future methods of
biomonitoring.
INDEX WORDS: Altamaha River, biomonitor, bioaccumulation, Corbicula fluminea,
arsenic, cadmium, copper, mercury, lead, zinc, laser ablation, freshwater mussel, sediment, water chemistry.

BIOACCUMULATION OF TRACE ELEMENTS BY BIVALVES IN THE ALTAMAHA
RIVER SYSTEM
by
W. AARON SHOULTS-WILSON
BS Chemistry, Truman State University, 2003
A Dissertation Submitted to the Graduate Faculty of The University of Georgia in Partial
Fulfillment of the Requirements for the Degree
DOCTOR OF PHILOSOPHY
ATHENS, GEORGIA
2008

© 2008
W. Aaron Shoults-Wilson
All Rights Reserved

BIOACCUMULATION OF TRACE ELEMENTS BY BIVALVES IN THE ALTAMAHA
RIVER SYSTEM
by
W. AARON SHOULTS-WILSON
Major Professor: Marsha C. Black
Committee: Alan Covich Raymond Noblet Jay Overmyer
Electronic Version Approved: Maureen Grasso Dean of the Graduate School The University of Georgia December 2008

iv
DEDICATION
In loving acknowledgement of some of my greatest teachers, my grandparents: June
Meece (botany); Russell Meece (land management); Bill Wilson (zoology); Mary Wilson
(music).

v
ACKNOWLEDGEMENTS
First, I would like to thank my committee: Marsha Black, Alan Covich, Ray Noblet and
Jay Overmyer, for overseeing the evolution of this dissertation and for continually giving me
new ways to look at what I was doing. Especial thanks go to my advisor, Marsha Black, for her
unflagging support and optimism. From my first day here, she has provided me with the advice,
encouragement and direction that I needed. Jason Unrine deserves many thanks as a long-
serving committee member and for providing access to the instruments and expertise needed to
analyze my samples. Lynne Seymour and Jim Peterson patiently guided me through the
statistical methods that made this work possible. Jason Wiskniewski from GA DNR taught me
how to identify the mussels of the Altamaha and counted shell annuli. Jimmy Rickard at Fish &
Wildlife helped me to focus this study and helped me access sites via boat. A host of other
people also provided assistance with sampling: Jason Meador and Becky Fauver let me ride
along on their sampling trips and helped me with my collections; Miles Buzbee, Scott Small,
Keith Hastie, Marsha Black, Jimmy Rickard, and Jeff Turner all helped me with sampling on
various occasions. I am grateful for the support of my labmates: Suzy Baird, Deanna Conners,
Brad Konwick and Emily Rogers; as well as the rest of my friends at EHS: Carrie Futch, Bradd
Haley, Arena Richardson and Jeff Turner. My family is one of the central supports of my life,
especially my grandmother Mary Wilson, my sister Sierra Wilson and my parents, Randy and
Melissa Wilson, who first encouraged me to pursue a career in science. And then there is my
wife Rhiannon, who was with me every step of the way on this project and always helped me
remain positive. Financial support for this research came from the Fish & Wildlife Service and

vi
the University of Georgia via stipends and small equipment grants from the Interdisciplinary
Toxicology Program. I am also grateful to the University of Georgia Graduate School, for
providing support to me through a Presidential Fellowship.
vii
TABLE OF CONTENTS
Page
ACKNOWLEDGEMENTS.............................................................................................................v
LIST OF TABLES...........................................................................................................................x
LIST OF FIGURES ...................................................................................................................... xii
CHAPTER
1 INTRODUCTION .........................................................................................................1
References .................................................................................................................4
2 FRESHWATER MUSSELS (FAMILY UNIONIDAE), ASIAN CLAMS
(CORBICULA FLUMINEA), AND BIVALVE (CLASS BIVALVIA) SHELLS AS
BIOMONITORS OF TRACE ELEMENT CONTAMINATION ............................6
Abstract .....................................................................................................................6
Introduction ...............................................................................................................7
Overview of Exposure Routes and Bioaccumulation of Trace Elements in Bivalves
.............................................................................................................................9
Tissue Bioaccumulation of Trace Elements by Freshwater Bivalves .....................11
Bioaccumulation of Trace Elements in the Shell Annuli of Bivalves.....................21
Conclusions .............................................................................................................30
References ...............................................................................................................34
3 BIOACCUMULATION OF TRACE ELEMENTS BY CORBICULA FLUMINEA
AND ELLIPTIO HOPETONENSIS IN THE ALTAMAHA RIVER SYSTEM.....45

viii
Abstract ...................................................................................................................45
Introduction .............................................................................................................46
Materials and Methods ............................................................................................48
Results .....................................................................................................................52
Discussion ...............................................................................................................54
Conclusions .............................................................................................................59
Acknowledgments ...................................................................................................60
References ...............................................................................................................69
4 THE ASIAN CLAM CORBICULA FLUMINEA AS A BIOMONITOR OF TRACE
ELEMENT CONTAMINATION: ACCOUNTING FOR NATURAL
VARIATION WHEN IDENTIFYING ANTHROPOGENIC SOURCES .............75
Abstract ...................................................................................................................75
Introduction .............................................................................................................76
Materials and Methods ............................................................................................78
Results .....................................................................................................................84
Discussion ...............................................................................................................85
Conclusions .............................................................................................................93
Acknowledgments ...................................................................................................94
References .............................................................................................................103
5 USE OF AUTOREGRESSION TO ANALYZE LASER ABLATION
INDUCTIVELY COUPLED PLASMA-MASS SPECTROSCOPY DATA FROM
BIVALVE SHELLS..............................................................................................112
Abstract .................................................................................................................112

ix
Introduction ...........................................................................................................113
Materials and Methods ..........................................................................................115
Results ...................................................................................................................118
Discussion .............................................................................................................120
Conclusions ...........................................................................................................125
Acknowledgments .................................................................................................126
References .............................................................................................................139
6 CONCLUDING REMARKS.....................................................................................145

x
LIST OF TABLES
Page
Table 2.1: A table summarizing the criteria of good biomonitors, how closely they are met by
freshwater bivalves, with references relating to the appropriate point ...........................32
Table 2.2: Field studies that have analyzed intra- and/or inter-annual variability in trace element
concentrations of bivalve shells. .....................................................................................33
Table 3.1: Mean concentration of each element as it was accumulated by each species over all
sites .................................................................................................................................61
Table 3.2: A list of physical and environmental parameters significantly (p < 0.05) correlated to
the mean amounts of each element at each site as calculated by tissue concentration
(μg/g) or body burden (g) ...............................................................................................62
Appendix 3.1: Element concentrations (in μg/g) in the tissues of each bivalve species, given as
the mean of each site, plus or minus standard error........................................................73
Table 4.1: Best fitting models for each metal, with the model’s parameters, the number of
parameters (K), the residual sum of squares (RSS), the Aikake Information Criteria
(AICC), difference between the AIC of the model and that of the model with the lowest
AIC (Δi), and the Aikake weight (wi) .............................................................................95
Table 4.2: Selected linear hierarchical models for each trace element, with the predictors for each
model and percent decrease of τ00 (intrer-site variability) and σ2 (intra-site variability)96
Appendix 4.1: Concentrations (ppm, μg/g) of elements at each site in three compartments: water,
sediment and Corbicula tissues ....................................................................................110

xi
Table 5.1: Mean concentrations of elements (μg/g of Ca43), size parameters (shell length, height,
depth and shell weight) and estimated number of annuli ablated (i.e. number of years
the trace element data represents) of individual shells analyzed in this study. Average
values for each site are given in bold............................................................................127
Table 5.2: Correlations between Mn data series for shells within a given site, at the lags selected
for greatest average correlation.....................................................................................128
Table 5.3: The fit of the least squares lines for the Mn data series, calculated for a linear
regression (Lin) and a linear autoreggression (Auto) ...................................................129
Table 5.4: Autoregression models for Mn data series, including number of cyclical components,
% of cyclical components that are significant (α = 0.10) and MSE for both the least
squares (LS) model and the least squares model with cyclical components (LSCC)...130
Appendix 5.1: Correlations between different elements within the same shell...........................143
Appendix 5.2: The correlation between Cd, Cu, Pb and Zn from different shells at the lags
determined by correlations between Mn data series .....................................................144

xii
LIST OF FIGURES
Page
Figure 3.1: A map of sites sampled within the Altamaha River system........................................64
Figure 3.2: The natural log of mean metal(loid) concentration in the tissue of E. hopetonensis at
each site, plotted as a function of the natural log mean concentration in the tissue of
Corbicula.......................................................................................................................65
Figure 3.3: The natural log of mean metal(loid) body burden of E. hopetonensis at each site,
plotted as a function of the natural log mean body burden of Corbicula......................66
Figure 3.4: Mean tissue concentrations found in Corbicula and E. hopetonensis of A) As and Cd;
B) Cu and Zn; C) Hg and Pb at each site, arranged up to downstream.........................67
Figure 4.1: Map of the locations sampled in this study .................................................................98
Figure 4.2: Average Corbicula tissue concentrations of (A) Cu and Zn; (B) As, Cd and Cr; and
(C) Hg and Pb of clams found upstream and downstream of sites of interest: Amercord
tires (AMC), Little Commissioner’s Creek (LCC), Kettle Creek (KC), Plant Hatch
(PH), Rayonier (RAY), and Reidsville State Penitentiary (RSP) .................................99
Figure 4.3: Differences in mean Corbicula tissue concentrations of (A) Cu and Zn; (B) As, Cd
and Cr; and (C) Hg and Pb between clams found upstream and downstream of sites of
interest: Amercord tires (AMC), Little Commissioner’s Creek (LCC), Kettle Creek
(KC), Plant Hatch (PH), Rayonier (RAY), and Reidsville State Penitentiary (RSP) .101
Figure 5.1: Sampling locations on the Oconee (OCN) and Altamaha (ALT) Rivers..................132
Figure 5.2: Mn data series, offset by lags of highest overall concentration ................................133

xiii
Figure 5.3: Regressions (black lines) of mean Mn series (gray lines).........................................135
Figure 5.4: Mean Pb series (black line), offset by the same lags as the mean Mn series ............137

1
CHAPTER ONE
INTRODUCTION
The course of evolutionary and human history has rendered potentially toxic trace
elements such as arsenic (As), cadmium (Cd), chromium (Cr), copper (Cu), mercury (Hg), lead
(Pb) and zinc (Zn) among the hardest contaminants to monitor, mitigate and regulate. Unlike
organic xenobiotic contaminants (e.g. pesticides, pharmaceuticals, etc.) potentially toxic trace
elements occur naturally within the earth’s crust. With xenobiotic pollutants, the ultimate source
of contaminants is rarely in question: human beings manufactured these molecules and human
activity released them into the environment. On the other hand, certain mineral and soil
formations may carry naturally high levels of trace elements. These may leach into local streams
and wetlands and be taken up by plants and animals, masking the additions caused by human
activities.
Over time xenobiotic molecules decay, being metabolized by higher organisms or
degraded by microorganisms into smaller components. Trace elements do not degrade in the
same manner. Rather, they are passed from one environmental compartment to another, used as
catalytic centers by biomolecules, sequestered in soils and bioinorganic structures, transformed
into oxides, sulfides and nitrates and carried on air and waterborne particles: they remain
indestructible. Therefore, the pollution of the past continues to haunt us in the present. The
large amounts of trace elements belched up by the smokestacks of the industrial revolution leave
records in tree rings, peat bogs and stratified layers of sediment (Shotyk et al. 2003, Heim et al.
2004, Abreu et al. 2008). Attributing trace elements to current human activity must contend with
2
the distribution of elements of the geologic past, as well as all the redistributions during human
history.
Furthermore, xenobiotics are new chemicals. While their properties may be similar to
those of natural molecules, chemical alterations make them more likely to act as toxicants by
interacting with biochemical pathways in expected or unexpected manners. With trace elements,
the route between exposure and toxicity is less direct. Exposure throughout evolutionary history
has resulted in many trace elements (e.g. Ca, Cu, Fe, Mg, Mn, Se, Zn, etc) becoming a vital part
of the cellular machinery of living organisms (Silva and Williams 2001). These essential
elements are carefully regulated by biochemical mechanisms of uptake, sequestration,
accumulation, utilization and elimination in order to maintain ideal concentrations within the
tissues of organisms (Newman 1998). In fact, in some instance, trace element deficiency in an
environment can be as much or more detrimental to organisms as increased exposure.
A separate class of trace elements has no known biological function (e.g. Cd, Hg, Pb).
These non-essential elements can cause toxicity at low levels by disrupting biochemical
pathways and tend to accumulate to higher levels than essential elements because of relatively
inefficient biochemical detoxification and elimination pathways (Silva and Williams 2001).
With the notable exceptions of the non-essential elements, most trace elements are not inherently
toxic. However, for many of them (e.g. Ag, Al, As, Cr, Cu, Ni, Se, Sn, Zn) the potential for
toxicity is there, if organisms are exposed to higher levels than they are able to cope with.
Therefore, human activities that increase the levels of these trace elements in the
environment have the potential to adversely affect all exposed organisms. Currently, human
sources constitute large percentages of the trace elements that enter environmental compartments
(Callender 2005). Human activities have therefore caused a redistribution of trace elements on a

3
global scale, introducing them into systems where they would naturally exist in small amounts
and making them more readily available to organisms by extracting them from normally
inaccessible minerals.
In the southeastern United States, industry and urbanization, intensive cotton cultivation
and clear cutting have all led to vast shifts in environmental structure in the last two centuries
(Merchant 2007). One particular adverse effect of these environmental changes is the
endangerment of the world’s most diverse assemblage of freshwater mussel species (Williams et
al. 1993, Neves 1999, Strayer et al. 2004). As a hotspot for biodiversity, the southeast also holds
a large proportion of the nation’s endangered or threatened mussel species (Williams et al. 1993).
Even as conservation organizations attempt to preserve these species, the extreme drought of
2007 has demonstrated the difficulty in balancing human demands with those of endangered
species (AP 2007).
At the crossroads of biodiversity preservation and monitoring of contaminants lies
biomonitoring, an attempt to use living organisms as sensors of contamination. Using
biomonitors allows investigators to identify increases of contaminants in a biologically relevant
way by monitoring an organism’s interaction with this contaminant. This is especially important
for trace elements, when interactions between contaminant and organism can be subtle and
complex. Freshwater bivalves, including both native and invasive species, have long been
considered compelling candidates to be used as biomonitor organisms (Doherty 1990, Elder
1991). They could prove especially compelling monitors of pollution in the same areas that hold
threatened mussel species, because the physiology is bound to be more similar between two
bivalve species than between two less similar organisms.

4
In this dissertation, I apply the principles of biomonitoring using freshwater bivalves in
the Altamaha River, a Georgia watershed serving as habitat for threatened endemic freshwater
mussel species (Meador 2008). Chapter Two reviews some of the recent literature dealing with
the bioaccumulation of trace elements in freshwater mussels in general and in particular the
invasive Asian clam Corbicula fluminea. Special attention is given to the use of bivalve shells as
archival records of the environment and trace element exposure. In Chapter Three, the use of
Corbicula bioaccumulation as an indication of trace element contamination is compared to
bioaccumulation in a co-occurring native freshwater mussel (Elliptio hopetonensis). Species-
specific differences in tissue concentrations of trace elements, inter-site correlations between the
two species, spatial distribution of elements and potential confounding factors are analyzed and
discussed. Sampling over a wider area in Chapter Four, a method using bioaccumulation of trace
elements in Corbicula to analyze sources of contamination in the Altamaha River watershed is
investigated. Linear hierarchical models are used to remove naturally occurring variation in
tissue concentrations of trace elements. Finally, in Chapter Five, trace metals in the shells of the
freshwater mussel E. hopetonensis are analyzed as archival records of environmental conditions
and exposure to potentially toxic trace elements.
References
Abreu, S. N., A. M. V. M. Soares, A. J. A. Nogueira, and F. Morgado. 2008. Tree rings, Populus nigra L., as mercury data logger in aquatic environments: Case study of an historically contaminated environment. Bulletin of Environmental Contamination and Toxicology 80:294-299.
AP. 2007. Georgia's governor declares drought emergency. http://www.msnbc.msn.com/id/21393296/. Associated Press.
Callender, E. 2005. Heavy metals in the environment--historical trends in environmental chemistry, Lollar B.S. ed. 1 edition. Elsevier, Amsterdam, The Netherlands.

5
Doherty, F. G. 1990. The Asiatic clam, Corbicula Spp, as a biological monitor in freshwater environments. Environmental Monitoring and Assessment 15:143-181.
Elder, J., Collins, JJ. 1991. Freshwater molluscs as indicators of bioavailability and toxicity of metals in surface-water systems. . Reviews Environ Contam Tox 122:37-79.
Heim, S., J. Schwaubauer, A. Kronimus, R. Littke, C. Woda, and A. Mangini. 2004. Geochronology of anthropogenic pollutants in riparian wetland sediments of the Lippe River (Germany). Organic Geochemistry 35:1409-1425.
Meador, J. R. 2008. The development and evaluation of a freshwater mussel sampling protocol for a large lowland river. University of Georgia, Athens, GA.
Merchant, C. 2007. American environmental history : an introduction. Columbia University Press, New York.
Neves, R. J. 1999. Conservation and commerce: management of freshwater mussel (Bivalvia : Unionoidea) resources in the United States. Malacologia 41:461-474.
Newman, M. C. 1998. Fundamentals of ecotoxicology. Ann Arbor Press, Chelsea, MI.
Shotyk, W., M. E. Goodsite, F. Roos-Barraclough, R. Frei, J. Heinemeier, G. Asmund, C. Lohse, and T. S. Hansen. 2003. Anthropogenic contributions to atmospheric Hg, Pb and As accumulation recorded by peat cores from southern Greenland and Denmark dated using the 14C "bomb pulse curve". Geochimica Et Cosmochimica Acta 67:3991-4011.
Silva, J. J. R. F. d. and R. J. P. Williams. 2001. The biological chemistry of the elements : The inorganic chemistry of life. 2nd edition. Oxford University Press, Oxford ; New York.
Strayer, D. L., J. A. Downing, W. R. Haag, T. L. King, J. B. Layzer, T. J. Newton, and S. J. Nichols. 2004. Changing perspectives on pearly mussels, North America's most imperiled animals. Bioscience 54:429-439.
Williams, J. D., M. L. Warren, K. S. Cummings, J. L. Harris, and R. J. Neves. 1993. Conservation status of freshwater mussels of the United States and Canada. Fisheries 18:6-22.

6
CHAPTER TWO
FRESHWATER MUSSELS (FAMILY UNIONIDAE), ASIAN CLAMS (CORBICULA
FLUMINEA), AND BIVALVE (CLASS BIVALVIA) SHELLS AS BIOMONITORS OF
TRACE ELEMENT CONTAMINATION1
Abstract
Freshwater bivalves have received widespread interest as biomonitor organisms of
contaminants. This paper reviews recent studies using freshwater bivalves in general and the
Asian clam Corbicula fluminea in particular as biomonitors of potentially toxic trace element
contamination. Individual growth and size, the effects of seasonal fluctuations in temperature
and reproductive state, water and sediment chemistry and the differing biological and chemical
characteristics of trace elements have been reported to affect how bivalves accumulate trace
elements. Fewer attempts have been made to definitively link trace element accumulation to
adverse effects at higher levels of biological organization. A new approach to biomonitoring
analyzes growth annuli in bivalve shells for archival records of trace element exposure. Further
research in the field should focus on 1) explaining the effects of confounding factors such as size
and season of collection and how much variation they explain compared to anthropogenic inputs;
2) linking bioaccumulation to adverse effects; and 3) exploring the use of bivalve shells as
archives of trace element exposure.
1 Shoults-Wilson WA. Portions to be submitted to Hydrobiologia.

7
Introduction
A biomonitor organism is a species that has been chosen to provide indications of the
potential impacts of anthropogenic activities on wild populations. Anthropogenic impacts on
natural communities are numerous and include alteration of habitat, direct harvest of certain
species, disruption of naturally occurring nutrient cycles and the introduction of increased
amounts of toxic elements or compounds. Typically, biomonitor organisms are employed to
determine the impacts of contaminants such as pesticides, other organic xenobiotic compounds
and potentially toxic trace elements that are released into a system due to human activities.
Several criteria must be considered in order to determine the suitability of candidate
biomonitor species based on Elder (1991): 1) tolerance to the contaminants in question; 2)
mobility, with less mobile organisms preferable; 3) a life span long enough to allow sampling of
multiple age-classes; 4) ubiquity and abundance at sites of interest; 5) ability to obtain enough
tissue for appropriate analyses; 6) ability to survive sampling and laboratory testing disturbances;
7) ease of identification and sampling; 8) display of a metric of exposure to the contaminant(s) of
interest; 9) a link between this metric and metrics of environmental health or special concern
(Table 2.1).
One group of organisms that have become common biomonitors in both marine
(Farrington 1983) and freshwater (Elder 1991) systems are bivalve species [class Bivalvia
(McMahon 2001)]. Bivalves are mollusks, which secrete a calcium carbonate shells in two
halves (or valves) with an external hinge. They are primarily filter feeders, drawing water in
through a siphon and removing suspended food particles, although they can use their muscular
“foot” to sweep food particles into their shell cavity (Reid et al. 1992, McMahon 2001).

8
The suitability of freshwater bivalves as biomonitors according to the criteria listed
previously is summarized in Table 2.1. Briefly, freshwater mussels are large, mostly sedentary
organisms, which burrow in the sediment of aquatic systems and move very little even during
storm surges (Imlay 1982, Schwalb and Pusch 2007). Mussels in the family Unionidae are
typically long lived (up to 20 years maximum age on average), while other freshwater bivalves
(such as clams of the family Corbiculidae) have shorter life spans (up to 3-4 years maximum
age) (Vaughn and Hakenkamp 2001). They are usually resistant to a wide array of contaminants
and can survive short-term disturbances, although these characteristics are species specific (Elder
1991). Freshwater mussels typically colonize aquatic habitat in areas of dense aggregation
known as beds, making abundance within a system extremely patchy (Strayer 1999, Morales et
al. 2006, Strayer 2008). While they can easily be sampled from wadeable portions of streams, it
can be difficult to distinguish certain species (Campbell et al. 2005). The final two criteria
(metric of exposure and correlation to environmental health) are the subject of most research on
the suitability of bivalve species as biomonitor organisms. Findings vary between studies,
species and contaminants of concern.
The purpose of this review is first to summarize research that has investigated the use of
freshwater bivalves as biomonitor of a diverse group of potentially toxic contaminants: trace
elements (e.g. As, Cd, Cr, Cu Hg, Pb, Zn, etc). Several reviews have previously been published
on trace metal accumulation in bivalves, including one focusing on all freshwater mollusks
(Elder 1991); another specific to the use of the invasive Asian clam Corbicula fluminea
(Doherty 1990); another specific to employing bivalve shells to monitor metals (Imlay 1982);
and more recently a mini-review devoted to the ecotoxicology of metals on freshwater mussels
(Naimo 1995). This review will include elements of all of these reviews and synthesize the

9
issues involving investigating the bioaccumulation of trace elements by freshwater mussels and
Corbicula fluminea (hereafter Corbicula) and the use of mussel shells as biomonitor surrogates.
This final section will be given special attention, with a focus on the analysis of growth annuli in
bivalve shells for trace element composition.
Overview of Exposure Routes and Bioaccumulation of Trace Elements in Bivalves
A bewildering array of natural processes define how trace elements move in the
environment and are eventually accumulated by aquatic organisms. As described in Foster and
Charlesworth (1996), trace elements entering fluvial systems are primarily sorbed to particulate
matter and sediment, especially very fine sediment. Trace metals in sediments can exist in a
variety of chemical states and complexes, which may be more or less available for uptake by
benthic organisms (Salomons et al. 1987, Tessier and Campbell 1987, Foster and Charlesworth
1996). Freshwater bivalves, as organisms that actively burrow in sediment and feed on detrital
deposits, are more likely than many other organisms to be exposed to trace elements bound to
sediments. For instance, Tessier et al. (1984) found that Cu, Pb and Zn bound to iron (Fe)
oxides, organic matter and sulfides were best predictive of accumulation in Elliptio complanata.
Applying a more rigorous approach, Tessier et al. (1993) developed a model for Cd
accumulation in Anodonta grandis that included Fe oxide, organic matter, pH and Cd
concentration in lake sediments as predictors. These biogeochemical models indicate that the
major factors affecting bioaccumulation are related to the chemistry of the surficial sediment that
provides bivalves with habitat.
Alternatively, the biodynamics concept has been proposed as a means of understanding
the effects of four primary factors on bioaccumulation: “metal specificity, environmental
influences, exposure route, and species-specific characteristics” (Luoma and Rainbow 2005).

10
This approach typically uses controlled, laboratory experiments to determine the kinetics of
uptake and loss of trace elements via various pathways. These results are used in the dynamic
multi-pathway bioaccumulation model (DYM-BAM) to predict the concentration of
contaminants in an organism at steady state (CSS):
CSS = [(ku * CW) + (AE * IR * CF)] / (ke + g)
Where ku is a constant of uptake, CW is the water concentration of the element in questions, AE
is a measure of assimilation efficiency from food for that element, IR is a rate of food intake, CF
is the concentration in food of the element of question, ke is a constant of elimination, and g is
the rate of growth of the organism (Luoma and Rainbow 2005).
The DYN-BAM model of accumulation has been applied to a wide variety of aquatic
invertebrates, as reviewed and synthesized by Rainbow (2002) and Wang & Fisher (1999). A
principle finding from these studies has been that metal accumulation is proportional to the
assimilation efficiency (AE) of metals from food (Wang and Fisher 1999). The implication of
this finding is that most bioaccumulation of metal occurs from exposure. This is not surprising,
considering that the concentrations of metals found in food resources, sediment and particulates
are usually orders of magnitude higher than aqueous concentrations.
Most of the biodynamic modeling to date has focused on marine species of bivalves such
as the blue mussel Mytilus edulis (Wang and Fisher 1999), the clam Macoma balthica (Griscom
et al. 2002) and the green mussel Perna viridis (Shi and Wang 2005). However, the same
conclusions appear to hold true for freshwater bivalves. For instance, Roditi & Fisher (1999)
reported that the freshwater zebra mussel, Dreissena polymorpha accumulate up to 100 times the
amount of the elements Ag, C, Cd, Hg and Se from food than water. A further experiment in the

11
field found that D. polymorpha accumulates most of its Ag, Cd and Hg from ingested particulate
matter and dissolved organic carbon (Roditi et al. 2000b, a).
Tissue Bioaccumulation of Trace Elements by Freshwater Bivalves:
The bioaccumulation of trace elements by freshwater mussels has been more
exhaustively reviewed in Elder and Collins (1991), while the use of Corbicula as a biomonitor
for trace elements was first reviewed by Doherty (1990). Therefore, this paper will review more
recent studies using freshwater bivalves (especially Corbicula) as biomonitors of trace elements,
with a focus on the issues involved in interpreting those results.
Tissue Specific Bioaccumulation
Bioaccumulation of trace metals has been shown to occur at different concentrations in
different tissues of freshwater mussels, although the distinct tissues vary from study to study.
For instance, Adams et al. (1981) found Cd and Zn concentrated in the gills of transplanted
Amblema perplicata when those tissues, along with foot, mantle viscera, were analyzed
separately. The zebra mussel D. polymorpha and a co-occurring mussel Mytilopsis leucophaeta
have been found to accumulate more Cd, Cu and Zn in the byssus (proteinaceous threads used to
attach to hard substrate) than the soft body tissue or shell (Van der Velde 1992). Gundacker
(2000) divided Unio pictorum and Anodonta sp. into viscera, gill, mantle, adductor muscle and
shell. The gills of both species had some of the highest concentrations of Cd, Cu, Pb and Zn,
while the shell tended to have the lowest concentrations of these elements.
Investigations into the tissue-specific accumulation of trace elements in Corbicula have
been limited and primarily investigated in a laboratory environment, probably due to the small
size of the organisms. In a study that combined water and sediment exposures, inorganic and
methylated Hg and Cd predominantly accumulated in the viscera and gills, rather than the

12
mantle, foot or kidney tissues (Inza et al. 1997). Similar results were obtained in another
laboratory study (Baudrimont et al. 1997) but with the gills showing higher accumulation of Cd
and Hg, followed by viscera and the other tissues. These studies both indicate that Corbicula
probably accumulates trace elements in a manner similar to freshwater mussels, with gills
accumulating higher concentrations, although mussel viscera have not been shown to have
significantly higher concentrations of Cd, Pb, or Zn (Adams et al. 1981, Gundacker 2000).
Conners et al. (1999) reported Pb concentrations in Corbicula shells up to 89% greater than that
of the adductor muscle and foot tissues. Such high concentrations in shells contradicts to the
findings of Gundacker (2000) who discerned no significant difference in Pb concentrations
between shells and adductor muscles in two freshwater mussels. This discrepancy may be
explained by the difference between controlled laboratory experiments (Sturresson 1976,
Almeida et al. 1998, Conners 1999) that have regularly reported Pb concentrations in bivalve
shells 1 to 2 orders of magnitudes higher than those found by field studies (Bourgoin and Risk
1987, Bourgoin 1990, Gundacker 2000). In other words, a controlled laboratory environment
introducing environmental media enriched in trace elements may influence the distribution of
those elements in the tissues of biomonitor organisms. One possible explanation is that the
coping mechanisms used by bivalves to survive acute doses of trace elements may differ from
those used in dealing with the chronic exposure that is more common in the natural environment.
Furthermore, it may be related to the preference in laboratory studies for aqueous exposure,
while most environmental accumulation is related to dietary exposure.
A little understood aspect of trace element bioaccumulation is the effect that the presence
of other trace elements has on mechanisms of accumulation. Studies into tissue-specific
distributions of trace elements have touched on this issue, which is undoubtedly a factor in the

13
environment where all trace elements naturally occur, although usually absent in most laboratory
studies which are often concerned with only a single element. A 1986 laboratory study (Cassini
et al.) found Cd exposure to increase Zn concentration in the gills of Anodonta cygnea but not
Unio elongatulus. Other studies suggest that rather than Cd affecting Zn accumulation, Zn exerts
an antagonistic effect on Cd accumulation, not surprising given that both elements favor a 2+
oxidation state and have a similar ionic radius. The conclusions of Hemelraad et al. (1987)
indicate that A. cygnea exposed to Zn as well as Cd accumulated lower concentrations of Cd
overall, specifically in the gills, with slightly higher levels of Cd accumulated in the midgut. A
more recent study reached similar conclusions for D. polymorpha and Corbicula, with Zn/Cd
mixtures causing the bivalves to accumulate lower concentrations of Cd than exposure to Cd-
only solution (Marie et al. 2006). These studies demonstrate just one of the many interactions
that may occur between trace elements in the environment.
Seasonal Differences in Accumulation
It is necessary to consider the season of collection when using freshwater bivalves as
monitors of trace elements. It is commonly assumed that seasonal changes in organism tissue
mass (caused by the reproductive cycle) and environmental concentrations of trace metals
(caused by high flow events) will result in different tissue concentrations of trace elements
(Abaychi and Mustafa 1988, Luoma et al. 1990). However Couillard et al. (1995b) found during
the course of a year-long transplant study using Pyganodon grandis that while the mussels’
condition (tissue dry wt / shell wt) changed in a seasonal manner, tissue concentrations of Cd and
Zn were more closely related to environmental concentrations of those metals. A study using the
Brazilian mussel Anodontites trapesialis found seasonal differences in the concentration of Cd
and Pb only at two sites (Tomazelli et al. 2003). Again, point source proximity was more

14
important in explaining Pb accumulation. Finally, while Angelo et al. (2007) found evidence of
seasonally variable water and fine sediment concentrations of Cd, Pb and Zn caused by high-
flow events, they concluded that these affected metal accumulation less than anthropogenic
inputs when compared across a wide area.
Seasonality has also been implicated as a factor influencing the accumulation of trace
elements in Corbicula. This is a reasonable assumption, since Corbicula only feed and grow for
a certain portion of the year when the water temperature is above 14˚ C (Joy 1985). Studies in
artificial streams have shown increased accumulation of Cd with increased temperature (Graney
et al. 1984). Biodynamic models for Corbicula indicate that it accumulates Cu primarily from
dietary sources (Croteau et al. 2004, Croteau and Luoma 2005). Therefore the biodynamic
theory predicts seasonal differences in accumulation based on metabolic activity and sources of
food, such as seasonal algal blooms.
Actual field verification of seasonality in trace metal bioaccumulation has been more
conclusive for Corbicula than for other freshwater mussel species. Abaychi and Mustafa (1988)
found temporal variability in the concentrations of Cd, Cu, Fe, Mn, Ni, Pb, V and Zn in water,
suspended particles and Corbicula tissue. However, they did not determine the statistical
significance of this fluctuation or the causal agent, limiting the strength of their conclusions. In a
3-year study in Suisun Bay, Luoma et al. (1990) showed seasonal fluctuations in Corbicula
condition (calculated dry weight of a 3.5 cm clam) and Cd, Cr, Cu and Zn in both Corbicula and
fine sediment. They found a correlation between Cd and Cu with the flow regime of the
Sacramento River but determined that temporal change in Cr accumulation was driven by
emissions from a local steel plant. They recommended temporally intensive monitoring, with
yearly averages being used to determine spatial trends in trace element contamination.

15
Relations Between Trace Element Accumulation and Bivalve Age and/or Size
Another oft-sited consideration in freshwater bivalve biomonitor studies is the size or age
of the organism (Millington 1983, Elder 1991). Studies using freshwater mussels that address
this factor are aptly summarized in Metcalfe-Smith et al. (1996). Few general conclusions can
be drawn about the relation between mussel size and metal accumulation. Metcalfe-Smith et al.
concluded that size and age should be included when designing a monitoring program but that
distinctions should be made between “contaminated” and “clean” sites, which will show
different ranges of accumulation. They also suggested that condition (tissue dry weight / shell
volume) serves as a better indicator of size than shell length for many elements (e.g. Cd, Cu, Mn
and Pb). However, Perceval et al. (2006) found that age was not a good indicator of metal
accumulation in P. grandis.
With regards to shell length as a variable affecting accumulation, broad conclusions are
also difficult to draw. Naimo et al. (1992) found Zn to be significantly concentrated and Cu to
be significantly less concentrated in larger individuals of Amblema plicata plicata. However, Cd
and Hg accumulation showed different relationships to growth depending on the sampling site.
A potential confounding factor in the results presented by this study was their use of size classes,
which essentially transformed length from a continuous variable into a discrete variable. They
also did not allow mussels to depurate before dissection, which meant that they measured metals
sorbed to gut contents as well as those assimilated into tissue. A similarly limited study found a
larger size class of Mytilaster lineatus to accumulate significantly higher concentrations of Cu
and lower concentrations of Pb than a smaller size class (Pourang 1996).
Comparing size classes to determine correlations between accumulation and length has
also been used in studies utilizing Corbicula as a biomonitor, probably to facilitate pooling of

16
tissues in for analysis. The size class approach was used by Abaychi and Mustafa (1988) to
conclude that smaller Corbicula accumulated significantly higher concentrations of Cu, Ni, Pb
and Zn as well as lower concentrations of Cd. In clams sampled from the Rio de lat Plata
(Argentina), Bilos et al. (1998) found larger size classes to accumulate higher concentrations of
Cu and lower concentrations of Zn. Sebesvari et al. (2005) showed a positive correlation
between size class and Sn accumulation but not As accumulation. In their study of a mining-
impacted watershed, Angelo et al. (2007) found lower concentrations of Cd in smaller size
classes but larger concentrations of Pb. Comparing size classes from a relatively uncontaminated
site to data from more contaminated sites, they concluded that environmental factors, rather than
individual clam size, accounted for more spatial variation.
The problem with assessing the effects of organism size using size classes is that
Corbicula have been shown to spawn in distinct, homogenously sized cohorts in certain systems
(Stites et al. 1995). In other words, effects on accumulation implied to be a function of growth
may be a function of cohort age. Because Corbicula grow at different rates under different
conditions, size classes cannot easily be applied across multiple sites where cohorts may grow at
different rates (i.e. this would involve comparing older, slower growing cohorts to younger,
faster growing cohorts). Using lengths and tissue concentrations of individuals, Peltier et al.
(2008) found a significant negative relationship between length and Cd accumulation but no
correlation with As, Cu, Hg, Se or Zn. Because length only explained 3-9% of variation in trace
element concentrations, they concluded that land cover was a better predictor. Clearly, more
work needs to be done in examining the relationship between size and the accumulation of trace
elements. Advanced analytical techniques can analyze individual organisms, allowing size to be
used as a continuous, rather than a discrete variable. Removing the variability related to size

17
from bioaccumulation data will ensure that erroneous conclusions are not drawn about the
relative contamination of different sites.
Relating Bioaccumulation to Water and Sediment Sources of Trace Elements
A central idea behind many biomonitoring efforts is that biomonitor organisms take up
trace elements from the environment and thus their levels of bioaccumulation can be correlated
to concentrations of that element in the local environment. This approach has been employed to
some extent with various freshwater mussels. Adams et al. (1981) found A. perplicata to
accumulate higher concentrations of Zn and Cd at sites with higher concentrations of those
elements in the sediments. D. polymorpha from 20 sites on the Mosel River showed no
correlation between tissue and water concentrations of Cd, Cr, Cu and Zn but did show a
correlation for Pb (Mersch 1992). Five sites in the Mirgenbach reservoir showed a tissue/water
correlation with Cu but with none of the other metals. Looking at several tissues and several
environmental compartments, Gundacker (2000) correlated tissue concentrations of Pb and Zn in
Anodonta to fine (< 23 μm) sediments, and Cd in U. pictorum tissues to concentrations in the
sediments. The general trend seen in data gathered from freshwater mussels is for stronger
correlations between bioaccumulated trace elements and the concentrations in local sediments,
rather than those in ambient waters at the time of sampling.
Many more biomonitoring studies of this type have been conducted using Corbicula,
with many of them reviewed by Doherty (1990). For example, laboratory studies have
demonstrated that Corbicula can accumulate Cd, Cu and Zn from water exposure in a dose-
dependent manner (Graney et al. 1983); accumulate Cu from water in a dose-dependent manner
(Harrison et al. 1984); accumulate Pb but not Cd from sediments (Tatem 1986); and accumulate
Cd and Hg from the water column in a dose-dependent manner (Inza et al. 1998). Most studies

18
carried out in aquaria and artificial streams tend to focus on the overlying water column as the
primary source of metals. Taking this approach is complicated by the natural response of
Corbicula to contaminants, which is to close valves and lower respiration in order to limit
exposure (Doherty et al. 1987). In other words, Corbicula will bioaccumulate trace elements in a
manner that is more likely to reflect chronic exposure to trace elements rather than brief
exposure. As a longer term depository of trace elements, sediments are more commonly
correlated to Corbicula tissues in field studies (Foster and Charlesworth 1996).
In a field study on the Apalachicola River, Elder and Mattraw (1984) found a significant
correlation between fine sediment and Corbicula tissue concentrations for As but not for Cd, Cr,
Cu, Pb or Zn. This finding contradicts several studies and is most likely due to Elder and
Mattraw’s difficulty in detecting elements in Corbicula tissues. They also collected Corbicula
and sediments from separate, nearby sites but treated them as though they came from the same
site. More recently, Villar et al. (1999) concluded that Cd accumulation in Corbicula and
Limnoperna fortunei was linked with sediment loads, while Cu and Zn accumulation was not
related to sediment concentrations. Andrès et al. (1999) found that Cd accumulated in relation to
the amount of Cd in the water column but that Zn showed no similar correlation. A number of
other studies previously discussed in this review have shown poor agreement between Corbicula
and water Cd, Cu, Fe, Mn, Ni, Pb, V and Zn (Abaychi and Mustafa 1988); apparent, but non-
significant, correlations between sediment and Corbicula Cd, Cr, Cu, Pb and Zn (Luoma et al.
1990); and stronger relationships between bioaccumulation and free ion concentrations
(calculated from sediment) for Cd than for Cu and Zn (Perceval et al. 2006). A repeated finding
in field surveys of Corbicula is that trace element concentrations in clam tissues are more likely
to be correlated to sediment concentrations than water. However, essential metals such as Cu

19
and Zn seem to be less likely to show a correlation between tissue and environmental
compartments than nonessential elements such as Cd. This is not surprising, considering the
higher biochemical controls that are exerted on Cu and Zn concentrations. Conclusions on the
environmental compartments that can be linked to bioaccumulation must therefore be made on
an element-by-element basis.
Relating Bioaccumulation to Adverse Effects
The ultimate goal for biomonitoring studies it to relate metrics that are analyzed (e.g.
tissue concentrations of a metal) with both organism impairment and human activity. In this
way, the amount of impairment caused by human activities can be quantified and monitored.
Attempts to connect mussel bioaccumulation of metals to deleterious effects in the environment
have met with mixed results. For instance, while Vinot & Pihan (2005) found that D.
polymorpha accumulated Cu from algae and transferred it to molluscivorous fish, they could
only speculate on potential ecotoxicological effects. Using P. grandis, Couillard et al. (1995a)
attempted to link bioaccumulation to all levels of organization. Their study examined
biomarkers (cellular level), growth (individual level) and reproductive (population level)
endpoints in P. grandis with increased Cd and Zn accumulation. They found increased oxidative
stress and decreased growth with metal accumulation but could not unambiguously make
conclusions at the population level because of the difference in response between transplanted
and local mussels (Couillard et al. 1995a). A later study using the same protocol found that the
calculated free ion of Cd2+ could be correlated to decreased population and fecundity endpoints
(Perceval et al. 2004). However, much of the variation in Cd2+ could be explained by
environmental factors such as dissolved organic matter and degree days (a function of time that
varies by temperature), thus indicating that lake morphometry could be structuring populations

20
more than Cd contamination. A 13-year study in the same smelter-impacted region of Canada
found that metal accumulation in P. grandis decreased as smelter emissions decreased (Perceval
et al. 2006) proving its effectiveness as a biomonitor of smelter pollution. Finally, in one of the
more convincing studies, Angelo et al. (2007) found that local extirpation or decreased richness
of native mussel assemblages was correlated to higher levels of Cd, Pb and Zn in mussel tissues
and fine sediments.
These studies demonstrate the difficulties in initiating and interpreting the results of a
biomonitoring program based on the bioaccumulation of trace elements by mussels. In addition
to the considerations already discussed, numerous papers have noted differences in accumulation
between different mussel species sampled at the same site (Van der Velde 1992, Metcalfe-Smith
et al. 1996, Gundacker 2000, Angelo et al. 2007). Because freshwater species can have fairly
restricted ranges, it can be difficult to compare the results of one biomonitor to another in
locations where different species overlap.
As with freshwater mussels, few studies have attempted to link trace metal
bioaccumulation to endpoints that demonstrate a detrimental effect to Corbicula. Returning to
Luoma et al. (1990), this study correlated decreased condition (calculated dry weight of a 3.5 cm
individual at a certain sampling site/date) with Cd and Cu in sediment and Corbicula tissue.
Paggi et al. (2006) examined the entire benthic community in a contaminant plume and found
Corbicula to be a sensitive species to Cr pollution but did not measure bioaccumulation. Other
studies have found Corbicula survival and growth to react to inputs of acid mine drainage and
nutrients (Soucek et al. 2001), as well as impacts from other coal-related activities such as
mining, burning, and waste disposal (Hull et al. 2006). In these studies, bioaccumulation of trace
metals was not measured, although contaminant sources were likely to contain increased loads of

21
trace elements. There is a large gap in our understanding between the bioaccumulation of trace
elements by biomonitor bivalves and the effects on the health of the aquatic system the
biomonitor organism represents.
Bioaccumulation of Trace Elements in the Shell Annuli of Bivalves
The calcium carbonate shells of freshwater bivalves have also been described as
potentially useful in the biomonitoring of trace element contamination (Imlay 1982). As they
grow, bivalves secrete sequential layer of shell to contain their increasing tissue mass. In many
climates, shell growth occurs in an annual fashion, with most growth occurring during periods of
the warmest water temperatures (Dunca et al. 2005). The patterns laid down by these layers are
typically used to age the bivalves, with sectioning the shell to reveal internal growth rings
considered the most accurate method (Neves and Moyer 1988). During shell growth, many trace
elements are incidentally incorporated into the shells of bivalves (Imlay 1982), making them
suitable as components of a biomonitoring study. More so than tissues, shells could theoretically
serve as long-term records of trace element exposure.
Early investigations into the trace metal accumulation in freshwater mussels are reviewed
thoroughly by Imlay (1982). These studies mainly used whole-shell analysis for metal
concentration, an approach that has not been wholly abandoned. Studies previously mentioned
in this study (Van der Velde 1992, Gundacker 2000) compared the trace element concentrations
in tissues of mussels collected in the field to concentrations in shells. In all instances, the shell
was found to accumulate (in some cases significantly) lower concentrations of trace elements.
Markich et al. (2002) found significant correlations between Velesunio angasi shell
concentrations of Co, Cu, Mn, Ni, U and Zn and the concentration found in the surface water (all
concentrations standardized by Ca). They further found significant correlation between Cu, Ni

22
and Zn concentrations in the shell to those in the sediment (sediment concentrations standardized
by Fe). Carroll and Romanek (2008) found that Mn and Sr in the shells of E. complanata from
various sites correlated to concentrations collected in the overlying water over a 2-year period.
Non-Toxic Trace Elements in Bivalve Shells: Ba, Mg, Mn and Sr
More detailed investigations of bivalve shells have approached them as recorders of
environmental condition and sampled within individual growth rings, attempting to determine
seasonal or annual differences in trace element concentration (see Table 2.2 for a summary of
studies). Earlier attempts at analyzing separate annuli relied on ashing shells and physically
breaking annuli apart (Imlay 1982, Neves and Moyer 1988). These approaches have been
superseded by newer instrumental techniques, which can analyze elemental profiles over a very
small area of shell. The principle technique used in this manner is laser ablation inductively
coupled plasma-mass spectroscopy (LA ICP-MS). The many analytical uses of LA ICP-MS are
reviewed in Russo et al. (2002), while the issues surrounding calibrating LA ICP-MS for studies
of biogenic calcium carbonate are explored in several papers (Vander Putten et al. 1999, Bellotto
and Miekeley 2000, Craig et al. 2000, Barats et al. 2007). These advances in analytical
capability have made it possible to analyze small fluctuations in the elemental composition of
shell annuli, potentially identifying seasonal trends or anomalous events resulting from increased
exposure to trace elements.
Strong evidence has emerged from studies on estuarine and marine bivalves that non-
toxic trace elements such as Ba, Mg, Mn and Sr are deposited into the shell in a manner driven
by environmental parameters. The estuarine clam Mya arenaria showed clear correlation
between peaks in Sr/Ca ratios and winter (low temperature) annuli (Palacios et al. 1994). The
same relationship was found in Spisula solidissima, while Mercenaria mercenaria shells showed

23
the opposite relationship to season (Stecher et al. 1996). Regular Sr peaks corresponding to
seasonal cycles of growth, have also been found in Arctica islandica (Toland et al. 2000), M.
edulis (Vander Putten et al. 2000), mangrove Isognomon ephippium (Lazareth et al. 2003),
Protothaca staminea (Takesue and Van Geen 2004) and in the scallop Pectens maximus (Freitas
et al. 2006). However, the cause of this annual fluctuation is a matter of debate. While Stecher
et al. (1996) demonstrated a correlation between Sr and δ18O [a standard measure of water
temperature at the time of shell formation; (Andrus and Crowe 2000)], Takesue and van Geen
(2004) argued that Sr peaks are more closely related to shell growth rate because their data could
not be well correlated to recorded water temperatures. Likewise, Vander Putten et al. (2000)
found that Sr did not co-vary with temperature. Modeling a larger number of environmental
parameters, Freitas et al. (2006) found temperature to best explain Sr/Ca shell formed in the
spring, while Mg/Ca best explained Sr/Ca incorporated in the summer, possibly due to the lattice
structure of calcium carbonate. These distinctions, while they do not change the seasonal
patterns of peaks, do indicate that Sr/Ca concentrations are the result of complex biogeochemical
processes.
Another environmental indicator analyzed in estuarine shells is Ba concentration. Ba
peaks in shell annuli are believed to represent times of greatly increased productivity, such as
periods of algal blooms (Stecher et al. 1996). In the same study discussed above, Stecher et al.
(1996) noted “sharp, episodic maxima” in Ba/Ca profiles that they associated with “episodic
phytoplankton blooms associated with increased nutrients and light fluxes in the spring.” Toland
et al. (2000) and Vander Putten et al. (2000) reported findings that agreed with this hypothesis,
while Lazareth et al. (2003) similarly found Ba/Ca peaks in a tropical coastal system were likely
driven by freshwater/nutrient inputs associated with the monsoon regime. A more thorough

24
approach by Gillikin et al. (2006) involving both laboratory studies and field transplants of M.
edulis firmly linked [Ba/Ca]shell to [Ba/Ca]Water. Although they could not link episodic Ba
maxima to chlorophyll a maxima at all sites, they concluded that barite formation during algal
blooms is one of the most likely answers for this phenomenon. Overall, the literature appears to
agree that Ba profiles in bivalve shells are governed by primary productivity and nutrient
availability.
A less well-researched element in bivalve annuli is Mg. Toland et al. (2000) assumed a
relationship between temperature and Mg defined the seasonal trends they found in the shells of
A. islandica. Year round Mg/Ca relationships to temperature were demonstrated by Lazareth et
al. (2003) and Takesue and van Geen (2004). However, Vander Putten (2000) found a strong
relationship between Mg/Ca in the shells of transplanted M. edulis and water temperature in the
spring that “broke down” during the summer months. Likewise, while Freitas et al. (2006)
observed a weak but significant correlation between temperature and Mg/Ca, they found that the
relationship differed during winter and summer months. The available findings therefore seem
to indicate that different controls affect Mg/Ca concentrations in marine or estuarine bivalves,
with temperature being a major factor for at least part of the year.
A final element thought to indicate environmental conditions is Mn. The first paper to
correlate Mn to estuarine environmental parameters is Vander Putten et al. (2000), who found
Mn to co-vary with Ba and chlorophyll a, thus linking Mn/Ca to primary productivity. The
findings of this study were seconded by that of Lazareth et al. (2003). However, Freitas et al.
(2006) determined that the seasonal Mn peaks seen in their study did not match local chlorophyll
a peaks or periods of Mn oxidation, but were more likely related to dissolved and particulate
concentrations of Mn. Unfortunately, this assessment was not based on directly measured Mn

25
concentrations during the study period but rather on records of seasonal Mn concentrations in the
study area from 20 years previous. Therefore, it may be more fitting to look at their findings in a
similar light to Ba analyses, in which Ba/Ca peaks could not be well correlated to the exact dates
of chlorophyll a peaks (Vander Putten et al. 2000, Gillikin et al. 2006).
Similar studies in freshwater bivalves have only been pursued in a few limited instances.
A study using Anodonta demonstrated possible seasonal fluctuations in Mn concentrations
(Lindh et al. 1988). The authors speculated that spring snow melt mobilized Mn, which was then
incorporated into the shell. A study employing freshwater pearl mussels, Margaritifera
margaritifera, found a poor relation of Sr/Ca to temperature but still found higher Sr
concentrations in winter growth bands and disturbance lines (Nystrom et al. 1996). Further, they
observed Mn peaks during times of high temperature and low dissolved oxygen, although they
did not attempt to correlate the two directly. Profiles of Mn obtained from Hyridella depressa
also showed seasonal peaks in Mn associated with organic-rich bands of winter growth (Siegele
et al. 2001). Langlet et al. (2007) found seasonal peaks of Mn in the shells of Pleiodon spekii
from Lake Tanganyika that they related to seasonal Mn upwellings and increased primary
productivity linked to the monsoon cycle. In their study of E. complanata, Carroll and Romanek
(2008) found that shells downstream of a lake showed regular peaks in Ba and Mn that they
speculated could correspond to phytoplankton availability. Furthermore, they found that a site
near a coal-fired power plant provided very different Ba, Mn and Sr profiles than those found at
other sites, which may indicate that pollution can alter the manner in which these trace elements
are incorporated into shells.
Explanations of trace element profiles in bivalve shells have in some cases agreed with
the conclusions of marine and estuarine researchers, for instance the finding that Mn is primarily

26
influenced by phytoplankton availability (Langlet et al. 2007, Carroll and Romanek 2008).
However, Nystrom et al. (1996) speculated that Sr was incorporated during growth cessation to
create higher density crystal lattices for protective purposes. They also saw a link in seasonal
lows of DO with peaks of Mn, caused by redox chemistry that made Mn more bioavailable.
With all of the many biogeochemical processes that go into bioavailability of trace elements and
their incorporation into bivalve shells, it is possible that freshwater bivalves act in a different
manner than their marine relations.
Potentially Toxic Trace Elements in Bivalve Shells
Trace elements linked to industrial contamination have not been studied as extensively as
Ba, Mg, Mn and Sr. Using only the most recent annuli of M. arenaria, Pitts and Walker (1994)
found direct correlation between [Pb]shell and [Pb]Water collected over a 2-year period. An early
use of LA ICP-MS by Raith et al. (1996) used a single A. islandica shell to identify Pb peaks that
may have correlated to increased loads entering Cardigan Bay (UK). Four individuals of
Cerastoderma edule were collected from 4 sites around the UK in Price and Pearce (1997). The
authors characterized As, Cu, Pb, U and Zn and found that metal profiles rarely matched one
another in the same shell and that metal concentrations often increased after winter growth
bands. Their complete lack of statistical analysis renders any relationship merely speculative.
Analysis of Crassotrea virginica shells by Huanxin et al. (2000) revealed variations in Cr, Fe,
Mn, Pb and Zn but the authors did not attempt to described the reasons behind the variation. In a
more concerted attempt to characterize trace element pollution using bivalve shells, Richardson
et al. (2001) compared three Modiolus modiolus from a North Sea (UK) site of known industrial
dumping to three shells from a non-dumping sites. Cu, Pb and Zn concentrations in the shells
were significantly higher at the dumping site. The metal profiles showed good agreement

27
between the shells at the same site and may have reflected a temporal decrease in trace metal
exposure following a ban on dumping industrial waste at sea. A similar approach was taken by
Liehr et al. (2005), using A. islandica from the Mecklenburg Bight (Baltic Sea;
Germany/Denmark). They also found higher Cu, Pb and Zn concentrations at the dumping site
but saw no pattern.
In a study limited by its minimal sampling, Chiffoleau et al. (2004) found V to have been
significantly enriched in a single specimen of P. maximus in the annulus laid down directly
following an oil spill. The laser ablation study was strengthened by biomonitor data from
mussels and oysters that showed increased tissue concentrations of Ni and V following the spill
but weakened by the use of only a single sample shell. Nevertheless, this is one of the few
studies that links trace element enrichment in shell annuli directly to a pollution event. In an
attempt to determine impacts of accelerated glacier loss and increased human activity in the
Antarctic, Dick et al. (2007) examined shells of Laternula elliptica. No increases in Al, Cu, Fe,
Mn or Pb were found in more recent annuli, although resolution was limited by the narrowness
of the growth rings being analyzed.
Lead has been more intensely analyzed than other potentially toxic trace elements. In an
attempt to validate incorporation of Pb into growing shell, MacFarlane et al. (2006) determined
that the pearl mussel Pinctada imbricata incorporated increased Pb concentrations into shell
during both sustained and chronic aqueous exposures. Vander Putten et al. (2000) found
underlying seasonal trends (broad maxima in spring and early summer) in Pb/Ca concentrations
in M. edulis but were unable to correlate them to seasonal fluctuations in Pb concentration in
water. Mercenaria mercenaria shells, both modern and archival, collected from Pamlico Sound
(NC, USA) were used to develop a long-term chronology by Gillikin et al. (2005). They found

28
significantly higher Pb/Ca in annuli coinciding with dates directly before the ban on tetra-ethyl
lead in gasoline but found no other intra- or inter-annual trends. Unfortunately, their “annual”
data was a mean of averaged intra-annual data that was then averaged again between shells from
sites that had different environments and significantly different Pb/Ca concentrations. A visual
inspection of their intra-annual data for four shells indicates apparent seasonal trends, similar to
those previously described in Vander Putten et al. (2000). The overall implication is that their
conclusion that bivalve shells do not constitute suitable archives of environmental Pb may be
mistaken.
Again, the literature is depaupurate when it comes to freshwater studies of the sort
discussed above, with a few studies using a wide variety of instrumental approaches. An early
study by Carrell et al. (1987) using a proton microprobe (μ-PIXE) found newer M. margaratifera
shells showed significantly lower levels of Ag, Au, Co and Fe than 19th century samples taken
from annuli laid down when mining in the region was active. Subsequently, a similar study
showed possible seasonal fluctuations in Al, Cu, Fe and Zn in Anodonta (Lindh et al. 1988).
Fossil D. polymorpha shells sampled in lake sediment cores were analyzed with LA ICP-MS for
Cd, Cu, Pb and Zn by Schettler and Pearce (1996). This study showed that older shells located
in less contaminated sediments accumulated lower levels of Cd, Cu, Pb and Zn, but annuli were
not sampled individually. Al-Aasm et al. (1998) digested whole annuli of D. polymorpha from
Lake Erie and determined that Cd, Cu, Fe, Mg, Mn and V increased during periods of warmer
temperatures and were higher at sites closer to sources of industrial contaminants, although they
supplied no statistical analysis to support this. A study utilizing micro-XRF spectrometry on a
modern (1992) and archival (1917) specimen of Unio crassus retzius was undertaken by
Kurunczi et al. (2001). This approach allowed only a qualitative comparison, with the newer

29
shell surface showing As, Cu and Pb not present in the archived sample. Metal profiles were
attributed to the dubious provenance of sediments preserved on the shell surface, limiting their
usefulness. Markich et al. (2002) found significantly higher concentrations of Co, Cu, Mn, U
and Zn in V. angasi from a site impacted by mine waste when compared to reference sites, with
shell concentrations linearly correlated to water concentrations. They also found that Cu and Zn
in annual layers declined after the mine-waste site was remediated. Carroll (2008) used LA ICP-
MS to analyze Cu in E. complanata and found increased concentrations at organic-rich winter
growth bands, implying that Cu was associated with the organic fraction of the shell, which tends
to increase during winter growth.
Summary
That environmental factors exert strong controls on incorporation of Ba, Mg, Mn and Sr
into bivalve shells is supported by numerous studies. The challenges for the future in this field
will be two-fold. First, the individual agents of environmental control need to be investigated
further, so that trace element profiles can be used as reliable chronographs of environmental
conditions at a given time in an organism’s life. Secondly, the same approaches that have
successfully identified potential environmental controls in estuarine and marine systems should
be applied more extensively to freshwater systems, especially lotic systems. Applying this
approach to lotic systems may prove more challenging because the more variable environment of
freshwater, especially lotic, systems may lead to more variable data.
Summarizing the current findings for metals such as Cu, Pb and Zn is more difficult than
those for Ba, Mg, Mn and Sr. That Cu, Pb and Zn can become enriched in the shells of bivalves
with increased exposure is supported by several studies but the utility of retroactively monitoring
shell annuli is not always clear. Much work needs to be done in order to use bivalve shell annuli

30
as archives of trace element pollution, especially in freshwater systems. Firstly, seasonal
environmental parameters controlling contaminant uptake need to be taken into account to
eliminate naturally occurring peaks in concentrations. Secondly, the regularity with which
bivalves record the impacts of short-term pollution events needs to be validated. Validation
could be performed through laboratory and mesocosm studies or by surveying populations that
have recently seen increased exposure. By validating these approaches, bivalve shells could be
transformed into long-term, retroactive records of trace element pollution that would require
much less time and effort to sample than traditional biomonitoring approaches.
Conclusions
A large body of work has grown up around the idea of using freshwater bivalves in
general and Corbicula fluminea, in particular, as biomonitors of potentially toxic trace elements.
Although it has been well established that bivalves exposed to higher levels of trace elements
will accumulate higher concentrations in their tissues, the many factors that affect
bioaccumulation are not fully understood. Two leading models of trace element
bioaccumulation (biodynamic and biogeochemical) indicate that element sources in particulates
and sediments contribute the most to accumulation. Together, these studies call into question the
importance of bioaccumulation and toxicity studies using water as a primary source. Likewise,
individual size and season of collection have been implicated as affecting bioaccumulation but
the specific effects of these factors remain limited to the species, element, site and methodology
of a particular study. Meanwhile, numerous field studies have indicated that anthropogenic
inputs (as measured in particulates and sediments especially) of trace elements better determine
bioaccumulation than other confounding affects. Continued investigation into the individual and
environmental factors that influence trace element accumulation in bivalves, as well as studies

31
that link bioaccumulation directly to adverse effects in wild populations, will greatly increase
their usefulness as biomonitors. Meanwhile, a promising aspect of biomonitoring is analyzing
the accumulation of trace elements in bivalve shells. Understanding the environmental controls
of this process and validating the ability of bivalve shells to record fluctuations in metal
concentrations may eventually enable retroactive monitoring of trace element pollution.

32
Table 2.1. A table summarizing the criteria of good biomonitors, how closely they are met by freshwater bivalves, with references relating to the appropriate point.
Criterion Suitability of Bivalves References 1. Tolerance of contaminants
Typically resilient to contaminants; can be dependent on species and contaminant.
(Elder 1991, Naimo 1995)
2. Limited mobility Mostly sedentary; move very little even during storm surges
(Imlay 1982, Schwalb and Pusch 2007)
3. Long life span Unionidae: up to 100 years; Corbiculidae: 1-4 years
(McMahon 2001, Vaughn and Hakenkamp 2001)
4. Ubiquity and abundance
Typically colonize in large, dense “beds”; distribution can be patchy
(Strayer 1999, Morales et al. 2006, Strayer 2008)
5. Tissue amount Wide range of sizes; smaller species may have to be analyzed in composite samples
(Elder 1991, McMahon 2001, Vaughn and Hakenkamp 2001)
6. Ability to survive disturbance
Can be dependent on species; by sealing its valves, a bivalve can survive most
short-term disturbances
(Elder 1991, Vaughn and Hakenkamp 2001)
7. Easily identified and sampled
Sampling can occur in wadeable portions of streams; identification of certain
species may be problematic
(Campbell et al. 2005, Meador 2008)
8. Displays a metric of exposure
Metrics can include: Biomarkers, bioaccumulation, growth, fecundity, acute
toxicity, etc.
Numerous: See this chapter
9. The metric correlates to environmental health
May be problematic; see this chapter for more detailed analysis.
Numerous: See this chapter

33
Table 2.2. Field studies that have analyzed intra- and/or inter-annual variability in trace element concentrations of bivalve shells. Environment Species Instrumentation Elements Citation
Marine Arctica islandica LA ICP-MS Sr, Pb Raith et al. 1996 Spisula solidissima LA ICP-MS Ba, Sr Stecher et al. 1996 Cerastoderma edule LA ICP-MS As, Cu, Pb, U, Zn Price and Pearce 1997 Crassotrea virgina GF-AAS Cd, Cu, Cr, Fe, Mn, Pb, Zn Huanxi et al. 2000 Arctica islandica LA ICP-MS Ba, Mg, Sr Toland et al. 2000 Modiolus modiolus LA ICP-MS Cu, Pb, Zn Richardson et al. 2001 Pecten maximus LA ICP-MS Ni, V Chiffoleau et al. 2004 Protothaca staminea LA ICP-MS Mg, Sr Takesue and van Geen 2004 Mercenaria mercenaria LA ICP-MS Pb Gillikin et al. 2005 Arctica islandica LA ICP-MS Cu, Pb, Zn Liehr et al. 2005 Pecten maximus LA ICP-MS Mg, Mn, Sr Freitas et al. 2006 Laternula elliptica LA ICP-MS Al, Cu, Fe, Mn, Pb and U Dick et al. 2007
Estuarine Mya arenaria LA ICP-MS Sr Palacios et al. 1994 Mercenaria mercenaria LA ICP-MS Ba, Sr Stecher et al. 1996 Mytilus edulis LA ICP-MS Ba, Mg, Mn, Pb, Sr Vander Putten et al. 2000 Isognomon ephippium LA ICP-MS Ba, Mg, Mn, Sr Lazareth et al. 2003 Mytilus edulis LA ICP-MS Ba Gillikin et al. 2006
Lentic Anodonta μ-PIXE Al, Cu, Fe, Mg, Mn, Ni, Sr, Zn Lindh et al. 1988 Freshwater Dreissena polymorpha LA ICP-MS Cd, Cu, Pb, Zn Schettler and Pearce 1996
Dreissena polymorpha ICP-MS Cd, Cu, Fe, Mg, Mn, Pb, V Al-Aasm et al. 1998 Pleiodon spekii LA ICP-MS Mn Langlet et al. 2007
Lotic Margaratifera margaratifera μ-PIXE Al, Cu, Fe, Mg, Mn, Ni, Zn Carrell et al. 1987 Freshwater Margaratifera margaratifera SLIM-UP Mn, Sr Nystrom et al. 1996
Unio crassus retzius μ-XRF Cu, Fe, Mn, Pb, Sr, Zn Kurunczi et al. 2001 Hyridella depressa μ-PIXE Mn Siegele et al. 2001 Velesunio angasi SIMS Cu, Co, Fe, Mn, Ni, Pb, U, Zn Markich et al. 2002

34
References
Abaychi, J. K. and Y. Z. Mustafa. 1988. The Asiatic clam, Corbicula fluminea - an indicator of trace metal pollution in the Shatt Al-Arab River, Iraq. Environmental Pollution 54:109-122.
Adams, T. G., G. J. Atchison, and R. J. Vetter. 1981. The use of the three-ridge clam (Amblema perplicata) to monitor trace metal contamination. Hydrobiologia 83:67-72.
Al-Aasm, I. S., J. D. Clarke, and B. J. Fryer. 1998. Stable isotopes and heavy metal distribution in Dreissena polymorpha (Zebra mussels) from western basin of Lake Erie, Canada. Environmental Geology 33:122-129.
Almeida, M. J., G. Moura, T. Pinheiro, J. Machado, and J. Coimbra. 1998. Modifications in Crassostrea gigas shell composition exposed to high concentrations of lead. Aquatic Toxicology 40:323-334.
Andres, S., M. Baudrimont, Y. Lapaquellerie, F. Ribeyre, N. Maillet, C. Latouche, and A. Boudou. 1999. Field transplantation of the freshwater bivalve Corbicula fluminea along a polymetallic contamination gradient (river Lot, France): I. Geochemical characteristics of the sampling sites and cadmium and zinc bioaccumulation kinetics. Environmental Toxicology and Chemistry 18:2462-2471.
Andrus, C. F. T. and D. E. Crowe. 2000. Geochemical analysis of Crassostrea virginica as a method to determine season of capture. Journal of Archaeological Science 27:33-42.
Angelo, R. T., M. S. Cringan, D. L. Chamberlain, A. J. Stahl, S. G. Haslouer, and C. A. Goodrich. 2007. Residual effects of lead and zinc mining on freshwater mussels in the Spring River Basin (Kansas, Missouri, and Oklahoma, USA). Science of the Total Environment 384:467-496.
Barats, A., C. Pecheyran, D. Amouroux, S. Dubascoux, L. Chauvaud, and O. F. X. Donard. 2007. Matrix-matched quantitative analysis of trace-elements in calcium carbonate shells by laser-ablation ICP-MS: application to the determination of daily scale profiles in scallop shell (Pecten maximus). Analytical and Bioanalytical Chemistry 387:1131-1140.
Baudrimont, M., J. Metivaud, R. MauryBrachet, F. Ribeyre, and A. Boudou. 1997. Bioaccumulation and metallothionein response in the Asiatic clam (Corbicula fluminea) after experimental exposure to cadmium and inorganic mercury. Environmental Toxicology and Chemistry 16:2096-2105.

35
Bellotto, V. R. and N. Miekeley. 2000. Improvements in calibration procedures for the quantitative determination of trace elements in carbonate material (mussel shells) by laser ablation ICP-MS. Fresenius Journal of Analytical Chemistry 367:635-640.
Bilos, C., J. C. Colombo, and M. J. R. Presa. 1998. Trace metals in suspended particles, sediments and Asiatic clams (Corbicula fluminea) of the Rio de la Plata Estuary, Argentina. Environmental Pollution 99:1-11.
Bourgoin, B. P. 1990. Mytilus edulis shell as a bioindicator of lead pollution - Considerations on bioavailability and variability. Marine Ecology-Progress Series 61:253-262.
Bourgoin, B. P. and M. J. Risk. 1987. Historical changes in lead in the Eastern Canadian Arctic, determined from fossil and modern Mya truncata shells. Science of the Total Environment 67:287-291.
Campbell, D. C., J. M. Serb, J. E. Buhay, K. J. Roe, R. L. Minton, and C. Lydeard. 2005. Phylogeny of North American amblemines (Bivalvia, Unionoida): Prodigious polyphyly proves pervasive across genera. Invertebrate Biology 124:131-164.
Carell, B., S. Forberg, E. Grundelius, L. Henrikson, A. Johnels, U. Lindh, H. Mutvei, M. Olsson, K. Svardstrom, and T. Westermark. 1987. Can mussel shells reveal environmental history? Ambio 16:2-10.
Carroll, M. and C. S. Romanek. 2008. Shell layer variation in trace element concentration for the freshwater bivalve Elliptio complanata. Geo-Marine Letters In Press.
Cassini, A., L. Tallandini, N. Favero, and V. Albergoni. 1986. Cadmium bioaccumulation studies in the freshwater mollusks Anodonta cygnea and Unio elongatulus. Comparative Biochemistry and Physiology C-Pharmacology Toxicology & Endocrinology 84:35-41.
Chiffoleau, J. F., L. Chauvaud, D. Amouroux, A. Barats, A. Dufour, C. Pecheyran, and N. Roux. 2004. Nickel and vanadium contamination of benthic invertebrates following the "Erika" wreck. Aquatic Living Resources 17:273-280.
Conners, D., Westerfield, SM, Feyko, A, Black, MC 1999. Lead accumulation in soft tissues and shells of Asiatic clams (Corbicula fluminea). Proceedings of the 1999 Georgia Water Resources Conference.

36
Couillard, Y., P. G. C. Campbell, J. Pellerinmassicotte, and J. C. Auclair. 1995a. Field transplantation of a freshwater bivalve, Pyganodon grandis, across a metal contamination gradient .2. Metallothionein response to Cd and Zn exposure, evidence for cytotoxicity, and links to effects at higher levels of biological organization. Canadian Journal of Fisheries and Aquatic Sciences 52:703-715.
Couillard, Y., P. G. C. Campbell, A. Tessier, J. Pellerinmassicotte, and J. C. Auclair. 1995b. Field transplantation of a freshwater bivalve, Pyganodon grandis, across a metal contamination gradient .1. Temporal changes in metallothionein and metal (Cd, Cu, and Zn) concentrations in soft tissues. Canadian Journal of Fisheries and Aquatic Sciences 52:690-702.
Craig, C. A., K. E. Jarvis, and L. J. Clarke. 2000. An assessment of calibration strategies for the quantitative and semi-quantitative analysis of calcium carbonate matrices by laser ablation-inductively coupled plasma-mass spectrometry (LA-ICP-MS). Journal of Analytical Atomic Spectrometry 15:1001-1008.
Croteau, M. N. and S. N. Luoma. 2005. Delineating copper accumulation pathways for the freshwater bivalve Corbicula using stable copper isotopes. Environmental Toxicology and Chemistry 24:2871-2878.
Croteau, M. N., S. N. Luoma, B. R. Topping, and C. B. Lopez. 2004. Stable metal isotopes reveal copper accumulation and less dynamics in the freshwater bivalve Corbicula. Environmental Science & Technology 38:5002-5009.
Dick, D., E. Philipp, M. Kriews, and D. Abele. 2007. Is the umbo matrix of bivalve shells (Laternula elliptica) a climate archive? Aquatic Toxicology 84:450-456.
Doherty, F. G. 1990. The Asiatic clam, Corbicula Spp, as a biological monitor in freshwater environments. Environmental Monitoring and Assessment 15:143-181.
Doherty, F. G., D. S. Cherry, and J. Cairns. 1987. Valve closure responses of the Asiatic clam Corbicula fluminea exposed to cadmium and zinc. Hydrobiologia 153:159-167.
Dunca, E., B. R. Schone, and H. Mutvei. 2005. Freshwater bivalves tell of past climates: But how clearly do shells from polluted rivers speak? Palaeogeography Palaeoclimatology Palaeoecology 228:43-57.
Elder, J., Collins, JJ. 1991. Freshwater molluscs as indicators of bioavailability and toxicity of metals in surface-water systems. . Reviews Environ Contam Tox 122:37-79.

37
Elder, J. F. and H. C. Mattraw. 1984. Accumulation of trace elements, pesticides, and polychlorinated biphenyls in sediments and the clam Corbicula manilensis of the Apalachicola River, Florida. Archives of Environmental Contamination and Toxicology 13:453-469.
Farrington, J. W. 1983. Bivalves as sentinels of coastal chemical pollution - the mussel (and oyster) watch. Oceanus 26:18-29.
Foster, I. D. L. and S. M. Charlesworth. 1996. Heavy metals in the hydrological cycle: Trends and explanation. Hydrological Processes 10:227-261.
Freitas, P. S., L. J. Clarke, H. Kennedy, C. A. Richardson, and F. Abrantes. 2006. Environmental and biological controls on elemental (Mg/Ca, Sr/Ca and Mn/Ca) ratios in shells of the king scallop Pecten maximus. Geochimica Et Cosmochimica Acta 70:5119-5133.
Gillikin, D. P., F. Dehairs, W. Baeyens, J. Navez, A. Lorrain, and L. Andre. 2005. Inter- and intra-annual variations of Pb/Ca ratios in clam shells (Mercenaria mercenaria): A record of anthropogenic lead pollution? Marine Pollution Bulletin 50:1530-1540.
Gillikin, D. P., F. Dehairs, A. Lorrain, D. Steenmans, W. Baeyens, and L. Andre. 2006. Barium uptake into the shells of the common mussel (Mytilus edulis) and the potential for estuarine paleo-chemistry reconstruction. Geochimica Et Cosmochimica Acta 70:395-407.
Graney, R. L., D. S. Cherry, and J. Cairns. 1983. Heavy metal indicator potential of the Asiatic clam (Corbicula fluminea) in artificial stream systems. Hydrobiologia 102:81-88.
Graney, R. L., D. S. Cherry, and J. Cairns. 1984. The influence of substrate, pH, diet and temperature upon cadmium accumulation in the Asiatic clam (Corbicula fluminea) in laboratory artificial streams. Water Research 18:833-842.
Griscom, S. B., N. S. Fisher, and S. N. Luoma. 2002. Kinetic modeling of Ag, Cd and Co bioaccumulation in the clam Macoma balthica: quantifying dietary and dissolved sources. Marine Ecology-Progress Series 240:127-141.
Gundacker, C. 2000. Comparison of heavy metal bioaccumulation in freshwater molluscs of urban river habitats in Vienna. Environmental Pollution 110:61-71.

38
Harrison, F. L., J. P. Knezovich, and D. W. Rice. 1984. The toxicity of copper to the adult and early life stages of the freshwater clam, Corbicula manilensis. Archives of Environmental Contamination and Toxicology 13:85-92.
Hemelraad, J., Kleinveld, HA, de Roos, AM, Holwerda, DA, Zandee, DI 1987. Cadmium kinetics in freshwater clams. III. Effects of zinc on uptake and distribution of cadmium in Anodonta cygnea. Arch. Environ. Contam. Toxicol. 16:95-101.
Huanxin, W., Z. Lejun, and B. J. Presley. 2000. Bioaccumulation of heavy metals in oyster (Crassostrea virginica) tissue and shell. Environmental Geology 39:1216-1226.
Hull, M. S., D. S. Cherry, and R. J. Neves. 2006. Use of bivalve metrics to quantify influences of coal-related activities in the Clinch River watershed, virginia. Hydrobiologia 556:341-355.
Imlay, M. 1982. Use of shells of freshwater mussels in monitoring heavy metals and environmental stresses: a review. . Ecological Review 15:1-14.
Inza, B., F. Ribeyre, and A. Boudou. 1998. Dynamics of cadmium and mercury compounds (inorganic mercury or methylmercury): uptake and depuration in Corbicula fluminea. Effects of temperature and pH. Aquatic Toxicology 43:273-285.
Inza, B., F. Ribeyre, R. MauryBrachet, and A. Boudou. 1997. Tissue distribution of inorganic mercury, methylmercury and cadmium in the Asiatic clam (Corbicula fluminea) in relation to the contamination levels of the water column and sediment. Chemosphere 35:2817-2836.
Joy, J. E. 1985. A 40-week study on growth of the Asian clam, Corbicula fluminea (Muller), in the Kanawha River, West-Virginia. Nautilus 99:110-116.
Kurunczi, S., S. Torok, and P. Chevallier. 2001. A micro-XRF study of the element distribution on the growth front of mussel shell (Species of Unio crassus Retzius). Mikrochimica Acta 137:41-48.
Langlet, D., L. Y. Alleman, P. D. Plisnier, H. Hughes, and L. Andre. 2007. Manganese content records seasonal upwelling in Lake Tanganyika mussels. Biogeosciences 4:195-203.
Lazareth, C. E., E. Vander Putten, L. Andre, and F. Dehairs. 2003. High-resolution trace element profiles in shells of the mangrove bivalve Isognomon ephippium: a record of

39
environmental spatio-temporal variations? Estuarine Coastal and Shelf Science 57:1103-1114.
Liehr, G. A., M. L. Zettler, T. Leipe, and G. Witt. 2005. The ocean quahog Arctica islandica L.: a bioindicator for contaminated sediments. Marine Biology 147:671-679.
Lindh, U., H. Mutvei, T. Sunde, and T. Westermark. 1988. Environmental history told by mussel shells. Nuclear Instruments & Methods in Physics Research Section B-Beam Interactions with Materials and Atoms 30:388-392.
Luoma, S. N., R. Dagovitz, and E. Axtmann. 1990. Temporally intensive study of trace metals in sediments and bivalves from a large river, estuarine system - Suisun Bay Delta in San-Francisco Bay. Science of the Total Environment 97-8:685-712.
Luoma, S. N. and P. S. Rainbow. 2005. Why is metal bioaccumulation so variable? Biodynamics as a unifying concept. Environmental Science & Technology 39:1921-1931.
MacFarlane, G. R., S. J. Markich, K. Linz, S. Gifford, R. H. Dunstan, W. O'Connor, and R. A. Russell. 2006. The Akoya pearl oyster shell as an archival monitor of lead exposure. Environmental Pollution 143:166-173.
Marie, V., P. Gonzalez, M. Baudrimont, J. P. Bourdineaud, and A. Boudou. 2006. Metallothionein response to cadmium and zinc exposures compared in two freshwater bivalves, Dreissena polymorpha and Corbicula fluminea. Biometals 19:399-407.
Markich, S. J., R. A. Jeffree, and P. T. Burke. 2002. Freshwater bivalve shells as archival indicators of metal pollution from a copper-uranium mine in tropical northern Australia. Environmental Science & Technology 36:821-832.
McMahon, R. F. 2001. "Mollusca: Bivalvia", in Ecology and classification of North American freshwater invertebrates, Thorp JH and Covich AP ed. Pages 315-399. Academic Press, San Diego.
Meador, J. R. 2008. The development and evaluation of a freshwater mussel sampling protocol for a large lowland river. University of Georgia, Athens, GA.
Mersch, J., Jeanjean, A, Spor, H, Pihan, J-C. 1992. The freshwater mussel Dreissena polymorpha as a bioindicator for trace metals, organochlorines and radionuclides. Limnologie aktuell 4:227-244.

40
Metcalfe-Smith, J. L., R. H. Green, and L. C. Grapentine. 1996. Influence of biological factors on concentrations of metals in the tissues of freshwater mussels (Elliptio complanata and Lampsilis radiata radiata) from the St Lawrence River. Canadian Journal of Fisheries and Aquatic Sciences 53:205-219.
Millington, P., Walker, KF 1983. Australian freshwater mussel Velsunio ambiguous (Philippi) as a biological monitor for zinc, iron, and manganese. . Aust. J. mar. freshwat. Res. 34:873-892.
Morales, Y., L. J. Weber, A. E. Mynett, and T. J. Newton. 2006. Effects of substrate and hydrodynamic conditions on the formation of mussel beds in a large river. Journal of the North American Benthological Society 25:664-676.
Naimo, T. J. 1995. A review of the effects of heavy metals on freshwater mussels. Ecotoxicology 4:341-362.
Naimo, T. J., D. L. Waller, and L. E. Hollandbartels. 1992. Heavy metals in the threeridge mussel Amblema plicata plicata (Say, 1817) in the Upper Mississippi River. Journal of Freshwater Ecology 7:209-217.
Neves, R. J. and S. N. Moyer. 1988. Evaluation of techniques for age determination of freshwater Mussels (Unionidae). American Malacological Bulletin 6:179-188.
Nystrom, J., E. Dunca, H. Mutvei, and U. Lindh. 1996. Environmental history as reflected by freshwater pearl mussels in the River Vramsan, southern Sweden. Ambio 25:350-355.
Paggi, A. C., C. Ocon, M. Tangorra, and A. R. Capitulo. 2006. Response of the zoobenthos community along the dispersion plume of a highly polluted stream in the receiving waters of a large river (Rio de la Plata, Argentina). Hydrobiologia 568:1-14.
Palacios, R., J. M. Orensanz, and D. A. Armstrong. 1994. Seasonal and lifelong variation of Sr/Ca ratio in shells of Mya arenaria from Grays Harbor (Washington) - An ancillary criterion in demographic studies. Estuarine Coastal and Shelf Science 39:313-327.
Peltier, G. L., J. L. Meyer, C. H. Jagoe, and W. A. Hopkins. 2008. Using trace element concentrations in Corbicula fluminea to identify potential sources of contamination in an urban river. Environmental Pollution 154:283-290.

41
Perceval, O., Y. Couillard, B. Pinel-Alloul, E. Bonneris, and P. G. C. Campbell. 2006. Long-term trends in accumulated metals (Cd, Cu and Zn) and metallothionein in bivalves from lakes within a smelter-impacted region. Science of the Total Environment 369:403-418.
Perceval, O., Y. Couillard, B. Pinel-Alloul, A. Giguere, and P. G. C. Campbell. 2004. Metal-induced stress in bivalves living along a gradient of Cd contamination: relating sub-cellular metal distribution to population-level responses. Aquatic Toxicology 69:327-345.
Pitts, L. C. and G. T. Wallace. 1994. Lead deposition in the shell of the bivalve, Mya arenaria - An indicator of dissolved lead in seawater. Estuarine Coastal and Shelf Science 39:93-104.
Pourang, N. 1996. Heavy metal concentrations in surficial sediments and benthic macroinvertebrates from Anzali wetland, Iran. Hydrobiologia 331:53-61.
Price, G., Pearce, NJG 1997. Biomonitoring of pollution by Cerastoderma edule from the British Isles: A laser ablation ICP-MS study. . Marine Pollution Bulletin 34:1025-1031.
Rainbow, P. S. 2002. Trace metal concentrations in aquatic invertebrates: Why and so what? Environmental Pollution 120:497-507.
Raith, A., W. T. Perkins, N. J. G. Pearce, and T. E. Jeffries. 1996. Environmental monitoring on shellfish using UV laser ablation ICP-MS. Fresenius Journal of Analytical Chemistry 355:789-792.
Reid, R. G. B., R. F. McMahon, D. O. Foighil, and R. Finnigan. 1992. Anterior inhalant currents and pedal feeding in bivalves. Veliger 35:93-104.
Richardson, C. A., S. R. N. Chenery, and J. M. Cook. 2001. Assessing the history of trace metal (Cu, Zn,Pb) contamination in the North Sea through laser ablation ICP-MS of horse mussel Modiolus modiolus shells. Marine Ecology-Progress Series 211:157-167.
Roditi, H. A. and N. S. Fisher. 1999. Rates and routes of trace element uptake in zebra mussels. Limnology and Oceanography 44:1730-1749.
Roditi, H. A., N. S. Fisher, and S. A. Sanudo-Wilhelmy. 2000a. Field testing a metal bioaccumulation model for zebra mussels. Environmental Science & Technology 34:2817-2825.

42
Roditi, H. A., N. S. Fisher, and S. A. Sanudo-Wilhelmy. 2000b. Uptake of dissolved organic carbon and trace elements by zebra mussels. Nature 407:78-80.
Russo, R. E., X. L. Mao, H. C. Liu, J. Gonzalez, and S. S. Mao. 2002. Laser ablation in analytical chemistry - A review. Talanta 57:425-451.
Salomons, W., N. M. Derooij, H. Kerdijk, and J. Bril. 1987. Sediments as a source for contaminants. Hydrobiologia 149:13-30.
Schettler, G. and N. J. G. Pearce. 1996. Metal pollution recorded in extinct Dreissena polymorpha communities, Lake Breitling, Havel Lakes system, Germany: A laser ablation inductively coupled plasma mass spectrometry study. Hydrobiologia 317:1-11.
Schwalb, A. N. and M. T. Pusch. 2007. Horizontal and vertical movements of unionid mussels in a lowland river. Journal of the North American Benthological Society 26:261-272.
Sebesvari, Z., K. F. Ettwig, and H. Emons. 2005. Biomonitoring of tin and arsenic in different compartments of a limnic ecosystem with emphasis on Corbicula fluminea and Dikerogammarus villosus. Journal of Environmental Monitoring 7:388-388.
Shi, D. L. and W. X. Wang. 2005. Uptake of aqueous and dietary metals by mussel Perna viridis with different Cd exposure histories. Environmental Science & Technology 39:9363-9369.
Siegele, R., I. Orlic, D. D. Cohen, S. J. Markich, and R. A. Jeffree. 2001. Manganese profiles in freshwater mussel shells. Nuclear Instruments & Methods in Physics Research Section B-Beam Interactions with Materials and Atoms 181:593-597.
Soucek, D. J., T. S. Schmidt, and D. S. Cherry. 2001. In situ studies with Asian clams (Corbicula fluminea) detect acid mine drainage and nutrient inputs in low-order streams. Canadian Journal of Fisheries and Aquatic Sciences 58:602-608.
Stecher, H. A., D. E. Krantz, C. J. Lord, G. W. Luther, and K. W. Bock. 1996. Profiles of strontium and barium in Mercenaria mercenaria and Spisula solidissima shells. Geochimica Et Cosmochimica Acta 60:3445-3456.
Stites, D. L., A. C. Benke, and D. M. Gillespie. 1995. Population dynamics, growth, and production of the Asiatic clam, Corbicula fluminea, in a blackwater river. Canadian Journal of Fisheries and Aquatic Sciences 52:425-437.

43
Strayer, D. L. 1999. Use of flow refuges by Unionid mussels in rivers. Journal of the North American Benthological Society 18:468-476.
Strayer, D. L. 2008. Freshwater mussel ecology : A multifactor approach to distribution and abundance. University of California Press, Berkeley.
Sturresson, U. 1976. Lead enrichment in shells of Mytulis edulis. Ambio 5:253-256.
Takesue, R. K. and A. Van Geen. 2004. Mg/Ca, Sr/Ca, and stable isotopes in modern and holocene Protothaca staminea shells from a northern California coastal upwelling region. Geochimica Et Cosmochimica Acta 68:3845-3861.
Tatem, H. E. 1986. Bioaccumulation of polychlorinated biphenyls and metals from contaminated sediment by freshwater prawns, Macrobrachium rosenbergii and Clams, Corbicula fluminea. Archives of Environmental Contamination and Toxicology 15:171-183.
Tessier, A. and P. G. C. Campbell. 1987. Partitioning of trace metals in sediments - Relationships with bioavailability. Hydrobiologia 149:43-52.
Tessier, A., P. G. C. Campbell, J. C. Auclair, and M. Bisson. 1984. Relationships between the partitioning of trace metals in sediments and their accumulation in the tissues of the freshwater mollusk Elliptio complanata in a mining area. Canadian Journal of Fisheries and Aquatic Sciences 41:1463-1472.
Tessier, A., Y. Couillard, P. G. C. Campbell, and J. C. Auclair. 1993. Modeling Cd partitioning in oxic lake sediments and Cd concentrations in the freshwater bivalve Anodonta grandis. Limnology and Oceanography 38:1-17.
Toland, H., B. Perkins, N. Pearce, F. Keenan, and M. J. Leng. 2000. A study of sclerochronology by laser ablation ICP-MS. Journal of Analytical Atomic Spectrometry 15:1143-1148.
Tomazelli, A. C., L. A. Martinelli, W. E. P. Avelar, P. B. de Camargo, A. H. Fostier, E. S. B. Ferraz, F. J. Krug, and D. S. Junior. 2003. Biomonitoring of Pb and Cd in two impacted watersheds in southeast Brazil, using the freshwater mussel Anodontites trapesialis (Lamarck, 1819) (Bivalvia : Mycetopodidae) as a biological monitor. Brazilian Archives of Biology and Technology 46:673-684.
Van der Velde, G., Hermus, K, Van der Gaag, M, Jenner, HA 1992. Cadmium, zinc, and copper in the body, byssus and shell of the mussels, Mytilopsis leucophaeta and Dreissena

44
polymorpha in the brackish Noordzeekanaal of the Netherlands. Limnologie aktuell 4:213-226.
Vander Putten, E., F. Dehairs, L. Andre, and W. Baeyens. 1999. Quantitative in situ microanalysis of minor and trace elements in biogenic calcite using infrared laser ablation - inductively coupled plasma mass spectrometry: A critical evaluation. Analytica Chimica Acta 378:261-272.
Vander Putten, E., F. Dehairs, E. Keppens, and W. Baeyens. 2000. High resolution distribution of trace elements in the calcite shell layer of modern Mytilus edulis: Environmental and biological controls. Geochimica Et Cosmochimica Acta 64:997-1011.
Vaughn, C. C. and C. C. Hakenkamp. 2001. The functional role of burrowing bivalves in freshwater ecosystems. Freshwater Biology 46:1431-1446.
Villar, C., J. Stripeikis, L. D'Huicque, M. Tudino, O. Troccoli, and C. Bonetto. 1999. Cd, Cu and Zn concentrations in sediments and the invasive bivalves Limnoperna fortunei and Corbicula fluminea at the Rio de la Plata basin, Argentina. Hydrobiologia 416:41-49.
Vinot, I. and J. C. Pihan. 2005. Circulation of copper in the biotic compartments of a freshwater dammed reservoir. Environmental Pollution 133:169-182.
Wang, W. X. and N. S. Fisher. 1999. Assimilation efficiencies of chemical contaminants in aquatic invertebrates: A synthesis. Environmental Toxicology and Chemistry 18:2034-2045.

45
CHAPTER THREE
BIOACCUMULATION OF TRACE ELEMENTS BY CORBICULA FLUMINEA AND
ELLIPTIO HOPETONENSIS IN THE ALTAMAHA RIVER SYSTEM1
Abstract
The Asian clam, Corbicula fluminea, has frequently been used as a biomonitor of a wide
array of pollutants, including potentially toxic trace elements. This study analyzed the tissue
concentrations of As, Cd, Cr, Cu, Hg, Mn, Ni, Pb and Zn in Corbicula and the native mussel
Elliptio hopetonensis from 14 sites in the Altamaha River system, in Georgia, USA.
Concentrations (μg/g) of As, Cd, Cu, Hg and Pb were found to be significantly positively
correlated (α = 0.05) between the two species, indicating that Corbicula bioaccumulation can be
used as a proxy for co-occurring E. hopetonensis. When calculated as body burdens (g), As, Cd,
Cu, Hg and Zn were significantly positively correlated (α =0.05) between the two species. The
trace element tissue concentrations and body burdens in both Corbicula and E. hopetonensis
were correlated to a number of environmental and growth parameters. Lower water temperature,
dissolved oxygen, alkalinity, and hardness tended to lead to higher concentrations of trace
elements, while larger organisms tended to accumulate higher concentrations. Only Cd, Cu, Ni
and Pb showed any correlation between tissue concentrations of either species and
concentrations in water and/or sediment. No obvious longitudinal trends could be seen from the
data. This study supports the idea that bioaccumulation of trace elements by Corbicula can be
1 Shoults-Wilson WA, Unrine JM, Rickard J, Black MC. To be submitted to Science of the Total Environment
46
used to approximate levels accumulated by co-occurring native mussel species as part of a
biomonitoring program.
Introduction
Native mussel species have been declining across the southeast (Williams et al. 1993).
The Altamaha River in southeastern Georgia contains a native assemblage of 19 mussels. The
federally endangered species Elliptio spinosa is of special concern (Meador 2008). Threats to
native mussels include sedimentation and habitat alteration, loss of host fish species, exposure to
anthropogenic contaminants and competition from invasive species (Williams et al. 1993, Naimo
1995). As an invasive species, Corbicula has been implicated as a factor in native mussel
decline through competition for food resources (Sickel 1973, Kraemer 1979, Elder 1991).
A widespread invasive freshwater bivalve, the Asian clam (Corbicula fluminea; hereafter
Corbicula) was first found along the Pacific coast of the United States in 1937 (Kraemer 1979).
Since then it has spread to 33 of the 49 continental states, its range limited by colder winter
temperatures (Stites et al. 1995). Spreading to the southeastern states, Corbicula became
established in all Georgia watersheds, including the largest Atlantic Slope drainage, the
Altamaha River (Sickel 1973, Stites et al. 1995). It has since established itself ubiquitously and
abundantly throughout the Altamaha and its tributaries.
Corbicula has been studied extensively as a biomonitor, or an organism whose
accumulation of or reaction to contaminants is used as a measure of the impacts of those
contaminants on the environment. It has become popular as a biomonitor for both potentially
toxic trace elements (Caldwell and Buhler 1983, Graney et al. 1983, Elder and Mattraw 1984,
Graney et al. 1984, Tatem 1986, Abaychi and Mustafa 1988, Doherty et al. 1990, Luoma et al.
1990, Pourang 1996, Baudrimont et al. 1997, Andres et al. 1999, Villar et al. 1999, Angelo et al.

47
2007) and organic compounds (Elder and Mattraw 1984, Tatem 1986, Doherty 1990). The
general consensus found in the literature is that Corbicula can serve as a good biomonitor
organism for a variety of contaminants due to its ubiquity, high abundance, low mobility, rapid
accumulation of contaminants and tolerance to high amounts of contamination (Doherty 1990).
Of primary interest in past studies has been the bioaccumulation of contaminants by Corbicula
following exposure (Graney et al. 1983, Doherty 1990). Elevated bioaccumulation of trace
elements by freshwater bivalves has been linked to adverse effects such as oxidative stress,
reduced fecundity and local extinctions of native mussels (Couillard et al. 1995, Perceval et al.
2004, Angelo et al. 2007). Few studies have made direct comparison between the accumulation
of contaminants by Corbicula and that of co-occurring native mussel species (Caldwell and
Buhler 1983, Angelo et al. 2007).
In order to better evaluate the utility of Corbicula as a biomonitor organism, this study
examined 1) the difference (if any) in the amount of trace metals accumulated by co-occurring
Corbicula and the native Unionid mussel species Elliptio hopetonensis at multiple sites within
the Altamaha River system; 2) the ability to draw significant correlations between Corbicula
accumulation and that of a native species; 3) spatial and environmental factors that may
influence bioaccumulation. By elucidating the link between Corbicula and E. hopetonensis in
their bioaccumulation of trace metals, the groundwork could be laid for trace metal
biomonitoring programs using Corbicula exclusively. Such a program would allow the
assessment of the threat of trace metals to native mussels without disrupting their communities
with destructive sampling.
48
Materials and Methods
Study Area
The Altamaha River drainage is completely contained within the state of Georgia. The
Altamaha River proper is formed by the confluence of the Ocmulgee and Oconee Rivers, whose
headwaters are in the piedmont phyto-geographic province and cross the fall line at Macon and
Milledgeville GA, respectively (Reese and Batzer 2007). The Altamaha proper has a largely
unaltered channel, bordered by wide areas of bottomland forest, while the Oconee and Ocmulgee
both have reservoirs in their middle or upper reaches. Other major tributaries are the Little
Ocmulgee and Ohoopee Rivers. While many of its smaller tributaries below the fall line could
be considered to be blackwater systems (Patrick 1994), the Altamaha mainstem is not a classic
example of a blackwater river (Stites et al. 1995).
Fourteen sites were chosen for this study, two on the lower Oconee (OCN), four on the
middle and lower Ocmulgee (OMG), one on the lower Ohoopee (OHP), and seven on the main
channel of the Altamaha (ALT; Figure 3.1). These sites were chosen based on their location
within the Altamaha system (for broad representation), their downstream proximity to potential
sources of trace metals (population centers and industry) and the co-occurrence of Corbicula and
E. hopetonensis. Habitats sampled ranged from depositional sloughs separated from the river by
a small sandbar, to the leading edges of sandbars, to rocky shelves of the unique “Altamaha grit”
microhabitat. GIS coordinates were taken and recorded for each site at the time of sampling
(Magellan explorist 210; Thales Navigation, San Diego CA), and a sketch of the site was made
indicating major features of substrate and local morphology.

49
Water Quality and Stream Parameters
At each site, the following water quality parameters were measured immediately
upstream of the sampling site: temperature and dissolved oxygen (YSI Model 55; Yellow
Springs OH, USA), conductivity (YSI Model 85), and pH (Orion Model 720A; Beverly MA,
USA). Nalgene bottles previously washed in 10% trace metal grade HNO3 were used to collect
500 mL of water at each site. The water was kept cool and refrigerated upon return to the lab.
Subsamples (50 mL) were used to determine alkalinity and hardness titrametrically (Hach®,
Loveland CO, USA).
Sediment and Bivalve Collection
Sediment was collected at each site using a petite Ponar grab sampler until 3 grabs had
been made or >500 mL of sediment had been acquired. Composite sediments were homogenized
in an acid-rinsed plastic container and 500 mL was subsampled into a 10% trace metal grade
HNO3 washed nalgene bottle. The sediment was stored on ice for transport back to the lab and
stored at 4°C. Further processing took place within 2 weeks of collection.
At each site, Corbicula (25-35) and E. hopetonensis (5) were sampled by hand and
deposited in labeled mesh bags. They were stored in a bucket of aerated river water, which was
placed in a cooler with small amounts of ice to limit stress to the organisms. Upon transportation
to the lab, they were transferred to a climate controlled room and allowed to depurate gut
contents for ~12-36 h.
Sample Processing
Water samples were filtered through a 0.5 μm paper filter that had previously been rinsed
with 10% trace metal grade HNO3 and dried. Approximately 50 mL of each filtered sample
were poured into an acid-washed nalgene bottle and acidified with 0.5 mL of trace metal grade

50
HNO3 in order to maintain the integrity of trace metal concentrations. Samples were stored at
room temperature until analysis.
All sediment samples were processed using a protocol adapted from Luoma et al. (1990).
Sediment samples were re-homogenized and poured through a 1 mm acid-washed plastic sieve.
The resulting < 1 mm fraction was placed in acid-washed nalgene containers and stored at –20°C
until they could be processed further. Frozen samples were thawed under refrigeration at a later
date and wet-sieved again through a 105 μm Nytex mesh (Spectrum Mesh; Rancho Dominguez
CA, USA) into an acid-washed 600 mL beaker. Fine fractions were dried at temperatures
ranging from room temperature to 95°C, homogenized using a dry acid-washed mortar and pestle
and stored in acid washed plastic centrifuge tubes under anhydrous conditions until digestion.
Bivalves were measured for maximum length, height, and depth of shells while still alive.
Whole tissues (8-10 Corbicula and 5 E. hopetonensis) were dissected from their shells and
placed on pre-weighed aluminum pans. Wet weights of tissues were measured and the tissues
were then dried at 100 °C for 48 h or until completely dry, at which point they were reweighed.
Because of its much larger tissue mass, E. hopetonensis tissues were homogenized using an acid-
washed mortar and pestle. Corbicula samples were stored as whole tissues. All dried tissues
were stored in acid-washed plastic containers until digestion. Shells were allowed to dry, then
weighed, labeled in pencil and stored in plastic bags. Left valves of shells were filled with sand
of a known density and weighed in order to estimate shell volume (Kesler 2004).
Acid-Digestion
Between 0.25 and 0.5 g of dried fine fraction sediment were completely digested in 8 mL
trace metal grade HNO3 and 3 mL HF, using a MARS 5 HP 500 Plus system (CEM Corp;
Matthews NC, USA), under the conditions of EPA protocol 3052 (USEPA 1996). Three

51
replicate samples were digested for each sediment composite. All digestions were diluted in 24
mL of Milli-Q water to ~33% acid. Blanks and standard sediments (MESS-3, National Research
Council of Canada, Ottawa ON, Canada; NIST 1645, National Bureau of Standards,
Gaithersburg MD, USA) were also digested with each run. All samples, blanks and standards
were stored at room temperature in acid-washed centrifuge tubes until analysis.
Whole tissues of Corbicula and 0.10-0.25 g homogenized tissues of E. hopetonensis were
completely digested in 5 mL of trace metal grade HNO3, using a MARS 5 HP 500 Plus system
(CEM Corp; Matthews NC, USA), under the conditions of EPA protocol 3015 (USEPA 1994).
Three replicate digestions were performed for each individual E. hopetonensis. Digestions were
diluted with 10 mL Milli-Q water to ~33% acid. Exact concentrations were calculated using dry
tissue mass and the mass of the final solution. One blank (acid only) and one standard reference
material (SRM) of ~0.075 g TORT-2 lobster hepatopancreas (National Research Council of
Canada, Ottawa ON, Canada) were digested in each run. Dilute samples, blanks and standard
were stored at room temperature until analysis.
Sample Analysis
Analyses of digested samples were carried out as described in Unrine et al. (2007). Trace
element concentrations in digests (As, Cd, Cr, Cu, Hg, Mn, Ni, Pb and Zn) were quantified using
a Perkin-Elmer Sciex Elan DRC Plus inductively coupled plasma-mass spectrometer (ICP-MS;
Norwalk CT, USA) operating in standard mode. Method detection limits (MDLs) were
calculated using blank digests. Mean MDLs ranged from 0.0250 μg/g for Cd to 3.360 μg/g for
Cu. Recoveries of SRMs were in good agreement with certified values and averages ranged
between 85.27% for As and 130.04% for Pb. However Cr recovery was highly variable because
of carbon interference and Cr concentrations from those samples were not used in data analysis.

52
Relative percent difference (RPD) of replicate dilutions of sub-samples was used to approximate
analytical error. On average (n=34) RPD ranged from 2.01% for As and Zn to 12.80% for Pb.
Spikes of ~2-5 times the un-spiked sample concentration had mean recoveries ranging from
91.61% for Cr and 101.87% for Ni (n=33).
Statistical Analysis
Concentrations of metals were calculated on a μg/g dry tissue weight basis for both
Corbicula and E. hopetonensis and were compared at each site. Analysis of variance (ANOVA)
was used to determine significant differences in metal concentrations between species followed
by Duncan’s post hoc test (α = 0.05). Calculations were performed using Statistical Analysis
Software (SAS v9.1, SAS Institute, Cary NC, USA). Similarly, ANOVA was used to determine
a significant difference in accumulation of an element between a site and the closest upstream
site. Tissue concentrations of each element were averaged for a given species at each sites. The
mean concentrations of an element for each species were correlated across sites using linear
regression and an F-test performed to determine the significance (α = 0.05) of the correlation.
Finally, tissue element concentrations at each site were compared to environmental
concentrations of the element (water and sediment) at each site, as well as the water quality
parameters (temperature, pH, etc) at each site using linear regression. F-Tests were used to
determine any significant (α = 0.05) correlations between these outside factors and accumulation
of trace metals in the two species.
Results
The results of the comparisons of element accumulation between Corbicula and E.
hopetonensis are summarized in Table 3.1 (mean concentrations of elements, organized by site
and species, are included in Appendix 2.1). Overall, Corbicula tended to accumulate

53
significantly higher concentrations of As, Cd, Cu, and Hg. E. hopetonensis tended to accumulate
significantly higher concentrations of the elements Mn. Samples that were below detection
limits reduced the number of sites at which a comparison could be made for Ni and Pb (to 11 and
5 respectively). Highly variable Cr recovery from SRMs decreased the number of sites with
usable data (to 7). These elements, as well as Zn, did not reveal trends of accumulation that were
clear, although Corbicula tended to accumulate higher concentrations of Cr and Ni, while E.
hopetonensis tended to accumulate higher levels of Zn. It should be noted that at sites where Cr,
Ni, and Pb were below detection in Corbicula, they were readily detectable in E. hopetonensis.
The log transformed concentrations of the elements As, Cd, Cu, Hg and Pb found in
Corbicula were significantly (α = 0.05) correlated to those found in E. hopetonensis (Figure 3.2).
The log transformed body burdens of the elements As, Cd, Cu, Hg and Zn found in Corbicula
were significantly (p < 0.05) correlated to those found in E. hopetonensis (Figure 3.3). All
correlations were positive, with higher concentrations and body burdens of an element in
Corbicula corresponding to higher concentrations and body burdens in E. hopetonensis.
Upstream/downstream comparisons for selected elements (As, Cd, Cu, Hg, Pb, and Zn)
are represented in Figure 3.4. No clear longitudinal trends can be drawn from these data.
Notably, the site on the Ohoopee River (OHP1) exhibited significantly elevated levels of Cd, Cu,
Hg, Pb, and Zn. The two species also tended to show increased or decreased element
concentrations in tandem with one another. This further supports the use of Corbicula as a
surrogate of E. hopetonensis.
There were numerous correlations between environmental parameters and the mean
concentration of accumulated elements. The significant (α = 0.05) correlations are listed in
Table 3.2. Water quality parameters (pH, temperature, dissolved oxygen, alkalinity and
54
hardness) were negatively correlated, while size metrics [shell length, height, depth, thickness
index and condition index: dry tissue mass / shell volume (Kesler 2004)] and concentrations of
the elements in water and sediment typically formed positively correlated. Body burdens of both
species had a greater tendency to correlate with size metrics and were also more likely to be
correlated with certain water quality parameters, such as temperature and dissolved oxygen. On
the other hand, tissue concentration was more likely to be correlated with water alkalinity and
hardness. With respect to the concentrations or burdens of an element reflecting the amounts
found in the environment, only Cd, Cu, Ni, and Pb showed any correlation between amount
accumulated and the amount found in water and/or sediment samples. Overall, Corbicula tended
to correlate with fewer parameters, whether growth or environmental, than E. hopetonensis.
Discussion
Comparison of trace element bioaccumulation between Asian clams and native mussels
It has been suggested that the Asian clam Corbicula is a suitable biological monitor of
potentially toxic trace metals (Doherty 1990). This assertion comes primarily from comparisons
between Corbicula and environmental concentrations of metals in compartments such as water
and sediment. The typical approach has been to validate the ability of tissue concentrations in
Corbicula to indicate increased environmental concentrations. This study has attempted to
validate Corbicula’s suitability as a biomonitor by comparing it to another species, in particular
that of a native Unionid mussel collected in the field.
Angelo et al. (2007) investigated the accumulation of Cd, Pb, and Zn by Corbicula as
well as various co-occurring native mussel species (14 species not differentiated in their data
analysis). They found that Corbicula tissue concentrations significantly correlated to mussel
concentrations. Similarly, in this study, accumulation of higher concentrations of As, Cd, Cu,

55
Hg, and Pb by Corbicula were correlated with higher concentrations in E. hopetonensis (Figure
3.2). This supports the idea that metal concentrations accumulated by Corbicula can be used to
estimate those accumulated by co-occurring populations of native mussels. It is likely that
biomonitoring programs that solely sample Corbicula can provide an accurate representation of
the exposure of native Unionids to trace element pollution.
While mean concentrations are well correlated when compared between sites, our study
also showed that Corbicula typically accumulated higher concentrations of As, Cd, Cu, and Hg,
while E. hopetonensis typically accumulated higher concentrations of Mn and Zn (Table 3.1).
This differs from past studies, which found Corbicula to accumulate significantly higher
concentrations of Pb, while accumulating similar amounts of Cd and Zn to various native species
in Oklahoma (Angelo et al. 2007) or accumulating similar concentrations of Cd, Hg, and Zn as
other bivalves in the Columbia River estuary, Oregon (Caldwell and Buhler 1983). In both of
these studies, multiple species were averaged together, with few of the samples being from
Elliptio species, a fact that may account for this discrepancy. Our comparison of Pb
accumulation was also hampered by difficulty in quantifying concentrations of Pb in Corbicula.
This may be due to the small tissue mass of the organisms or low environmental availability in
the Altamaha system.
Spatial distribution of trace elements
Comparing sites to those immediately upstream showed no underlying longitudinal trend
in trace element bioaccumulation within the system (Figure 3.4). A few trends can be seen. The
site OMG3 tended to show significantly lower levels of bioaccumulation than OMG2, the site
directly upstream (Figure 3.4). Likewise, the site OCN2 showed significantly lower
concentrations of several trace elements than its nearest upstream neighbor, OCN1. Both of

56
these sites (OMG3 and OMG2) were situated in marginal habitat, with specimens that were on
average smaller than those of the nearest neighboring sites.
Abaychi and Mustafa (1988) reported smaller clams collected in the field had
accumulated significantly higher concentrations of Cu, Ni, Pb, and Zn, while larger clams
accumulated significantly higher concentrations of Cd. Luoma et al. 1990 reported Cd, Cr, and
Cu concentrations were positively correlated with Corbicula length. No mean size metrics were
correlated with tissue metal concentrations of Cd, Cu, Hg, and Pb in either species in our study,
although E. hopetonensis displayed a positive correlation between shell length and Cr
concentration (Table 3.2). Because each of these previous studies assigned individuals to size
classes that were then analyzed in composite, the observed correlation between accumulation and
size (in both cases shell length) could be an artifact of aggregation. Conversely, by selecting
individuals of representative sizes for analysis and then averaging by site, we may be unable to
observe the effects of size. Significantly lower accumulation could also be the result of more
frequent valve closures to survive within marginal habitats. Valve closure has been shown to be
a common response in Corbicula to toxic trace elements that limits exposure and deleterious
effects (Doherty et al. 1987).
Also of interest is the site on the Ohoopee, OHP1, which typically showed significantly
higher concentrations of elements than the nearest downstream site, ALT4 (Figure 3.4). Further,
ALT4 frequently had significantly higher concentrations of these elements than its downstream
neighbor, ALT5 and showed significantly higher bioaccumulation than the nearest site upstream
ALT3. This may provide evidence of a source of trace metals (particularly Cd and Hg) within
the Ohoopee drainage that is then transferred to the Altamaha. It may also indicate that the water
57
chemistry parameters (low alkalinity and hardness) of the Ohoopee may increase bioavailability
and therefore accumulation of these trace elements.
One difficulty in using biomonitor organisms to assess the distribution of contaminants is
that in natural environments, a large amount of habitat heterogeneity can exist in a small area,
leading to fine spatial differences in the conditions under which bioaccumulation takes place.
This leads to the comparison of tissue trace element concentrations from ALT1 and ALT2
(Figure 3.4). These sites are ~500 m apart and were collected on the same day. Corbicula at
ALT2 had significantly higher concentrations of As, Cd, Cu, Hg, and Zn than those at ALT1.
ALT1 was a swifter flowing site of packed sand, while ALT2 was a shallower site with little
current, whose sediment was silty sand and dead bivalve shells. The differences in
environmental conditions between sites could have led to the observed differences in trace
element accumulation. This illustrates the kind of fine scale spatial variability that makes it
difficult to draw conclusions on anthropogenic sources of trace elements based on
upstream/downstream comparisons.
Correlation between bioaccumulation and environmental parameters
Bioaccumulation of trace elements by both species was significantly correlated to a
variety of environmental factors (Table 3.2). Two factors frequently negatively correlated with
bioaccumulation were water hardness and alkalinity (e.g. Cd, Cu, Hg, Pb, Zn). With lower
alkalinity and hardness, trace metal concentrations in tissues were found to be higher. This
agrees with predictions of the biotic ligand model (BLM), in which Ca and Mg ions compete
with metals for uptake (Paquin et al. 2002). As discussed earlier, this is important when
considering the reasons for the high metal concentrations found at the site of OHP1, which also
had lower water alkalinity and hardness than all other sites (data not shown).

58
Environmental concentrations of trace metals were correlated with tissue concentrations
only in some instances (Table 3.2). It has been reported that Corbicula accumulate very low
amounts of trace metals from sediment (Doherty 1990). However, the trace elements Cu and Pb
were significantly correlated between concentrations in Corbicula tissues and sediment, while
Cd and Pb were correlated between concentrations in E. hopetonensis tissues and in sediment.
Elder and Mattraw (1984) found no correlation between Corbicula accumulation of Cd, Cr, Cu,
Pb, or Zn and sediment from sites in the Apalachicola River in Florida, although they did find a
correlation with As. However, they analyzed very fine clay particles (<23-μm) rather than the
more inclusive fine fraction we analyzed (<105-μm). Also, their methods resulted in limited
detection of As and Cd from Corbicula tissue, which may have skewed their results. Tatem
(1986) found that Corbicula did not accumulate Cd from contaminated sediment, although they
did find an accumulation of Pb, as did this study. Luoma et al. (1990) using methods similar to
those used in this study found strong correlations between concentrations of Cu, Cd, Pb, and Zn
in Corbicula and fine (<100-μm) sediments sampled from Suisun Bay, California. However, the
correlation was only significant when monthly data were aggregated on a yearly or tri-yearly
basis. In any case, the findings of this study indicate that Corbicula may take up some trace
elements from the fine fraction of sediment it inhabits. Similarly, the native mussel E.
hopetonensis may be accumulating certain toxic trace elements (Cd, Pb) from exposure via fine
sediment sources. Future biomonitoring programs would be advised to consider incorporating
sediment into any sampling protocol.
Some past studies (Abaychi and Mustafa 1988, Luoma et al. 1990, Angelo et al. 2007)
have indicated that trace element tissue concentrations in Corbicula, as well as other bivalves
(Cain and Luoma 1990) fluctuate on a seasonal basis. These changes have been attributed to

59
increased water flow and trace element exposure during seasonal high flows (Abaychi and
Mustafa 1988) and seasonal changes in body mass resulting from growth and reproductive
strategies (Luoma et al. 1990). Our data shows significant negative correlation between mean E.
hopetonensis tissue concentrations of the essential elements Ni and Zn with water temperature,
an indicator of season, while only Zn shows such a correlation in Corbicula (Table 3.2). In this
instance, it seems that essential elements may be more greatly affected by seasonal changes in
the local environment. One proposed approach to eliminating the seasonal changes of tissue
mass that can influence concentration is to calculate body burden as opposed to tissue
concentration (Luoma et al. 1990). However, body burdens of Cd, Cr, Cu, Mn, Ni and Zn are all
significantly correlated to temperature in E. hopetonensis, while no element body burdens are
correlated in Corbicula. Body burden is also more often significantly correlated to organism size
metrics, causing small differences in body size to bias data. Therefore, body burden is not
necessarily a robust metric to use when comparing sites sampled on different dates. The work of
Angelo et al. (2007) concluded that seasonal effects on Corbicula accumulation were secondary
to the effects of anthropogenic inputs into the system. Our study supports this conclusion, which
suggests that sampling season should be a secondary concern when instituting a spatially
intensive biomonitoring program.
Conclusions
This study has provided evidence that the Asian clam Corbicula can be used as a
biomonitoring proxy of trace element accumulation for the native freshwater mussel E.
hopetonensis and adds to previous evidence that Corbicula is a suitable biomonitor of trace
elements. This study also provides the first survey of trace metal accumulation in the bivalves of
the Altamaha River system and indicates some areas that may exhibit increased exposure to trace

60
elements, either through anthropogenic activity or through increased bioavailability caused by
differences in water chemistry. Clearly, more intensive sampling needs to be conducted in this
system to explore the distribution and potential impacts of trace elements on native mussel
assemblages. This study shows that both of the bivalves studied, Corbicula and E. hopetonensis,
may accumulate trace elements from the fine fraction of sediment, suggesting that analysis of
sediment for trace elements should be included in any biomonitoring program. Finally,
correlations between tissue concentrations of trace elements in both species and environmental
factors indicate that local heterogeneity in water chemistry, habitat and organism size play
important rolls and bioaccumulation and should be taken into account when analyzing
bioaccumulation data.
Acknowledgments
I would like to acknowledge Jason Meador, Becky Fauver, Miles Buzbee, Keith Hastie
and Scott Small for their help in field sampling during the course of this study. I’d also like to
thank Diane Addis and Gretchen Loeffler-Peltier for help in processing samples. This study was
conducted with financial support from the US Fish & Wildlife Service as well as the University
of Georgia.

61
Table 3.1. Mean concentration of each element as it was accumulated by each species over all sites. The number of sites in which a comparison between species was possible is given and the number of sites at which each species accumulated significantly higher concentrations of each element. Element Species Concentration
(μg/g) Number of sites
Significantly higher sites
As Corbicula E. hopetonensis
4.55±0.20 2.34±0.06
14 14 0
Cd Corbicula E. hopetonensis
2.34±0.27 1.27±0.08
14 9 0
Cr Corbicula E. hopetonensis
4.18±0.40 2.61±0.18
7 4 0
Cu Corbicula E. hopetonensis
67.8±3.8 5.62±0.12
14 14 0
Hg Corbicula E. hopetonensis
1.296±0.195 0.357±0.028
14 10 1
Mn Corbicula E. hopetonensis
50.9±8.3 4098±191
14 0 14
Ni Corbicula E. hopetonensis
3.84±0.67 1.91±0.14
11 5 0
Pb Corbicula E. hopetonensis
0.553±0.082 0.852±0.129
5 1 2
Zn Corbicula E. hopetonensis
122±3 167±15
14 1 6
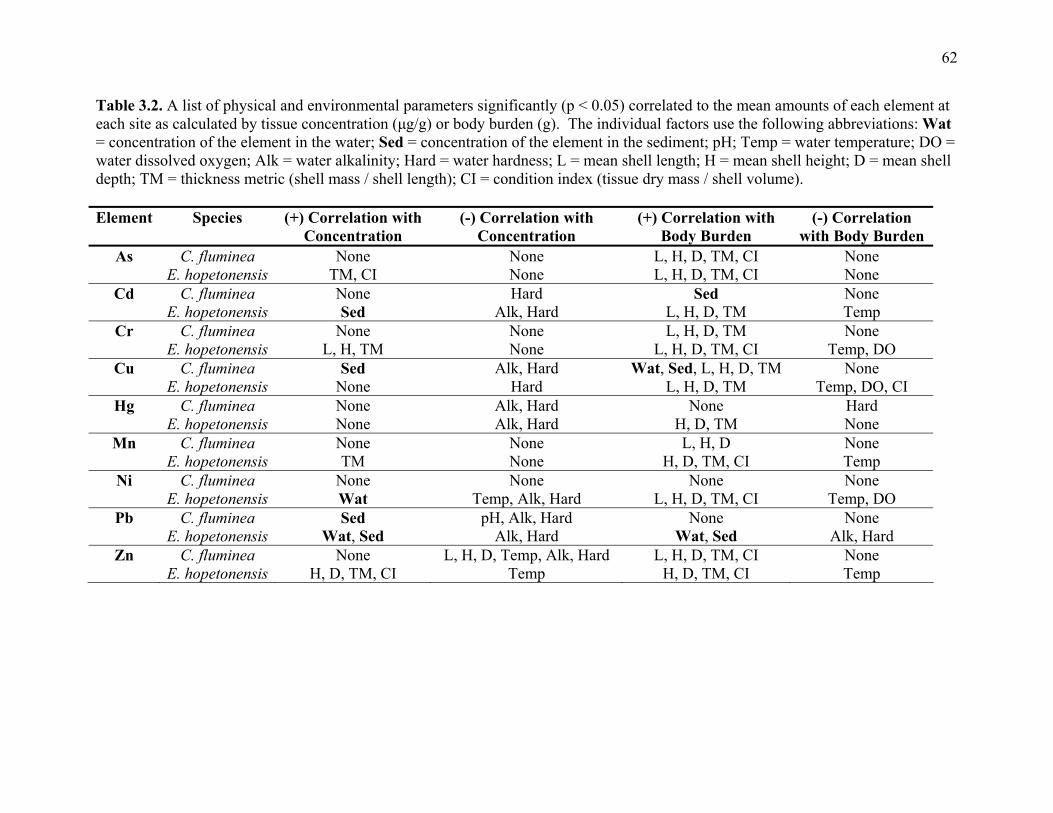
62
Table 3.2. A list of physical and environmental parameters significantly (p < 0.05) correlated to the mean amounts of each element at each site as calculated by tissue concentration (μg/g) or body burden (g). The individual factors use the following abbreviations: Wat = concentration of the element in the water; Sed = concentration of the element in the sediment; pH; Temp = water temperature; DO = water dissolved oxygen; Alk = water alkalinity; Hard = water hardness; L = mean shell length; H = mean shell height; D = mean shell depth; TM = thickness metric (shell mass / shell length); CI = condition index (tissue dry mass / shell volume). Element Species (+) Correlation with
Concentration
(-) Correlation with Concentration
(+) Correlation with Body Burden
(-) Correlation with Body Burden
As C. fluminea E. hopetonensis
None TM, CI
None None
L, H, D, TM, CI L, H, D, TM, CI
None None
Cd C. fluminea E. hopetonensis
None Sed
Hard Alk, Hard
Sed L, H, D, TM
None Temp
Cr C. fluminea E. hopetonensis
None L, H, TM
None None
L, H, D, TM L, H, D, TM, CI
None Temp, DO
Cu C. fluminea E. hopetonensis
Sed None
Alk, Hard Hard
Wat, Sed, L, H, D, TM L, H, D, TM
None Temp, DO, CI
Hg C. fluminea E. hopetonensis
None None
Alk, Hard Alk, Hard
None H, D, TM
Hard None
Mn C. fluminea E. hopetonensis
None TM
None None
L, H, D H, D, TM, CI
None Temp
Ni C. fluminea E. hopetonensis
None Wat
None Temp, Alk, Hard
None L, H, D, TM, CI
None Temp, DO
Pb C. fluminea E. hopetonensis
Sed Wat, Sed
pH, Alk, Hard Alk, Hard
None Wat, Sed
None Alk, Hard
Zn C. fluminea E. hopetonensis
None H, D, TM, CI
L, H, D, Temp, Alk, Hard Temp
L, H, D, TM, CI H, D, TM, CI
None Temp

63
Figure 3.1. A map of sites sampled within the Altamaha River system. The following abbreviations map sites to the river they were sampled from: OMG = Ocmulgee; OCN = Oconee; OHP = Ohoopee; ALT = Altamaha Mainstem. Figure 3.2. The natural log of mean metal(loid) concentration in the tissue of E. hopetonensis at each site, plotted as a function of the natural log mean concentration in the tissue of Corbicula. All linear regressions are significant (p < 0.05) with the following r2 values: As = 0.5441; Cd = 0.5807; Cu = 0.3444; Hg = 0.7524; Pb = 0.6686. Figure 3.3. The natural log of mean metal(loid) body burden of E. hopetonensis at each site, plotted as a function of the natural log mean body burden of Corbicula. All linear regressions are significant (p < 0.05) with the following r2 values: As = 0.7226; Cd = 0.6303; Cu = 0.5694; Hg = 0.5172; Zn = 0.7962. Figure 3.4. Mean tissue concentrations found in Corbicula and E. hopetonensis of A) As and Cd; B) Cu and Zn; C) Hg and Pb at each site, arranged up to downstream. Values that are significantly (p < 0.05) higher than those of the site directly upstream are indicated with ↑, while those that are significantly lower are indicated by ↓. River convergences are indicated using lines and large arrows. In the cases of significant differences between two upstream sites, two arrows are used.

64
Figure 3.1.
OMG1
OMG2 OMG3
OMG4
OCN1
OCN2
ALT1&2
ALT3
OHP
ALT4
ALT5&6
ALT7

65
Figure 3.2.
LN Corbicula [Metal]
-4 -2 0 2 4 6
LN H
opet
onen
sis [
Met
al]
-3
-2
-1
0
1
2
3Cu
Hg
Pb
Cd
As
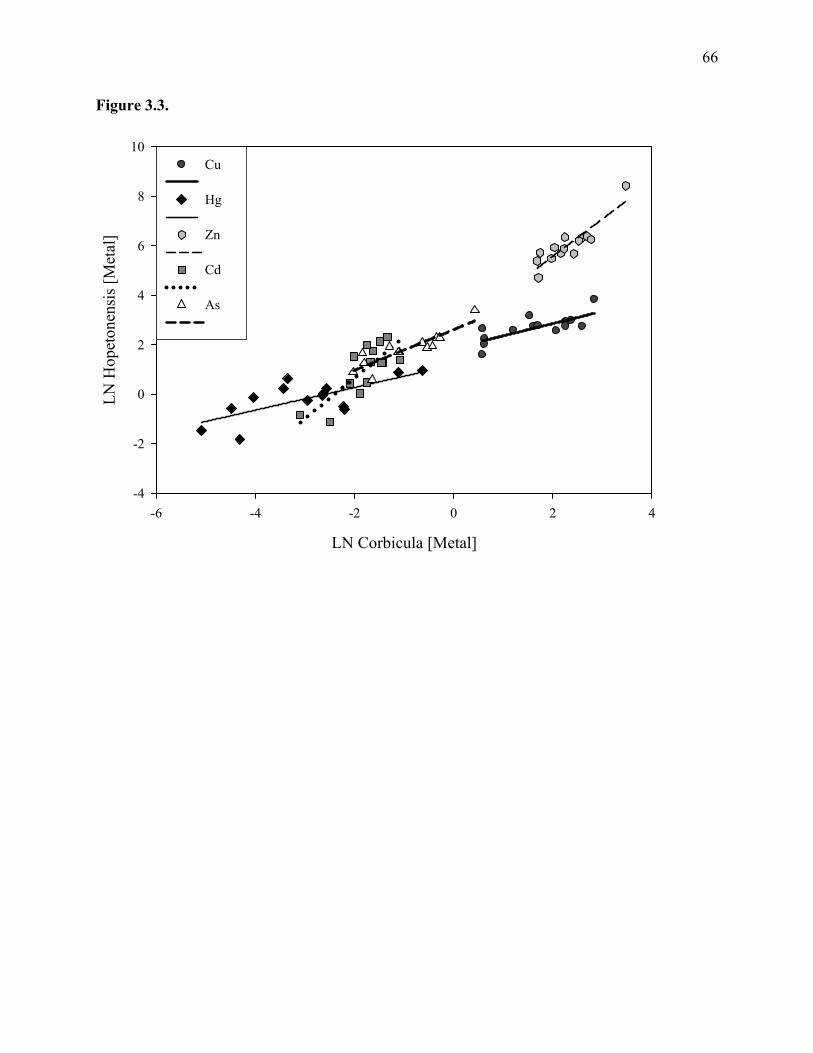
66
Figure 3.3.
LN Corbicula [Metal]
-6 -4 -2 0 2 4
LN H
opet
onen
sis [
Met
al]
-4
-2
0
2
4
6
8
10Cu
Hg
Zn
Cd
As

67
Figure 3.4.
OMG1 OMG2 OMG3 OMG4 OCN1 OCN2 ALT1 ALT2 ALT3 OHP1 ALT4 ALT5 ALT6 ALT7
[Met
al] (μg
/g)
0
1
2
3
4
5
6
7As (Corb)As (Hope)Cd (Corb)Cd (Hope)
↓ ↓
↓↓↑
↑
↑
↓↓
↓↑↑
↓
↓↓
↓
↓ ↓ ↓
↑ ↑
↑
↑
↓↑
↓↑↓
↑
A.
OMG1 OMG2 OMG3 OMG4 OCN1 OCN2 ALT1 ALT2 ALT3 OHP1 ALT4 ALT5 ALT6 ALT7
[Met
al] (μg
/g)
0
100
200
300
400
500
600
700Cu (Corb)Cu (Hope)Zn (Corb)Zn (Hope)
↓ ↓ ↓↓↓ ↓
↓↓
↓↓↓
↓
↓
↓↓↑ ↑
↑ ↑
↑ ↑ ↑
↑ ↑
B

68
Figure 3.4 (cont.)
OMG1 OMG2 OMG3 OMG4 OCN1 OCN2 ALT1 ALT2 ALT3 OHP1 ALT4 ALT5 ALT6 ALT7
[Met
al] (μg
/g)
0
2
4
6
8Hg (Corb)Hg (Hope) Pb (Corb) Pb (Hope)
↑ ↓↓ ↓↓
↑
↑
↑ ↑
↓↑
↓↑
↑↑
↓↓ ↓
↓↑
C.

69
References
Abaychi, J. K. and Y. Z. Mustafa. 1988. The Asiatic clam, Corbicula fluminea - an indicator of trace metal pollution in the Shatt Al-Arab River, Iraq. Environmental Pollution 54:109-122.
Andres, S., M. Baudrimont, Y. Lapaquellerie, F. Ribeyre, N. Maillet, C. Latouche, and A. Boudou. 1999. Field transplantation of the freshwater bivalve Corbicula fluminea along a polymetallic contamination gradient (river Lot, France): I. Geochemical characteristics of the sampling sites and cadmium and zinc bioaccumulation kinetics. Environmental Toxicology and Chemistry 18:2462-2471.
Angelo, R. T., M. S. Cringan, D. L. Chamberlain, A. J. Stahl, S. G. Haslouer, and C. A. Goodrich. 2007. Residual effects of lead and zinc mining on freshwater mussels in the Spring River Basin (Kansas, Missouri, and Oklahoma, USA). Science of the Total Environment 384:467-496.
Baudrimont, M., J. Metivaud, R. MauryBrachet, F. Ribeyre, and A. Boudou. 1997. Bioaccumulation and metallothionein response in the Asiatic clam (Corbicula fluminea) after experimental exposure to cadmium and inorganic mercury. Environmental Toxicology and Chemistry 16:2096-2105.
Cain, D. J. and S. N. Luoma. 1990. Influence of seasonal growth, age, and environmental exposure on Cu and Ag in a bivalve indicator, Macoma balthica, in San-Francisco Bay. Marine Ecology-Progress Series 60:45-55.
Caldwell, R. S. and D. R. Buhler. 1983. Heavy metals in estuarine shellfish from Oregon. Archives of Environmental Contamination and Toxicology 12:15-23.
Couillard, Y., P. G. C. Campbell, J. Pellerinmassicotte, and J. C. Auclair. 1995. Field transplantation of a freshwater bivalve, Pyganodon grandis, across a metal contamination gradient .2. Metallothionein response to Cd and Zn exposure, evidence for cytotoxicity, and links to effects at higher levels of biological organization. Canadian Journal of Fisheries and Aquatic Sciences 52:703-715.
Doherty, F. G. 1990. The Asiatic clam, Corbicula Spp, as a biological monitor in freshwater environments. Environmental Monitoring and Assessment 15:143-181.
Doherty, F. G., D. S. Cherry, and J. Cairns. 1987. Valve closure responses of the Asiatic clam Corbicula fluminea exposed to cadmium and zinc. Hydrobiologia 153:159-167.

70
Doherty, F. G., D. S. Cherry, and J. Cairns. 1990. Multiseasonal tissue-growth trends in Corbicula fluminea (Bivalvia, Corbiculidae) from the New River, Virginia. Nautilus 104:10-15.
Elder, J., Collins, JJ. 1991. Freshwater molluscs as indicators of bioavailability and toxicity of metals in surface-water systems. . Reviews Environ Contam Tox 122:37-79.
Elder, J. F. and H. C. Mattraw. 1984. Accumulation of trace elements, pesticides, and polychlorinated biphenyls in sediments and the clam Corbicula manilensis of the Apalachicola River, Florida. Archives of Environmental Contamination and Toxicology 13:453-469.
Graney, R. L., D. S. Cherry, and J. Cairns. 1983. Heavy metal indicator potential of the Asiatic clam (Corbicula fluminea) in artificial stream systems. Hydrobiologia 102:81-88.
Graney, R. L., D. S. Cherry, and J. Cairns. 1984. The influence of substrate, pH, diet and temperature upon cadmium accumulation in the Asiatic clam (Corbicula fluminea) in laboratory artificial streams. Water Research 18:833-842.
Kesler, D. H. 2004. Influence of a lentic area on condition indices of Corbicula fluminea in the Wolf River, Tennessee. Journal of Freshwater Ecology 19:445-453.
Kraemer, L. R. 1979. Corbicula (Bivalvia, Sphaeriacea) vs indigenous mussels (Bivalvia, Unionacea) in United-States Rivers - A hard case for interspecific competition? American Zoologist 19:1085-1096.
Luoma, S. N., R. Dagovitz, and E. Axtmann. 1990. Temporally intensive study of trace metals in sediments and bivalves from a large river, estuarine system - Suisun Bay Delta in San-Francisco Bay. Science of the Total Environment 97-8:685-712.
Meador, J. R. 2008. The development and evaluation of a freshwater mussel sampling protocol for a large lowland river. University of Georgia, Athens, GA.
Naimo, T. J. 1995. A review of the effects of heavy metals on freshwater mussels. Ecotoxicology 4:341-362.
Paquin, P. R., J. W. Gorsuch, S. Apte, G. E. Batley, K. C. Bowles, P. G. C. Campbell, C. G. Delos, D. M. Di Toro, R. L. Dwyer, F. Galvez, R. W. Gensemer, G. G. Goss, C. Hogstrand, C. R. Janssen, J. C. McGeer, R. B. Naddy, R. C. Playle, R. C. Santore, U.

71
Schneider, W. A. Stubblefield, C. M. Wood, and K. B. Wu. 2002. The biotic ligand model: a historical overview. Comparative Biochemistry and Physiology C-Toxicology & Pharmacology 133:3-35.
Patrick, R. 1994. Rivers of the United States. J. Wiley, New York.
Perceval, O., Y. Couillard, B. Pinel-Alloul, A. Giguere, and P. G. C. Campbell. 2004. Metal-induced stress in bivalves living along a gradient of Cd contamination: relating sub-cellular metal distribution to population-level responses. Aquatic Toxicology 69:327-345.
Pourang, N. 1996. Heavy metal concentrations in surficial sediments and benthic macroinvertebrates from Anzali wetland, Iran. Hydrobiologia 331:53-61.
Reese, E. G. and D. P. Batzer. 2007. Do invertebrate communities in floodplains change predictably along a river's length? Freshwater Biology 52:226-239.
Sickel, J. 1973. A new record of Corbicula manilensis (philippi) in the southern Atlantic slope region of Georgia. . Nautilus 87:11-12.
Stites, D. L., A. C. Benke, and D. M. Gillespie. 1995. Population dynamics, growth, and production of the Asiatic clam, Corbicula fluminea, in a blackwater river. Canadian Journal of Fisheries and Aquatic Sciences 52:425-437.
Tatem, H. E. 1986. Bioaccumulation of polychlorinated biphenyls and metals from contaminated sediment by freshwater prawns, Macrobrachium rosenbergii and Clams, Corbicula fluminea. Archives of Environmental Contamination and Toxicology 15:171-183.
Unrine, J. M., W. A. Hopkins, C. S. Romanek, and B. P. Jackson. 2007. Bioaccumulation of trace elements in omnivorous amphibian larvae: Implications for amphibian health and contaminant transport. Environmental Pollution 149:182-192.
USEPA. 1994. EPA Method 3015. Microwave assisted acid digestion of aqueous samples and extracts. U.S. Environmental Protection Agency, Washington, D.C.
USEPA. 1996. EPA Method 3052. Microwave assisted digestion of siliceous and organically based matrices. Revision 0 (December 1996). U.S. Environmental Protection Agency, Washington, D.C.

72
Villar, C., J. Stripeikis, L. D'Huicque, M. Tudino, O. Troccoli, and C. Bonetto. 1999. Cd, Cu and Zn concentrations in sediments and the invasive bivalves Limnoperna fortunei and Corbicula fluminea at the Rio de la Plata basin, Argentina. Hydrobiologia 416:41-49.
Williams, J. D., M. L. Warren, K. S. Cummings, J. L. Harris, and R. J. Neves. 1993. Conservation status of freshwater mussels of the United States and Canada. Fisheries 18:6-22.

73
Appendix 3.1. Element concentrations (in μg/g) in the tissues of each bivalve species, given as the mean of each site, plus or minus standard error. Underlined values indicate a mean that is significantly higher than the mean for the other species co-occurring at that site. These sites are those on the major tributaries of the Altamaha.
Site Species As Cd Cr Cu Hg Mn Ni Pb Zn C. flum. 6.35±0.31 0.83±0.13 UR 71.7±5.48 0.163±0.031 20.0±4.6 1.50±0.30 0.154±0.019 137±6 OCN1 E. hope. 3.70±0.46 0.84±0.23 UR 6.33±0.51 0.209±0.064 7171±942 1.31±0.19 0.275±0.031 497±187C. flum. 3.05±0.40 1.06±0.09 1.50±0.18 43.2±6.7 0.129±0.016 18.0±1.8 2.02±0.37 0.245±0.015 126±7 OCN2 E. hope. 1.51±0.05 0.27±0.02 0.55±0.07 4.62±0.33 0.142±0.007 2259±190 1.09±0.08 0.134±0.012 132±7 C. flum. 4.85±0.23 4.77±0.20 UR 80.4±8.7 0.566±0.056 81.0±9.5 1.65±0.16 0.429±0.076 169±3 OMG1 E. hope. 1.76±0.24 2.56±0.44 UR 6.47±0.60 0.326±0.040 3901±700 3.67±1.13 0.580±0.106 148±14 C. flum. 3.01±0.35 2.30±0.23 3.11±0.63 34.7±11.6 0.212±0.160 18.2±1.6 9.23±1.86 BD 134±5 OMG2 E. hope. 1.83±0.12 0.86±0.12 3.29±0.58 4.71±0.28 0.298±0.018 2897±327 1.68±0.22 0.312±0.053 125±4 C. flum. 4.09±0.10 2.46±0.16 1.94±0.16 64.8±2.8 0.687±0.026 16.8±2.6 4.25±5.66 BD 104±3 OMG3 E. hope. 2.18±0.11 2.35±0.14 2.45±0.30 6.38±0.22 0.314±0.148 4323±349 1.97±0.10 0.737±0.025 119±6 C. flum. 3.55±0.20 3.05±0.13 2.39±0.15 38.9±4.3 0.381±0.046 64.6±11.3 2.78±0.32 BD 131±3 OMG4 E. hope. 2.04±0.09 1.70±0.18 2.52±0.25 5.50±0.28 0.328±0.017 3148±231 1.94±0.26 0.348±0.031 118±3 C. flum. 4.62±0.13 3.23±0.12 UR 152.1±9.1 7.49±0.54 45.1±11.2 7.77±4.38 1.31±0.188 179±5 OHP1 E. hope. 2.26±0.15 3.39±0.25 UR 8.14±0.41 1.06±0.032 7715±755 3.08±0.21 5.37±0.687 201±9
* Standard error could not be calculated for this element at this site. BD = All samples were below detection for this element at this site. UR = All samples were unreliable for this element at this site.

74
Appendix 3.1 (cont). Element concentrations (in μg/g) in the tissues of each bivalve species, given as the mean of each site, plus or minus standard error. Underlined values indicate a mean that is significantly higher than the mean for the other species co-occurring at that site. These sites are those on the main channel of the Altamaha River.
Site Species As Cd Cr Cu Hg Mn Ni Pb Zn C. flum. 3.89±0.10 1.42±0.09 UR 41.0±3.3 0.543±0.049 41.3±3.9 BD BD 100±4 ALT1 E. hope. 2.41±0.23 1.04±0.20 UR 4.72±0.37 0.307±0.026 3473±543 1.17±0.27 0.268±0.022 157±16 C. flum. 5.88±0.49 2.05±0.24 UR 83.8±19.7 2.776±0.671 105±23.3 BD BD 122±6 ALT2 E. hope. 2.84±0.19 0.94±0.15 UR 5.45±0.41 0.620±0.304 4753±761 0.94±0.19 0.266±0.041 171±14 C. flum. 4.68±0.26 2.00±0.17 8.46±0.63 43.4±3.2 0.318±0.054 35.8±2.0 5.61±0.59 BD 138±7 ALT3 E. hope. 2.39±0.10 0.43±0.02 1.73±0.09 6.78±0.34 0.217±0.011 4061±212 2.30±0.42 0.281±0.049 147±5 C. flum. 6.22±2.45 6.37±3.70 4.95±1.20 63.0±9.5 1.456±0.175 19.2±1.0 3.19±0.56 0.608* 144±9 ALT4 E. hope. 2.18±0.09 1.39±0.22 2.35±0.39 5.37±0.21 0.492±0.031 4318±497 1.53±0.13 0.750±0.063 150±6 C. flum. 3.05±0.26 0.78±0.18 UR 39.8±6.1 0.529±0.147 30.7±10.5 BD 0.322* 60.9±2 ALT5 E. hope. 2.28±0.21 0.35±0.03 UR 4.50±0.34 0.191±0.023 1358±217 1.25±0.39 0.200±0.030 103±9 C. flum. 4.75±0.82 1.32±0.19 UR 97.8±16.9 0.787±0.156 151±96.1 2.59* 0.589* 71.8±9 ALT6 E. hope. 2.30±0.21 0.49±0.06 UR 4.90±0.34 0.187±0.025 2141±723 0.86±0.20 0.313±0.063 112±16 C. flum. 5.20±0.15 1.67±0.10 5.59±0.60 67.4±2.9 0.491±0.049 31.0±3.9 3.22±0.30 0.291±0.301 112±3 ALT7 E. hope. 2.92±0.16 1.06±0.27 2.96±0.31 4.73±0.23 0.282±0.014 5619±661 1.43±0.11 0.277±0.036 154±10
* Standard error could not be calculated for this element at this site. BD = All samples were below detection for this element at this site. UR = All samples were unreliable for this element at this site.

75
CHAPTER FOUR
THE ASIAN CLAM CORBICULA FLUMINEA AS A BIOMONITOR OF TRACE ELEMENT
CONTAMINATION: ACCOUNTING FOR NATURAL VARIATION WHEN IDENTIFYING
ANTHROPOGENIC SOURCES1
Abstract
Widespread decline of freshwater mussel populations has led to interest in monitoring
anthropogenic contaminants that could potentially be harming native mussel populations. In this
study, specimens of the invasive clam, Corbicula fluminea, were collected above and below
possible sources of potentially toxic trace elements (As, Cd, Cr, Cu, Hg, Pb and Zn) in the
Altamaha River System. Their bioaccumulation of these elements was quantified, along with
environmental (water and sediment) concentrations. Hierarchical linear models were used to
decrease variability in concentrations related to environmental (site water chemistry and
sediment characteristics) and individual (growth metrics) variables. This study found
significantly elevated bioaccumulation of Cd, Cu and Hg below the outfall of kaolin processing
facilities, Zn below a tire cording facility, and Cr below a nuclear power plant and a paper pulp
mill. Hierarchical linear models found correlations between trace element accumulation and
variables such as upstream distance, dissolved oxygen, % silt and clay in the sediment, elemental
sediment concentration, shell length and bivalve condition index. Taking into account this
variability reduced the number of sites with significantly elevated trace elements. This finding
1 Shoults-Wilson WA, Peterson JT, Unrine JM, Rickard J, Black MC. To be submitted to Environmental Toxicology and Chemistry.

76
shows that conclusions about trace element distribution cannot be drawn from bioaccumulation
studies without taking into account environmental and individual sources of variation.
Introduction
An unfortunate recent development in aquatic ecology has been the widespread decline of
native mussel populations throughout the United States (Williams et al. 1993). There are
numerous possible explanations for these declines, including habitat alteration from
sedimentation and impoundment, changes in fish-host populations and distributions, competition
from invasive species and exposure to anthropogenic toxicants (Williams et al. 1993, Naimo
1995, Vaughn and Taylor 1999).
Toxic trace elements such as arsenic (As), cadmium (Cd), chromium (Cr) copper (Cu),
mercury (Hg), lead (Pb) and zinc (Zn) have been shown to exert acute and chronic toxic effects
on various freshwater bivalves (Elder 1991, Naimo 1995). Responses can include altered valve
movement (Doherty et al. 1987), inhibition of growth (Belanger et al. 1986), reduced fecundity
(Perceval et al. 2004) and mortality (Harrison et al. 1984, Elder 1991, Naimo 1995). Because of
their ability to accumulate trace elements following exposure, freshwater bivalves, particularly
the invasive Asian clam Corbicula fluminea (hereafter Corbicula), are frequently used as
biological monitors of trace elements contamination (Millington 1983, Abaychi and Mustafa
1988, Doherty 1990, Luoma et al. 1990, Pourang 1996, Gundacker 2000, Tomazelli et al. 2003,
Sebesvari et al. 2005, Angelo et al. 2007).
In biomonitoring studies, an increased concentration of trace elements in the tissues of
the biomonitor species is typically considered an indicator of increased environmental
availability of that element. However, a host of environmental factors that include size and age
(MetcalfeSmith et al. 1996), sampling season (Luoma et al. 1990) and the chemistry of

77
surrounding water and sediment (Graney et al. 1984, Angelo et al. 2007) have all been shown to
be correlated to the bioaccumulation of various trace elements. This makes it difficult to draw
conclusions about contaminant levels based solely on tissue concentrations of trace elements in
the biomonitor organism.
The Altamaha River system is the largest drainage basin encompassed by the state of
Georgia and is home to 3 imperiled native mussel species (Meador 2008). The Oconee River, a
primary tributary of the Altamaha is also home to an extensive kaolin mining and processing
industry (Pruett 2000). The kaolin industry in Georgia and abroad, has been implicated for
increasing loads of Zn and Hg in local sediments (Jordao et al. 2002, Lasier et al. 2004), with
potential detrimental implications to native mussels. Other potential point sources for trace
elements in this region include a former tire cording plant, which has been fined for excessive
discharge of Zn and Cu, a nuclear power plant, a paper mill and a state prison. The area is also
subject to non-point sources, although its lower reaches have only small urban areas and little
light industry.
This study examined 1) whether proximity to various industrial activities increases the
concentrations of trace elements in resident bivalves; 2) the utility of hierarchical linear
modeling in accounting for variability in trace elements accumulation; and 3) the amount of
variability in elemental concentrations that could be accounted for by environmental factors or
individual growth rather than human activity. This would not only indicate sources of stressors
to bivalves in the Altamaha River but it would also provide a more accurate indication of human
influence on trace element accumulation.

78
Materials and Methods
Study Area
The Altamaha River drainage is completely contained within the state of Georgia, USA.
The mainstem of the Altamaha River is formed by the confluence of the Ocmulgee and Oconee
Rivers, whose headwaters are in the piedmont phyto-geographic province and cross the fall line
at Macon and Milledgeville GA, respectively (Reese and Batzer 2007). Study sites were chosen
based on potential point sources of trace elements and to provide coverage of the majority of the
watershed area.
Twenty-two sites were chosen for this study, with sites located upstream and downstream
of 6 potential point sources of trace elements: Little Commissioner’s Creek (LCC) which carries
effluent from a kaolin processing facility, Kettle Creek (KC) which drains an area with active
kaolin mines, the former Amercord tire facility (AMC) on the Ocmulgee River, Plant Hatch
Nuclear Power Station (PH) and the Rayonier paper mill (RAY) on the Altamaha River and the
Reidsville State Penitentiary (RSP) on the Ohoopee River (Figure 4.1). The remaining 10 sites
were spread out among the rivers and their tributaries, with emphasis placed on the Oconee
because of the large amount of kaolin mines within its drainage. Habitats sampled included
depositional sloughs, edges of sandbars, rocky shelves of the unique “Altamaha grit”
microhabitat and gravel seams in the main channel. GIS coordinates were taken and recorded for
each site at the time of sampling (Magellan explorist 210; Thales Navigation, San Diego CA),
and a sketch of the site was made indicating major features of substrate and local morphology.
Sampling occurred during the spring and early summer of 2007.

79
Sample Collection
Sample collection is described in detail in Chapter 3. Briefly, water temperature,
dissolved oxygen, pH and conductivity were determined on site, while water alkalinity and
hardness were determined later in the laboratory. Grab samples of water (~500 mL), sediment
(~500 mL) and Corbicula (5-35 individuals) were collected at each site. A petite ponar grab was
used to collect sediment and was also used to collect Corbicula during high flows. All samples
were kept in a cooler that contained small amounts of ice until they could be transported back to
the laboratory.
Sample Processing
Water and Corbicula processing are described in more detail in Chapter 3. Water
samples were filtered (0.5 μm filter) and acidified (10%; trace metal grade HNO3). Corbicula
were measured for length, height, depth and shell mass. Whole tissues were removed from
shells, dried, massed and stored in acid-washed vessels. Shell valves were measured for volume
as described in Kesler (2004).
Sediment samples were split into two separate sub-samples. One sub-sample was re-
homogenized and poured through a 1 mm acid-washed plastic sieve. The resulting < 1 mm
fractions were placed in acid-washed nalgene containers and stored at –20°C. Frozen samples
were thawed under refrigeration at a later date and wet-sieved again through a 105 μm Nytex
mesh (Spectrum Mesh; Rancho Dominguez CA, USA) into an acid-washed 600 mL beaker as in
(Luoma et al. 1990). Fine fractions were dried at temperatures ranging from room temperature
to 50°C, homogenized using a dry, acid-washed mortar and pestle and stored in acid washed
centrifuge tubes under anhydrous conditions until digestion.

80
The other sub-sample was refrigerated until it could be homogenized and dried. It was
then put through nested sieves (4 mm, 2 mm, 1 mm, 500 μm, 250 μm, 125 μm and 64 μm mesh)
as recommended by Plumb (1981). These sediment fractions were carefully transferred to weigh
boats and massed to determine the percentage of each size fraction in the overall sample. At
least 98% of the original material was accounted for.
Acid-Digestion
Between 0.25 and 0.5 g of dried fine fraction sediment were completely digested in 8 mL
trace metal grade HNO3 and 3 mL HF, using a MARS 5 HP 500 Plus system (CEM Corp;
Matthews NC, USA), under the conditions of EPA protocol 3052 (USEPA 1996). Three
replicate samples were digested for each of the sediment composites. All digestions were diluted
in 24 mL of Milli-Q water to ~33% acid. Blanks and standard sediments (MESS-3, National
Research Council of Canada, Ottawa ON, Canada; NIST 1645, National Bureau of Standards,
Gaithersburg MD, USA) were also digested with each run. All samples, blanks and standards
were stored at room temperature in acid-washed centrifuge tubes until analysis.
Whole tissues of Corbicula were completely digested in 5 mL of trace metal grade
HNO3, using a MARS 5 HP 500 Plus system (CEM Corp; Matthews NC, USA), under the
conditions of EPA protocol 3015 (USEPA 1994). Digestions were diluted with 10 mL Milli-Q
water to ~33% acid. Exact concentrations were calculated using dry tissue mass and the mass of
the final solution. One blank (acid only) and one standard reference material (SRM) of ~0.075 g
TORT-2 lobster hepatopancreas (National Research Council of Canada, Ottawa ON, Canada)
were digested in each run. Dilute samples, blanks and standard were stored at room temperature
until analysis.

81
Sample Analysis
Analyses of digested samples were carried out as described in Unrine et al. (2007). Trace
element concentrations in digests (As, Cd, Cr, Cu, Hg, Mn, Ni, Pb and Zn) were quantified using
a Perkin-Elmer Sciex Elan DRC Plus inductively coupled plasma-mass spectrometer (ICP-MS;
Norwalk CT, USA) operating in standard mode. Method detection limits (MDLs) were
calculated using blank digests. Mean MDLs ranged from 0.0250 μg/g for Cd to 3.360 μg/g for
Cu. Recoveries of SRMs were in good agreement with certified values, mean recoveries ranging
from 85.27% for As and 130.04% for Pb. Relative percent difference (RPD) of replicate
dilutions of sub-samples was used to approximate analytical error. On average (n=34) RPD
ranged from 2.01% for As and Zn to 12.80% for Pb. Spikes of ~2-5 times the un-spiked sample
concentration had mean recoveries ranging from 91.61% for Cr and 101.87% for Ni (n=33).
Statistical Analysis
Initially, analysis of variance (ANOVA) followed by Duncan’s post hoc test were
calculated using Statistical Analysis Software (SAS v9.1, SAS Institute, Cary NC, USA). These
tests determine significant (α = 0.05) differences between metal concentrations in clams
collected both upstream and downstream of potential trace element sources (Fig. 4.1).
In order to reduce variation in the data caused by natural factors, we employed
hierarchical linear models. Hierarchical linear models are able to reduce variation at multiple
levels of biological organization, such as the individual level, the site (i.e. local environment)
level, the regional (e.g. watershed) level, etc. By reducing naturally occurring variation, this
approach can then test what differences in bioaccumulation are more likely due to human

82
activities. This approach also allows multiple models to be applied to the data and ranked for
their usefulness (Burnham and Anderson 2001).
In our approach to limiting natural variation in bioaccumulation, we used predictors at
two levels of biological organization. Individual (Level-1) predictors were: shell length, height
and depth; shell thickness index [shell mass / shell length (Griffiths and Cyr 2006)]; condition
index [tissue dry weight / shell volume; (Kesler 2004)]; tissue dry weight. Site specific (Level-2)
predictors were: latitude, longitude and upstream distance from the estuary; day of the year
collected; water temperature, DO, pH, conductivity, alkalinity and hardness; percent sediment
fraction (silts/clays, very fine sand, fine sand, medium sand, coarse sand, very coarse sand, fine
gravel, gravel); sediment sorting index (standard deviation of sediment fractions); sediment
coarseness index (weighted average of sediment fractions); and water and sediment
concentrations of the element being modeled. Incorporating Level-1 predictors into a model
decreases variability within a site, while incorporating Level-2 predictors into a model decreases
variability between sites.
All level-2 predictors were considered singly and the decrease in inter-site variation
calculated. All combinations of the Level-2 predictors that decreased inter-site variation were
then considered in two-variable models unless they were correlated to each other (Pearson’s
coefficient squared < 0.30). Level-1 predictors were then considered singly and the decrease in
intra-site variation calculated for each. Fully hierarchical models of 1 Level-1 predictor and 1
Level-2 predictor were also considered for all Level-1 predictors, combined with most Level-2
predictors (only the 3 sediment fractions which decreased intra-site variation the most and
%silt/clay were considered in this manner).

83
The Aikake Information Criteria (AIC) were calculated for all models using the following
formula:
AIC = -2*ln(likelihood) + 2*K
Where K = the number of parameters in the model (Burnham and Anderson 2001).
Data sets where n/K < 40 had AICs bias-adjusted using the following formula:
AICC = -2*ln(likelihood) + 2*K + [2*K*(K+1)]/(n-K-1)
AIC values were used to rank models, with the model with the lowest AIC being the best
fitting model. Subtracting the lowest AIC from all AICs resulted in ranked Δi values, such that
the best fitting model had Δi = 0. Finally Aikake weights were calculated to quantify the
plausibility of the model, using the following equation:
wi = __exp(-0.5*Δi)__ ΣR
r=1 exp(-0.5*Δr)
Only models in which wi(Δi>0) > (wi(Δi=0) / 2) were considered for the selected model. In
other words, only models for which the best-fit model was less than twice as likely were
considered. A final model for each element was selected based on low Aikake weights, the
environmental importance of the predictors used in the model and the ability to make
up/downstream comparisons using the model (see below).
Using the final models to take into account inter- and/or intra-site variability, the
difference of the intercepts (i.e. mean tissue concentrations after the model is fit) for all the
up/downstream pairs was calculated. The 95% confidence intervals of all difference were also
calculated. Significantly non-zero (p < 0.05) differences were those whose 95% confidence
intervals did not overlap zero. A non-zero difference indicated that the mean concentrations of
the up/downstream pair were significantly different.

84
Results
Mean concentrations of elements in all three compartments (water, sediment, Corbicula
tissues) are compiled in Appendix 4.1. The up/downstream comparisons of mean tissue
concentrations made using ANOVA with Duncan’s post hoc test are represented in Figure 4.2.
Of the six up/downstream comparisons, the site downstream of LCC is the only one that
consistently showed significantly (p < 0.05) higher tissue concentrations of trace elements (Cd,
Cu, Hg, and Zn) than in the tissues of clams collected from the site upstream (Figure 4.2). All
other sites demonstrated no definitive trends between elements, showing significantly higher
concentrations in clams for one or more element both upstream and down.
Best fitting hierarchical linear models for each element are given in Table 4.1 with AIC,
Δi and wi values. The final hierarchical models selected for each element are given in Table 4.2
with estimates for each parameter and an estimation of the reduction in variability resulting from
using the model. Models with Δi > 0 were chosen over models with Δi = 0 when wi(Δi>0) >
(wi(Δi=0) / 2) and when their model parameters were deemed more environmentally relevant. For
instance, upstream distance was considered to be more environmentally relevant to stream spatial
organization than longitude or latitude and was preferred to these two (As and Cr models; Table
4.1). In one instance (Cd model) a final model in which Δi > 0 was selected because the model
in which Δi = 0 could not calculate all up/downstream comparisons (Table 4.1).
The differences in the final model intercepts (mean concentrations of elements) between
clam samples at each up/downstream pair are given in Figure 4.3. Note that the 95% confidence
interval (CI95) displayed in this graph provides a visual indication of significant differences. If
the CI95 overlaps with zero, that indicates there is no difference between the concentrations
found at each site after the final model reduces variability.

85
Discussion
Applying the hierarchical linear models to the bioaccumulation data from the 22 sites
reduced overall variability in the data to varying degrees (Table 4.2). When these models were
used to assess six up/downstream comparisons, fewer significant differences between sites were
found than when the tissue concentrations of these sites were compared directly. In this section,
we will discuss the effects of the model on our conclusions and how they relate to previous
studies.
Arsenic (As)
When ANOVA was used to compare the six up/downstream comparisons in our study,
two were found to be significantly different, indicating higher exposure to As at one site rather
than the other (Figure 4.2B). Following the selection of a final model (Table 4.1 & 4.2),
variability related to DO and upstream distance was controlled and the resulting comparisons
revealed no significant differences between any up/downstream pair (Figure 4.3B).
Few studies have used Corbicula as a biomonitor species for As, although past work has
shown no relation between As accumulation and the length or shell weight of organisms
(Sebesvari et al. 2005). This agrees with our finding that organism growth metrics did not
explain As accumulation in Corbicula. On the other hand, our findings indicate that DO
influences As accumulation, with clams collected from more oxygenated surface waters
portending higher accumulation. This increased accumulation may be due to increased
availability of the arsenate ion, the dominant form of As under oxic conditions. It could also be
related to a seasonal fluctuation in As accumulation, since higher DO accompanies higher flows
and colder temperatures. The selected model also incorporated stream distance to decrease inter-
site variability, with upstream sites tending to show lower levels of bioaccumulation. The sites

86
that we sampled on smaller, blackwater tributaries tended to be located further upstream, while
sites sampled on river mainstems were on average located further downstream. Thus, these
differences in accumulation could be attributed to differences in the chemistry between small,
blackwater tributaries and main river channels. In either case, it appears that variations in As
bioaccumulation at these site pairs can be primarily attributed to environmental differences at
each site rather than human activity.
Cadmium (Cd)
Using ANOVA, Corbicula collected from a site directly downstream of LCC were found
to have accumulated significantly higher concentrations, while the reverse was true for sites
above and below RAY (Figure 4.2B). However, using a linear hierarchical model incorporating
the length of individual clams and the % of silt and clay (<64 μm) particles at each site, the
difference between the RAY sites was no longer significant at α = 0.05 (Figure 4.3B).
These Cd data illustrate the importance of taking into account environmental conditions
at each site before attributing significant differences to human activities. The site upstream of
RAY was predominantly very coarse sand (47.85%) with little silt/clay (1.26%). Meanwhile, the
downstream site was located in a slough with predominantly very fine sand (49.16%) and a large
amount of silt/clay (16.28%). Past studies using artificial streams have found that Corbicula
accumulate significantly less Cd in a predominantly silt/clay system than in systems that were
predominantly or completely sandy in composition (Graney et al. 1984). Past studies also
support our finding that longer Corbicula accumulate higher concentrations of Cd than smaller
individuals (Abaychi and Mustafa 1988, Metcalfe-Smith et al. 1996, Angelo et al. 2007).
However, even with the model taking into account some of the variation in observed
concentrations, clams collected from the site below LCC accumulated significantly higher Cd
87
concentrations than the upstream site. This indicates that effluent from the kaolin-processing
plant or another local industry may be introducing bioavailable Cd to Commissioner’s Creek (an
Oconee tributary) via LCC. This is somewhat surprising, given that sediments potentially
impacted by kaolin processing activity typically show concentrations of Cd below detection
(Jordao et al. 2002, Lasier et al. 2004). The concentrations (Appendix 4.1) of Cd found in
sediments from our study sites on the Oconee were 1-2 orders of magnitude greater than those
found by Lasier et al. in the same area in 1998, using similar methodos. This may indicate a new
source of Cd in the area or a change in industrial practices.
Chromium (Cr)
Clams sampled at sites downstream of both the Plant Hatch (PH) nuclear power facility
and Rayonier paper mill (RAY) accumulated significantly higher concentrations of Cr than their
upstream counterparts when compared using ANOVA (Figure 4.2B). Subsequent hierarchical
modeling resulted in a model using organism condition and stream distance as the primary
controls for variability, such that Corbicula with a better condition that were located further
downstream, accumulated greater concentrations of Cr. Even after the model took into account
the variation caused by condition and stream distance, significant differences were still found
between the paired sites at PH and RAY (Figure 4.3B).
Past studies have shown a correlation between Cr accumulation in Corbicula and
organism size, the season of collection and sediment loads of Cr (Luoma et al. 1990). In our
study, indicators of season (temperature, DO, day of year) and [Cr]Sediment did not produce one of
the best-fit models. Condition of the organism [tissue dry weight / shell volume; (Kesler 2004)]
was used in the selected model, with organisms in poorer condition showing higher accumulation
of Cr. Because dry weights of Corbicula can fluctuate seasonally (Luoma et al. 1990), this may

88
indicate some seasonal fluctuation in Cr accumulation. As with As, organisms in smaller
tributaries tended to accumulate lower concentrations of Cr, probably leading to the influence of
stream distance.
The significant difference between organisms above and below PH is most likely due to
the fact that the nuclear power station is a permitted discharger of Cr and Zn (USEPA 2006) and
elevated tissue concentrations of these elements may be expected. RAY, a paper fibers mill, has
permits to discharge Hg, Mn, Ni, Pb, V and Zn but not Cr (USEPA 2006). However, Cr has
been found bound to a potentially bioavailable fraction of pulp and paper waste from a mill in
Finland (Poykio et al. 2007). It is also closely associated with the ferro-manganese oxide (FMO)
fraction of freshwater sediment (Koretsky et al. 2006). By releasing large amounts of Mn
compounds [110000 lbs/year; (USEPA 2006)], the mill may be increasing bioavailability of Cr.
Copper (Cu)
ANOVA comparisons indicated significant differences between two site pairs (AMC and
LCC; Figure 4.2A). Model selection resulted in a best-fit model using shell length and upstream
distance as the variables. After controlling for these variables, both differences were still found
to be significant, while a third site pair was found to be significantly different (RSP; Figure
4.3A).
Like Cr, Cu has also been reported to vary with organism size, season, and sediment
concentrations of the metal (Luoma et al. 1990). Also like Cr, our best-fit model used stream
distance along with a growth metric (length) to reduce variation. With respect to the site pairs
showing significant differences, the site downstream of LCC showed significantly higher
concentrations of Cu. Sediment in the Oconee River has been shown to be enriched with Cu
(Lasier et al. 2004) but the authors could not link these levels to kaolin activities. Our findings

89
indicate a source of Cu emanating from LCC that causes increased concentrations of Cu in
downstream organisms. Copper readily sorbs to kaolin particles, with increased adsorption in
the presence of humic acids (Arias et al. 2002) and neutral pH (Katsumata et al. 2003) such as
can be found in some blackwater systems (Patrick 1994). Because bivalves preferentially filter
fine particles (Vaughn and Hakenkamp 2001), the presence of kaolin particles in solution could
be mobilizing copper and other metals. This is in agreement with some of the conclusions of the
biodynamic model of trace element bioaccumulation, which states that assimilation from food is
the primary source of metals to aquatic organisms (Luoma and Rainbow 2005). This has been
found to be true for Cu accumulation in Corbicula in particular (Croteau et al. 2004, Croteau and
Luoma 2005).
The other two site pairs (AMC and RSP) had upstream sites with significantly higher
concentrations of Cu. In the case of AMC, the former Amercord tire plant was fined for illegal
release of Cu compounds (ARK 2003), which would imply that organisms below its effluent
release may show increased accumulation. The Cu compounds released by the Amercord plant
apparently did not have a significant impact on accumulation at this site at the time of sampling.
Operations ceased at this plant in 2001, so discharges since that time have been limited to rain
overflow of chemical storage tanks (Spinrad 2003). This may mean that Cu at this site has been
diluted or sequestered with time, limiting the bioaccumulation that we observed, although there
was no difference in the Cu concentrations found in the sediment (Appendix 4.1). Sediment
sequestration of metals can occur fairly quickly and while it may decrease exposure in the short
term, contaminated sediment may serve as a long-term source (Salomons et al. 1987, Foster and
Charlesworth 1996).

90
The last site with significant differences after the model was taken into account (RSP) is
unique in being the only site whose difference was not shown to be significant using ANOVA.
The reason our linear hierarchical model indicated that the differences were significant was
because the downstream organisms were on average larger, while mean concentrations of Cu
were similar between the two sites. Controlling for shell length accentuated the slight difference
between the two sites. In other words, the upstream organisms accumulated higher levels of Cu
despite being smaller than the downstream organisms. Because Cu accumulation normally
increases with length, this small difference in concentration becomes important.
Mercury (Hg)
Of our six site pairs compared using ANOVA, three upstream sites were found to have
significantly higher levels of bioaccumulation of Hg than their downstream counterpart, while
one downstream site had significantly higher Hg concentrations (Figure 4.2C). The best-fit
linear hierarchical model for Hg used only the variable of shell length. Past studies have also
found bivalves with longer shells to accumulate higher concentrations of Hg (MetcalfeSmith et
al. 1996). Because larger individuals are older (Stites et al. 1995), this is probably due to fact
that the methylated form of Hg is readily accumulated in Corbicula tissues over time, with much
slower elimination that inorganic Hg (Inza et al. 1998). Older individuals will have more time to
accumulate Hg but will be unable to eliminate it.
After taking into account organism length, only two up/downstream pairs showed
significant differences in Hg bioaccumulation (Figure 4.3C). One pair consisted of the sites
above and below KC. In this case, the upstream site showed higher concentrations. This
probably reflects elevated methylation that takes place in wetlands (Rudd 1995), especially
humic-rich, blackwater wetlands (Jagoe et al. 1998), such as those that make up the riparian zone

91
of Buffalo Creek, where the sites were located. A recent survey of trace elements accumulated
by Corbicula in the Chattahoochee and Broad Rivers (Peltier et al. 2008) found the highest Hg
accumulation in catchments with higher percentages of forest cover. The authors attributed this
to the greater organic materials associated with forested catchments.
The other pair were again the sites above and below LCC. The downstream clams
accumulated significantly more Hg than the upstream site. This is not surprising, considering
that Lasier et al. (2004) found that sediments in the Oconee River directly below the confluence
with Commissioner’s Creek had concentrations of Hg higher than 83% of the sediments in the
National Status and Trends data set. Our sediment samples were mostly below detection for Hg,
but one site (OCN2) within the same region sampled by Lasier et al. contained similar
concentrations of Hg as those found by that study (Appendix 4.1). Commissioner’s Creek seems
to carry Hg to the Oconee River and that Hg enters the creek after the confluence with LCC. As
with other metals, Hg readily sorbs to kaolin in freshwater (Bilinski et al. 1991). It is therefore
possible that kaolin-processing activities may be responsible for increased Hg bioaccumulation
and concentration in the fine fractions of sediment. Again, this is in accordance with the
biodynamic model of bioaccumulation (Roditi et al. 2000).
Lead (Pb)
Lead accumulation showed no significant differences in any up/downstream pair
analyzed, either using ANOVA or a linear hierarchical model. This could be due to low
bioavailability of Pb in the environment, as evidenced by how frequently we encountered tissue
samples below detection. The best fitting model for Pb used, like Hg, shell length alone. In this
case, larger individuals were found to have accumulated lower concentrations of Pb, possibly
due to growth dilution or older organisms sequestering Pb in their shells. This finding is similar

92
to previous studies that have found higher concentrations of Pb in smaller Corbicula (Abaychi
and Mustafa 1988, Angelo et al. 2007). Previous studies of kaolin-processing activity have also
not found that it substantially increases the concentrations of Pb in nearby sediments (Jordao et
al. 2002, Lasier et al. 2004).
Zinc (Zn)
ANOVA analysis showed mean tissue concentrations of Zn to be variable at five of the
six paired sites, making it the most significant differences of any element I analyzed (Figure
4.2A). The best-fit model for Zn used the variables clam condition (tissue dry mass / shell
volume) and sediment Zn concentrations (Table 4.2). Taking those variables into account, only
one pair remained significantly different (Fig. 4.3A). This pair was made up of the sites on the
Ocmulgee above and below the outfall of the former Amercord tire plant (AMC), with the
downstream site having higher concentrations. This is to be expected, since Amercord was fined
in 2003 for discharging excessive amounts of Cu and Zn compounds (ARK 2003). Increased Zn
concentrations in Corbicula tissues probably reflect this increased exposure to metals.
Two of the other site pairs which showed higher concentrations downstream were those
above and below LCC and KC. In both cases, the downstream sediment had much higher
concentrations of Zn (Appendix 4.1). While taking into account Zn sediment concentrations
rendered these differences non-significant, it should be noted that kaolin processing uses large
amounts of Zn compounds and is known to increase concentrations of Zn found in sediment
(Jordao et al. 2002, Lasier et al. 2004). Therefore, if Zn bioaccumulation in Corbicula is
strongly tied to exposure via sediment, kaolin mining and processing activities could still account
for the different Zn concentrations found at the downstream sites. This agrees with the findings
of some biogeochemical models, which are based on the idea that easily extractable metals and

93
sediment chemistry are some of the major factors in bioaccumulation by bivalves (Tessier et al.
1984).
Conclusions
Several conclusions can be drawn from the results of this study.
1) Size of individual clams can be used to predict the accumulation of many trace
elements within a site. Our selected models for all elements but As included shell length or
organism condition as a variable.
2) Location within a river system also greatly affects accumulation. Our selected models
for As, Cr and Cu all used stream distance as a variable, with Corbicula collected from upstream
sites in smaller tributaries accumulating lower concentrations. This result warns against using
smaller upstream tributaries as “reference” sites and comparing them to contaminated sites in
larger rivers. While this approach lends itself to the null hypothesis testing approach used in
ANOVA and other common statistical tests, it could produce inappropriate comparisons. In
other words, “reference” sites could show lower bioaccumulation not just because of less human
activity but also because of different chemicophysical characteristics.
3) A significant source of the potentially toxic metals Cd, Cu, Hg and Zn appears to enter
the Altamaha river system in the vicinity of the confluence of Little Commissioner’s (LCC) and
Commissioner’s Creeks. However, significant amounts of metals do not appear to be entering
the system at the confluence of Kettle (KC) and Buffalo Creeks. The evident conclusion is that
effluent from kaolin processing at LCC is increasing bioaccumulation of trace elements in the
system, while kaolin-mining activities in the watershed of KC does not seem to affect
accumulation. More studies should be conducted to determine the range and extent of kaolin
processing impacts on trace element contamination.

94
4) Our findings show agreement with some of the tenets of two of the principle models
for metal bioaccumulation in aquatic invertebrates: biogeochemical and biodynamic models.
Because bivalves both filter out particulate matter as their principle foot and interact closely with
this sediment, it is probable that both contribute to bioaccumulation of trace elements. Kaolin, as
easily suspended fine particles that readily sorb a variety of metals, may mobilize potentially
toxic trace elements as well as increasing their bioavailability. More research in this system
should be conducted to analyze the affect of particulate matter on bioaccumulation and the role
of kaolin effluent on particulate matter.
Finally, this study demonstrates the utility and necessity of taking into account both
individual and environmental differences when comparing biomonitor populations. Simply
comparing tissue concentrations between two populations can lead to erroneous conclusions and
misattribution of contamination to human activities.
Acknowledgments
I would like to acknowledge Jason Meador, Becky Fauver, Miles Buzbee, Keith Hastie
and Jeff Turner for their help in field sampling during the course of this study. I’d also like to
thank Diane Addis and Gretchen Loeffler-Peltier for help in processing samples. This study was
conducted with financial support from the US Fish & Wildlife Service as well as the University
of Georgia.

95
Table 4.1. Best fitting models for each metal, with the model’s parameters, the number of parameters (K), the residual sum of squares (RSS), the Aikake Information Criteria (AICC), difference between the AIC of the model and that of the model with the lowest AIC (Δi), and the Aikake weight (wi). Note that only models with wi within 10% of the lowest wi are included for each element (in the case of Zn there was no other model that qualified). Models selected as the final model for each element are in bold. Element Model K RSS AICc Δi wi
As Longitude, DO 5 9166 723.6 0.0 0.1269 As DO 4 9303 724.0 0.4 0.1060 As Latitude, DO 5 9186 724.0 0.4 0.1060 As Stream Distance, DO 5 9196 724.2 0.6 0.0940 Cd Thickness Index, [Cd]Sediment 7 34172 967.0 0.0 0.5433 Cd Length, % Silt/Clay 7 34342 968.0 0.9 0.3464 Cd Weight, [Cd]Sediment 7 34836 971.0 3.5 0.0944 Cr Condition, Longitude 7 4947 536.7 0.0 0.0839 Cr Longitude, Alkalinity 5 5113 537.2 0.5 0.0645 Cr Longitude 4 5189 537.3 0.6 0.0627 Cr Condition, Stream Distance 7 4967 537.3 0.6 0.0627 Cu Length, Stream Distance 7 762735 1532.64 0.0 0.3679 Cu Length, Longitude 7 765254 1533.24 0.6 0.2369 Cu Length, [Cu]Sediment 7 772011 1534.84 2.2 0.0861 Hg Length 5 689 250.6 0.0 0.5814 Hg Length, % Medium Sand 7 682 253.0 2.3 0.1282 Hg Length, Coarseness Index 7 689 254.9 4.2 0.0126 Pb Length 5 779 226.9 0.0 0.4124 Pb Dry Weight, % Silt/Clay 7 760 228.6 1.7 0.1787 Pb Height, % Silt/Clay 7 770 230.1 3.2 0.0844 Zn Condition, [Zn]Sediment 7 1452246 1649.8 0.0 0.9930

96
Table 4.2. Selected linear hierarchical models for each trace element, with the predictors for each model and percent decrease of τ00 (intrer-site variability) and σ2 (intra-site variability). The values in parentheses indicate the percentage of the total variability decreased. Element Level-2
Predictor Level-2
Predictor Level-1
Predictor % decrease in
τ00 % decrease in
σ2
As Stream Dist -0.4256
DO 0.6717
None 49.84% (19.15%)
-0.08% (-0.05%)
Cd % Silt/Clay -2.437
None Length 0.2299
-72.05% (-16.35%)
20.73% (16.01%)
Cr Stream Dist -0.7738
None Condition -0.5720
-0.30% (-0.20%)
17.79% (6.11%)
Cu Stream Dist -5.8349
None Length 11.399
27.19% (12.97%)
24.48% (12.81%)
Hg None None Length 0.2251
4.03% (3.39%)
34.66% (5.49%)
Pb None None Length -0.0017
-33.56% (-2.93%)
23.32% (18.55%)
Zn [Zn]Sediment 25.095
None Condition 3.2799
63.63% (45.41%)
11.21% (3.21%)

97
Figure 4.1. Map of the locations sampled in this study. The labels refer to the six site-pairs used to make up/downstream comparisons of trace element bioaccumulation at sites of interest: Amercord tires (AMC), Little Commissioner’s Creek (LCC), Kettle Creek (KC), Plant Hatch (PH), Rayonier (RAY), and Reidsville State Penitentiary (RSP). Figure 4.2. Average Corbicula tissue concentrations of (A) Cu and Zn; (B) As, Cd and Cr; and (C) Hg and Pb of clams found upstream and downstream of sites of interest: Amercord tires (AMC), Little Commissioner’s Creek (LCC), Kettle Creek (KC), Plant Hatch (PH), Rayonier (RAY), and Reidsville State Penitentiary (RSP). Upstream locations are in black, while downstream locations are in gray. The error bars represent standard error of concentrations. Sites with an * have significantly higher concentrations than their paired site. Significance was determined using ANOVA with Duncan’s post hoc test (α = 0.05). Figure 4.3. Differences in mean Corbicula tissue concentrations of (A) Cu and Zn; (B) As, Cd and Cr; and (C) Hg and Pb between clams found upstream and downstream of sites of interest: Amercord tires (AMC), Little Commissioner’s Creek (LCC), Kettle Creek (KC), Plant Hatch (PH), Rayonier (RAY), and Reidsville State Penitentiary (RSP). Mean Corbicula tissues at all sites had variation in each element controlled by the final model. Error bars represent 95% confidence intervals (CI95). ↑ = Upstream site has a significantly higher concentration. ↓ = Downstream site has a significantly higher concentration.

98
Figure 4.1
LCC KC
AMC
RSP
RAY
PH

99
Figure 4.2
AMC LCC KC PH RAY RSP
[Met
al] (
ppm
)
0
50
100
150
200
250Cu UpCu Dn Zn UpZn Dn
A.
*
*
*
**
*
*
AMC LCC KC PH RAY RSP
[Met
al] (
ppm
)
0
2
4
6
8
10
12As UpAs DnCd UpCd Dn Cr UpCr Dn
*
*
*
*
*
*
B.

100
Figure 4.2 (cont.)
AMC LCC KC PH RAY RSP
[Met
al] (
ppm
)
0
1
2
3
Hg UpHg DnPb UpPb Dn
C.
** *
*

101
Figure 4.3
AMC LCC KC PH RAY RSP
Diff
eren
ce in
Inte
rcep
t (pp
m)
0
10
20
30
40
50
60CuZn
A.
↑
↓
↑
↓
AMC LCC KC PH RAY RSP
Diff
eren
ce in
Inte
rcep
t (pp
m)
0
2
4
6
8
10AsCdCr
B. ↓
↓
↓

102
Figure 4.3 (cont)
AMC LCC KC PH RAY RSP
Diff
eren
ce in
Inte
rcep
ts (p
pm)
0.0
0.2
0.4
0.6
0.8
1.0
1.2
1.4
1.6HgPb
C.
↓
↑

103
References
Abaychi, J. K. and Y. Z. Mustafa. 1988. The Asiatic clam, Corbicula fluminea - an indicator of
trace metal pollution in the Shatt Al-Arab River, Iraq. Environmental Pollution 54:109-
122.
Angelo, R. T., M. S. Cringan, D. L. Chamberlain, A. J. Stahl, S. G. Haslouer, and C. A.
Goodrich. 2007. Residual effects of lead and zinc mining on freshwater mussels in the
Spring River Basin (Kansas, Missouri, and Oklahoma, USA). Science of the Total
Environment 384:467-496.
Arias, M., M. T. Barral, and J. C. Mejuto. 2002. Enhancement of copper and cadmium
adsorption on kaolin by the presence of humic acids. Chemosphere 48:1081-1088.
ARK. 2003. Business must pay the price: Federal judge fines south Georgia company $1 million
for polluting Ocmulgee River. Altamaha River Keeper.
Belanger, S. E., J. L. Farris, D. S. Cherry, and J. Cairns. 1986. Growth of Asiatic clams
(Corbicula Sp) during and after long-term zinc exposure in field-located and laboratory
artificial streams. Archives of Environmental Contamination and Toxicology 15:427-434.
Bilinski, H., S. Kozar, M. Plavsic, Z. Kwokal, and M. Branica. 1991. Trace metal adsorption on
inorganic solid-phases under estuarine conditions. Marine Chemistry 32:225-233.
Burnham, K. P. and D. R. Anderson. 2001. Kullback-Leibler information as a basis for strong
inference in ecological studies. Wildlife Research 28:111-119.
Croteau, M. N. and S. N. Luoma. 2005. Delineating copper accumulation pathways for the
freshwater bivalve Corbicula using stable copper isotopes. Environmental Toxicology
and Chemistry 24:2871-2878.

104
Croteau, M. N., S. N. Luoma, B. R. Topping, and C. B. Lopez. 2004. Stable metal isotopes
reveal copper accumulation and less dynamics in the freshwater bivalve Corbicula.
Environmental Science & Technology 38:5002-5009.
Doherty, F. G. 1990. The Asiatic clam, Corbicula Spp, as a biological monitor in freshwater
environments. Environmental Monitoring and Assessment 15:143-181.
Doherty, F. G., D. S. Cherry, and J. Cairns. 1987. Valve closure responses of the Asiatic clam
Corbicula fluminea exposed to cadmium and zinc. Hydrobiologia 153:159-167.
Elder, J., Collins, JJ. 1991. Freshwater molluscs as indicators of bioavailability and toxicity of
metals in surface-water systems. . Reviews Environ Contam Tox 122:37-79.
Foster, I. D. L. and S. M. Charlesworth. 1996. Heavy metals in the hydrological cycle: Trends
and explanation. Hydrological Processes 10:227-261.
Graney, R. L., D. S. Cherry, and J. Cairns. 1984. The influence of substrate, pH, diet and
temperature upon cadmium accumulation in the Asiatic clam (Corbicula fluminea) in
laboratory artificial streams. Water Research 18:833-842.
Griffiths, N. A. and H. Cyr. 2006. Are there hot spots for Elliptio complanata in the shallow
littoral zone of a large Canadian Shield lake? Canadian Journal of Fisheries and Aquatic
Sciences 63:2137-2147.
Gundacker, C. 2000. Comparison of heavy metal bioaccumulation in freshwater molluscs of
urban river habitats in Vienna. Environmental Pollution 110:61-71.
Harrison, F. L., J. P. Knezovich, and D. W. Rice. 1984. The toxicity of copper to the adult and
early life stages of the freshwater clam, Corbicula manilensis. Archives of Environmental
Contamination and Toxicology 13:85-92.

105
Inza, B., F. Ribeyre, and A. Boudou. 1998. Dynamics of cadmium and mercury compounds
(inorganic mercury or methylmercury): uptake and depuration in Corbicula fluminea.
Effects of temperature and pH. Aquatic Toxicology 43:273-285.
Jagoe, C. H., B. Arnold-Hill, G. M. Yanochko, P. V. Winger, and I. L. Brisbin. 1998. Mercury in
alligators (Alligator mississippiensis) in the southeastern United States. Science of the
Total Environment 213:255-262.
Jordao, C. P., M. G. Pereira, and J. L. Pereira. 2002. Metal contamination of river waters and
sediments from effluents of kaolin processing in Brazil. Water Air and Soil Pollution
140:119-138.
Katsumata, H., S. Kaneco, K. Inomata, K. Itoh, K. Funasaka, K. Masuyama, T. Suzuki, and K.
Ohta. 2003. Removal of heavy metals in rinsing wastewater from plating factory by
adsorption with economical viable materials. Journal of Environmental Management
69:187-191.
Kesler, D. H. 2004. Influence of a lentic area on condition indices of Corbicula fluminea in the
Wolf River, Tennessee. Journal of Freshwater Ecology 19:445-453.
Koretsky, C. M., J. R. Haas, N. T. Ndenga, and D. Miller. 2006. Seasonal variations in vertical
redox stratification and potential influence on trace metal speciation in minerotrophic
peat sediments. Water Air and Soil Pollution 173:373-403.
Lasier, P. J., P. V. Winger, J. L. Shelton, and K. J. Bogenrieder. 2004. Sediment-quality
assessment of the lower Oconee River. Southeastern Naturalist 3:139-154.
Luoma, S. N., R. Dagovitz, and E. Axtmann. 1990. Temporally intensive study of trace metals in
sediments and bivalves from a large river, estuarine system - Suisun Bay Delta in San-
Francisco Bay. Science of the Total Environment 97-8:685-712.

106
Luoma, S. N. and P. S. Rainbow. 2005. Why is metal bioaccumulation so variable? Biodynamics
as a unifying concept. Environmental Science & Technology 39:1921-1931.
Meador, J. R. 2008. The development and evaluation of a freshwater mussel sampling protocol
for a large lowland river. University of Georgia, Athens, GA.
Metcalfe-Smith, J. L., R. H. Green, and L. C. Grapentine. 1996. Influence of biological factors
on concentrations of metals in the tissues of freshwater mussels (Elliptio complanata and
Lampsilis radiata radiata) from the St Lawrence River. Canadian Journal of Fisheries
and Aquatic Sciences 53:205-219.
MetcalfeSmith, J. L., R. H. Green, and L. C. Grapentine. 1996. Influence of biological factors on
concentrations of metals in the tissues of freshwater mussels (Elliptio complanata and
Lampsilis radiata radiata) from the St Lawrence River. Canadian Journal of Fisheries and
Aquatic Sciences 53:205-219.
Millington, P., Walker, KF 1983. Australian freshwater mussel Velsunio ambiguous (Philippi) as
a biological monitor for zinc, iron, and manganese. . Aust. J. mar. freshwat. Res. 34:873-
892.
Naimo, T. J. 1995. A review of the effects of heavy metals on freshwater mussels. Ecotoxicology
4:341-362.
Patrick, R. 1994. Rivers of the United States. J. Wiley, New York.
Peltier, G. L., J. L. Meyer, C. H. Jagoe, and W. A. Hopkins. 2008. Using trace element
concentrations in Corbicula fluminea to identify potential sources of contamination in an
urban river. Environmental Pollution 154:283-290.
107
Perceval, O., Y. Couillard, B. Pinel-Alloul, A. Giguere, and P. G. C. Campbell. 2004. Metal-
induced stress in bivalves living along a gradient of Cd contamination: relating sub-
cellular metal distribution to population-level responses. Aquatic Toxicology 69:327-345.
Plumb, R. 1981. Procedures for handling and chemical analysis of sediment and water samples.
U.S. Army Engineer Waterways Experiment Station, Vicksburg, MS.
Pourang, N. 1996. Heavy metal concentrations in surficial sediments and benthic
macroinvertebrates from Anzali wetland, Iran. Hydrobiologia 331:53-61.
Poykio, R., H. Nurmesniemi, and R. L. Keiski. 2007. Environmental risk assessment of heavy
metal extractability in a biosludge from the biological wastewater treatment plant of a
pulp and paper mill. Environmental Monitoring and Assessment 128:153-164.
Pruett, R. J. 2000. Georgia kaolin: development of a leading industrial mineral. Mining
Engineering 52:21-27.
Reese, E. G. and D. P. Batzer. 2007. Do invertebrate communities in floodplains change
predictably along a river's length? Freshwater Biology 52:226-239.
Roditi, H. A., N. S. Fisher, and S. A. Sanudo-Wilhelmy. 2000. Field testing a metal
bioaccumulation model for zebra mussels. Environmental Science & Technology
34:2817-2825.
Rudd, J. W. M. 1995. Sources of methyl mercury to freshwater ecosystems - A review. Water
Air and Soil Pollution 80:697-713.
Salomons, W., N. M. Derooij, H. Kerdijk, and J. Bril. 1987. Sediments as a source for
contaminants. Hydrobiologia 149:13-30.

108
Sebesvari, Z., K. F. Ettwig, and H. Emons. 2005. Biomonitoring of tin and arsenic in different
compartments of a limnic ecosystem with emphasis on Corbicula fluminea and
Dikerogammarus villosus. Journal of Environmental Monitoring 7:388-388.
Spinrad, J. C. 2003. Federal court fines Georgia manufacturer $1 million for Clean Water Act
violations. Georgia Environmental Law Excerpts. Arnall Golden Gregory LLP.
Stites, D. L., A. C. Benke, and D. M. Gillespie. 1995. Population dynamics, growth, and
production of the Asiatic clam, Corbicula fluminea, in a blackwater river. Canadian
Journal of Fisheries and Aquatic Sciences 52:425-437.
Tessier, A., P. G. C. Campbell, J. C. Auclair, and M. Bisson. 1984. Relationships between the
partitioning of trace metals in sediments and their accumulation in the tissues of the
freshwater mollusk Elliptio complanata in a mining area. Canadian Journal of Fisheries
and Aquatic Sciences 41:1463-1472.
Tomazelli, A. C., L. A. Martinelli, W. E. P. Avelar, P. B. de Camargo, A. H. Fostier, E. S. B.
Ferraz, F. J. Krug, and D. S. Junior. 2003. Biomonitoring of Pb and Cd in two impacted
watersheds in southeast Brazil, using the freshwater mussel Anodontites trapesialis
(Lamarck, 1819) (Bivalvia : Mycetopodidae) as a biological monitor. Brazilian Archives
of Biology and Technology 46:673-684.
Unrine, J. M., W. A. Hopkins, C. S. Romanek, and B. P. Jackson. 2007. Bioaccumulation of
trace elements in omnivorous amphibian larvae: Implications for amphibian health and
contaminant transport. Environmental Pollution 149:182-192.
USEPA. 1994. EPA Method 3015. Microwave assisted acid digestion of aqueous samples and
extracts. U.S. Environmental Protection Agency, Washington, D.C.

109
USEPA. 1996. EPA Method 3052. Microwave assisted digestion of siliceous and organically
based matrices. Revision 0 (December 1996). U.S. Environmental Protection Agency,
Washington, D.C.
USEPA. 2006. Envirofacts Data Warehouse.
Vaughn, C. C. and C. C. Hakenkamp. 2001. The functional role of burrowing bivalves in
freshwater ecosystems. Freshwater Biology 46:1431-1446.
Vaughn, C. C. and C. M. Taylor. 1999. Impoundments and the decline of freshwater mussels: A
case study of an extinction gradient. Conservation Biology 13:912-920.
Williams, J. D., M. L. Warren, K. S. Cummings, J. L. Harris, and R. J. Neves. 1993.
Conservation status of freshwater mussels of the United States and Canada. Fisheries
18:6-22.

110
Appendix 4.1. Concentrations (ppm, μg/g) of elements at each site in three compartments: water, sediment and Corbicula tissues. Water concentrations come from a single sample, while sediments are means of 3 sub-samples from a single sample and tissue values come from whole tissue digestions of individual Corbicula (n = 1-8). OMG1 OMG2 OMG3 OMG4 LOMG OCN1 OCN2 OCN3 OCN4 COM1 COM2 COM3[As]H2O [As]Sed [As]Clam
0.6764 6.081 3.005
0.4881 BD
4.087
0.5568 BD
3.009
0.4424 4.879 3.552
0.8412 6.895 2.467
0.4227 8.269 6.220
0.2675 5.025 3.072
0.3285 10.68 4.206
0.3752 BD
3.054
0.5762 13.21 3.975
0.4903 7.348 2.126
0.4531 7.728 2.392
[Cd]H2O [Cd]Sed [Cd]Clam
0.06055 0.6118 5.145
0.02420 0.4741 2.458
0.065980.4495 2.297
0.1761 0.1919 3.049
0.033120.1397 1.521
0.071910.2276 1.457
0.02934 0.3190 5.730
0.035212.391 6.967
0.050050.1795 1.059
0.087290.0281 0.4814
0.1139 0.1185 1.833
0.1006 1.241 9.896
[Cr]H2O [Cr]Sed [Cr]Clam
1.465 67.64 2.311
0.7413 61.31 3.107
1.429 70.02 1.940
1.379 74.39 2.387
0.8700 49.63 1.569
2.182 68.93 3.098
0.9098 59.42 1.830
1.008 64.62 3.115
0.8412 62.35 1.495
2.586 66.36 1.442
2.704 62.46 1.124
1.016 81.49 BD
[Cu]H2O [Cu]Sed [Cu]Clam
2.275 31.15 54.034
1.398 22.02 64.77
2.127 22.06 34.66
2.035 21.55 38.91
1.241 12.56 108.36
2.672 45.26 60.67
1.984 26.90 58.78
1.943 32.56 47.49
1.406 22.51 43.24
2.164 25.77 24.24
1.782 29.50 31.64
2.319 24.45 60.35
[Hg]H2O [Hg]Sed [Hg]Clam
ND BD
0.2548
ND BD
0.6865
ND BD
0.2122
ND BD
0.3806
ND BD
4.341
ND BD
0.1738
ND BD
0.1750
ND 0.3088 0.2393
ND BD
0.1294
ND BD
0.0838
ND BD
0.4559
ND BD
0.9281 [Pb]H2O [Pb]Sed [Pb]Clam
0.4461 39.89 0.7593
0.5044 27.96 BD
0.8655 34.77 BD
0.2514 29.96 BD
0.7260 42.62 0.4763
0.7820 33.82 0.2423
0.2550 27.24 1.136
0.3481 29.31 0.7144
0.1705 28.53 0.2451
0.3063 24.72 0.2330
0.3644 37.13 0.4686
0.1740 35.35 0.7541
[Zn]H2O [Zn]Sed [Zn]Clam
440.7 130.2 133.2
115.1 115.0 104.1
660.0 129.6 133.5
883.2 88.92 131.4
266.2 79.18 145.7
576.3 122.9 115.9
223.4 301.2 149.2
168.0 413.1 269.6
352.2 174.4 126.4
1526 63.04 101.9
2403 97.91 128.3
1156 506.7 188.5
ND = Not detected. This element was not analyzed because of predicted low detection. BD = Below detection. All analytical values for this element from this site were below the detection limit.

111
Appendix 4.1 (cont). Concentrations (ppm, μg/g) of elements at each site in three compartments: water, sediment and Corbicula tissues. Water concentrations come from a single sample, while sediments are means of 3 sub-samples from a single sample and tissue values come from whole tissue digestions of individual Corbicula (n = 1-8).
BUF1 BUF2 BSC1 BSC2 ALT1 ALT2 ALT3 ALT4 ALT5 ALT6 OHP1 OHP2[As]H2O [As]Sed [As]Clam
0.7050 13.11 2.006
2.721 8.963 1.588
0.8807 7.984 1.711
0.6713 7.842 3.351
0.31816.481 4.363
0.4736 BD
4.677
0.4685 10.65 3.770
0.3269 8.020 5.465
0.4067 14.23 5.352
0.3081 6.902 5.195
0.5329 BD
2.335
0.82918.005 2.879
[Cd]H2O [Cd]Sed [Cd]Clam
0.04158 0.0921 1.865
0.03338 0.7487 2.218
0.022400.5718 2.902
0.043980.3358 2.183
0.13990.34122.168
0.065310.2705 2.009
0.033570.5142 2.662
0.045290.3161 4.569
0.043030.6243 3.842
0.066030.3441 1.665
0.031700.2420 2.573
0.12432.089 2.853
[Cr]H2O [Cr]Sed [Cr]Clam
0.0978 68.43 1.954
0.3508 63.35 0.934
0.2443 77.24 1.013
0.7006 73.59 1.145
1.973 70.92 1.916
1.047 56.19 8.460
0.7152 60.58 4.949
0.4709 95.23 3.685
0.7559 114.9 2.601
0.9822 69.95 5.589
0.3900 53.87 3.574
1.744 37.84 2.198
[Cu]H2O [Cu]Sed [Cu]Clam
1.164 21.82 40.87
2.387 20.90 35.88
0.4314 15.98 39.29
0.8068 14.70 55.02
2.521 25.36 49.97
1.505 19.16 43.44
1.021 21.38 53.63
33.70 18.39 36.24
2.083 26.37 64.68
1.448 23.77 67.43
0.7324 15.26 59.33
1.262 8.253 55.99
[Hg]H2O [Hg]Sed [Hg]Clam
ND 0.3998 0.9822
ND BD
0.2126
ND BD
2.037
ND BD
1.882
ND BD
0.3210
ND BD
0.3180
ND 0.3342 1.610
ND 0.3040 0.4097
ND BD
0.8811
ND BD
0.4909
ND BD
1.837
ND BD
2.316 [Pb]H2O [Pb]Sed [Pb]Clam
0.2264 23.25 0.4991
0.2848 20.99 0.3693
0.0886928.32 0.6610
0.3426 32.82 0.6059
0.640429.04 0.1495
0.2534 25.39 BD
0.1629 31.66 BD
0.3646 29.56 1.237
0.2851 34.66 0.3037
0.1631 29.47 0.2907
0.2109 39.46 1.176
0.818527.98 0.8956
[Zn]H2O [Zn]Sed [Zn]Clam
219.2 96.36 149.7
41.08 269.7 182.9
126.2 156.2 145.2
317.8 123.3 135.4
1169 164.3 137.5
235.6 137.7 137.8
447.0 181.4 136.6
155.4 109.0 121.1
306.9 113.9 122.1
466.8 169.2 112.2
106.9 96.16 162.7
496.0 62.12 147.7
ND = Not detected. This element was not analyzed because of predicted low detection. BD = Below detection. All analytical values for this element from this site were below the detection limit.

112
CHAPTER FIVE
USE OF AUTOREGRESSION TO ANALYZE LASER ABLATION INDUCTIVELY
COUPLED PLASMA-MASS SPECTROSCOPY DATA FROM BIVALVE SHELLS1
Abstract
Bivalves secrete their shells in an annual fashion, forming discrete bands of growth. In
doing so, they incorporate trace elements in concentrations based on environmental conditions
and exposure, thus making it possible to use them as archives of environmental information. In
this study, we used laser ablation inductively coupled plasma-mass spectrometry to analyze trace
elements (Cd, Cu, Mn, Pb and Zn) on a transect perpendicular to the growth annuli of the
freshwater bivalve Elliptio hopetonensis. Concentrations of Mn from multiple shells at each site
were correlated and average Mn data series were formed. Periodicity of Mn data was determined
and sampling errors removed using an autoregression model. The data series at each site were
shown to have regular fluctuations of high and low concentrations. Fluctuations were similar
between the shells from the same site but different between shells from different sites. Using Mn
correlations to offset Pb series from the same site aligns Pb peaks from multiple shells. This
study shows that Mn deposition in the shells of E. hopetonensis is a regular, seasonal process but
that growth differs between sites with different environments. It also shows that Mn series can
be used to align Pb peaks between multiple shells. By using autoregression models to remove
1 Shoults-Wilson WA, Seymour L, Unrine JM, Wiskniewski J, Black MC. To be submitted to Environmental Science and Technology.

113
sampling error, bivalve shells have the potential to be used as archives of both essential (i.e. Mn)
and potentially toxic (i.e. Pb) trace element uptake by the organism.
Introduction
Bivalve biomonitoring approaches are often employed to determine the extent and
magnitude of anthropogenic trace element release into the aquatic environment. In some places,
these programs build long term data sets that record the changes in environmental availability of
trace elements over time (Farrington 1983, Beliaeff et al. 1998, Perceval et al. 2006). In fact,
past research has indicated that long-term baseline data may be necessary for understanding the
environmental parameters affecting trace element bioaccumulation by biomonitor species
(Luoma et al. 1990). While temporally intensive studies are certainly preferable to studies
conducted on a limited time scale, the added expense from repeated sampling can make this
infeasible.
It has been shown in numerous studies that bivalves incorporate higher levels of trace
elements into their shells when exposed to higher concentrations in the laboratory (Sturresson
1976, Sturresson 1978, Imlay 1982, Bourgoin 1990, Almeida et al. 1998, Conners 1999) or in the
environment (Imlay 1982, Koide 1982, Carell et al. 1987, Schettler and Pearce 1996, Gundacker
2000, Richardson et al. 2001, Markich et al. 2002, Chiffoleau et al. 2004, Liehr et al. 2005).
Unlike tissues, trace elements deposited into the shell become locked into a matrix with much
slower turnover (Yap et al. 2003).
Furthermore, the shells of bivalves are secreted in an annual fashion, usually with distinct
bands marking periods of rapid growth (warm months) and periods of slower growth (winter
months) (Dunca et al. 2005). This means that bivalve shells can potentially serve as an archive
of trace element exposure that stretches backwards in time from the date of collection. This

114
would allow temporally intensive biomonitoring of trace metals without necessitating time
intensive sampling strategies.
Accessing these archives is dependent on understanding the complex biogeochemical
controls that influence the movement of trace elements from the environment into the shell.
These may include temperature (Stecher et al. 1996), growth (Takesue and Van Geen 2004),
dissolved oxygen (Nystrom et al. 1996), precipitation (Lazareth et al. 2003), nutrients/primary
productivity (Vander Putten et al. 2000, Langlet et al. 2007) and exposure to pollutants
(Richardson et al. 2001, Gillikin et al. 2005, Liehr et al. 2005). The trace element most
commonly investigated in freshwater bivalve shells is Mn. It has been shown to regularly peak
in the portion of annuli corresponding to early or midsummer, either due to anoxic release of Mn
from sediments (Nystrom et al. 1996) or turbation in anoxic sediments (Langlet et al. 2007) or
seasonal phytoplankton blooms (Lazareth et al. 2003).
Using laser ablation inductively coupled plasma-mass spectroscopy (LA ICP-MS), small
fluctuations in trace element concentrations in shells can be quantified (Vander Putten et al.
1999, Bellotto and Miekeley 2000, Barats et al. 2007). By using this technique to sample within
the annuli of bivalves, intra-annual (seasonal) and inter-annual (yearly) differences in trace
element accumulation can be studied. Theoretically, with enough resolution, anomalous events
(extreme weather events, pollution events, etc) recorded in bivalve shells could also be analyzed.
To date, this approach has been primarily applied to marine and estuarine bivalves, while
little work has focused on freshwater bivalves (Nystrom et al. 1996, Langlet et al. 2007). Even
fewer studies have attempted to analyze potentially toxic trace metals (e.g. Cd, Cu, Pb and Zn) in
freshwater bivalve shells (Markich et al. 2002). In this study, we analyze shells of the freshwater
mussel Elliptio hopetonensis from the Altamaha River (Georgia, USA) to 1) demonstrate the
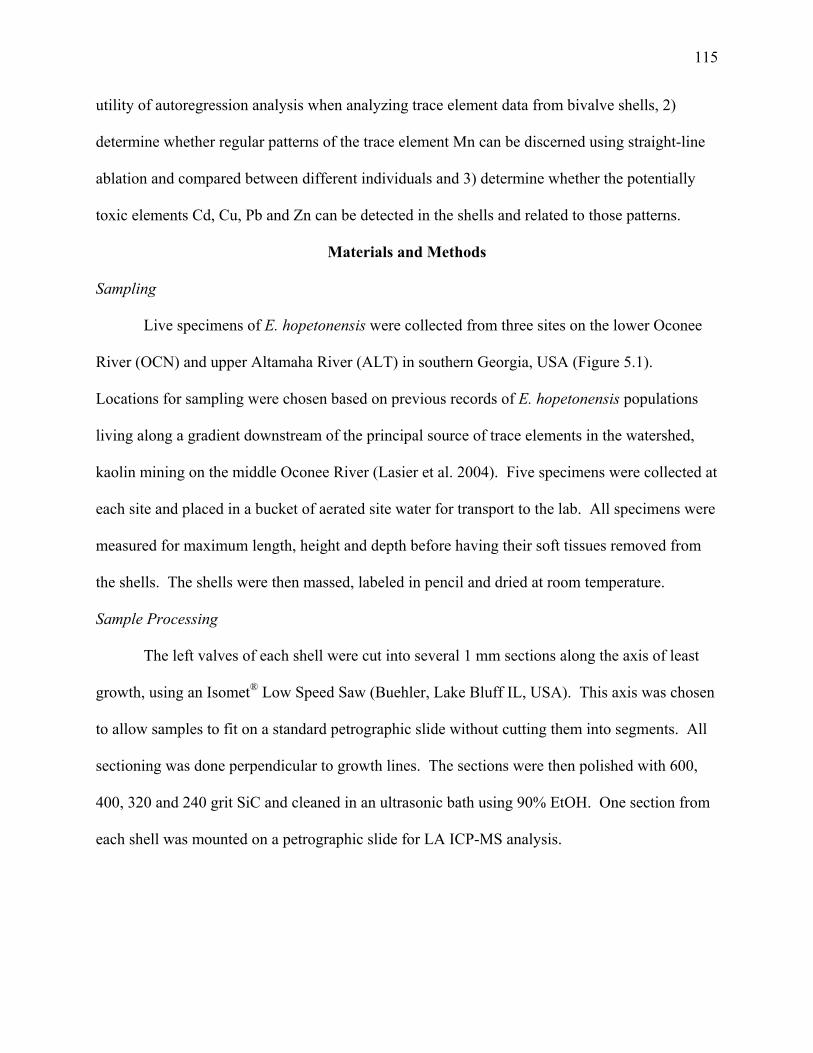
115
utility of autoregression analysis when analyzing trace element data from bivalve shells, 2)
determine whether regular patterns of the trace element Mn can be discerned using straight-line
ablation and compared between different individuals and 3) determine whether the potentially
toxic elements Cd, Cu, Pb and Zn can be detected in the shells and related to those patterns.
Materials and Methods
Sampling
Live specimens of E. hopetonensis were collected from three sites on the lower Oconee
River (OCN) and upper Altamaha River (ALT) in southern Georgia, USA (Figure 5.1).
Locations for sampling were chosen based on previous records of E. hopetonensis populations
living along a gradient downstream of the principal source of trace elements in the watershed,
kaolin mining on the middle Oconee River (Lasier et al. 2004). Five specimens were collected at
each site and placed in a bucket of aerated site water for transport to the lab. All specimens were
measured for maximum length, height and depth before having their soft tissues removed from
the shells. The shells were then massed, labeled in pencil and dried at room temperature.
Sample Processing
The left valves of each shell were cut into several 1 mm sections along the axis of least
growth, using an Isomet® Low Speed Saw (Buehler, Lake Bluff IL, USA). This axis was chosen
to allow samples to fit on a standard petrographic slide without cutting them into segments. All
sectioning was done perpendicular to growth lines. The sections were then polished with 600,
400, 320 and 240 grit SiC and cleaned in an ultrasonic bath using 90% EtOH. One section from
each shell was mounted on a petrographic slide for LA ICP-MS analysis.

116
LA ICP-MS Analysis
The LA ICP-MS system used consists of a MerchantekTM UP frequency quintupled
Neodymium doped Yttrium Aluminum Garnet (Nd-YAG) operating at 213 nm, coupled to a
Perkin-Elmer Sciex Elan DRC Plus ICP-MS (Norwalk CT, USA). Ablations were made in a
straight line as close to orthogonal to growth lines as possible. A pre-ablation pass to remove
surface contamination [as recommended by Vander Putten et al. (1999)] was performed at a spot
size of 75 μm, a repetition rate of 20 Hz and a scanning speed of 25 μm/s. The second, analytical
pass was made with similar operating parameters but at a slower speed of 5 μm/s. In some cases,
a single line was ablated, while in larger shells, a second line was ablated at a different angle in
order to account for curvature in the shell. Isotopes that were analyzed in this manner were
55Mn, 65Cu, 68Zn, 114Cd, and 208Pb. Data were calibrated using a series of calcium carbonate
standards prepared in house and having concentrations ranging from 0 to 100 ppm for all
elements analyzed [as recommended by Bellotto and Miekeley (2000)]. Standards were
analyzed along a 900 μm transect for a total of 80 values per calibration. To allow comparison
between standards and samples, all values were calibrated using Ca43 as an internal standard
(Vander Putten et al. 1999).
Statistical Analysis
Different trace metals within the same shell were correlated with each other using Excel
(Microsoft, Redmond WA, USA), in order to determine if there was any direct relation between
accumulation of different elements within the shell. The element Mn was chosen to construct
models for all shells because past studies (Nystrom et al. 1996, Langlet et al. 2007) and our own
preliminary study (data not shown) indicated the regular, seasonal nature of its incorporation into

117
freshwater bivalve shells. The data series for Mn that we collected also showed some of the
strongest correlations between shells at the same site, which made them amenable to
combination (see below). Preliminary studies (data not shown) indicated that trace element data
collected from bivalve shells is highly autocorrelated—data points are correlated to earlier data
points in the same series. In order to account for autocorrelation, we treated the data as a time
series, incorporating “seasonal” (cyclical) data into an autoregression model that removed errors
caused by autocorrelated data (Chatfield 2004).
The first step in model building was to create mean Mn data series for each site.
Observations of Mn concentration in shells from the same sites were correlated to one another at
different lags (differences in observation number). Best-fit lags were determined based on: 1)
minimizing the lags between shells; 2) obtaining correlations above 0.250 between as many
shells as possible; 3) visual inspection of the mean time series to determine that the number of
peaks have not greatly increased nor decreased when compared to the Mn data series of
individual shells. For values that were at the upper limit of detection, Mn concentrations as a
function of Ca were calculated for each shell and a standard value was substituted for above
detection observations. This was only extensively used for shells from the site OCN1 (Fig 5.1).
Average Mn data series were then examined for cyclical patterns in concentration. In
cases where more than one ablation line was used, these data series were separated and analyzed
individually. After estimation of peak distances, the linear autocorrelation function of each data
series was determined using an autoregressive integrated moving average (ARIMA) procedure in
Statistical Analysis Software (SAS Institute, Cary NC, USA ). This procedure measures
correlation between points within the same data series at different distances apart within the
series (e.g. different lags). Autocorrelation data was plotted at lags up to 360, with correlations >

118
|2*Standard Error| being considered significant. Lags that were indicated to have significant
correlation were introduced into the data series in the form of a “cycle” value (i.e. for a lag of
three, observations 1-3 would be assigned a cycle parameter of 1-3, but observation 4 would be
assigned a 1, observation 5 a 2, observation 6 a 3, observation 7 at 1, etc). The mean values of
all observations with the same cycle value then became separate parameters of the regression.
Bayes Information Criteria were calculated for all models to determine the appropriate
lag for autoregression. Autoregression takes into account errors caused by data series whose
values are autocorrelated. Following autoregression at the appropriate lag, the p-values of all
cyclical parameters were assessed for significance. The residuals of the autoregression models
were assessed for normality using the Kolmogorov-Smirnov test (α = 0.05) with no more than
1.5% of residuals removed as outliers. Lingering correlation was assessed using the
autocorrelation function as described above. Models were determined to be appropriate for use
if the mean square error (MSE) was less than that of the least squares (linear, non-cyclical)
autoregression model and the residuals were considered normal and uncorrelated. The model
with the lowest MSE was then chosen as the final autoregression model.
Finally, the lags used to construct the mean Mn data series were applied to trace metals
Cd, Cu, Pb and Zn and correlation between shells analyzed, in order to determine if the Mn data
series could be used to match up peaks of potentially toxic element accumulation within the
shell.
Results
General parameters for each shell are collected in Table 5.1. The site OCN1 consisted of
older, larger individuals with thicker shells, while OCN2 was a population of smaller, younger
individuals.
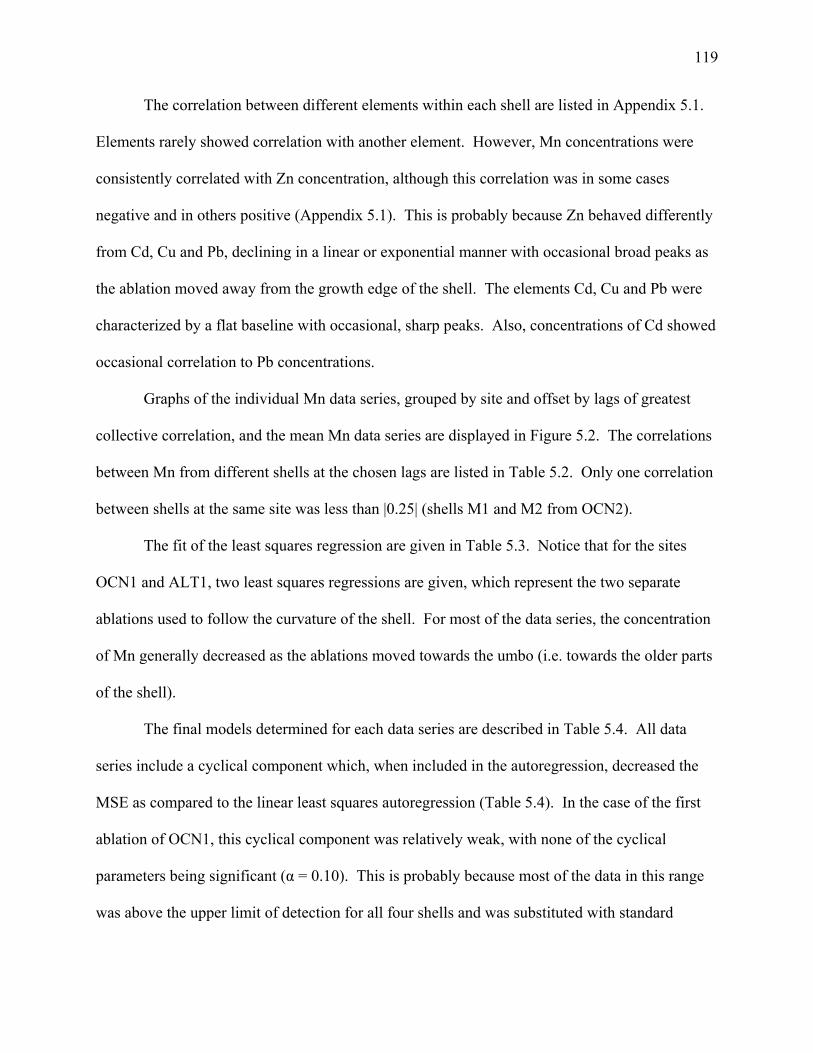
119
The correlation between different elements within each shell are listed in Appendix 5.1.
Elements rarely showed correlation with another element. However, Mn concentrations were
consistently correlated with Zn concentration, although this correlation was in some cases
negative and in others positive (Appendix 5.1). This is probably because Zn behaved differently
from Cd, Cu and Pb, declining in a linear or exponential manner with occasional broad peaks as
the ablation moved away from the growth edge of the shell. The elements Cd, Cu and Pb were
characterized by a flat baseline with occasional, sharp peaks. Also, concentrations of Cd showed
occasional correlation to Pb concentrations.
Graphs of the individual Mn data series, grouped by site and offset by lags of greatest
collective correlation, and the mean Mn data series are displayed in Figure 5.2. The correlations
between Mn from different shells at the chosen lags are listed in Table 5.2. Only one correlation
between shells at the same site was less than |0.25| (shells M1 and M2 from OCN2).
The fit of the least squares regression are given in Table 5.3. Notice that for the sites
OCN1 and ALT1, two least squares regressions are given, which represent the two separate
ablations used to follow the curvature of the shell. For most of the data series, the concentration
of Mn generally decreased as the ablations moved towards the umbo (i.e. towards the older parts
of the shell).
The final models determined for each data series are described in Table 5.4. All data
series include a cyclical component which, when included in the autoregression, decreased the
MSE as compared to the linear least squares autoregression (Table 5.4). In the case of the first
ablation of OCN1, this cyclical component was relatively weak, with none of the cyclical
parameters being significant (α = 0.10). This is probably because most of the data in this range
was above the upper limit of detection for all four shells and was substituted with standard

120
values. The data series and their linear regressions with cyclical components are compared in
Figure 5.3. Cyclical components do not match exactly with all peaks in a given data series,
being selected based on reducing MSE.
There were no strong correlations between Cd, Cu, or Pb from different shells at the lags
used to create the average Mn series (Appendix 5.2) or at any other lags (data not shown). This
is probably because of the irregular, “spiky” nature of the data. Zn did show correlation between
different shells but often showed higher correlation at lags other than those that were used for the
average Mn series. However, visual inspection of Pb data from the shells at site OCN2 indicate
that lags used for the average Mn data series aligned peaks from multiple shells, as shown in
Figure 5.4. Shells from OCN1 also exhibited some alignment of Pb peaks (Figure 5.4). Only
shells from ALT1 did not show this trend, probably due to the fact that only one shell from that
site showed discernible Pb peaks. Visual inspection of Cd and Cu did not reveal any obvious
peak alignment as was the case for Pb.
Discussion
Utility of Autoregression Models
This is the first study that the authors are aware of in which trace element data from
bivalve shell annuli were analyzed using an autoregression function. This is surprising,
considering that several studies have concluded that trace elements in bivalve shells are linked to
regular, seasonal cycles of temperature, growth, precipitation, primary productivity or some
combination (Nystrom et al. 1996, Vander Putten et al. 2000, Lazareth et al. 2003, Freitas et al.
2006, Langlet et al. 2007). Seasonal parameters such as these fluctuate in an autocorrelated
manner: considering a measurement of such a parameter independent from previous
measurements introduces errors. Because bivalves secrete shell in a continuous manner,

121
dependent on environmental parameters such as temperature and pollution levels (Dunca et al.
2005), statistical treatment of data from shell annuli must use statistical methods that removes
autocorrelation errors.
Strong autocorrelation was found in all data series of Mn in our study. As shown by
Table 4, a model that took autocorrelation into account fit the date much better than a linear least
squares model for each data series. This clearly demonstrates the utility of autoregression when
analyzing trace metal concentrations collected from bivalve shells. Our study also found that, on
the whole, Mn concentrations declined as the ablation continued into the older annuli of the
shell. This has previously been reported in the literature and has been explained as an
ontogenetic effect of the mussel’s age affecting shell formation (Imlay 1982).
Seasonality of Mn Incorporation in Bivalve Shells
Our study also shows that the freshwater bivalve E. hopetonensis incorporates Mn into its
shell in a cyclical fashion. The size of these cycles (number of data points contained in one
cycle) differed between data series that came from different angles of ablation (if more than one
was used) or different sites (Table 5.4). However, it seems that cycle size is conserved between
shells originating from the same site, as demonstrated by the between-shell correlations in Table
5.2. This could indicate that local environmental factors affect the shell growth and Mn
incorporation of individuals.
Our study was also the first to determine the strength of observed seasonal trends. As
demonstrated by Table 5.4, some cyclical trends were stronger than others, with significant
components ranging from 0-71.93%. It could be argued that the weakness of the cyclic
parameters for the first ablation line of shells from OCN1 indicates that the cyclical model is
inappropriate. However, this weakness is probably due to the fact that many points in these

122
shells were at the upper limit of detection and were replaced by a standard value, an approach
known to cause distortions (Park et al. 2007).
With regards to whether Mn concentration in bivalve shells fluctuates in a seasonal
manner, our method of data collection does not allow us to directly determine where individual
peaks occur within a growth annuli. However, our estimates for the number of annuli that are
ablated (Table 5.1) agree to some degree with the number of peaks found in each mean Mn
series. For instance, the series for OCN2 shows 4 peaks (Figure 5.4), while 2-3 annuli were
ablated in each shell. The series for ALT1 shows 15 peaks from shells that had an average of 8
annuli ablated. However, peaks from the first ablation seem to represent a pattern of large and
small peaks that may indicate some kind of biannual trend. In this case, the data represents 7-8
seasons, which agrees with annuli counts. Because of values that were uniformly above
detection, it is difficult to count peaks in OCN1. Overall, comparing mean Mn peaks to annuli
counts agrees with other studies that have found Mn accumulation to show a strictly seasonal
trend (Nystrom et al. 1996, Vander Putten et al. 2000, Siegele et al. 2001, Freitas et al. 2006,
Langlet et al. 2007).
Past researchers have suggested that increased Mn concentrations in bivalve shells could
be the result of increased summer concentrations of Mn caused by anoxic waters (Nystrom et al.
1996), early summer increases in primary productivity (Vander Putten et al. 2000, Lazareth et al.
2003) or a combination of the two (Langlet et al. 2007). While we do not have environmental
monitoring data that could allow us to test either of these hypotheses, we can make a few
observations, the shells from OCN1 which routinely had Mn concentrations above the
instrumental detection were collected from a small slack water on the bankward side of a
sandbar. Periodic disconnection at this site could result in slower moving, more anoxic water in

123
the summer than at OCN2 (undercut bank with strong current) or ALT (fast flowing and sandy).
Data collected by USGS at sites (Doctortown and Everett GA) downstream of those sampled in
this study indicate average water concentrations of Mn to be higher in summer months (July and
August), while dissolved oxygen is lower (USGS 2008a, b). Because Mn is associated with
oxides, it is readily mobilized under anoxic conditions (Koretsky et al. 2006, Poykio et al. 2007).
Therefore, it is plausible that later summer anoxia leads to the seasonal increases in Mn
concentrations that we found in the shells of E. hopetonensis.
Bivalve Shells as Long-Term Records of Trace Element Pollution
Past studies have shown that higher concentrations of Cd, Cu, Pb and Zn in the annuli of
bivalve shells can be linked to higher concentrations of those trace elements in the environment
(Schettler and Pearce 1996, Richardson et al. 2001, Markich et al. 2002, Liehr et al. 2005).
However, past attempts to use annuli as archives of past contamination have given mixed results.
Markich et al. (2002) analyzed the trace elements in the freshwater species, Velesunio angasi, at
sites downstream of a mine waste site that had recently been remediated. They found annuli laid
down after remediation had significantly lower concentrations of Cu and Zn than annuli laid
down prior to remediation. Gillikin et al. (2005) constructed a 53-year series of Pb found in the
shells of Mercenaria mercenaria from a coastal island. They found that Pb concentrations in
annuli corresponding to the years 1977-1981 were significantly higher than years before and
after that time period. They found no other trends, not even seasonal trends in Pb seen by other
researchers (Vander Putten et al. 2000, Freitas et al. 2006).
Our specimens showed very low concentrations of the elements Cd, Cu and Pb, with only
a few individuals showing discernable peaks in Pb concentration (Figure 5.4). This could be a
function of the species, E. hopetonensis, being less likely to incorporate these elements into its

124
shell than other species that have been studied. Or it could be the result of low environmental
concentrations of the elements in the system, since the Lower Oconee/Upper Altamaha has little
urbanization and only a few significant local sources of potentially toxic elements [see Chapter
4; (Lasier et al. 2004)]. Our findings did indicate that aligning Pb data series from different
shells based on the lags of best agreement for Mn data series seems to match peaks between
shells (Figure 5.4A,B). This is especially obvious when looking at the younger shells from
OCN2 (Figure 5.4B), where an increase in observed Pb concentrations in 3-4 of the 4 shells
accompanies the mean series’ most prominent peak in Pb concentrations. This concurrence
indicates that the seasonal trends seen in Mn accumulation could be used to match up many
elemental data series between shells. By doing this, periods of increased Pb accumulation are
also aligned. As seasonal Mn incorporation into bivalve shells becomes better understood, it
should be used to determine dates of increased accumulation of elements such as Pb.
Future Directions
This study illustrates one of the weaknesses in using straight-line rather than spot ablation
when analyzing bivalve shells. Unlike spot ablation, data points collected using straight-line
ablation cannot be easily related to a specific portion of shell annuli. However, straight-line
ablation provides a higher degree of resolution, and is more capable of detecting small
fluctuations in trace element concentration that could indicate temporary exposure to increased
concentrations of trace elements.
This is one of several issues to be addressed by future analysis of the data generated in
this study and in future studies. Firstly, a means of directly linking trace element data that
demonstrates a seasonal nature to dates as explained by annual growth rings would allow
anomalies to be related to environmental disturbances or, potentially, pollution events.
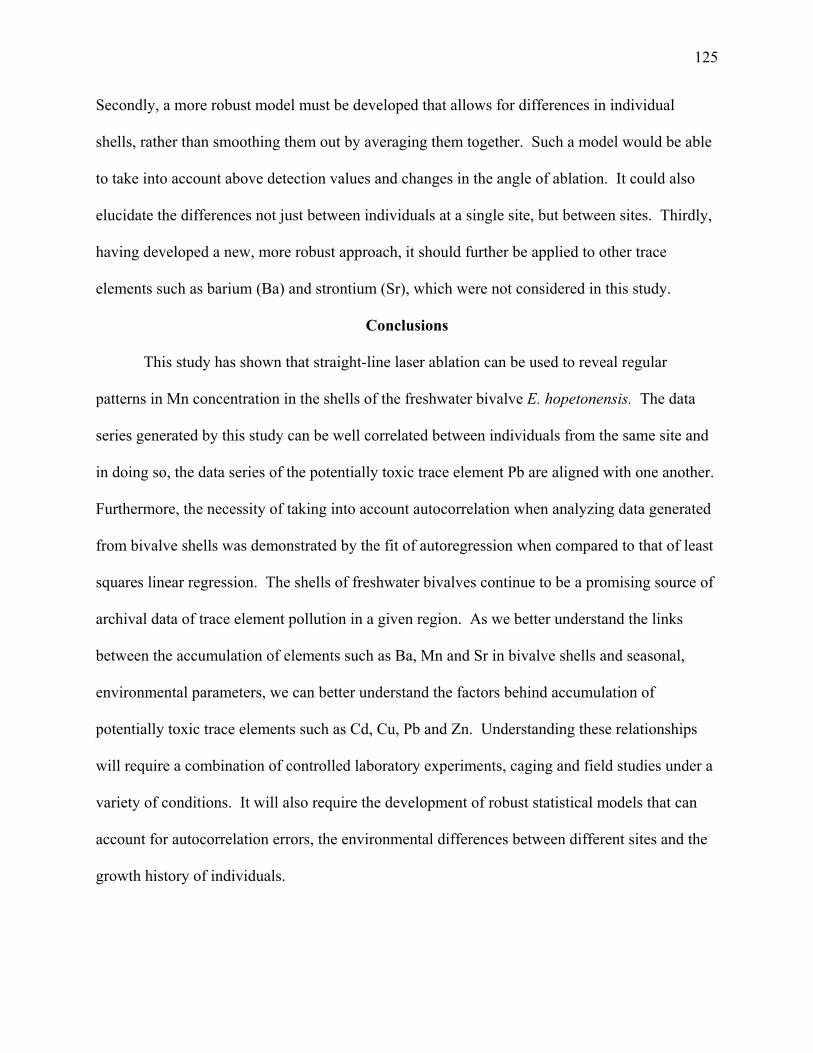
125
Secondly, a more robust model must be developed that allows for differences in individual
shells, rather than smoothing them out by averaging them together. Such a model would be able
to take into account above detection values and changes in the angle of ablation. It could also
elucidate the differences not just between individuals at a single site, but between sites. Thirdly,
having developed a new, more robust approach, it should further be applied to other trace
elements such as barium (Ba) and strontium (Sr), which were not considered in this study.
Conclusions
This study has shown that straight-line laser ablation can be used to reveal regular
patterns in Mn concentration in the shells of the freshwater bivalve E. hopetonensis. The data
series generated by this study can be well correlated between individuals from the same site and
in doing so, the data series of the potentially toxic trace element Pb are aligned with one another.
Furthermore, the necessity of taking into account autocorrelation when analyzing data generated
from bivalve shells was demonstrated by the fit of autoregression when compared to that of least
squares linear regression. The shells of freshwater bivalves continue to be a promising source of
archival data of trace element pollution in a given region. As we better understand the links
between the accumulation of elements such as Ba, Mn and Sr in bivalve shells and seasonal,
environmental parameters, we can better understand the factors behind accumulation of
potentially toxic trace elements such as Cd, Cu, Pb and Zn. Understanding these relationships
will require a combination of controlled laboratory experiments, caging and field studies under a
variety of conditions. It will also require the development of robust statistical models that can
account for autocorrelation errors, the environmental differences between different sites and the
growth history of individuals.

126
Acknowledgments
I would like to acknowledge Jason Meador and Miles Buzbee for their help in field
sampling during the course of this study. Thanks are also due to Monica Carroll for her advice
on sample processing and analysis. This study was conducted with financial support from the
US Fish & Wildlife Service as well as the University of Georgia.

127
Table 5.1. Mean concentrations of elements (μg/g of Ca43), size parameters (shell length, height, depth and shell weight) and estimated number of annuli ablated (i.e. number of years the trace element data represents) of individual shells analyzed in this study. Average values for each site are given in bold.
Site Shell Length (mm)
Height (mm)
Depth (mm)
Shell Wt. (g)
Annuli Ablated
[Cd/Ca] (μg/g)
[Cu/Ca] (μg/g)
[Mn/Ca] (μg/g)
[Pb/Ca] (μg/g)
[Zn/Ca] (μg/g)
M1 105.5 63.5 35.0 111.55 15 4.390 2.481 351.3 2.821 14.98 M2 108.9 56.4 31.2 86.72 18 4.392 2.492 445.1 2.821 17.99 M3 114.2 61.4 34.3 113.68 7 4.407 2.506 412.1 2.848 10.06 M4 121.4 66.0 35.3 118.34 19 4.393 2.476 415.0 2.849 16.30
OCN1
AVG 112.5 61.8 34.0 107.57 14.75 4.396 2.489 405.9 2.835 14.83 M1 92.0 43.2 24.9 29.01 3 4.396 2.492 137.1 2.833 12.25 M2 90.1 49.0 23.5 27.60 2 4.387 2.472 126.2 2.846 8.70 M3 90.5 41.1 19.4 19.91 2 4.394 2.463 167.0 2.835 13.47 M4 88.6 41.6 19.9 25.54 3 4.383 2.425 134.9 2.816 1.23
OCN2
AVG 90.3 43.7 21.9 25.51 2.5 4.390 2.463 141.3 2.833 8.91 M1 106.8 50.8 29.0 57.64 9 4.440 2.566 227.1 3.430 4.86 M2 102.8 51.4 31.0 26.19 10 4.395 2.471 177.9 2.841 7.90 M3 92.6 49.7 25.7 50.63 5 4.382 2.443 153.2 2.815 10.60
ALT1
AVG 100.7 50.6 28.6 44.82 8 4.406 2.493 186.1 3.029 7.79

128
Table 5.2. Correlations between Mn data series for shells within a given site, at the lags selected for greatest average correlation. Values in bold are greater than 0.25 or less than –0.25. Correlations between the same data sets = 1.000.
Site Shell M1 M2 M3 M4 M1 1.000 M2 0.431 1.000 M3 0.266 0.647 1.000
OCN1
M4 0.363 0.379 0.351 1.000 M1 1.000 M2 -0.013 1.000 M3 0.601 0.316 1.000
OCN2
M4 0.332 0.401 0.251 1.000 M1 1.000 M2 0.472 1.000
ALT1
M3 0.505 0.527 1.000

129
Table 5.3. The fit of the least squares lines for the Mn data series, calculated for a linear regression (Lin) and a linear autoreggression (Auto).
Site
Data Points
Intercept (Lin)
Slope (Lin)
r2 (Lin)
Intercept(Auto)
Slope (Auto)
r2 (Auto)
1-950 484.05 -0.046 0.086 474.16 -0.028 0.918 OCN1 951-2073 441.37 -0.184 0.634 452.06 -0.208 0.989
OCN2 1-1253 114.88 0.043 0.243 125.71 0.027 0.993 1-538 284.44 -0.145 0.171 283.94 -0.149 0.994 ALT1
539-1099 124.42 0.026 0.067 126.16 0.012 0.984

130
Table 5.4. Autoregression models for Mn data series, including number of cyclical components, % of cyclical components that are significant (α = 0.10) and MSE for both the least squares (LS) model and the least squares model with cyclical components (LSCC). Site Data
Points Cyclical
Components % Significant Components
MSE (LS)
MSE (LSCC)
OCN1 1-950 91 0.00% 154.05 149.79 951-2073 292 37.33% 63.066 59.897
OCN2 1-1253 285 71.93% 7.0953 6.8595 ALT1 1-538 49 57.14% 18.628 17.906
538-1098 126 30.95% 4.1078 3.8545

131
Figure 5.1. Sampling locations on the Oconee (OCN) and Altamaha (ALT) Rivers. Figure 5.2. Mn data series, offset by lags of highest overall concentration. The gray lines are individual shells, while the black line is the mean series. Vertical lines indicate the end of the first ablation line. The individual plots represent the three sites OCN1, OCN2, and ALT1 in a downstream manner. Figure 5.3. Regressions (black lines) of mean Mn series (gray lines). The regressions include cyclical components as described in Table 5. The individual plots represent the three sites OCN1, OCN2, and ALT1 in a downstream manner. Figure 5.4. Mean Pb series (black line), offset by the same lags as the mean Mn series. The bars at the bottom indicate the number of shells with above average Pb values at each point on the series. Gray boxes highlight peaks in the mean Pb series that coincide with above average values in several shells. The individual plots represent the three sites OCN1, OCN2, and ALT1 in a downstream manner.

132
Figure 5.1
OCN1
OCN2
ALT1

133
Figure 5.2.
Observations
0 500 1000 1500 2000
[Mn/
Ca]
( μg/
g)
0
100
200
300
400
500
600
700OCN1
Observations
0 200 400 600 800 1000 1200 1400 1600
[Mn/
Ca]
( μg/
g)
0
50
100
150
200
250
300
350
400OCN2

134
Figure 5.2 (cont).
Observations
0 200 400 600 800 1000 1200
[Mn/
Ca]
( μg/
g)
0
100
200
300
400
500
600ALT1
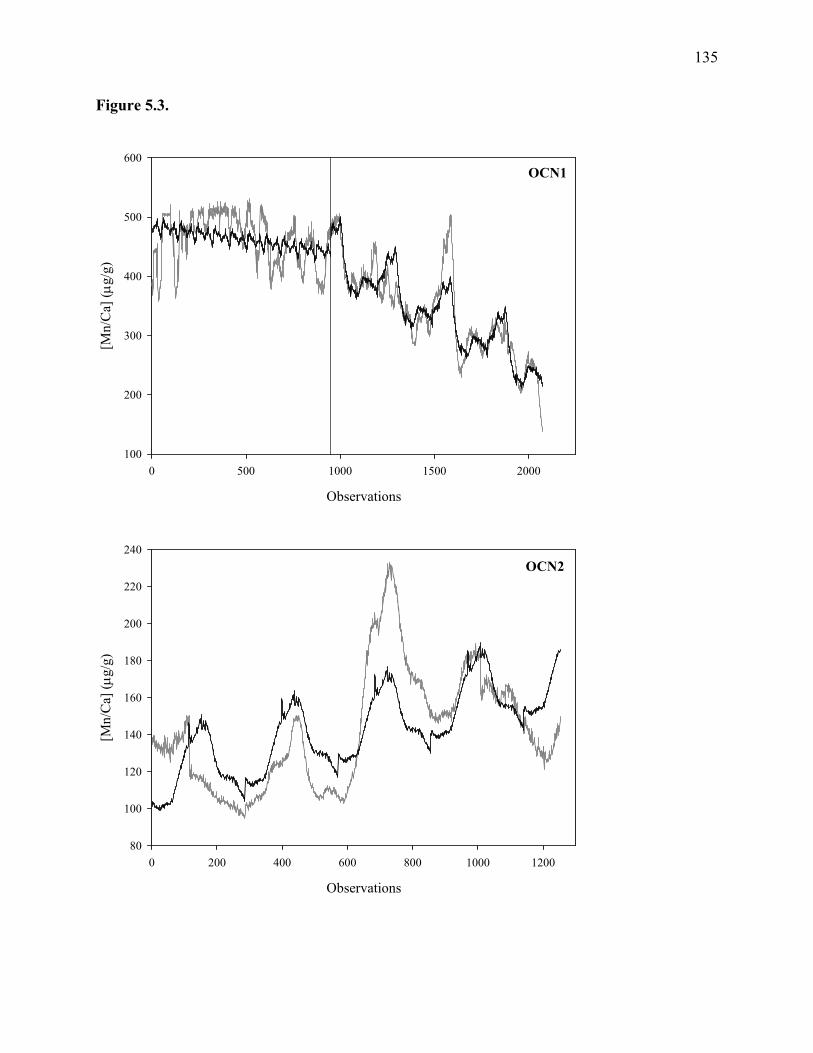
135
Figure 5.3.
Observations
0 500 1000 1500 2000
[Mn/
Ca]
( μg/
g)
100
200
300
400
500
600OCN1
Observations
0 200 400 600 800 1000 1200
[Mn/
Ca]
( μg/
g)
80
100
120
140
160
180
200
220
240OCN2
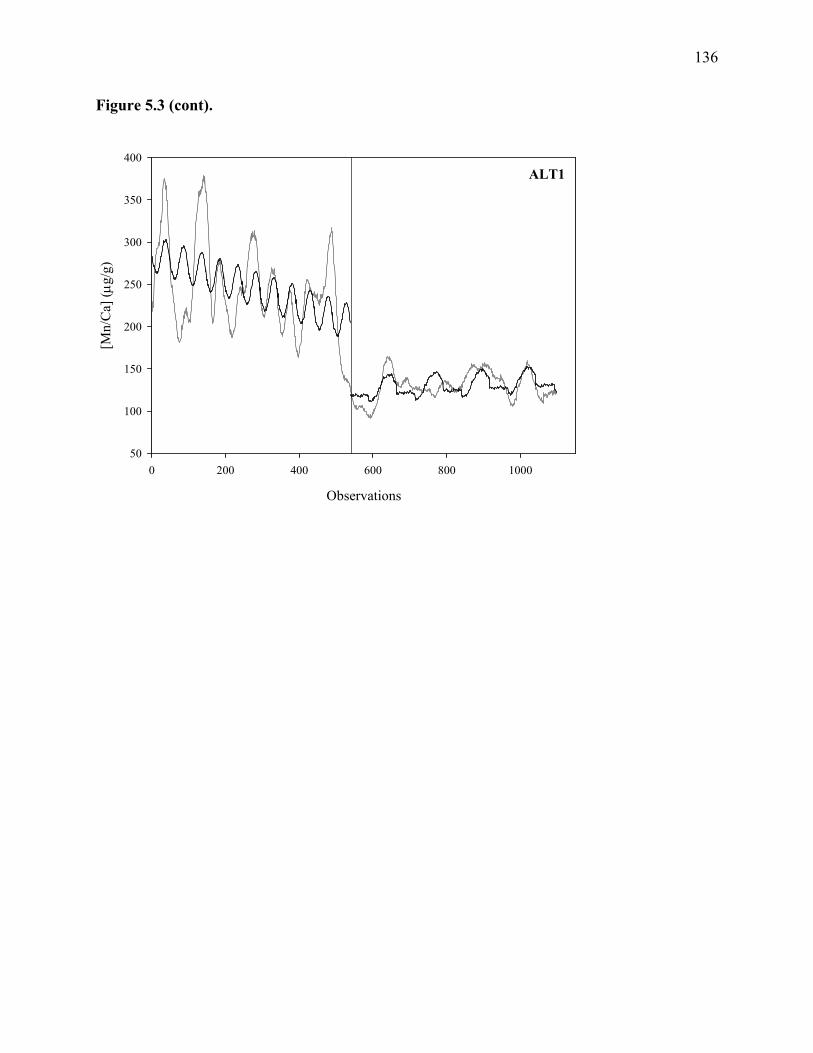
136
Figure 5.3 (cont).
Observations
0 200 400 600 800 1000
[Mn/
Ca]
( μg/
g)
50
100
150
200
250
300
350
400ALT1

137
Figure 5.4.
Observations
0 500 1000 1500 2000
[Pb/
Ca]
( μg/
g)
2.8
3.0
3.2
3.6
OCN1
Observations
0 200 400 600 800 1000 1200
[Pb/
Ca]
( μg/
g)
3.0
3.5
5.0
OCN2

138
Figure 5.4 (cont).
Observations
0 200 400 600 800 1000
[Pb/
Ca]
( μg/
g)
10
20
45
60
ALT1

139
References
Almeida, M. J., G. Moura, T. Pinheiro, J. Machado, and J. Coimbra. 1998. Modifications in Crassostrea gigas shell composition exposed to high concentrations of lead. Aquatic Toxicology 40:323-334.
Barats, A., C. Pecheyran, D. Amouroux, S. Dubascoux, L. Chauvaud, and O. F. X. Donard. 2007. Matrix-matched quantitative analysis of trace-elements in calcium carbonate shells by laser-ablation ICP-MS: application to the determination of daily scale profiles in scallop shell (Pecten maximus). Analytical and Bioanalytical Chemistry 387:1131-1140.
Beliaeff, B., T. P. O'Connor, and D. Claisse. 1998. Comparison of chemical concentrations in mussels and oysters from the United States and France. Environmental Monitoring and Assessment 49:87-95.
Bellotto, V. R. and N. Miekeley. 2000. Improvements in calibration procedures for the quantitative determination of trace elements in carbonate material (mussel shells) by laser ablation ICP-MS. Fresenius Journal of Analytical Chemistry 367:635-640.
Bourgoin, B. P. 1990. Mytilus-Edulis Shell as a Bioindicator of Lead Pollution - Considerations on Bioavailability and Variability. Marine Ecology-Progress Series 61:253-262.
Carell, B., S. Forberg, E. Grundelius, L. Henrikson, A. Johnels, U. Lindh, H. Mutvei, M. Olsson, K. Svardstrom, and T. Westermark. 1987. Can mussel shells reveal environmental history? Ambio 16:2-10.
Chatfield, C. 2004. The analysis of time series : an introduction. 6th edition. Chapman & Hall/CRC, Boca Raton.
Chiffoleau, J. F., L. Chauvaud, D. Amouroux, A. Barats, A. Dufour, C. Pecheyran, and N. Roux. 2004. Nickel and vanadium contamination of benthic invertebrates following the "Erika" wreck. Aquatic Living Resources 17:273-280.
Conners, D., Westerfield, SM, Feyko, A, Black, MC 1999. Lead accumulation in soft tissues and shells of Asiatic clams (Corbicula fluminea). Proceedings of the 1999 Georgia Water Resources Conference.
Dunca, E., B. R. Schone, and H. Mutvei. 2005. Freshwater bivalves tell of past climates: But how clearly do shells from polluted rivers speak? Palaeogeography Palaeoclimatology Palaeoecology 228:43-57.

140
Farrington, J. W. 1983. Bivalves as sentinels of coastal chemical pollution - the mussel (and oyster) watch. Oceanus 26:18-29.
Freitas, P. S., L. J. Clarke, H. Kennedy, C. A. Richardson, and F. Abrantes. 2006. Environmental and biological controls on elemental (Mg/Ca, Sr/Ca and Mn/Ca) ratios in shells of the king scallop Pecten maximus. Geochimica Et Cosmochimica Acta 70:5119-5133.
Gillikin, D. P., F. Dehairs, W. Baeyens, J. Navez, A. Lorrain, and L. Andre. 2005. Inter- and intra-annual variations of Pb/Ca ratios in clam shells (Mercenaria mercenaria): A record of anthropogenic lead pollution? Marine Pollution Bulletin 50:1530-1540.
Gundacker, C. 2000. Comparison of heavy metal bioaccumulation in freshwater molluscs of urban river habitats in Vienna. Environmental Pollution 110:61-71.
Imlay, M. 1982. Use of shells of freshwater mussels in monitoring heavy metals and environmental stresses: a review. . Ecological Review 15:1-14.
Koide, M., Lee, DS, Goldber, ED. 1982. Metal and transuranic records in mussel shells, byssal threads, and tissues. . Estuarine, Coastal, and Shelf Sci 15:679-695.
Koretsky, C. M., J. R. Haas, N. T. Ndenga, and D. Miller. 2006. Seasonal variations in vertical redox stratification and potential influence on trace metal speciation in minerotrophic peat sediments. Water Air and Soil Pollution 173:373-403.
Langlet, D., L. Y. Alleman, P. D. Plisnier, H. Hughes, and L. Andre. 2007. Manganese content records seasonal upwelling in Lake Tanganyika mussels. Biogeosciences 4:195-203.
Lasier, P. J., P. V. Winger, J. L. Shelton, and K. J. Bogenrieder. 2004. Sediment-quality assessment of the lower Oconee River. Southeastern Naturalist 3:139-154.
Lazareth, C. E., E. Vander Putten, L. Andre, and F. Dehairs. 2003. High-resolution trace element profiles in shells of the mangrove bivalve Isognomon ephippium: a record of environmental spatio-temporal variations? Estuarine Coastal and Shelf Science 57:1103-1114.
Liehr, G. A., M. L. Zettler, T. Leipe, and G. Witt. 2005. The ocean quahog Arctica islandica L.: a bioindicator for contaminated sediments. Marine Biology 147:671-679.

141
Luoma, S. N., R. Dagovitz, and E. Axtmann. 1990. Temporally intensive study of trace metals in sediments and bivalves from a large river, estuarine system - Suisun Bay Delta in San-Francisco Bay. Science of the Total Environment 97-8:685-712.
Markich, S. J., R. A. Jeffree, and P. T. Burke. 2002. Freshwater bivalve shells as archival indicators of metal pollution from a copper-uranium mine in tropical northern Australia. Environmental Science & Technology 36:821-832.
Nystrom, J., E. Dunca, H. Mutvei, and U. Lindh. 1996. Environmental history as reflected by freshwater pearl mussels in the River Vramsan, southern Sweden. Ambio 25:350-355.
Park, J. W., M. G. Genton, and S. K. Ghosh. 2007. Censored time series analysis with autoregressive moving average models. Canadian Journal of Statistics-Revue Canadienne De Statistique 35:151-168.
Perceval, O., Y. Couillard, B. Pinel-Alloul, E. Bonneris, and P. G. C. Campbell. 2006. Long-term trends in accumulated metals (Cd, Cu and Zn) and metallothionein in bivalves from lakes within a smelter-impacted region. Science of the Total Environment 369:403-418.
Poykio, R., H. Nurmesniemi, and R. L. Keiski. 2007. Environmental risk assessment of heavy metal extractability in a biosludge from the biological wastewater treatment plant of a pulp and paper mill. Environmental Monitoring and Assessment 128:153-164.
Richardson, C. A., S. R. N. Chenery, and J. M. Cook. 2001. Assessing the history of trace metal (Cu, Zn,Pb) contamination in the North Sea through laser ablation ICP-MS of horse mussel Modiolus modiolus shells. Marine Ecology-Progress Series 211:157-167.
Schettler, G. and N. J. G. Pearce. 1996. Metal pollution recorded in extinct Dreissena polymorpha communities, Lake Breitling, Havel Lakes system, Germany: A laser ablation inductively coupled plasma mass spectrometry study. Hydrobiologia 317:1-11.
Siegele, R., I. Orlic, D. D. Cohen, S. J. Markich, and R. A. Jeffree. 2001. Manganese profiles in freshwater mussel shells. Nuclear Instruments & Methods in Physics Research Section B-Beam Interactions with Materials and Atoms 181:593-597.
Stecher, H. A., D. E. Krantz, C. J. Lord, G. W. Luther, and K. W. Bock. 1996. Profiles of strontium and barium in Mercenaria mercenaria and Spisula solidissima shells. Geochimica Et Cosmochimica Acta 60:3445-3456.

142
Sturresson, U. 1976. Lead enrichment in shells of Mytulis edulis. Ambio 5:253-256.
Sturresson, U. 1978. Cadmium enrichment in shells of Mytulis edulis. Ambio 7:122-125.
Takesue, R. K. and A. Van Geen. 2004. Mg/Ca, Sr/Ca, and stable isotopes in modern and holocene Protothaca staminea shells from a northern California coastal upwelling region. Geochimica Et Cosmochimica Acta 68:3845-3861.
USGS. 2008a. USGS 02226000 Altamaha River At Doctortown, GA.
USGS. 2008b. USGS 02226160 Altamaha River Near Everett City, GA.
Vander Putten, E., F. Dehairs, L. Andre, and W. Baeyens. 1999. Quantitative in situ microanalysis of minor and trace elements in biogenic calcite using infrared laser ablation - inductively coupled plasma mass spectrometry: A critical evaluation. Analytica Chimica Acta 378:261-272.
Vander Putten, E., F. Dehairs, E. Keppens, and W. Baeyens. 2000. High resolution distribution of trace elements in the calcite shell layer of modern Mytilus edulis: Environmental and biological controls. Geochimica Et Cosmochimica Acta 64:997-1011.
Yap, C. K., A. Ismail, S. G. Tan, and I. A. Rahim. 2003. Can the shell of the green-lipped mussel Perna viridis from the west coast of Peninsular Malaysia be a potential biomonitoring material for Cd, Pb and Zn? Estuarine Coastal and Shelf Science 57:623-630.
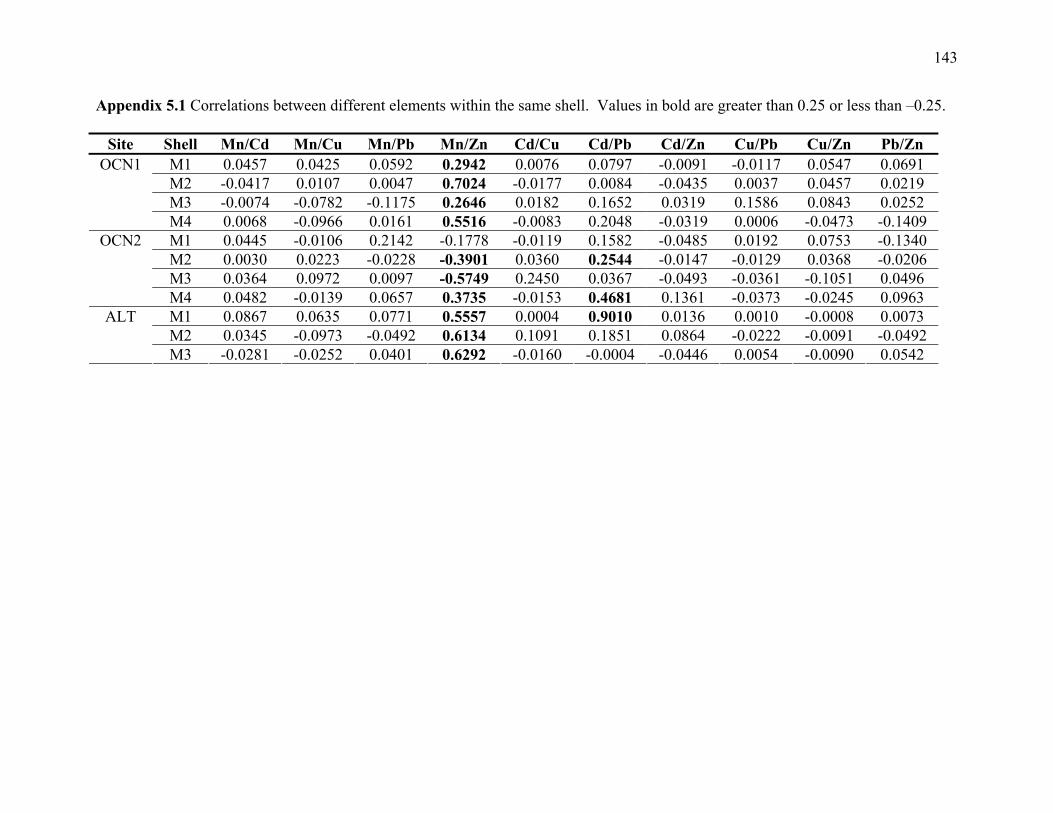
143
Appendix 5.1 Correlations between different elements within the same shell. Values in bold are greater than 0.25 or less than –0.25.
Site Shell Mn/Cd Mn/Cu Mn/Pb Mn/Zn Cd/Cu Cd/Pb Cd/Zn Cu/Pb Cu/Zn Pb/Zn M1 0.0457 0.0425 0.0592 0.2942 0.0076 0.0797 -0.0091 -0.0117 0.0547 0.0691 M2 -0.0417 0.0107 0.0047 0.7024 -0.0177 0.0084 -0.0435 0.0037 0.0457 0.0219 M3 -0.0074 -0.0782 -0.1175 0.2646 0.0182 0.1652 0.0319 0.1586 0.0843 0.0252
OCN1
M4 0.0068 -0.0966 0.0161 0.5516 -0.0083 0.2048 -0.0319 0.0006 -0.0473 -0.1409 M1 0.0445 -0.0106 0.2142 -0.1778 -0.0119 0.1582 -0.0485 0.0192 0.0753 -0.1340 M2 0.0030 0.0223 -0.0228 -0.3901 0.0360 0.2544 -0.0147 -0.0129 0.0368 -0.0206 M3 0.0364 0.0972 0.0097 -0.5749 0.2450 0.0367 -0.0493 -0.0361 -0.1051 0.0496
OCN2
M4 0.0482 -0.0139 0.0657 0.3735 -0.0153 0.4681 0.1361 -0.0373 -0.0245 0.0963 M1 0.0867 0.0635 0.0771 0.5557 0.0004 0.9010 0.0136 0.0010 -0.0008 0.0073 M2 0.0345 -0.0973 -0.0492 0.6134 0.1091 0.1851 0.0864 -0.0222 -0.0091 -0.0492
ALT
M3 -0.0281 -0.0252 0.0401 0.6292 -0.0160 -0.0004 -0.0446 0.0054 -0.0090 0.0542

144
Appendix 5.2. The correlation between Cd, Cu, Pb and Zn from different shells at the lags determined by correlations between Mn data series. Values in bold are greater than 0.25 or less than –0.25. Correlations between the same data sets = 1.000.
Cd Cu Pb Zn Site Shell M1 M2 M3 M4 M1 M2 M3 M4 M1 M2 M3 M4 M1 M2 M3 M4
M1 1.000 1.000 1.000 1.000 M2 0.016 1.000 -0.021 1.000 -0.007 1.000 0.730 1.000 M3 0.066 0.010 1.000 -0.007 -0.022 1.000 -0.021 -0.008 1.000 -0.001 0.139 1.000
OCN1
M4 -0.006 -0.008 0.003 1.000 -0.017 -0.011 -0.008 1.000 -0.011 -0.008 0.002 1.000 0.735 0.741 0.025 1.000 M1 1.000 1.000 1.000 1.000 M2 -0.008 1.000 0.016 1.000 0.025 1.000 0.862 1.000 M3 -0.002 -0.008 1.000 -0.052 0.023 1.000 0.034 -0.004 1.000 -0.405 0.602 1.000
OCN2
M4 0.011 0.020 -0.018 1.000 -0.013 -0.005 0.010 1.000 0.016 0.004 -0.002 1.000 -0.628 -0.530 0.604 1.000 M1 1.000 1.000 1.000 1.000 M2 0.008 1.000 -0.006 1.000 -0.005 1.000 0.803 1.000
ALT1
M3 0.002 -0.012 1.000 -0.031 -0.013 1.000 -0.012 -0.028 1.000 0.803 0.912 1.000

145
CHAPTER SIX
CONCLUDING REMARKS
This dissertation has attempted to address a number of the devilish details that can hinder
efforts to monitor potentially toxic trace element contamination in lotic systems. The first goal
was to determine whether bioaccumulation of trace elements in the tissues of the Asian clam
Corbicula fluminea accurately reflected the accumulation in the tissues of a co-occurring native
mussel species (Elliptio hopetonensis) at the same sites. While this seems like an obvious mode
of inquiry, there is a sad lack of direct comparisons in the literature between freshwater mussels
and the invasive species that are assumed to represent them as biomonitors. This dissertation
determined that several trace elements (As, Cd, Cu, Hg, Pb and Zn) showed similar trends
between each bivalve species. However, the study revealed that a number of other factors such
as size, season of collection (represented by temperature and to some extent dissolved oxygen)
and water chemistry may be in some way influencing accumulation. Without taking into account
these factors, it would be difficult to draw firm conclusions about the cause of increased
accumulation of trace elements found at any given site.
The next step, then, was to expand the spatial range of the study and the number of
environmental parameters that were analyzed along with the trace elements. The key to
implementing this step was also in employing hierarchical linear models as a means of
accounting for individual variation in trace element accumulation related to growth as well as
site-specific variation related to location within the watershed and local water and sediment
characteristics. That hydrological, chemical, physical and biological parameters should affect

146
bioaccumulation should come as no surprise. What is needed in biomonitoring efforts such as
this one is not just the recognition that those parameters affect the outcome but an attempt to
remove naturally occurring variation. In other words, more sophisticated and flexible statistical
models than the typical null hypothesis testing approaches need to be employed. By removing
uncertainty caused by naturally occurring variation, biomonitoring approaches can truly achieve
their ostensible goal of identifying the presence and impacts of anthropogenic pollution.
In its final study, I attempted to use freshwater bivalve shells as archives of exposure to
trace elements, as well as a record of seasonal environmental processes. The results lend
credence to the idea that trace element accumulation in annuli of bivalve shells can eventually be
tapped as a source of environmental data. Bivalve shells may be recording information on
climate, hydrology, water chemistry and pollution events within their shells. It will require an
array of validating studies as well as specialized statistical models to access this data and fully
understand its implications. Because bivalve shells are secreted in a sequential manner, their
trace element concentrations are autocorrelated and again, cannot be dealt with using null
hypothesis testing. Despite these challenges, the benefits of using shells as environmental
archives is clear, with implications including bivalve aging (the current techniques of which are
in dispute), monitoring the effects of climate change as they directly impact an organism and
possibly, retroactive monitoring of pollution events.
Overall, this dissertation makes the case for a carefully considered, appropriately
analyzed biomonitoring protocol when investigating trace elements. Naturally occurring
variation in bioaccumulation needs to be controlled for accurate conclusions to be drawn.
Potential biomonitor organisms need to meet a variety of criteria, including validation of their
suitability that takes place under the variable conditions that biomonitor programs would expect

147
to encounter in the field. At the same time, biomonitoring programs need to keep in mind their
ultimate goals, as in these studies, which attempted to identify sources of potentially toxic trace
elements to threatened native bivalves.
The mussels of the Altamaha River system are a highly unique and in some instances
imperiled group of organisms that inhabit a large, relatively unaltered drainage. Concurrent to
the studies reported on here, other researchers were investigating the genetics of Altamaha
mussels, their populations and our ability to accurately assess them and the movement of organic
xenobiotics within the Altamaha and its tributaries. At the same time, the Altamaha
spinymussel, Elliptio spinosa, was finally slated for federal listing as an endangered species,
underscoring the necessity of conservation and monitoring of this system. And so the work
continues, with a concerted effort to determine fish hosts for all the endemic species of the
Altamaha. Between the efforts of researchers to understand the unique mussel populations and
the stressors that they face and the actions of conservation-minded citizens groups such as the
Altamaha Riverkeeper, it is entirely possible that mussels and their habitat, will be preserved.


![Laboratory-Based Bioaccumulation Essay for Elements ... · in aquatic environment, including bioaccumulation [10]. Thus, this laboratory-based study assessed the bioaccumulation of](https://img.dokumen.tips/doc/110x75/5f0813d47e708231d42038a6/laboratory-based-bioaccumulation-essay-for-elements-in-aquatic-environment.jpg)


![Residues of some organic pollutants, their bioaccumulation ......Bioaccumulation is the net result of competing processes of absorption, ingestion, digestion, and excretion [22]. Bioaccumulation](https://img.dokumen.tips/doc/110x75/60fbc786322fe552715ef131/residues-of-some-organic-pollutants-their-bioaccumulation-bioaccumulation.jpg)