Embed Size (px)
Citation preview

Atmospheric CO2 and the terrestrial
carbon cycle in the past
Peter Köhler
16 February 2007AWI/IUP Blockseminare, University of Bremen
Alfred Wegener InstituteHelmholtz Centre for Polar and Marine ResearchBremerhaven


Anthropogenic rise

Anthropogenic rise
seasonal variability

Anthropogenic rise
(seasonal variability)
Glacial/interglacial
rise

Anthropogenic rise
(seasonal variability)
Glacial/interglacial
rise
Millennial-scale variations

The global carbon cycle
IPCC 2001

• GPP (gross primary production through photosynthesis)
~ 120 PgC/yr
• RA (autotrophic respiration)
vegetation ~60 PgC/yr
• NPP = GPP -RA (net primary
production) ~ 60 PgC/yr
• RH (heterotrophic respiration)
humus and soil ~ 55 PgC/yr
• NEP = NPP – RH (net ecosystem
production) ~ 5 PgC/yr
The global terrestrial carbon cycle

Present day tree cover (remote sensing)
DeFries et al. 2000

1 Seasonal variations
Variations in CO
2 (red)
and d13C (blue)
seasonal d(CO2) ~ 8ppmv
Köhler et al., 2006 Biogeosciences

Keeling plot (C.D.Keeling (1958))
Pataki et al 2003
Two important limitations:• 2 reservoir system• Fast process
Biosphere
Atmosphere
d 13C a∗Ca=d13C b∗Cb+d
13C s∗C s
Ca=C b+C s
d 13C a=a1Ca+d13C s

1 Seasonal variations
Seasonal cycle in atm 13C(CO2) has its origin in the
variability of the terrestrial biosphere (d13C0 ~ -25 o/oo)
Köhler et al., 2006 Biogeosciences

2 Anthropogenic rise

Cumulative input:•Fossil fuels 284 PgC•Land use 181 PgC•Sum 465 PgC
Cumulative uptake:•Atmosphere (m) 150 PgC•Ocean (m) 106 PgC•Terrestial B 209 PgC (back calculation (O2/N2); most uncertain)
2 Anthropogenic rise – global budget
After Marland et al 2005, Houghton 2003

•CO2 measured
•Fossil fuel burning uses O2
•Oceanic uptake measured•Land biotic uptake: •Land uptake increases O
2/N
2
ratio
>> Outgassing of O2 and land
uptake can be estimated
2 Antropogenic rise – recent land uptake
Plattner et al., 2002, GBC

Dynamic Global Vegetation Models DGVM
Global vegetation model include fundamental processes on different levels (photosynthesis, respiration, allocation, disturbances)
Global vegetation model include fundamental processes on different levels (photosynthesis, respiration, allocation, disturbances)
Global vegetation model include fundamental processes on different levels (photosynthesis, respiration, allocation, disturbances)
Species need to be grouped into so-called Plant Functional Types (PFT), typically 10 – 20 globally (grasses, temperate or tropical trees, etc).

C in Vegetation (Lund-Potsdam-Lena LPJ)

C in Soil (LPJ)

Total C (LPJ)

Glacial/interglacial
rise

3 Glacial/interglacial
Petit et al., 1999; EPICA, 2004; Siegenthaler et al., 2005

3 Glacial/interglacial
Köhler et al 2005, Climate Dynamics

3 Glacial/interglacial
Köhler et al 2005, Climate Dynamics
ice sheets

3 Glacial/interglacial
Köhler et al 2005, Climate Dynamics
ice sheets
sea level

3 Glacial/interglacial
Joos et al., 2004, GBC; Köhler et al 2005, Climate Dynamics
Results with LPJDifference Preindustrial to Last Glacial
Maximum LGM (~20,000 yr BP):
• Ice sheet retreat +600 PgC
• Sea level rise (+120 m) -200 PgC
• Rise in dT (+(5-10)K) -250 PgC
• Rise in CO2 (+90 ppmv) +650 PgC
• Total +800 PgC
Range given by various studies (d13C, pollen-based vegetation reconstructions, modelling): +(300-1000) PgC
C rise in biosphere leads to a DROP in CO2 by
~30 ppmv opposite to observations

CO2 fertilisation
Experiments show species specific response to elevated CO
2. Uptake rates seem to increase, but
also the respiration rates: Storage in plants not necessary increased. Soils are important. Körner, 2006

4 Millennial-scale variability
Köhler et al 2005, Climate Dynamics
Northern
Temperature
CO2
Southern
Temperature

4 Millennial-scale variability
Köhler et al 2005, Climate Dynamics
d(Precipitation)d(Temperature)

4 Millennial-scale variability
Köhler et al 2005, Climate Dynamics

4 Millennial-scale variability
Köhler et al 2005, Climate Dynamics
1. The overall response of the terrestrial carbon cycle depends on the background climate.
The pattern are the same:- southward shift of northern treeline- lower respirational losses in soil carbon
2. During glacial conditions about 50% of the observed variability in CO
2 (10-20 ppmv) can be explained
by the terrestrial biosphere.

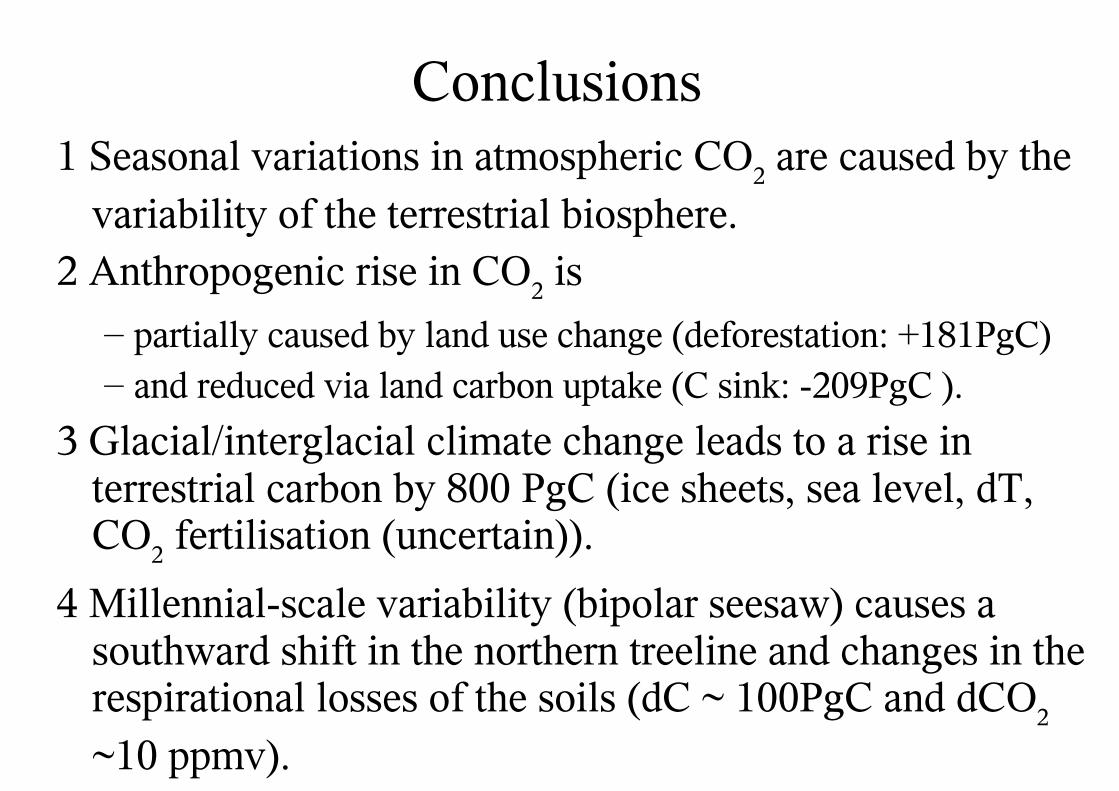
Conclusions1 Seasonal variations in atmospheric CO
2 are caused by the
variability of the terrestrial biosphere.

Conclusions1 Seasonal variations in atmospheric CO
2 are caused by the
variability of the terrestrial biosphere.2 Anthropogenic rise in CO
2 is
– partially caused by land use change (deforestation: +181PgC) – and reduced via land carbon uptake (C sink: -209PgC ).

Conclusions1 Seasonal variations in atmospheric CO
2 are caused by the
variability of the terrestrial biosphere.2 Anthropogenic rise in CO
2 is
– partially caused by land use change (deforestation: +181PgC) – and reduced via land carbon uptake (C sink: -209PgC ).
3 Glacial/interglacial climate change leads to a rise in terrestrial carbon by 800 PgC (ice sheets, sea level, dT, CO
2 fertilisation (uncertain)).
4 Millennial-scale variability (bipolar seesaw) causes a southward shift in the northern treeline and changes in the respirational losses of the soils (dC ~ 100PgC and dCO
2
~10 ppmv).


![Colgate Universitydepartments.colgate.edu/geography/pubs/domack... · shelf (Figure 2) [Rebesco et al., 1998; Anderson, 1999; Barker et al., 1999]. However, glacial/ interglacial](https://img.dokumen.tips/doc/110x75/5f695a8d41efda6d7e6c1a4d/colgate-u-shelf-figure-2-rebesco-et-al-1998-anderson-1999-barker-et-al.jpg)