Embed Size (px)
Citation preview

ASSESSMENT OF NUTRITIONAL STATUSAND ASSOCIATED FACTORS INNORTHERN PROVINCE
Dr. Renuka JayatissaDr. Moazzem HossainLaksiri Nanayakkara
Medical Research InstituteIn collaboration withUNICEF and WFP
MINISTRY OF HEALTH, SRI LANKAMarch 2012

i
ASSESSMENT OF NUTRITIONAL STATUS
AND ASSOCIATED FACTORS IN
NORTHERN PROVINCE
Dr. Renuka JayatissaDr. Moazzem HossainLaksiri Nanayakkara
Medical Research InstituteIn collaboration withUNICEF and WFP
MINISTRY OF HEALTH, SRI LANKAMarch 2012

ASSESSMENT OF NUTRITIONAL STATUS AND ASSOCIATED FACTORS IN NORTHERN PROVINCE
ii

ASSESSMENT OF NUTRITIONAL STATUS AND ASSOCIATED FACTORS IN NORTHERN PROVINCE
iii
PREFACE
The Northern Province survey was carried out by the Department of Nutrition of theMedical Research Institute in collaboration with the UNICEF and the World Food Program.This research was mainly focusing on maternal and child health nutrition status andassociated factors of the families who reside in the Northern Province. This research ismore than timely to assess years of efforts taken by the government and other organisationsto prevent and control nutritional problems in vulnerable age groups in the NorthernProvince.
I sincerely hope results of this survey will be a great opportunity for the policy makers anddonors in their efforts to control nutritional problems and to implement suitableinterventions for the betterment of the people who is residing in the Northern Province ofSri Lanka.
I appreciate the effort taken by the staff of the Department of Nutrition of the MedicalResearch Institute who has conducted the study. I take this opportunity to thank theparticipants of the study for their immense cooperation.
I am grateful to UNICEF and the WFP who always invest for the welfare of the Sri Lankanpopulation. I hope this survey will help to identify the current problems and upgrade thenutritional status of the population residing in the Northern Province.
Dr. Ravindra RuberuSecretaryMinistry of Health

ASSESSMENT OF NUTRITIONAL STATUS AND ASSOCIATED FACTORS IN NORTHERN PROVINCE
iv
MESSAGE FROM UNICEF AND WORLD FOODPROGRAMME
In October 2010 UNICEF and the World Food Programme (WFP), in collaboration with theMinistry of Health, conducted a survey to assess the nutritional status of resettledhouseholds in the Northern Province. The survey provided important data for evidence-based interventions in the Northern Province and wider public policy directions.
In the more recent context of the resettlement process nearing its completion, this currentsurvey was necessary to assess nutrition and related factors among the resettled and hostpopulations of the North. The basic objectives involved comparing the data of the previousyear with what we have found in this latest survey and to provide updated knowledge andevidence for future nutrition and food aid programmes for the Northern Province.
This survey’s findings are both encouraging and challenging; with a decline in the prevalenceof severe wasting and an increase in moderate wasting, when comparing the results with2010 survey. In addition the results show that the proportion of income which householdsspend to satisfy basic food needs has remained relatively unchanged. That said, additionalsurveys and more monitoring of the food security situation in the Northern Province arenecessary to understand the prevalence of food insecurity and where those most deprivedare living in the Northern Province.
The survey findings recommend continued nutrition interventions with particular focus onthe treatment of severe acute malnutrition, enhanced targeted programmes for childrenwith moderately acute under nutrition and food security measures in Northern Province.UNICEF and WFP are pleased to be part of this survey conducted by Medical ResearchInstitute (MRI) of the Ministry of Health and reiterate their commitment to continuedsupport for the Government of Sri Lanka in the quest of improving maternal and childhealth and the nutrition status of many vulnerable citizens of the country.
Reza Hossaine Adnan KhanUNICEF Representative WFP Representative

ASSESSMENT OF NUTRITIONAL STATUS AND ASSOCIATED FACTORS IN NORTHERN PROVINCE
v
ACKNOWLEDGEMENTS
Dr. Ravindra Ruberu, Secretary, Ministry of Health, provided the inspiration and the “space”to carryout this survey.
Dr. Moazzem Hossain, Chief Health and Nutrition, UNICEF, Colombo provided unstintingsupport and guidance in conceptualizing and implementing this survey co-authored thereport.
The survey was initiated with steadfast support from Reza Hussaine, country representativeof the UNICEF, and Adnan Khan, country representative, World Food Programme SriLanka.
We highly appreciate the continuous support of Dr. L. Siyabalagoda, DDG (PHS), Ministry ofhealth and Dr. Anil Samaranayaka, Acting Director, Medical Research Institute, Colombo.
Thanks goes to Dr. Lalith Chandradasa, and staff of SevaLanka colloborated in this effortwith data collection.
Roshan Madawala, Director Research Intelligent Unit, Colombo, Amila Wickramasekara,Statistician, University of Colombo and Thisara Jayasekara provided invaluable support forentering and analysis of data.
Special thanks goes to all the members of the National Nutrition Steering Committee,Ministry of Health, all the members of the MCN sub committee provided feedback on theconcept note and Dr. Ananda Gunasekara, DDG (MS), Ministry of Health, and all Expertswho participated in the data presentation meeting.
Our deepest gratitude goes to the Provincial Secretary, Provincial Director of HealthServices of the Northern Province, the Regional Directors, Medical officers of Health ofthe areas and their field staff and the District Secretaries and the Gramaseva Niladariofficers for their support given during the data collection period.
Our special thanks goes to Mr. K. Dharmawardena, Accountant of the National HealthFund and his staff for their assistance throughout the study.
Thanks are due to the many colleagues at the UNICEF, WFP who provided valuableinformation and support from the beginning.
Finally our acknowledgement goes to the villagers and the families of the Northern Provincefor their cooperation during the period of data collection. The hospitality shown by thevillagers gave us a great pleasure during the stay and it was a learning exercise throughexperience.
Dr. Renuka JayatissaConsultant Medical Nutritionist, MRI

ASSESSMENT OF NUTRITIONAL STATUS AND ASSOCIATED FACTORS IN NORTHERN PROVINCE
vi
RESEARCH TEAM
Dr. Renuka Jayatissa - Consultant Medical Nutritionist, MRI
Dr. S.M. Moazzem Hossaine - Chief Health and Nutrition, UNICEF
Prof. Dulitha Fernando - Emiratus Prof. Community Medicine
Dr. Nilakshi Waidyathilaka - Consultant Community Physician
Dr. Sandya Gunawardana - Medical Officer
Dr. Dula De Silva - Programme officer, WFP
Mr. Laksiri Nanayakkara - Programme Assistant, WFP
Mr. Anders Petersson - Programme officer, WFP
Mr. J.M. Ranbanda - Nutrition Assistant
Dr. A.T.D. Dabare - Medical Officer
Dr.W.I Gankanda - Pre-intern Research assistant
Dr.I.A.G.M.P Gunathilake - Pre-intern Research assistant
Miss.C.G Uduwaka - Research assistant
Mr. A.P. Senevirathne - Public Health Inspector
Mr. H.K.T. Wijayasiri - Public Health Inspector
Mr. P.V.N. Ravindra - Public Health Inspector
Mr. E.G.S. Kulasinghe - Public Health Inspector
Mr. W.A.P.I. Pieris - Public Health Inspector
Mr. E.C. Paranagama - Public Health Inspector
Mr. D.S. Dabare - Public Health Inspector
Mr. P.A.K.Y. Wijesundara - Public Health Inspector
Mrs. K.H.R. Shyamalee - Development Assistant
Mrs. W.R.T.S. Perera - Development Assistant
Miss H.I.K.N. Hevawitharana - Development Assistant
Miss.C.B. Wijemanna - Data Entry Operators
Miss. G.C. Priyadarshani - Data Entry Operators

ASSESSMENT OF NUTRITIONAL STATUS AND ASSOCIATED FACTORS IN NORTHERN PROVINCE
vii
TABLE OF CONTENTS
PREFACE iii
MESSAGE FROM UNICEF AND WORLD FOOD PROGRAMME iv
ACKNOWLEDGEMENTS v
RESEARCH TEAM vi
LIST OF TABLES ix
LIST OF FIGURES x
LIST OF ABREVIATIONS xi
EXECUTIVE SUMMARY xii
CHAPTER 1 1
INTRODUCTION 1
1.1 Background 1
1.2 Rationale 2
1.3 Objectives 2
CHAPTER 2 4
METHOD 4
2.1 Study population 4
2.2 Sample size collection 4
2.3 Sampling procedure 5
2.4 Data collection 6
2.5 Training of survey team 6
2.6 Field level data collection 6
2.7 Quality assurance 7
2.8 Data analysis 7
2.9 Ethical considerations 7
CHAPTER 3 9
BASIC HOUSEHOLD INFORMATION 9
3.1 Status of the Household 9
3.1.1 Sex of the head of the household 10
3.1.2 Number of persons within the household 10
3.1.3 Number of children under five years 11
3.1.4 Other relevant information 11
3.2 Basic information on the children 11

ASSESSMENT OF NUTRITIONAL STATUS AND ASSOCIATED FACTORS IN NORTHERN PROVINCE
viii
3.3 Basic information on the mother 12
3.3.1 Age distribution 13
3.3.2 Educational level of mothers 14
3.3.3 Availability of mother/father, at the time of the survey 15
3.4 Information on the structure of the house 15
CHAPTER 4 18
NUTRITIONAL STATUS AND RELATED FACTORS 18
4.1 Prevalence of wasting, stunting and underweight 18
4.2 Low birth weight (LBW) 20
4.3 Nutritional status of adult women 21
4.4 Determinants of nutritional status 22
4.4.1 Prevalence of diarrhoea/ acute respiratory infections (ARI) 22
4.4.2 Young child feeding practices 23
4.4.3 Food items given during the preceding 24 hours 24
4.4.4 Use of health services 25
4.4.5 Environmental sanitation and hygienic practices 26
4.4.6 Participation in nutrition rehabilitation programmes 29
4.4.7 Comparison of data on nutritional status in 2010 with data of the
present study 30
CHAPTER 5 32
ASSOCIATED FACTORS 32
5.1 Primary income sources 32
5.2 Agriculture 33
5.3 Assets 36
5.4 Expenditure 36
5.5 Coping strategies 38
5.6 Humanitarian assistance 39
CHAPTER 6 41
CONCLUSIONS 41
RECOMMENDATIONS 43
BIBILIOGRAPHY 44
ANNEX 1: LIST OF CLUSTERS - NORTHERN PROVINCE 45
ANNEX 2: BASIC HOUSEHOLD INFORMATION BY DISTRICT 47
ANNEX 3: QUESTIONNAIRE 61

ASSESSMENT OF NUTRITIONAL STATUS AND ASSOCIATED FACTORS IN NORTHERN PROVINCE
ix
LIST OF TABLES
Table 1 : Prevalence of under nutrition: stunting, wasting and underweight bybackground Characteristic 19
Table 2 : Prevalence of low birth weight, and mean birth weight among children bornin the 5 years preceding the survey, by background characteristics 20
Table 3 : Nutritional status of adult women (non-pregnant non-lactating) byhousehold status 21
Table 4 : Percentage of under-5 children who reported symptoms of respiratoryillness and diarrhea during previous 2 weeks, by background characteristics 22
Table 5 : Percentage of children, currently breast fed by age 23
Table 6 : Infant and young child feeding practices by background characteristics(children aged more than 6 months) 23
Table 7 : Percentage of children aged 6-59 months, who were given food itemsbelonging to the different food groups, on the day preceding the interviewby household status 24
Table 8 : Percentage distribution of children who received Vitamin A mega dosesupplement, de-worming tablets, vaccination and availability of CHDR, byhousehold status 25
Table 9 : Percentage of households according to source of water, method ofpurification, type of latrine and basic hygienic practices by household status 27
Table 10 : Sources of drinking water 28
Table 11 : Participation in nutrition supplementation programme 29
Table 12 : Clinic visits and the nutritional status 30
Table 13 : Comparison of data on nutritional status in 2010 with data of the presentstudy 31
Table 14 : Prevalence of under nutrition: stunting, wasting and underweight bydistricts 60

ASSESSMENT OF NUTRITIONAL STATUS AND ASSOCIATED FACTORS IN NORTHERN PROVINCE
x
LIST OF FIGURES
Figure 1 : Status of the household 9
Figure 2 : Sex of the head of the household 10
Figure 3 : Distribution of households by the number of s within the household 10
Figure 4 : Distribution of households by the number of under five years children 11
Figure 5 : Distribution of under 5 children by sex 12
Figure 6 : Distribution of under 5 children by age in months 12
Figure 7 : Distribution of mothers by pregnant / lactating status 13
Figure 8 : Age distribution of mothers 13
Figure 9 : Educational status of mothers 14
Figure 10 : Availability of mother/father during the visit to the household 15
Figure 11 : Information on materials used for housing 16
Figure 12 : Primary income sources, Northern Province 32
Figure 13 : Proportion of farmers who cultivated in yala 2011 and those who planto cultivate in maha 2011/12 33
Figure 14 : Households involved in home gardening 34
Figure 15 : Households cultivating the highland crops 34
Figure 16 : Households cultivating paddy 35
Figure 17 : Ownership of livestock 35
Figure 18 : Percentage of households that reported ownership of Jewellery 36
Figure 19 : Average proportion of expenditure on food 36
Figure 20 : Distribution of households by the the average percentage of incomespent on food by population groups 37
Figure 21 : Mean household reduced coping strategy index 38
Figure 22 : Type of food assistance received by households 39
Figure 23 : Other froms of assistance 40
Figure 24 : Proportion of households who received food assistance during lastthree months 40

ASSESSMENT OF NUTRITIONAL STATUS AND ASSOCIATED FACTORS IN NORTHERN PROVINCE
xi
LIST OF ABBREVIATIONS
ARI Acute Respiratory Infections
BMI Body Mass Index
CHDR Child Health Development Record
CI Confidence Interval
CMR Crude Mortality Rate
CSB Corn Soy Blend
FAO Food and Agriculture Organization
GN Grama Nildhari
GCE (OL) General Certificate of Education (Ordinary Level)
HEB High Energy Biscuits
IDP Internally Displaced Persons
IEC Information, education, Communication
IYCF Infant and Young Child Feeding
LBW Low Birth Weight
MAM Moderate Acute Malnutrtion
MRI Medical Research Institute
MUAC Mid Upper Arm Circumference
NGO Non Governmental Organization
NRP Nutrition Rehabilitation Programme
PHM Public Health Midwife
RHA Rural Health Assistant
RHV Rural Health Volunteer
SAM Severe Acute Malnutrition
UNICEF United Nations Education Fund
WFP World Food Programme

ASSESSMENT OF NUTRITIONAL STATUS AND ASSOCIATED FACTORS IN NORTHERN PROVINCE
xii
EXECUTIVE SUMMARY
The end of three decades of violent conflict between the Sri Lankan Armed Forces and theLiberation Tigers of Tamil Eelam (LTTE) which ended in May 2009 lead to the displacementof a substantial proportion of the population in the Northern Province. Resettlement of thedisplaced population commenced towards the end of 2009. By October 2011, theresettlement process is nearing completion.
In implementing the resettlement programme, emphasis was placed on ensuring the safetyof the resettled population, availability of infrastructure facilities such as road network,facilities to ensure environmental sanitation, educational facilities, provision of livelihoodsupport and legal issues related to identifying ‘places’ (land/ housing etc.) of resettlement..Availability of health service was also considered as an area of priority.
During the period of displacement of the population, community-based NutritionRehabilitation Programmes (NRP) were implemented by the Ministry of Health incollaboration with UNICEF and WFP with the aim of having a positive impact on the healthand nutritional status of the displaced community. These programmes were continued afterresettlement.
With the resettlement process nearing completion, it was considered relevant to make anassessment of the status of nutrition and associated factors among the resettled populationin particular and the host population in general and make comparisons with the dataobtained during the previous year, to fulfill the information needs required to plan health,nutrition and food aid programs for the Northern Province in the long term. It will also giveuseful information about the coverage of the current interventions.
A descriptive cross sectional study was carried out in a random sample of households in thefive districts of the Northern Province, Vavuniya, Jaffna, Mannar, Killinochchi and Mullativu.A sample of 1192 households was included from the five districts with the percentage beinghighest from the Jaffna district. Data collection was carried out using an intervieweradministered questionnaire. Anthropometric measurements, weight and height of thechildren were taken to assess the nutritional status.
During the analysis, emphasis was placed on comparing the status between the resettledhouseholds and the resident households. However, caution in interpreting these results issuggested as the sample was not stratified by resident and resettled populations.
Of all children, 16.5 percent were ‘low birth weight’ (LBW), with this percentage beingcomparatively higher in the two cohorts aged between 24 – 47.9 months, among femalechildren and among those in the resident households. Maternal educational status did notshow a consistent pattern in relation to the prevalence of low birth weight, except for thehigh percentage of LBW children among babies of mothers with no education. Mean birthweight for the total sample was 2.9 kg with a SD of 0.48
Of the total group 22.8 percent were stunted, 18.3 percent wasted and 29.5 percentunderweight with the percentages of severe stunting, wasting and underweight being 4.7percent, 1.3 percent and 7.0 percent respectively. Prevalence of stunting was lowest in theunder 6 months age group and showed an increase up to the age of 36–47 months and thena decline. Data on wasting shows that the prevalence was low in age groups under 6 months

ASSESSMENT OF NUTRITIONAL STATUS AND ASSOCIATED FACTORS IN NORTHERN PROVINCE
xiii
and 6-11 months, with high prevalence values in the age groups 24-35 months and 48-59months, thus not showing a consistent pattern. The prevalence of under weight also doesnot show a consistent pattern with increasing age.
There were no consistent differences between boys and girls in the prevalence of stuntingbut a higher prevalence of wasting and underweight was seen among boys. There was anindication that the prevalence of all three indicators declined with increasing levels ofeducation of the mother.
Health services availability and use was relatively satisfactory except for the Vitamin Asupplementation programme and to a lesser extent, the services for ‘deworming’, and thepattern of use of services not showing differences between the two groups of households.Availability of sanitation facilities and practices related to proper hygiene were better amongthe resident households.
Of all children 80 percent were enrolled in a feeding programme, this proportion beingcomparable between the children from resident and resettled households. The commonestfood supplement provided was Thriposha with micronutrients being provided to 15 percentof participants and plumpy nut and BP 100 being given to 2 and 4 percent respectively.
Daily labour was the main source of income in these households with this percentage beinghigher among the resettled families. Less than half of the households had undertaken paddycultivation during the most recent harvesting season with a small percentage of householdshaving home gardens.
Nearly a third of the sample, had received humanitarian assistance within the precedingthree months, with this percentage being higher among the resettled households, the maintypes of assistance being food assistance and Samurdhi vouchers.


ASSESSMENT OF NUTRITIONAL STATUS AND ASSOCIATED FACTORS IN NORTHERN PROVINCE
1
CHAPTER 1
INTRODUCTION
This report presents the results an assessment of nutrition and associated factors conductedjointly by the Medical Research Institute, UNICEF and the World Food Programme. Theassessment was carried out in the five districts comprising the northern province of SriLanka, namely Vavuniya, Mullativu, Killinochchi, Mannar and Jaffna, during the period of 6th
September to 15th October 2011.
1.1. Background
Conflicts leads to many humanitarian crisis situations, one being migration of populationfrom a conflict area to a non-conflict area. Similarly, due to the internal conflict situationthat existed for nearly three decades in Sri Lanka, emigration as well as migration within thecountry took place at different times in varying numbers. It is documented that n May 2009,during the final stages of the conflict leading to a civil war situation, there was a largeexodus of approximately 360,000 people a majority of whom were from the Vanni districtto temporary settlements (welfare centres) mainly located in the Vavuniya district, and inlimited numbers to other districts including Jaffna.
Resettlement of the IDPs was a priority concern and commenced during the latter monthsof 2009. The pace of resettlement increased in 2010 and by 8th of October 2010, more than500 days after the end of the civil conflicts; 92% (322,503) of the IDPs had been returned totheir places of origin, with approximately 25,000 still being living in the camps (Ministry ofResettlement 2010). According to the data available from the Ministry of Resettlement, as of19/08/ 2011, a total of 72,758 families that included 234,008 persons (111,840 males and122,248 female) have been resettled. Among this group, 28.4% have been resettled inKilinochchi district with 25.5 % in Jaffna district, and 19.1% in Mullaitivu,11.7% in Vavuniyaand 6.5 % in Mannar district respectively (Ministry of Resettlement, 2011).
The key aspects considered when implementing the resettlement programme wereensuring the safety of the resettled population, availability of infrastructure facilities such asroad network, facilities to ensure environmental sanitation, educational and health facilities,provision of livelihood support and legal issues related to identifying ‘places’ (land/ housingetc.) of resettlement. The support provided included: subsidies amounting to Rs.25,000 perfamily, provision of housing material, agricultural utensils, seed paddy tractors for ploughing,etc. Health service availability was also being restored in the areas where the families wereto be resettled.
With the aim of having a positive impact on the health and nutritional status of the displacedcommunity, community-based Nutrition Rehabilitation Programmes (NRP) wasimplemented by the Ministry of Health in collaboration with UNICEF and WFP. Theseprogrammes targeted children in the age of 6 months to 5 years as well as pregnant andlactating women and included the following components:

ASSESSMENT OF NUTRITIONAL STATUS AND ASSOCIATED FACTORS IN NORTHERN PROVINCE
2
Treatment of children suffering from severe, acute under-nutrition by providingtherapeutic food, namely BP 100 and plummpy-nut.
Treatment and prevention of moderate, acute under-nutrition by providingsupplementary food - High Energy Biscuits (HEB), Thriposha and Corn Soya Blend(CSB).
Promotion of breastfeeding as well as infant and young child feeding (IYCF) practices. Distribution of information, education and communication (IEC) materials to public
health midwives (PHMs) and communities. Training of PHMs and other health professionals on IYCF and nutrition in emergencies,
including the management of acute malnutrition. Parasite control through the distribution of de-worming tablets to children under-5
years, pregnant women and lactating mothers.Monitoring of the nutrition status ofchildren and pregnant and lactating mothers in targeted areas with the help of growthmonitoring programmes.
1.2 Rationale
Displacement followed by resettlement on populations is likely to have an impact on theirnutritional status and their health status in the short-term as well as their work capacity andhence their contribution to national development in the long-term. Monitoring thenutritional status in this group was an important consideration. In keeping with theaccepted practices to use rapid assessment techniques to monitor nutritional status, it wasdecided to carry out such assessments, periodically.
A substantial proportion of the population had been resettled by October 2010. Anassessment of the nutritional status of children under 5 years of age and along with otherrelevant information and the current food security situation, with a particular focus onlivelihood conditions among resettled households in the districts of Vavuniya, Mannar,Killinochchi, Mullativu and Jaffna, was carried out during the period October to November2010. Findings from this assessment are presented in the report on the “Assessment ofnutritional status and food security levels among resettled families” (MRI 2011).
At a time when resettlement process is nearing completion, it was considered relevant tomake such an assessment of the resettled population in particular and the host population ingeneral and make comparisons with the data obtained during the previous year.
This survey was carried out to fulfil the information needs that will help the Governmentof Sri Lanka (Ministries), UN agencies (UNICEF, WFP, FAO) and non-governmentalorganizations (NGOs) plan long-term health, nutrition and food aid programs for theNorthern Province in the long term. It will also give useful information about the coverageof the current interventions and suggest areas of gap and opportunity for improvement.

ASSESSMENT OF NUTRITIONAL STATUS AND ASSOCIATED FACTORS IN NORTHERN PROVINCE
3
1.3 Objectives
The main objective of the survey was to obtain information of nutritional status and themain influencing factors
Nutritional status To determine the prevalence of global and severe acute malnutrition
among children aged 0 - 59 months To determine the BMI and prevalence of low mid-upper arm
circumference among women of reproductive age
Infant and Young Child Feeding To gain a better understanding of infant and young child feeding practices
including the average duration of breastfeeding for children 0-24 months
Infectious disease and mortality To determine crude and under five mortality rates in the 3 months prior
to the survey. To determine the prevalence of diarrhoea, fever and acute respiratory
infections among children aged 0 - 59 months in the last two weeks ineach survey locations
Access to health services To estimate the proportion of children aged 0 - 59 months vaccinated
against measles To estimate the proportion of children aged 0 - 59 months who have
received vitamin A supplementation in the last 6 months
Water and sanitation To estimate the coverage of latrines among households To estimate access to safe water among households
Programmatic coverage To estimate the coverage of food supplementation programmes, in terms
of frequency and content To estimate the proportion of malnourished children enrolled in
Nutrition Rehabilitation Programme (NRP)
To make recommendations to the Ministry of Health, UNICEF, WFP, FAO andNGOs on the priority and long-term interventions needed in the health andnutrition sectors in the Northern Province in general and resettled areas inparticular.

ASSESSMENT OF NUTRITIONAL STATUS AND ASSOCIATED FACTORS IN NORTHERN PROVINCE
4
CHAPTER 2
METHOD
A cross sectional household survey was carried out on a representative sample ofhouseholds in the Northern Province of Sri Lanka.
2.1 Study population
The study population included the total population of the Northern Province of Sri Lankaresiding in 5 districts, Jaffna, Killinochi, Mullativu, Vavuniya and Mannar. Data collection wascarried out at the household and individual level. All locations within the province wereincluded in the sampling universe.
2.2 Sample size calculation
Children per household based on conservative median figure between national average of0.45 child per household.
Crude Mortality Rate (CMR) estimate for the rural areas, as provided by DHS 2006-7 was6/1000 per year. It is possible that such deaths may have increased the CMR. Design effect forCMR was estimated to be three because of the impact of the post-conflict livelihood constraints isprobably not uniform. 90 day recall period was used for CMR calculations.
Sample size calculation

ASSESSMENT OF NUTRITIONAL STATUS AND ASSOCIATED FACTORS IN NORTHERN PROVINCE
5
2.3 Sampling procedure
Compiling the study population
The sample was drawn based on the best available population estimates. A list ofall Grama Niladari (GN) area from Jaffna, Killinochi, Mullativu, Vavuniya andMannar were collected from the District Secretaries.
Selection of clusters
Eighty (80) clusters were identified using the population proportion to sizesampling technique. List of clusters by districts is given in annex 1.
Selection of households
A household was defined as “persons routinely sharing food from the samecooking pot and living in the same compound or physical location”. Each clusterincluded 15 households.
After reaching the field area, the team leader/supervisor contacted the localresource persons (PHM, GN, RHA, RHV, etc.) for the exact location of thevillage. He/she explained the purpose of the survey and survey procedures andobtained the initial permission of GN. Using the area map, the team leaderselected one village for survey.
For this purpose, complete information about the number of households available in thearea was obtained. If the number of households in the village was more than 100-300, , thevillage was divided into segments of approximately 50 households each. One segmentwas chosen randomly (using lottery technique or random numbers) and each householdwithin the segment was identified in the map and were numbered.
The total number of households was divided by 16 to get the ‘interval’ (usually it should be3). Identification of households commenced from a household selected at ‘random’. Usingthe calculated interval, the eligible households were identified marked.
All chosen households identified using the above procedure were included in the survey,whether or not there was a child aged 0–59 months, within the household.. If householdmembers were not available during the survey, the team returned later to interview thepersons in the relevant household or if possible, community members were requested tofind them and bring them to the house to be interviewed. Households were visited at leastthree times in an effort to obtain information from household members, unless security orlogistical constraints prohibited the amount of time spent in a cluster. If the members of ahousehold have departed permanently or were not expected to return before the surveyteam leaves the village, the household was not included and was not replaced.
The minimum age of respondents for the survey was 15 years. Where respondents feltthat they are not able to provide accurate information, houses was revisited. If accurateinformation cannot be obtained on subsequent visits, such questions were marked as‘missing’ in the questionnaire.

ASSESSMENT OF NUTRITIONAL STATUS AND ASSOCIATED FACTORS IN NORTHERN PROVINCE
6
This questionnaire to be administered to the respondents in each of the selectedhouseholds included information on socio-economic status, livelihoods in general and onhealth & nutrition status of children under five years and mothers of under 5 children.
Where possible involve the female head of the household/mother in the household wasidentified to be the respondent as they were have a clearer picture about child’sfood/feeding practices. However, by involving others like the male-head or older children,the information collection process were consolidated further.
2.4 Data collection
Data collection was done by data collectors recruited by Seva Lanka1 . Their training wasconducted by the staff of the Nutrition Department of the MRI. A total of 5 teams, eachincluding 3 members and 1 team leader (4 members per team) was allocated to carry outdata collection in each cluster.All team leaders were from MRI and they were responsible for quality checks at the fieldlevel.
2.5 Training of survey teams
Training for survey team members included 2 days of classroom instruction and practiceand one day of pre-testing all survey procedures, including interviews and anthropometricmeasurement. The inputs included basic introduction to nutrition and an explanation onthe objectives and the methodology of the survey and practical training on measuringtechniques. Each question in the questionnaire was discussed in detail. Methods thatincluded field based training and role playing were used.
As a part of their training, interviewers assisted in pre-testing and revision of questionnairein order to ensure their clarity and cultural appropriateness
The minimum age of respondents for the survey was 15 years. When respondents felt thatthey were not able to provide e accurate information, houses were revisited. If it was notpossible to obtain accurate information on subsequent visits, the responses of thosequestions were marked as ‘missing’.
2.6 Field level data collection
The survey comprised of two components.
1. An interviewer administered questionnaire was used to collect basic information ofhouseholds.
This questionnaire aimed to collect information on household demographics, water andsanitation, mortality, and livelihoods and was administered to the head of the householdwhere possible. A copy of the questionnaire is given in the annex 3.
1 A non governmental organization.

ASSESSMENT OF NUTRITIONAL STATUS AND ASSOCIATED FACTORS IN NORTHERN PROVINCE
7
2. Anthropometric measurements including weight and height or length were taken for eachchild under the age of 5 years.
If a child was not available at the time of the investigator’s visit, a repeat visit was made totake the measurements. Standardized procedures for measuring the height/length, weight,and oedema will be used.
Nutritional status of mothers was assessed by checking weight and height to calculate BodyMass Index (BMI). Measurements made were checked among a sub sample of children andof mothers, by the Nutrition Assistant of MRI.
2.7 Quality assurance
Constant supervision and monitoring of all field activities, editing, was carried out byundertaking the following steps:1. Concurrent crosschecks of the data collected by interviewers in a random sample ofhouseholds by team leaders.2. Routine field-editing of all questionnaires by the team leaders.3. Data cleaning and editing of the completed questionnaires by professional data editorsbefore data entry.4. Random checks of the data entry of questionnaire (10%) done by separate data entruoperators and consistency checks used to detect and correct data entry errors.
2.8 Data analysis
Data collected were recorded on paper questionnaires. All interviews were conducted inTamil and no identifier information was recorded or retained.
ENA software package was used for data management and analysis. SPSS package was usedin the preliminary data analysis. Data was entered, checked and preliminary analysis carriedout by the Research Intelligence Unit.
Antropometric data was analyzed using Anthro software package and analysed using WHO growthstandards.
2.9 Ethical considerations
No adverse reactions were expected as the participants will only be interviewed andchildren will be measured and no invasive procedures were carried out. Confidentiality ofall information was ensured. All persons were working on the project will be askedwere given strict instruction regarding ensuring confidentiality.
Before the interview, all participants were informed that if they are uncomfortableanswering any question/s that they can refuse to answer such questions or that they canstop the interview at any time. The sampling process was explained to the participants sothat they do not feel that they have been ‘singled out’.

ASSESSMENT OF NUTRITIONAL STATUS AND ASSOCIATED FACTORS IN NORTHERN PROVINCE
8
All participants will be assured that the welfare benefits that they received at the time willnot be affected by their agreement/disagreement in participating in the survey.
Permission was obtained from the Secretary of Health and the health authorities in theNorthern Province.

ASSESSMENT OF NUTRITIONAL STATUS
BASIC HOUSEHOLD
A total of 1192 households were included in the survey, of which 51.6 percent were in theJaffna district with the percentages in Kilinochchi, Mannar, Vavuniya and Mullaitive districtsbeing 12.9, 8.9, 14.3 and 12.3, respectively. These houbroad categories, those households which weregroup being referred to as ‘resident’ with the others, being referred to as ‘resettled’basic information on the households is given according to these two categories(see section 3.1.1 for details on the status of the households).the results comparing ‘residents’ to ‘resettled’ is recommended since the sample was notstratified by the two groups.
3.1 Status of the household
Of the total sample, 47.6 percent of all households were residing in their original places ofresidence (resident) with the percentage belonging to categories resettled, relocated andother being 47.1, 3.9 and 1.4were with host families (Figure 1).
2 This group included all households that belonged to the groups, resettled, relocated and other.
0
5
10
15
20
25
30
35
40
45
50
Resident
Perc
enta
ge
AND ASSOCIATED FACTORS IN NORTHERN PROVINCE
CHAPTER 3
BASIC HOUSEHOLD INFORMATION
A total of 1192 households were included in the survey, of which 51.6 percent were in theJaffna district with the percentages in Kilinochchi, Mannar, Vavuniya and Mullaitive districtsbeing 12.9, 8.9, 14.3 and 12.3, respectively. These households were considered under twobroad categories, those households which were in their original places of residence, this
being referred to as ‘resident’ with the others, being referred to as ‘resettled’basic information on the households is given according to these two categories(see section 3.1.1 for details on the status of the households). Cautious interpretatiothe results comparing ‘residents’ to ‘resettled’ is recommended since the sample was notstratified by the two groups.
Status of the household
percent of all households were residing in their original places ofresidence (resident) with the percentage belonging to categories resettled, relocated and
.4 percent respectively. Of all households, 3 percent of familieswith host families (Figure 1).
Figure 1 : Status of the household
This group included all households that belonged to the groups, resettled, relocated and other.
Resident Resettled Relocated Other
9
INFORMATION
A total of 1192 households were included in the survey, of which 51.6 percent were in theJaffna district with the percentages in Kilinochchi, Mannar, Vavuniya and Mullaitive districts
seholds were considered under twoin their original places of residence, this
being referred to as ‘resident’ with the others, being referred to as ‘resettled’ 2. Thebasic information on the households is given according to these two categories
Cautious interpretation ofthe results comparing ‘residents’ to ‘resettled’ is recommended since the sample was not
percent of all households were residing in their original places ofresidence (resident) with the percentage belonging to categories resettled, relocated and
percent respectively. Of all households, 3 percent of families
Other

ASSESSMENT
10
3.1.1 Sex of the head of the household
In 80 percent of all households included in the study, the heads of the householdswere males, as shown in Figure 2. A comparison between the two groups ofhouseholds did not show any major differences.
Figure
3.1.2 Number of persons within the household
In 33 percent of all households, the number of persons was 3 or less (Figure 3), withanother 56 percent having 4with 7 or more members was 11 pmore than 3 members were higher among the resident households.
Figure 3 : Distribution of households by the number of s within the household
0
10
20
30
40
50
60
70
80
90
Resident
Perc
enta
ge
14.5
56.8
0
10
20
30
40
50
60
Resident
Perc
enta
ge
ASSESSMENT OF NUTRITIONAL STATUS AND ASSOCIATED FACTORS
Sex of the head of the household
In 80 percent of all households included in the study, the heads of the householdswere males, as shown in Figure 2. A comparison between the two groups ofhouseholds did not show any major differences.
Figure 2 : Sex of the head of the household
Number of persons within the household
In 33 percent of all households, the number of persons was 3 or less (Figure 3), withanother 56 percent having 4 – 6 household members. The percentage of familieswith 7 or more members was 11 percent for the total sample. Households withmore than 3 members were higher among the resident households.
: Distribution of households by the number of s within the household
Resident Resettled Northern Province
18.2
32.7
56.8
28.9
56
6 5.3
11.3
Resident Resettled Northern Province
IN NORTHERN PROVINCE
In 80 percent of all households included in the study, the heads of the householdswere males, as shown in Figure 2. A comparison between the two groups of
In 33 percent of all households, the number of persons was 3 or less (Figure 3), with6 household members. The percentage of families
ercent for the total sample. Households withmore than 3 members were higher among the resident households.
: Distribution of households by the number of s within the household
Male
Female
1-3
4-6
>_7

ASSESSMENT OF NUTRITIONAL STATUS
3.1.3 Number of children under five
Of the 1192 households visited there were one or more children under five in 460(38.6 percent) of householdspercentage being higher among resident households (Figure 4). In 4 percent of thesample, there were 3between the two groups.
Figure 4: Distribution of households by the number of under five
3.1.4 Other relevant information
There were a total of 56 births in these households since April 2011, 46 percent ofthem occurring in resettled households. There were 4 deaths, with 2 of themoccurring in each of the two groups of households.during the last 90 days.added on. Crude death rate was 0.09(0.03
3.2 Basic information on the children
A total of 568 children were identified from the households as being eligible to be includedin the survey.
In the resident households, the percentages of male children were higher than that of thefemales, (54 percent males and 46 percent females) with the reverse being observed amongresettled families (Figure 5). Distribution of children by age grouppercent in the 6 – 11.9 months age group, to 21 percent in the 48group (Figure 6), with minimum differences between the two groups.
69.5
26.4
0
10
20
30
40
50
60
70
80
Resident
Perc
enta
ge
AND ASSOCIATED FACTORS IN NORTHERN PROVINCE
Number of children under five years
Of the 1192 households visited there were one or more children under five in 460of households. Among this group, 64 percent had one child, with this
percentage being higher among resident households (Figure 4). In 4 percent of thewere 3 or more children aged under five years, with
the two groups.
: Distribution of households by the number of under five years children
Other relevant information
There were a total of 56 births in these households since April 2011, 46 percent ofthem occurring in resettled households. There were 4 deaths, with 2 of themoccurring in each of the two groups of households. There were no child deaths
days. A total of 13 members left the households anddeath rate was 0.09(0.03-0.22).
Basic information on the children
A total of 568 children were identified from the households as being eligible to be included
In the resident households, the percentages of male children were higher than that of thefemales, (54 percent males and 46 percent females) with the reverse being observed among
). Distribution of children by age group varied between 6.911.9 months age group, to 21 percent in the 48 – 59.9 months old age
), with minimum differences between the two groups.
58.963.6
26.4
37.232.4
4.1 3.9 4
Resident Resettled Northern Province
11
Of the 1192 households visited there were one or more children under five in 460. Among this group, 64 percent had one child, with this
percentage being higher among resident households (Figure 4). In 4 percent of theor more children aged under five years, with no differences
years children
There were a total of 56 births in these households since April 2011, 46 percent ofthem occurring in resettled households. There were 4 deaths, with 2 of them
There were no child deathsA total of 13 members left the households and 10 have been
A total of 568 children were identified from the households as being eligible to be included
In the resident households, the percentages of male children were higher than that of thefemales, (54 percent males and 46 percent females) with the reverse being observed among
varied between 6.959.9 months old age
1
2
>_3

ASSESSMENT
12
Figure
Figure 6: Distribution of under 5 children by age in months
3.3 Basic information on the mother
Information related to the mothers of the children included in the study are presentedbelow. As shown in figure 7, 4 percent in this group were pregnant, with another 18percent being lactating mothers. Percentage of pregnant women and lactating women wermarginally higher among the resettled families.
54.1
45.9
0
10
20
30
40
50
60
Resident
Perc
enta
ge
10.8
7.9
21.6
21.6
0
5
10
15
20
25
Resident
Perc
etag
e
ASSESSMENT OF NUTRITIONAL STATUS AND ASSOCIATED FACTORS
Figure 5: Distribution of under 5 children by sex
: Distribution of under 5 children by age in months
Basic information on the mother
Information related to the mothers of the children included in the study are presentedbelow. As shown in figure 7, 4 percent in this group were pregnant, with another 18percent being lactating mothers. Percentage of pregnant women and lactating women wermarginally higher among the resettled families.
45.349.2
45.9
54.750.8
Resident Resettled Northern Province
10.
4
10.6
6
6.9
21.5
21.5
21.6
19.8 20
.6
19.5
19.5
19.5
18.7
22.8
21
Resident Resettled Northern Province
IN NORTHERN PROVINCE
: Distribution of under 5 children by age in months
Information related to the mothers of the children included in the study are presentedbelow. As shown in figure 7, 4 percent in this group were pregnant, with another 18percent being lactating mothers. Percentage of pregnant women and lactating women wer e
Male
Female
0-5.9
6.0-11.9
12.0-23.9
24.0-35.9
36.0-47.9
48.0-59.9

ASSESSMENT OF NUTRITIONAL STATUS
3.3.1 Age distribution
More than half of them (59 percent) were in the age group 26than1percent in the age groups, less than18 years and more than 46 years (Figure 8).
Figure 7: Distribution of mothers by pregnant / lactating status
Figure
3.2 5.1
4.2
0
10
20
30
40
50
60
70
80
90
Pregnant
Perc
enta
ge
1.5
0.4 1
0
10
20
30
40
50
60
70
<18
Perc
enta
ge
AND ASSOCIATED FACTORS IN NORTHERN PROVINCE
Age distribution
More than half of them (59 percent) were in the age group 26 –in the age groups, less than18 years and more than 46 years (Figure 8).
: Distribution of mothers by pregnant / lactating status
Figure 8 : Age distribution of mothers
16.6
80.2
19.2
75.7
4.2
18
77.8
Pregnant Lactating Non pregnant &nonlactating
Resident
Resettled
Northern Province
20.5
56.9
20.5
0.5
19.7
59.2
20.6
0
20.1
58.1
20.6
0.2
19-25 26-35 36-45 >_46
Resident
Resettled
Northern Province
13
– 35 years with lessin the age groups, less than18 years and more than 46 years (Figure 8).
: Distribution of mothers by pregnant / lactating status
Resident
Resettled
Northern Province
Resident
Resettled
Northern Province

ASSESSMENT
14
3.3.2. Educational level of mothers
Comparison of educational levels of mothers between theindicate that a majority of the mothers (77 percent for the total sample) has receivededucation up to secondary level with this percentage being higher among those inthe resettled households (Figure 9 ). Conversely, of the 17 perhad achieved an educational status above GCE (OL), the percentage was higheramong the mothers of resident households (22 percent) compared to those ofresettled households (17 percent).
Figure
0.5 1.3
0.9
0
10
20
30
40
50
60
70
80
90
No Schooling
Perc
enta
ge
ASSESSMENT OF NUTRITIONAL STATUS AND ASSOCIATED FACTORS
Educational level of mothers
Comparison of educational levels of mothers between the two groups of householdsindicate that a majority of the mothers (77 percent for the total sample) has receivededucation up to secondary level with this percentage being higher among those inthe resettled households (Figure 9 ). Conversely, of the 17 per cent of mother whohad achieved an educational status above GCE (OL), the percentage was higheramong the mothers of resident households (22 percent) compared to those ofresettled households (17 percent).
Figure 9: Educational status of mothers7.
2
63.9
22.2
6.27.2
77
12.8
1.87.
2
71.1
17
3.7
1-5 6-10 11-13 Higher
Resident
Resittled
Northern Province
IN NORTHERN PROVINCE
two groups of householdsindicate that a majority of the mothers (77 percent for the total sample) has receivededucation up to secondary level with this percentage being higher among those in
cent of mother whohad achieved an educational status above GCE (OL), the percentage was higheramong the mothers of resident households (22 percent) compared to those of
Resident
Resittled
Northern Province

ASSESSMENT OF NUTRITIONAL STATUS
3.3.3 Availability of mother / father, at the time of the survey
In 98 percent of households, mothers were available at the time of the survey, withthis percentage being higher among the resettled households. The comparablepercentage among fathers was 91 percent. The percentage of families where thefather and mother were living separately was 8 percent (Figure 10).
Figure 10 : Availability of mother/
3.4 Information on the structure of the house
Table 11 A, B and C presents the data on the structure of housing. Of all houses, a majorityhad walls made of cement blocks (68 percent) , more of them being amongh residenthouseholds (80 percent).. The percentage of houses that had cadjan walls was 17among the resettled families which was much higher compared to the other group.
A total of 64 percent had roofing using tiles/asbestos with more of the resident hpuseholdshaving used this method. Another 21more houses of resettled population having used this mode of roofing.
Of all houses, 81 percent has cemented floors with another 17 percent having mud/cowdung being used for flooring.
44.5
0
53.3
97.8
0
20
40
60
80
100
120
Mot
her:
aliv
ean
dto
geth
er
Perc
enta
ge
AND ASSOCIATED FACTORS IN NORTHERN PROVINCE
Availability of mother / father, at the time of the survey
In 98 percent of households, mothers were available at the time of the survey, withthis percentage being higher among the resettled households. The comparablepercentage among fathers was 91 percent. The percentage of families where the
were living separately was 8 percent (Figure 10).
: Availability of mother/father during the visit to the household
Information on the structure of the house
Table 11 A, B and C presents the data on the structure of housing. Of all houses, a majorityhad walls made of cement blocks (68 percent) , more of them being amongh residenthouseholds (80 percent).. The percentage of houses that had cadjan walls was 17among the resettled families which was much higher compared to the other group.
A total of 64 percent had roofing using tiles/asbestos with more of the resident hpuseholdsAnother 21 percent had roofs made of corrugated
more houses of resettled population having used this mode of roofing.
Of all houses, 81 percent has cemented floors with another 17 percent having mud/cow
0 0.4
41.2
2.9
0.4
1.3
0.4
29.8
4.6
0.7
1.3
0.9
91
7.5
1.1
Mot
her:
aliv
ean
dse
para
te
Mo
ther
:dea
d
Fath
er:a
live
and
toge
ther
Fath
er:a
live
and
sepa
rate
Fath
er:d
ead
Resident
Resettled
Northern Province
15
Availability of mother / father, at the time of the survey
In 98 percent of households, mothers were available at the time of the survey, withthis percentage being higher among the resettled households. The comparablepercentage among fathers was 91 percent. The percentage of families where the
were living separately was 8 percent (Figure 10).
the visit to the household
Table 11 A, B and C presents the data on the structure of housing. Of all houses, a majorityhad walls made of cement blocks (68 percent) , more of them being amongh residenthouseholds (80 percent).. The percentage of houses that had cadjan walls was 17 percentamong the resettled families which was much higher compared to the other group.
A total of 64 percent had roofing using tiles/asbestos with more of the resident hpuseholdspercent had roofs made of corrugated sheets with
Of all houses, 81 percent has cemented floors with another 17 percent having mud/cow
Resident
Resettled
Northern Province

ASSESSMENT
16
Figure 11
81.1
2.8 5.
5
0
10
20
30
40
50
60
70
80
90
Resident
Perc
enta
ge
88
27.7
0.90
10
20
30
40
50
60
70
80
90
100
Resident
Perc
enta
ge
ASSESSMENT OF NUTRITIONAL STATUS AND ASSOCIATED FACTORS
11: Information on materials used for housing
A. Walls (exterior)
B. Floor
55.1
67.1
17
10.1
5.5 8.
3
6.9
1.9
12.2
7.2
Resident Resettled Northern Province
Walls
Cement blocks
Cadjan
Mud
Other
73.480.5
23.316.6
0.9 1.8 1.40 1 0.5
Resident Resettled Northern Province
Flooring
Cement
Mud/Cow dung
Wood
Others
IN NORTHERN PROVINCE
Cement blocks
Cadjan
Mud
Other
Cement
Mud/Cow dung
Wood
Others

ASSESSMENT OF NUTRITIONAL STATUS
Tables providing the data on comparison of basic household characteristics by districts are given inAnnex 2 tables 1 – 14.
58.7
24
9.96
0
10
20
30
40
50
60
70
Resident
Perc
enta
ge
AND ASSOCIATED FACTORS IN NORTHERN PROVINCE
C. Roofing
Tables providing the data on comparison of basic household characteristics by districts are given in
35.5
46.7
10.9
17.2
31.7
21.1
6
15.711
0.75.6
3.2
Resident Resettled Northern Province
Roofing
Tiles
Asbestos
Corrugated sheets
Cadjan
Others
17
Tables providing the data on comparison of basic household characteristics by districts are given in
Asbestos
Corrugated sheets
Cadjan

ASSESSMENT OF NUTRITIONAL STATUS AND ASSOCIATED FACTORS IN NORTHERN PROVINCE
18
CHAPTER 4
NUTRITIONAL STATUS AND RELATED FACTORS
4.1 Prevalence of wasting, stunting and underweight
The indicators of under-nutrition included in the assessment were stunting, wasting andunderweight. Of the total group (both resident and resettled households) 22.8 percentwere stunted, 18.3 percent wasted and 29.2 percent underweight with the percentages ofsevere stunting, wasting and underweight being 4.7 percent, 1.3 percent and 6.9 percentrespectively (Table 1)
Prevalence of stunting was lowest in the under 6 months age group and showed anincreasing prevalence up to the age of 36 – 47 months and then a decline in the 48 – 59month age group. Data on wasting shows that the prevalence was low in both age groupsunder 6 months and 6-11 months, with high prevalence values seen in the age group 24-35months of age and in the age group 48-59 months, thus not showing a consistent pattern.
The prevalence of under weight also does not show a consistent pattern with increasing age,with a low prevalence in the age group 12 – 23 months (11.5 percent) and a high prevalencein the age groups 24 – 35 months (35.2 percent) and 36 – 47 months (39.8 percent).
A difference was seen in the prevalence of all three indicators of nutritional status when acomparison was made between the children in the families who were resident and thosewho were resettled, with the prevalence of all indicators of under nutrition being higheramong the resettled, compared to the resident group. As mentioned this should beinterpreted with caution because the sample was not stratified by residents and resettledhouseholds.
There were no consistent differences between sexes regarding occurrence of stunting but ahigher prevalence of wasting and underweight was seen among males.
Considering mother’s education, only mothers of 6 children had not attended school and 16mothers who had obtained higher education, thus limiting the ability to draw validconclusions. However, among the other educational categories, the prevalence of all threeindicators showed a consistent decline with increasing levels of education of the mother.

ASSESSMENT OF NUTRITIONAL STATUS AND ASSOCIATED FACTORS IN NORTHERN PROVINCE
19
Table 1 : Prevalence of under nutrition: stunting, wasting and underweight by backgroundcharacteristics
Background Characteristic
Height-for- age (%)Stunting
Weight-for-height (%)Wasting
Weight-for-age(%)
UnderweightTotal No of
Children
<-3SD
≥-3to -2.01
≥-2SD
<-3SD
≥-3to -2.01
≥-2SD
<-3SD
≥-3to
2.01
≥-2SD
No %
Age of child (months)
<6 1(1.9)
4(7.5)
48(90.6)
0(0.0)
5(9.4)
48(90.6)
1(1.9)
6(11.3)
46(86.8) 53 10.0
6-11 1(2.9)
4(11.4)
30(85.7)
0(0.0)
3(8.6)
32(91.4)
1(2.9)
3(8.6)
31(88.6) 35 6.6
12-23 6(5.2)
16(13.9)
93(80.9)
1(0.9)
17(14.8)
97(84.3)
7(6.1)
23(20.0)
85(73.9) 115 21.7
24-35 7(6.7)
23(21.9)
75(71.4)
2(1.9)
22(21.0)
81(77.1)
8(7.6)
29(27.6)
68(64.8) 105 19.8
36-47 6(5.8)
27(26.2)
70(68.0)
3(2.9)
18(17.5)
82(79.6)
9(8.7)
32(31.1)
62(60.2) 103 19.5
48-59 4(3.4)
22(18.6)
92(78.0)
1(0.8)
25(21.2)
92(78.0)
11(9.3)
26(22.0)
81(68.6) 118 22.3
HH status
Resident 14(6.0)
37(15.8)
185(78.2)
6(2.6)
32(13.7)
196(83.8)
17(7.3)
52(22.2)
165(70.5) 234 44.4
Resettled 11(3.8)
58(19.8)
224(76.5)
1(0.3)
58(19.8)
234(79.9)
20(6.8)
67(22.9)
206(70.3) 293 55.6
Sex of child
Male 11(4.2)
47(18.1)
201(77.6)
3(1.2)
48(18.5)
208(80.3)
16(6.2)
52(20.1)
191(73.7) 259 49.0
Female 14(5.2)
49(18.1)
207(76.7)
4(1.5)
42(15.6)
224(83.0)
21(7.8)
67(24.8)
82(67.4) 270 51.0
Mother’s education*
No schooling 0(0.0)
1(16.7)
5(83.3)
0(0.0)
1(16.7)
5(83.3)
0(0.0)
4(66.7)
2(33.3) 6 1.2
Primary 3(7.7)
5(12.8)
31(79.5)
0(0.0)
6(15.4)
33(84.6)
2(5.1)
11(28.2)
26(66.7) 39 7.8
Secondary 17(4.8)
68(19.4)
266(75.8)
6(1.7)
68(19.4)
277(78.9)
30(8.5)
81(23.1)
240(68.4) 351 70.2
Passed O’ Level 2(2.3)
14(15.9)
72(81.8)
1(1.1)
12(13.6)
75(85.2)
2(2.3)
16(18.2)
70(79.5) 88 17.6
Higher 2(12.5)
1(6.3)
13(81.3)
0(0.0)
0(0.0)
16(100.0)
2(12.5)
1(6.3)
13(81.3) 16 3.2
Overall 25(4.7)
96(18.1)
408(77.1)
7(1.3)
90(17.0)
432(81.7)
37(7.0)
119(22.5)
373(70.5) 529 100.0
(<-3SD = severe; -3SD and -2SD= moderate; >=-2SD=mild and normal)

ASSESSMENT OF NUTRITIONAL STATUS AND ASSOCIATED FACTORS IN NORTHERN PROVINCE
20
4.2 Low birth weight (LBW)
Of all children included in the study, 17 percent were of low birth weight; with thispercentage being comparatively higher in the two cohorts aged between 24 – 47.9 monthsand among female children (Table 2). Mean birth weight for the total sample was 2.9 kgwith a SD of 0.48.
Percentage of low birth weight children was higher (17.8 percent) among those in theresident households compared to the resident population (14.5 percent).
Table 2: Prevalence of low birth weight, and mean birth weight among children born in the 5years preceding the survey, by background characteristics
BackgroundCharacteristic
Birth Weight
< 2500g (%) ≥2500g (%) Total (%) Mean (kg) SD
Age of child(months)
0-5.9 07 (12.7) 48 (87.3) 55 (10.2) 2.94 0.42
6-11.9 04 (11.1) 32 (88.9) 36 (6.7) 2.94 0.52
12-23.9 12 (10.4) 103 (89.6) 115 (21.3) 2.98 0.41
24-35.9 25 (22.9) 84 (77.1) 109 (20.2) 2.94 0.51
36-47.9 23 (22.8) 78 (77.2) 101 (18.7) 2.86 0.54
48-59.9 16 (13.0) 107 (87.0) 123 (22.8) 2.93 0.45
HH Status
Resident 43 (17.8) 198 (82.2) 241 (44.9) 2.91 0.49
Resettled 43 (14.5) 253 (85.5) 296 (55.1) 2.92 0.46
Sex of child
Male 36 (13.6) 228 (86.4) 264 (49.0) 2.97 0.50
Female 51 (18.5) 224 (81.5) 275 (51.0) 2.86 0.44
Mother’seducation
No schooling 02 (33.3) 04 (66.7) 06 (1.2) 2.69 0.43
Primary 06 (15.8) 32 (84.2) 38 (7.5) 2.84 0.49
Secondary 62 (17.5) 293 (82.5) 355 (69.9) 2.91 0.49
Passed O’ Level 11 (12.1) 80 (87.9) 91 (17.9) 2.97 0.43
Higher 03 (16.7) 15 (83.3) 18 (3.5) 3.03 0.44
Total 84 (16.5) 424 (83.5) 508 (100.0) 2.92 0.48

ASSESSMENT OF NUTRITIONAL STATUS AND ASSOCIATED FACTORS IN NORTHERN PROVINCE
21
Maternal educational status did not show a consistent pattern in relation to the prevalenceof low birth weight, except for the high percentage of LBW children among babies ofmothers with no education. However, this observation needs cautious interpretation, as thenumber of such mothers was small.
4.3 Nutritional status of adult women
Nutritional status of non pregnant non lactating women were assessed using Body MassIndex (BMI). As shown in Table 3, 15.0 percent of the women had a BMI less than 18.5, 58.2percent BMI values between 18.5 and 24.9, with this percentage being marginally higheramong the women in the resettled households. For the total sample, only 27 percent ofwomen had BMI values more than 25, more of them belonging to resident households.
A lower percentage of mothers in resident households had heights less than 145 cm (4.2.percent) compared to 6.2 percent among the other group.
Table 3: Nutritional status of adult women (non-pregnant non-lactating) by household status

ASSESSMENT OF NUTRITIONAL STATUS AND ASSOCIATED FACTORS IN NORTHERN PROVINCE
22
4.4 Determinants of nutritional status
4.4.1 Prevalence of diarrhoea/ acute respiratory infections (ARI)
As shown in Table 4, 14 percent of all children reported having had a cough or coldwith fever during the 2 weeks preceding the survey and 5 percent of all childrenreported to have had diarrhoea. Cough with fever was high in 24-35.9 months agegroup with diarrohea being highest in the age group 12- 23.9 months. A higherprevalence of both morbidities was reported among children from residenthouseholds compared to those that were resettled. Prevalence of both morbiditieswere higher among the male children. A reduction in the prevalence was seen withincreasing level of maternal education. (Mothers belonging to the highest and thelowest educational groups were not considered in this comparison due to smallnumbers in each such group).
Of the children who reported diarrohea, nearly half of them were given ‘Jeevanie’with this percentage being zero in the two extreme age groups.
Table 4: Percentage of under-5 children who reported symptoms of respiratory illness anddiarrhea during previous 2 weeks, by background characteristics
Background characteristicTotal
number ofchildren
% Reported illnessTreatment for
diarrhea
Cough orcold with
feverDiarrhea Jeevanee
Age of child (months)
0-5.9 57 06 (10.5) 02(3.5) 0 (0.0)
6-11.9 37 05 (13.5) 02 (5.4) 02 (100.0)
12-23.9 116 17 (14.7) 10 (8.6) 07(70.0)
24-35.9 111 20 (18.0) 07 (6.3) 03 (42.9)
36-47.9 106 19 (17.9) 03 (2.8) 01 (33.3)
48-59.9 125 14 (11.2) 01 (0.8) 0 (0.0)
HH Status
Resident 246 38 (15.6) 13 (5.3) 08 (61.5)
Resettled 209 43 (14.0) 12 (3.9) 05 (41.7)
Sex of child
Male 275 48 (17.6) 16 (5.9) 07 (43.8)
Female 282 33 (11.8) 09 (3.2) 06 (66.7)
Mother’s education
No schooling 06 0 (0.0) 0 (0.0) 0(0.0)
Primary 42 5 (12.2) 01 (2.4) 1 (100.0)
Secondary 365 51 (14.1) 16 (4.4) 07 (43.8)
Passed O’ Level 91 16 (17.8) 5(5.5) 04 (80.0)
Higher 18 03 (16.7) 2(11.1) 1 (50.0)
Overall 552 81 (14.7) 25 (4.6) 13 (52.0)

ASSESSMENT OF NUTRITIONAL STATUS AND ASSOCIATED FACTORS IN NORTHERN PROVINCE
23
4.4.2. Young child feeding practices
Of the total sample, 45 percent of all children were being breast fed at the time ofthe survey, this percentage being 98 percent in the under 6 months age group andshowing gradual decline with increasing age (Table 5).
Table 5: Percentage of children, currently breast fed by age
Age groupCurrently breastfed Total
Yes No Don’t Know No. %
0-5.9 56 (98.2) 1 (1.8) 0 (0.0 57 10.3
6.0-11.9 34 (91.9) 3 (8.1) 0 (0.0) 37 6.7
12.0-23.9 88 (75.9) 28 (24.1) 0 (0.0) 116 20.9
24.0-35.9 52 (46.4) 60 (53.6) 0 (0.0) 112 20.1
36.0-47.9 15 (14.2) 91 (85.8) 0 (0.0) 106 19.1
48.0-59.9 4 (3.1) 123 (96.1) 1 (0.8) 128 23.0
Total 44.8 55.0 0.2 556 100.0
Table 6: Infant and young child feeding practices by background characteristics(Children aged more than 6 months)
Feeding practices
% Within Household Status
Resident Resettled
Total NorthernProvince
No %
Solid, semi-solid or soft foodconsumption
Yes 201 (92.2) 255 (93.1) 456 92.7
No 10 (4.6) 13 (4.7) 23 4.7
Don’t know 07 (3.2) 06 (2.2) 13 2.6
Frequency of solid, semi-solid, orsoft food other than liquidconsumption of the child
1-2 33(16.4) 83(33.1) 116 25.7
3-4 148(73.6) 140(55.8) 288 63.7
5-6 20(10.0) 26(10.4) 46 10.2
Don’t know 0(0.0) 2(0.8) 2 0.4
Using a bottle with a nipple
Yes 78 (35.5) 85 (30.8) 163 32.9
No 142 (64.5) 189 (68.5) 331 6.7
Don’t know 0 (0.0) 02 (0.7) 02 0.4

ASSESSMENT OF NUTRITIONAL STATUS AND ASSOCIATED FACTORS IN NORTHERN PROVINCE
24
Additional information on infant and young feeding practices show that for all underfive children 93 percent were given solid, semi solid or soft food for consumption.This percentage did not show major differences between resident households andresettled households (Table 6). Children in the age groups of <6, 6-11 and 12-23months who were given solid, semisolid or soft foods were 10.7, 73.0 and 89.7percent respectively.
Of all children, 33 percent were given a food item using a bottle with a nipple withthis percentage being higher among the original households (36 percent).
4.4.3. Food items given during the preceding 24 hours
Table 7: Percentage of children aged 6-59 months, who were given food items belongingto the different food groups, on the day preceding the interview by household status
Item
%
Resident ResettledTotal Northern
Province %
Water 215(97.7) 277 (99.6) 492 98.8
Infant formula 117 (54.4) 134 (48.6) 251 51.1
Medicinal water 48 (22.0) 48 (17.5) 96 19.5
Sugar/Glucose water 65 (29.5) 88 (32.0) 153 30.9
Jeevanee 02 (0.9) 07 (2.6) 09 1.8
Cereals 97 (44.1) 95 (34.8) 192 38.9
Rice cunjee 39 (18.1) 55 (20.1) 94 19.3
Grains 206 (93.6) 254 (92.0) 460 92.7
Vitamin A rich food 99 (45.0) 97 (35.1) 196 39.5
Roots and yams 131 (59.5) 148 (53.6) 279 56.2
Dark green vegetables 102 (46.4) 113 (40.9) 215 43.3
Yellow Fruits (mangoes,papaya..) 77 (35.2) 96 (34.8) 173 34.9
Other vegetables and fruits 88 (40.0) 127 (46.4) 215 43.5
Organ meats 10 (4.6) 18 (6.5) 28 5.7
Chicken 29 (13.3) 31 (11.5) 60 12.3
Other meats 11 (5.0) 15 (5.5) 26 5.3
Eggs 96 (43.8) 122 (44.5) 218 44.2
Fish and sea foods 95(43.4) 138 (50.4) 233 47.3
Pulses 73 (33.3) 83 (30.2) 156 31.6
Coconuts and nuts 130 (50.9) 146 (53.3) 276 56
Milk 150 (69.4) 162 (59.8) 312 64.1
Milk products 35 (16.4) 40 (14.8) 75 15.5
Oil 71 (32.6) 76 (27.6) 147 29.8
Sugary food 193 (88.1) 240 (87.3) 433 87.7
Spices (condiment) 133 (61.0) 133 (48.9) 266 54.3
Total 219(44.2) 277(55.8) 498 -

ASSESSMENT OF NUTRITIONAL STATUS AND ASSOCIATED FACTORS IN NORTHERN PROVINCE
25
Children in the age group 6-59 months were given a wide range of food items withinthe preceding 24 hours and the percentage given each food item varied widely. Infantformula was given to nearly half the children (Table 7)
The commonest items given were water and grains. A low percentage of children (<10 percent) received organ meats and other meats and chicken was given to only 12percent. Sugary foods have been given to, 88 percent of children. Fish and sea foodshave been given to nearly half the children with approximately a similar percentagehaving been given vegetables and fruits.
There was no consistent pattern related to the types of foods given to childrenbetween the resident households and resettled households. Some of the differencesobserved include: higher percentage of original households giving vitamin A richfoods, cereals, infant formula, and milk with a lower percentages being given fish andorgan meats.
4.4.4. Use of health services
As shown in Table 8, 90 percent of the children had a CHDR, 94 percent hadreceived Measles /MR immunization, 60 percent had received Vitamin A megadosewith a lower percentage (54 percent) having received de worming tablets.
The percentages of children who had a CHDR, received immunization and receivedvitamin A megadose were higher among the resident families with the reverse beingobserved in the receipt of deworming tablets.
Table 8: Percentage distribution of children who received Vitamin A mega dosesupplement, de-worming tablets, vaccination and availability of CHDR, by household
status
% Within Household Status
Resident ResettledTotal Northern Province
2010 DataNo %
Availability of CHDR
Yes 226 (91.9) 270 (87.7) 496 89.5 96.2
No 20 (8.1) 38 (12.3) 58 10.5 3.8
Vitamin A megadose(children over 1 year)
Yes 148 (61.4) 179 (59.1) 327 60.1 61.8
No 93 (38.6) 124 (40.9) 217 39.9 38.2
De-worming tablets(children over 1 year)
Yes 125 (51.9) 168 (55.4) 293 53.9 70.7
No 116 (48.1) 135 (44.6) 253 46.1 29.3
Measles/MRvaccination (childrenover 09 months)
Yes 191 (94.6) 239 (93.7) 430 94.1 97.4
No 11 (5.5) 16 (6.3) 27 5.9 2.6

ASSESSMENT OF NUTRITIONAL STATUS AND ASSOCIATED FACTORS IN NORTHERN PROVINCE
26
4.4.5. Environmental sanitation and hygienic practices
Information on the source of water, method of purification of drinking water, typeof latrine and information on some basic hygienic practices are presented in Table 9and 10.
In a majority ( 57 percent) of the households, the main source of drinking waterwas an unprotected well, with another 10 percent of households using water from aprotected/ common well with tube wells/boreholes being the source for 11 percent.Piped water within the household (10 percent) and water from a common tap werethe other sources. Households with piped water (both within and outside the house)and water from a protected well / tube well were higher among the residenthouseholds. The commonest source of water for washing and other purposes was aunprotected well (67 percent).
Approximately 23 percent of households did not use a method of treating drinkingwater. Among those who used such a method, the most common method used wasboiling (34 percent), with 24 percent of the households using chlorination andanother 19 percent, using filtration. The percentages of households using boiling asthe method of purification, was marginally higher among the resident households andfiltration as a method of treating water was higher among the resettled households.More that 80 percent of s of households consumed less than 15 minutes to accessa source of water.
In 14 percent of all households, there were no toilet facilities. This percentage wasmuch lower, 5 percent among the original households compared to 23 percentamong the resettled households. When available, the most common type of toiletsused was a flush toilet. The method of disposal of excreta of a child within thehousehold was also enquired into. Most households (54 percent) used the system offlushing the excreta using the available toilet while another 37 percent buried theexcreta, with the percentage using the method of flushing down the toilet beinghigher among the resident households.
Hygienic practices: s of more than 90 percent of all households indicated that theywash their hands with soap after using the toilet, this percentage being higher amongthe original households (93 percent) compared to 88 percent among the resettledhouseholds. The percentage of households where hand washing with soap waspracticed prior to eating was 70 percent with a higher percentage practicing thismethod among the resident household’s (74 percent) compared to 66 percentamong the resettled households.
‘Always washing hands before feeding the child’ was reported to be practicedin 68 percent of households, this percentage also being higher among the residenthouseholds.

ASSESSMENT OF NUTRITIONAL STATUS AND ASSOCIATED FACTORS IN NORTHERN PROVINCE
27
Table 9: Percentage of households according to source of water, method of purification, type oflatrine and basic hygienic practices by household status
Resident Resettled No %
Type of toilet facility used by household
Flush latrine / toilet with water 522 (92.2) 447 (71.6) 969 81.4
Traditional pit latrine / open pit 10 (1.8) 27 (4.3) 37 3.1
Communal latrine 8 (1.4) 6 (1.0) 14 1.2
No latrine (bush) 26 (4.6) 144 (23.1) 170 14.3
Childs excreta disposal methods
Flush latrine / toilet with water 124 (59.3) 125 (49.8) 249 54.1
Traditional pit latrine / open pit 4 (1.9) 7 (2.8) 11 2.4
Communal latrine 2 (1.0) 2 (0.8) 4 0.9
No latrine (buried) 68 (32.5) 103 (41.0)171
37.2
No latrine (bush) 9 (4.3) 11 (4.4) 20 4.3
Flush latrine & buried 2 (1.0) 2 (1.2) 5 1.1
Hands washed after toilet use
Always with soap 525 (92.8) 549 (88.0) 1074 90.3
Sometimes with soap 33 (5.8) 56 (9.0) 89 7.5
Without soap 3 (0.5) 8 (1.3) 11 0.9
Do not wash 2 (0.4) 6 (1.0) 8 0.7
No answer 3 (0.5) 5 (0.8) 8 0.7
Hands washed before eating
Always with soap 419 (73.9) 412 (66.0) 831 69.8
Sometimes with soap 94 (16.6) 110 (17.6) 204 17.1
Without soap 43 (7.6) 90 (14.4) 133 11.2
Do not wash 8 (1.4) 7 (1.1) 15 1.3
No answer 3 (0.5) 5 (0.8) 8 0.7
Hands washed before feeding child
Always with soap 151 (72.2) 161 (64.1) 312 67.8
Sometimes with soap 32 (15.3) 35 (13.9) 67 14.6
Without soap 6 (2.9) 34 (13.5) 40 8.7
Do not wash 5 (2.4) 6 (2.4) 11 2.4
No answer 15 (7.2) 15 (6.0) 30 6.5

ASSESSMENT OF NUTRITIONAL STATUS AND ASSOCIATED FACTORS IN NORTHERN PROVINCE
28
Table 10: Sources of Drinking Water

ASSESSMENT OF NUTRITIONAL STATUS AND ASSOCIATED FACTORS IN NORTHERN PROVINCE
29
4.4.6. Participation in Nutrition Rehabilitation Programmes
Information on the nutrition rehabilitation programmes included both provision of foodsupplements on a routine basis and provision of therapeutic supplements. Information on theclinic visits of the participants and the assessment of nutritional status was also available inthis assessment.
Of all children who had global acute malnutrition on the day of survey (n=97), 82percent were enrolled in supplementary feeding programmes, this proportion beingcomparable between the children from resident and resettled households (Table 11).The commonest food supplement provided was Thriposha, provided to 83 percentof the participants and Corn Soy Blend (CSB) given to 33 percent of those enrolledin a feeding programme. This is appropriate given that these fortified blended foodsare used to treat the more prevalent type of acute malnutrition, i.e. moderate acutemalnutrition. Ready to Use Therapeutic Food (BP 100 or Plumpy Nut) was providedto almost all (n=7) cases of Severe Acute Malnutrition but not shown in the tabledue to very small number.
Table 11: Participation in nutrition supplementation programme

ASSESSMENT OF NUTRITIONAL STATUS AND ASSOCIATED FACTORS IN NORTHERN PROVINCE
30
As shown in table 12, half the number of children had attended the clinic within theprevious three weeks. Assessment of the nutritional status of the children at the lastvisit indicated that there were 13 percent who were MAM, 6 percent SAM and 12percent underweight. The prevalence rates for each of the nutritional statusindicators were marginally higher among children in the resettled families.
Table 12: Clinic visits and the nutritional status
% by household status
Resident ResettledNorthernProvince
No %
Date of last visit
< 1 week 35 (16.8) 26 (9.9) 61 13.0
1-3 weeks 75 (36.1) 97 (37.0) 172 36.6
1 month 40 (19.2) 30 (11.5) 70 14.9
> 1 month 58 (27.9) 109 (41.6) 167 35.5
No information (ADD)
Outcome of nutritional status at thelast visit*
Normal 148 (72.2) 171 (65.8) 319 68.6
MAM 23 (11.2) 39 (15.0) 62 13.3
SAM 12 (5.9) 16 (6.2) 28 6.0
Underweight 22 (10.7) 34 (13.1) 56 12.0
*Only those who have had a last visit to the clinic
4.4.7. Comparison of data on nutritional status in 2010 with data of thepresent study
A direct comparison between the findings of the nutritional assessment reported inthe present study with those of the reported data in the study carried out in 2010 isnot possible due to several reasons, some of them being due to methodologicaldifferences between the two surveys.
The group included in the 2010 assessment were children from households thatwere resettled and the present study included two main groups, children fromresettled households and those from original households. For programmaticpurposes, it is more relevant to compare the nutritional status indicators among the2010 sample and the indicators observed among the children in the resettledpopulation included in the present study. These data are presented in Table 13.

ASSESSMENT OF NUTRITIONAL STATUS AND ASSOCIATED FACTORS IN NORTHERN PROVINCE
31
Table 13: Comparison of data on nutritional status in 2010 with data of the present study
Source ofinformation
% stunted(95% CI)
% wasted(95% CI)
% underweight(95% CI)
Severe Moderate Severe Moderate Severe Moderate
Present survey(Resettled People)
3.8(1.0 – 6.0)
19.8(15.0 – 25.0)
0.3(0 – 1)
19.8(15 – 25)
6.8(4 – 7)
22.9(18 – 28)
Data from 2010survey
5.3(4.2 – 6.4)
15.1(13.4 – 16.8)
1.5(.9 – 2)
13.5(11.9 – 15.1)
6.6(5.4 – 7.8)
17.9(16.1 – 19.7)
The prevalence of severe stunting and wasting has shown a decline between 2010survey and the present study, though it is not statistically significant. Thecomparatively higher prevalence observed in moderate stunting and wasting could beinterpreted as a “shift” between the two categories of undernutrition, with animprovement in the severity of under nutrtion.

ASSESSMENT
32
ASSOCIATED FACTORS
5.1. Primary income sources
Daily labour was the most common income generation activity, this being the mainof income among 37 percent of the population.agricultural and non agricultural work. This percentage wasin the resettled households compared to the resident householdsmain sources of income were farming, salaried employment, fishing and skilled labour (Figure12).
Those in the resettled households were more likely to be daily wage labourers or farmers,and less likely to be a salaried employee or a skilled worker, compared to the originalresidents.
Figure 12: Primary inco
ASSESSMENT OF NUTRITIONAL STATUS AND ASSOCIATED FACTORS
CHAPTER 5
ASSOCIATED FACTORS
Primary income sources
Daily labour was the most common income generation activity, this being the maing 37 percent of the population. This group of activities included both
agricultural and non agricultural work. This percentage was higher (41 percnet) among thosein the resettled households compared to the resident households (33 percent). The othermain sources of income were farming, salaried employment, fishing and skilled labour (Figure
Those in the resettled households were more likely to be daily wage labourers or farmers,and less likely to be a salaried employee or a skilled worker, compared to the original
: Primary income sources, Northern Province
IN NORTHERN PROVINCE
Daily labour was the most common income generation activity, this being the main sourceThis group of activities included both
higher (41 percnet) among thosepercent). The other
main sources of income were farming, salaried employment, fishing and skilled labour (Figure
Those in the resettled households were more likely to be daily wage labourers or farmers,and less likely to be a salaried employee or a skilled worker, compared to the original

ASSESSMENT OF NUTRITIONAL STATUS
5.2 Agriculture
Northern Province belongs to the dry agro climatic zone. Dry zone agriculture is mainlydone under the two seasons ofMaha is typically rainfed andNorthern Province of Sri Lanka. The proportion of farmers who cultivated in the 2011season and those who expected to participate in the 2011/12Figure 13.
Less than half of farmers cultivated the 2011participated to a lesser extent inhouseholds (38 and 46 percentexpected to participate in the 2011/12was higher among resettled farmers compared to therespectively).
Figure 13: Proportion of farmers who cultivated in yala 2011 and those who plan to cultivate
Approximately one in five households were engaged in home gardening, as illustrated inFigure 14, with only minor differences between the resettled and theNearly one thinrd of households (31 percent) were unable to engage in home gardencultivation, despite an interest in doing so. The proportion of such households was higheramong the resettled population compared to the resident populatrespectively).
38%
0%
20%
40%
60%
80%
Resettled
Prop
orti
onof
farm
ers
Cultivated crops in yala 2011
AND ASSOCIATED FACTORS IN NORTHERN PROVINCE
Northern Province belongs to the dry agro climatic zone. Dry zone agriculture is mainlydone under the two seasons of yala (April to September) and maha (October to March).
is typically rainfed and yala typically irrigated. Paddy is the main seasonal crop in theNorthern Province of Sri Lanka. The proportion of farmers who cultivated in the 2011season and those who expected to participate in the 2011/12 maha season is shown in
than half of farmers cultivated the 2011 yala. Resettled farmers appear to haveparticipated to a lesser extent in yala cultivation compared to those in orginal residenthouseholds (38 and 46 percent yala participation respectively). A majority of farmersexpected to participate in the 2011/12 maha season. The expected degree of participation
settled farmers compared to the resident farmers (81 and 74 percent
tion of farmers who cultivated in yala 2011 and those who plan to cultivatein maha 2011/12
Approximately one in five households were engaged in home gardening, as illustrated in, with only minor differences between the resettled and the
Nearly one thinrd of households (31 percent) were unable to engage in home gardencultivation, despite an interest in doing so. The proportion of such households was higheramong the resettled population compared to the resident populat ion (40 and 21 percent
46%41%
81%74%
Resettled Original residents Northern Province
Cultivated crops in yala 2011 Expectation to cultivate in maha 2011 / 2012
33
Northern Province belongs to the dry agro climatic zone. Dry zone agriculture is mainly(October to March).
typically irrigated. Paddy is the main seasonal crop in theNorthern Province of Sri Lanka. The proportion of farmers who cultivated in the 2011 yala
season is shown in
. Resettled farmers appear to havecultivation compared to those in orginal resident
participation respectively). A majority of farmers areseason. The expected degree of participation
resident farmers (81 and 74 percent
tion of farmers who cultivated in yala 2011 and those who plan to cultivate
Approximately one in five households were engaged in home gardening, as illustrated in, with only minor differences between the resettled and the original residents.
Nearly one thinrd of households (31 percent) were unable to engage in home gardencultivation, despite an interest in doing so. The proportion of such households was higher
ion (40 and 21 percent
79%
Northern Province
Expectation to cultivate in maha 2011 / 2012

ASSESSMENT
34
Figure 14
As shown in Figure 15, households engaged in highland crop cultivation was 2among resettled households andparticipation among resettled households, this group still had a larger proportion thanthose in resident households who were interested in engaging in highland cuwere unable to do so (41 and 2
Figure 15
About one fifth of the total sample cultivated paddy, with a greater representationthe resettled households (28 percent) compared to the resident group (16 percent). Thefindings, illustrated in Figure 16, show that approximately one third of the surveyedpopulation (30 percent) would like to cultivate paddy but are unable to do so
36%
40%
24%
0%
20%
40%
60%
80%
100%
Resettled
Prop
orti
onof
hous
ehol
ds
No, has no interest in farming
36%
40%
24%
0%
10%
20%
30%
40%
50%
60%
70%
80%
90%
100%
Resettled
Prop
orti
onof
hous
ehol
ds
ASSESSMENT OF NUTRITIONAL STATUS AND ASSOCIATED FACTORS
14: Households involved in home gardening
As shown in Figure 15, households engaged in highland crop cultivation was 2among resettled households and 21 percent among resident population Despite higherparticipation among resettled households, this group still had a larger proportion thanthose in resident households who were interested in engaging in highland cuwere unable to do so (41 and 21 percent respectively).
15: Households cultivating the highland crops
About one fifth of the total sample cultivated paddy, with a greater representationthe resettled households (28 percent) compared to the resident group (16 percent). Thefindings, illustrated in Figure 16, show that approximately one third of the surveyedpopulation (30 percent) would like to cultivate paddy but are unable to do so
59%47%
21%31%
21% 22%
Resettled Original residents Northern Province
No, has no interest in farming Would like to cultivate, but can not Yes, does cultivate
59%47%
21%31%
21% 22%
Original residents Northern Province
Yes, does cultivate
Would like to cultivate, but cannot
No, has no interest in farming
IN NORTHERN PROVINCE
As shown in Figure 15, households engaged in highland crop cultivation was 2 4 percent1 percent among resident population Despite higher
participation among resettled households, this group still had a larger proportion thanthose in resident households who were interested in engaging in highland cu ltivation but
About one fifth of the total sample cultivated paddy, with a greater representation amongthe resettled households (28 percent) compared to the resident group (16 percent). Thefindings, illustrated in Figure 16, show that approximately one third of the surveyedpopulation (30 percent) would like to cultivate paddy but are unable to do so .
47%
31%
22%
Northern Province
Yes, does cultivate
Would like to cultivate, but cannot
No, has no interest in farming

ASSESSMENT OF NUTRITIONAL STATUS
Three important differences between resettled households and original residents in thepattern of cultivation can been seen in paddy cultivation, as well as for home gardening andhighland crop cultivation (described above):
More resettled household
Many more resettled households compared to original residents would like to startcultivating but are unable to do so
Far fewer resettled households have no interest in cultivation compared to originalresidents.
Figure
As shown in Figure 17, approximately half the surveyed population owns some kind oflivestock. Ownership of livestock is marginally higher among resettled households (51percent) compared to the resident group (46 percent). A large proportion of the population(47 percent) reported that they have previously owned livestock but does not any at thetime of the survey.
35%
37%
28%
0%
20%
40%
60%
80%
100%
Resettled
Prop
orti
onof
hous
ehol
ds
No, has no interest in farming
51%
46%
3%
0%
10%
20%
30%
40%
50%
60%
70%
80%
90%
100%
Resettled
AND ASSOCIATED FACTORS IN NORTHERN PROVINCE
Three important differences between resettled households and original residents in thepattern of cultivation can been seen in paddy cultivation, as well as for home gardening andhighland crop cultivation (described above):
More resettled household cultivate compared to original residents
Many more resettled households compared to original residents would like to startcultivating but are unable to do so
Far fewer resettled households have no interest in cultivation compared to original
igure 16: Households cultivating paddy
As shown in Figure 17, approximately half the surveyed population owns some kind oflivestock. Ownership of livestock is marginally higher among resettled households (51
rcent) compared to the resident group (46 percent). A large proportion of the population(47 percent) reported that they have previously owned livestock but does not any at the
Figure 17: Ownership of livestock
62%48%
22%
30%
16% 22%
Resettled Original residents Northern Province
No, has no interest in farming Would like to cultivate, but can not Yes, does cultivate
46% 48%
48% 47%
6% 5%
Original residents Northern Province
Never owned
No
Yes
35
Three important differences between resettled households and original residents in thepattern of cultivation can been seen in paddy cultivation, as well as for home gardening and
cultivate compared to original residents
Many more resettled households compared to original residents would like to start
Far fewer resettled households have no interest in cultivation compared to original
As shown in Figure 17, approximately half the surveyed population owns some kind oflivestock. Ownership of livestock is marginally higher among resettled households (51
rcent) compared to the resident group (46 percent). A large proportion of the population(47 percent) reported that they have previously owned livestock but does not any at the
48%
30%
22%
Northern Province
Yes, does cultivate
Never owned
No
Yes

ASSESSMENT
36
5.3 Assets
Ownership of jewellery is an important indicator of household prosperity, particularly in theNorthern Province where the collection of jewellery is a common form of saving.shows the percentage of households that owned of jewellery in three most recentassessments: October 2010, April 2011 and October 2011. The proportion of householdsowning jewellery has more than doubled from April 2011 to October 2011 among both theresettled population and the residents.
Figure 18: Percentage of households that reported ownership of Jewellery
5.4 Expenditure
Figure 19 shows the average proportion of expenditure spent on food as available from thethree studies: in October 2010 among the resettled population, in April 2011 amongresettled and resident population groups and in the present study (October 2011). Tproportion of expenditure spent on food was 71 percent in October 2010 and declined to62 percent in subsequent surveys, supporting the observation made in the section onincome and poverty, confirming the improved income .
Figure 19: Average proportion of expenditure on food
47%
25%
0%
20%
40%
60%
80%
Resettled Resettled
Prop
orti
onof
hous
ehol
ds
71%
0%
20%
40%
60%
80%
Resettled
Oct 2010
Prop
ortio
nof
tota
lex
pend
itur
es
ASSESSMENT OF NUTRITIONAL STATUS AND ASSOCIATED FACTORS
Ownership of jewellery is an important indicator of household prosperity, particularly in theNorthern Province where the collection of jewellery is a common form of saving.
households that owned of jewellery in three most recentassessments: October 2010, April 2011 and October 2011. The proportion of householdsowning jewellery has more than doubled from April 2011 to October 2011 among both the
residents.
: Percentage of households that reported ownership of Jewellery
Figure 19 shows the average proportion of expenditure spent on food as available from thethree studies: in October 2010 among the resettled population, in April 2011 amongresettled and resident population groups and in the present study (October 2011). Tproportion of expenditure spent on food was 71 percent in October 2010 and declined to62 percent in subsequent surveys, supporting the observation made in the section onincome and poverty, confirming the improved income .
: Average proportion of expenditure on food
25%32%
30%
68%
82%
Resettled Originalresidents
NorthernProvince
Resettled Originalresidents
63% 62% 62% 62% 62%
Resettled Originalresidents
NorthernProvince
Resettled Originalresidents
Apr-11 Oct 2011
IN NORTHERN PROVINCE
Ownership of jewellery is an important indicator of household prosperity, particularly in theNorthern Province where the collection of jewellery is a common form of saving. Figure 18
households that owned of jewellery in three most recentassessments: October 2010, April 2011 and October 2011. The proportion of householdsowning jewellery has more than doubled from April 2011 to October 2011 among both the
: Percentage of households that reported ownership of Jewellery
Figure 19 shows the average proportion of expenditure spent on food as available from thethree studies: in October 2010 among the resettled population, in April 2011 amongresettled and resident population groups and in the present study (October 2011). T heproportion of expenditure spent on food was 71 percent in October 2010 and declined to62 percent in subsequent surveys, supporting the observation made in the section on
75%
Originalresidents
NorthernProvince
62%
Originalresidents
NorthernProvince
Oct 2011

ASSESSMENT OF NUTRITIONAL STATUS AND ASSOCIATED FACTORS IN NORTHERN PROVINCE
37
Figure 20 presents the distribution of households by the the average percentage of incomespent on food by population groups, as given in the three studies. It is seen that theproportion of households that spend less than half of their expenditures on food,households that spent 50-65 percent on food, and households that spent more than 65percent their expenditures on food were comparable among the resettled and original,residents. The proportion of the sample spending more than 65 percent of theirexpenditure on food accounted for half of the population in the Northern Province.However, this proportion of households had decreased over time, when compared withthe results of the survey carried out in October 2010.
Figure 20: Distribution of households by the the average percentage of income spent on food bypopulation groups
11%21% 25% 24% 25% 26% 26%
17%
28% 25% 26% 26% 22% 24%
72%52% 49% 50% 49% 52% 50%
0%
20%
40%
60%
80%
100%
Resettled Resettled Originalresidents
NorthernProvince
Resettled Originalresidents
NorthernProvince
Oct-10 Apr-11 Oct-11
Prop
ortio
nof
Hou
seho
lds
<50% 50-65% >65%

ASSESSMENT
38
5.5 Coping strategies
The Coping Strategies Indexrelatively simple and quick to use, straightforward to understand, and correlates well withmore complexe measures of food securityseries of questions as to howconsumption. This information was used to develop a simple numeric score
Figure 21 shows the reduction in the coping strategy index in three different studies.Following a similar pattern as income, coping deteriorated2011, and improved from April 2011 to October 2011. The severity of coping of resettledhouseholds is much worse than for residents.
Figure 21: Mean hous
3 The coping Strategies Index; Field methods manual, version 24 The coping strategy index was calculated by following the guidelines of the above
5.6
0
1
2
3
4
5
6
7
8
9
Resettled NorthernProvince
Oct-10
Mea
nho
useh
old
CSIs
core
ASSESSMENT OF NUTRITIONAL STATUS AND ASSOCIATED FACTORS
The Coping Strategies Index (CSI) is an indicator of household food security that isrelatively simple and quick to use, straightforward to understand, and correlates well withmore complexe measures of food security3. Using the CSI, responses were obtained to
to how households manage to cope with a shortfall in food forconsumption. This information was used to develop a simple numeric score
shows the reduction in the coping strategy index in three different studies.as income, coping deteriorated from October 2010 to April
2011, and improved from April 2011 to October 2011. The severity of coping of resettledhouseholds is much worse than for residents.
: Mean household reduced coping strategy index
The coping Strategies Index; Field methods manual, version 2The coping strategy index was calculated by following the guidelines of the above -mentioned manual.
8.1
5.6
6.6
4.3
2.4
NorthernProvince
Resettled NorthernProvince
Resettled Originalresidents
Northern
Apr-11 Oct-11
IN NORTHERN PROVINCE
(CSI) is an indicator of household food security that isrelatively simple and quick to use, straightforward to understand, and correlates well with
. Using the CSI, responses were obtained to ahouseholds manage to cope with a shortfall in food for
consumption. This information was used to develop a simple numeric score 4.
shows the reduction in the coping strategy index in three different studies.from October 2010 to April
2011, and improved from April 2011 to October 2011. The severity of coping of resettled
ehold reduced coping strategy index
3.4
NorthernProvince

ASSESSMENT OF NUTRITIONAL STATUS AND ASSOCIATED FACTORS IN NORTHERN PROVINCE
39
5.6 Humanitarian Assistance
Supplementary feeding, school meals and Samurdhi were the most common forms of foodassistance received by households, as shown in Figure 22. More of the resettled householdswere beneficiaries of the general food distribution (28 percent) compared to the residentgroup (6 percent). Other forms of food assistance included food for work and food aidprovided by NGOs and communities.
Figure 22: Type of food assistance received by households
In addition to food assistance, other forms of humanitarian assistance were also provided,the most common being cash for work and Samurdhi vouchers, having been received by 16percent and 15 percent of households respectively. Several other forms of assistance werealso provided that included provision of construction material and agricultural assistance(Figure 23). Other forms of humanitarian assistance was also provided, the common sourcesbeing ‘cash for work’and Samurdhi vouchers.
28%
6%
18%
9%
2%
6%
29%
33%31%
6%
2%4%
16%
39%
26%
39%38% 38%
0%
10%
20%
30%
40%
Resettled Original residents Northern Province
Prop
orti
onof
hous
ehol
ds
General FoodDistributionNGO/Community basicfood aidSchool meal
Food for work / training
Samurdhi food ration
Supplementary feeding :CSB, Triposha

ASSESSMENT
40
Figure
Of the total sample, 34 percent had received humanitarian assistance within the precedingthree months, with this percentage being higher among the resettled households (36percent) compared to 31 percent among the resident households
Figure 24: Proportion of households who received food assistance during last three months
20%
6%
4%
9%
11%
9%
11%
4%
0%
5%
10%
15%
20%
25%
Resettled
Prop
ortio
nof
hous
ehol
ds
36%
0%
10%
20%
30%
Resettled
Prop
ortio
nof
hous
ehol
ds
ASSESSMENT OF NUTRITIONAL STATUS AND ASSOCIATED FACTORS
Figure 23: Other froms of assistance
Of the total sample, 34 percent had received humanitarian assistance within the precedingthree months, with this percentage being higher among the resettled households (36percent) compared to 31 percent among the resident households (Figure
: Proportion of households who received food assistance during last three months
12%
16%
2%
4%
2%3%
21%
15%
3%
7%
1%
5%
2%
7%
1%
3%
Original residents Northern Province
Cash for work
Government cash grant
Other cash assistance
Samurdhi vouchers
Other vouchers
Constructionmaterial, building
Agricultural assistance
Other livelihood assistance
31%33.80%
Resettled Original residents Total
IN NORTHERN PROVINCE
Of the total sample, 34 percent had received humanitarian assistance within the precedingthree months, with this percentage being higher among the resettled households (36
24).
: Proportion of households who received food assistance during last three months
Cash for work
Government cash grant
Other cash assistance
Samurdhi vouchers
Other vouchers
Constructionmaterial, building
Agricultural assistance
Other livelihood assistance
33.80%
Total

ASSESSMENT OF NUTRITIONAL STATUS AND ASSOCIATED FACTORS IN NORTHERN PROVINCE
41
CHAPTER 6
CONCLUSIONS
This study shows that overall prevalence of global acute malnutrition (GAM) inNorthern Province is 18.3%, of which 17% is moderate acute malnutrition (MAM)and 1.3% is severe acute malnutrition (SAM). However, it varies between Resident(GAM- 16.3%, SAM 2.6% & MAM 13.7%) and Resettled (GAM 20.1%, SAM 0.3% andMAM- 19.8%) population.
When compared with the nutrition assessment done during October 2010, thisstudy observes an increase in the prevalenc of GAM (from 16.5% in 2010 to 20.1%)although there was an improvement in SAM (from 1.5% to 0.3%) but an increase inMAM (from 13.5% to 19.8%) in the resettled population. Similar findings wereobserved for stunting (decline from 25.7% in 2010 to 23.6% in 2011) andunderweight (from 31.1% in 2010 to 23.2% in 2011) as well. When compared withNational Nutrition and Food Security Assessment done in 2010, this study shows ahigher prevalence of Stunting (22.8% vs. 19.2%), Wasting (18.3% vs. 11.7%) andUnderweight (29.5% vs. 21.6%) in Norther province.
Prevalence of low birth weight (LBW) of 16.7 percent did not significantly differ fromthe national level data but varied between Resident (17.8%) vs. Resettled (14.5%)population and boys (13.6%) vs. girls (18.5%) in the Northern Province.
Overall percentage of children with fever with cough/cold and diarrhoea were 14.7percent and 4.6 percent respectively.
Among children older than 6 months, 93 percent were given solid, semi solid orsoft food for consumption and about one third were bottle fed.
A wide range of food items had been given to children aged between 6 – 59 months.The pattern showed a relatively high consumption of pulses, milk and milk products,dark green vegetables and sugary foods with low consumption of meat products.
Vitamin A supplementation coverage among the children between 12-59 monthswere 60% while deworming was 54%. This was 60% and 70% respectively in October2010.
About 8 percent of all household had access to piped water for drinking which was10% among residents and 6.3% among resettled population. Around 81% householdshad access to flush latrine which was 92% among residents and 72% among resettledpopulation (it was 35% in 2010). However around 14% households were defecatingin the open/bushes which was 4.6% among residents and 23% among resettledpopulation. Similar variation between resident and settled population were foundregarding washing hands after defecation, before eating and before feeding child.
About 83 percent of the households had a child or mother enrolled insupplementary feeding programme and around 82 percent of them were receiving

ASSESSMENT OF NUTRITIONAL STATUS AND ASSOCIATED FACTORS IN NORTHERN PROVINCE
42
Triposha (69% among residents and 93% among resettled) and around 33% receivingCSB.
The main source of income for majority of the population (37% for overall, 33%among residents and 41% among resettled) is from wages earned as a daily/causallaborer (both agricultural and non-agricultural).
Average expenditure on food in norhter province is 62% with no variation betweenresidents and resettled population in this study although this was 71% duringOctober 2010.
Nearly a third of the sample had received some humanitarian assistance within thepreceding three months of the assessment. Around 18% were benefitted fromgeneral food distribution (6% in reseident vs. 28% in resettled), 26% receivedSamurdi food ration (39% in residents vs. 16% in resettled) and 38% receivedsupplementary feeding (no difference between reseidnets and resettled).

ASSESSMENT OF NUTRITIONAL STATUS AND ASSOCIATED FACTORS IN NORTHERN PROVINCE
43
RECOMMENDATIONS
Continued and enhanced support for the identification and treatment of moderateand severe acute malnutrition should be considered as priority interventions forchildren in resident and resettled population.
Integrate non-nutrition interventions like treatment of other illnesses, improvementin hyegenic and sanitary practices are importance to bring a further change innutrition status of children.
A review of the programs to prevent and treat acute malnutrition is called for todetermine their effectiveness and to make recommendations for furtherimprovements and long-term sustainable changes.
Monitoring of the nutritional status at population level needs to be done on a regularbasis in all households using routine data in order to assess the ‘direction of change’in the nutritional status and for taking prompt action.
Continued livelihood development programs and safety net initiatives need to beconsidered for ensuring food security in the hosueholds with poor nutrition status.
Encourage efforts to improve the income generation activites and shift the relianceon unqualified daily wage labor to more skilled labour and self employment.Additional surveys and monitoring of the food security and nutrition situation in theNorthern Province with representative sample at district level is necessary tounderstand the situation of food insecurity and geographical differences within theNorthern Province.
A detailed study of a cohort of children that includes assessment of nutritionalstatus as well as all relevant determinants including food security need to beconsidered as a part of the surveillance of child health status at the community level.
Indepth analysis of the current data and collection of qualitative information isrequired to understand the changes in nutrition status between resident andresettled population and betwee October 2010 and 2011.

ASSESSMENT OF NUTRITIONAL STATUS AND ASSOCIATED FACTORS IN NORTHERN PROVINCE
44
BIBILIOGRAPHY
1. Performance and Progress Report, Ministry of Resettlement, Sri Lanka, 2010.
2. Situation Report, Ministry of Resettlement, September 2011.
3. Demographic and Health Survey 2006-2007, Department of Census and Statistics,
Ministry of Health Care and Nutrition, Colombo, Sri Lanka, April 2009.
4. MRI/UNICEF/WFP 2011. Assessment of nutritional status and food security levels
among resettled families, October-November 2010.
5. MRI/UNCIEF/WFP 2010. Nutrition and Food Security Assessment in Sri Lanka
2010.

ASSESSMENT OF NUTRITIONAL STATUS AND ASSOCIATED FACTORS IN NORTHERN PROVINCE
45
ANNEXURE 1: LIST OF CLUSTERS - NORTHERNPROVINCE
Cluster No. DS Division GN Division GN Code
38 Vadamarachchi East Uduththurai J/430
54 Kandawlai Elephantpass KN/46
55 Kandawlai Punnaineeravi KN/57
56 Poonagary Gowtharimunai KN/68
57 Pachchipalaipalli Lyakkachchi KN/79
53 Karachchi Sivanagar KN/35
49 Karachchi Anaivilunthankulam KN/02
50 Karachchi Uthayanagar West KN/13
51 Karachchi Maruthanagar KN/24
52 Karachchi Kaneshapuram KN/29
71 Puthukkudiyiruppu Vallipuram 45
72 Puthukkudiyiruppu Puthukkudiyiruppu West 41
33 Vadamarachchi South West Karaveddy West J/363
34 Vadamarachchi South West Karanavai North West J/361
35 Vadamarachchi South West Karaveddy North J/364
36 Vadamarachchi South West Thunnalai J/372
39 Vadamarachchi North Alvai West J/396
40 Vadamarachchi North Point Pedro J/401
41 Vadamarachchi North Thumpalai J/404
27 Valikamam East Kalviyankadu J/259
28 Valikamam East Neervely West J/270
29 Valikamam East Pathaimeny J/281
30 Thenmarachchi Kaithady South East J/292
31 Thenmarachchi Chavakachcheri North J/303
32 Thenmarachchi Madduvil East J/314
37 Vadamarachchi South West Alvai South J/379
20 Valakamam South Uduvil South West J/182
21 Valakamam South Thavady East J/193
22 Valakamam South Eralalai East J/204
23 Valakamam South Alaveddy North J/215
24 Valakamam South Naguleswaram J/226
25 Valikamam North Palaiveemankamam South J/237
26 Valakamam South Mayiliddythurai South J/248

ASSESSMENT OF NUTRITIONAL STATUS AND ASSOCIATED FACTORS IN NORTHERN PROVINCE
46
14 Nallur Thirunelvely Centre North J/114
15 Nallur Kokkuvil West J/125
16 Valikamam South West Navali South J/136
17 Valikamam South West Piranpattu J/147
18 Valakamam West Araly West J/160
19 Valakamam West Moolai J/171
1 Island South Velanai South J/17
2 Island South Pungudutivu Centre North J/28
3 Island South Mandaitivu West J/08
4 Island South Mankumpan J/11
5 Island South Eluvaitivu J/39
6 Island South Seruvil J/59
9 Jaffna Nedunkulam J/61
10 Jaffna Small Bazzer J/72
11 Jaffna Koddady J/83
12 Nallur Ariyalalai Centre West J/32
13 Nallur Kandarmadam North East J/103
58 Pachchipalaipalli Pallai Town KN/87
7 Delft Delft East J/06
8 Delft Delft West J/01

ASSESSMENT OF NUTRITIONAL STATUS AND ASSOCIATED FACTORS IN NORTHERN PROVINCE
47
ANNEXURE 2: BASIC HOUSEHOLD INFORMATIONBY DISTRICT (TABLES 1 – 14)
Table 01. Distribution of households by household size, and status by district.
Characteristic
% Within District
Jaff
na
Kill
ino
chc
hi
Ma
nnar
Va
vun
iya
Mul
lati
ve
All Districts
No %
Household headship
Male 503(83.0)
117(78.0)
77(74.8)
130(77.4)
106(72.1)
933 79.5
Female103
(17.2)33
(22.0)26
(25.2)38
(22.6)41
(27.9) 241 20.5
No. of members
1-3 189(30.8)
66(44.0)
25(24.0)
60(34.1)
50(33.8)
390 32.7
4-6 348(56.7)
72(48.0)
66(63.5)
92(52.3)
89(60.1)
667 56.0
≥777
(12.5)12
(8.0)13
(12.5)24
(13.6)9
(6.1) 135 11.3
No. of children under fiveyears
1185
(81.1)43
(79.6)38
(73.1)46
(82.1)49
(75.4) 361 79.3
240
(17.5)10
(18.5)14
(26.9)9
(16.1)14
(21.5)87 19.1
≥3 3(1.3)
1(1.9)
0(0.0)
1(1.8)
2(3.1)
07 1.5
Current household status
Original residence457
(74.4)0
(0.0)37
(35.6)73
(41.5)0
(0.0) 567 47.6
Resettled129
(21.0)146
(97.3)64
(61.5)89
(50.6)134
(90.5)562 47.1
Relocated 16(2.6)
3(2.0)
1(1.0)
12(6.8)
14(9.5)
46 3.9
Other12
(2.0)1
(0.7)2
(1.9)2
(1.1)0
(0.0) 17 1.4
Host displaced member
Yes 4(0.7)
0(0.0)
0(0.0)
0(0.0)
4(2.7)
08 0.7
No610
(99.3)150
(100.0)104
(100.0)176
(100.0)144
(97.3) 1184 99.3
Relocated with host families
Yes7
(1.1)1
(0.7)1
(1.0)10
(5.7)17
(11.5)36 3.0
No 607(98.9)
149(99.3)
103(99.0)
166(94.3)
131(88.5)
1156 97.0
Mother’s years of schooling
No schooling0
(0.0)1
(1.9)1
(2.1)1
(1.9)1
(1.5) 04 0.9
1-516
(7.4)4
(7.7)2
(4.2)3
(5.7)7
(10.8)32 7.4

ASSESSMENT OF NUTRITIONAL STATUS AND ASSOCIATED FACTORS IN NORTHERN PROVINCE
48
6-10 74(34.1)
23(44.2)
19(39.6)
26(49.1)
26(40.0)
168 38.6
11-13115
(53.0)23
(44.2)24
(50.0)22
(41.5)31
(47.7) 215 49.4
Higher12
(5.5)1
(1.9)2
(4.2)1
(1.9)0
(0.0)16 3.7
Status of mother
Alive and together223
(98.7)55
(100.0)50
(98.0)53
(96.4)63
(94.0) 444 97.8
Alive and separated0
(0.0)0
(0.0)0
(0.0)2
(3.6)4
(6.0) 06 1.3
Dead 3(1.3)
0(0.0)
1(2.0)
0(0.0)
0(0.0)
04 0.9
Other0
(0.0)0
(0.0)0
(0.0)0
(0.0)0
(0.0) 0 0.0
Status of father
Alive and together206
(91.2)(94.5) (92.3) (89.1) (87.9) 413 91.0
Alive and separated (8.0) (5.5) (5.8) (3.6) (12.1) 34 7.5
Dead (0.9) 0(0.0)
(1.9) (3.6) 0(0.0)
05 1.1
Other0
(0.0)0
(0.0)0
(0.0) (3.6)0
(0.0) 02 0.4
Family members born sinceApril 14th, 2011
Male 15(57.7)
02(33.3)
05(50.0)
05(50.0)
03(75.0)
30 53.6
Female11
(42.3)04
(16.7)05
(50.0)05
(50.0)01
(25.0)26 46.4
Family memebrs since April 14th
2011
1-23
(100.0)3
(100.0)0
(0.0)2
(100.0)2
(100.0) 10100.
0
3-40
(0.0)0
(0.0)0
(0.0)0
(0.0)0
(0.0)0 0.0
≥5 0(0.0)
0(0.0)
0(0.0)
0(0.0)
0(0.0)
0 0.0
Family members arrived sinceApril 14th, 2011
1-24
(100.0)3
(100.0)1
(100.0)4
(100.0)1
(100.0)13
100.0
3-4 0(0.0)
0(0.0)
0(0.0)
0(0.0)
0(0.0)
0 0.0
≥50
(0.0)0
(0.0)0
(0.0)0
(0.0)0
(0.0) 0 0.0
Family members died sinceApril 14th, 2011
1-2 2(100.0)
0(0.0)
1(100.0)
1(100.0)
0(0.0)
04 100.0
3-40
(0.0)0
(0.0)0
(0.0)0
(0.0)0
(0.0) 0 0.0
≥50
(0.0)0
(0.0)0
(0.0)0
(0.0)0
(0.0)0 0.0

ASSESSMENT OF NUTRITIONAL STATUS AND ASSOCIATED FACTORS IN NORTHERN PROVINCE
49
Table 02. Household Characteristics
Type of housing
% Within District
Jaff
na
Kill
ino
chc
hi
Ma
nnar
Va
vun
iya
Mul
lati
ve
All Districts
No %
Walls exterior
Cadjan 40(6.5)
30(20.0)
14(13.5)
14(8.0)
21(16.3)
119 10.1
Mud32
(5.2)10
(6.7)2
(1.9)31
(17.6)6
(4.7)81 6.9
Wood3
(0.5)1
(0.7)0
(0.0)0
(0.0)3
(2.3)07 0.6
Hard boards14
(2.3)6
(4.0)3
(2.9)1
(0.6)3
(2.3) 27 2.3
Brick/Cabok16
(2.6)1
(0.7)0
(0.0)36
(20.5)7
(5.4) 60 5.1
Cement blocks 489(79.6)
79(52.7)
80(76.9)
86(48.9)
60(46.5)
794 67.7
Other 20(3.3)
23(15.3)
5(4.8)
8(4.5)
29(22.5)
85 7.2
Roof
Cadjan/Thatch37
(6.0)20
(13.3)16
(15.4)31
(17.6)25
(19.4) 129 11.0
Corrugated sheet/Tarsheet
79(12.9)
56(37.3)
13(12.5)
60(34.1)
40(31.0) 248 21.1
Asbestos143
(23.3)26
(17.3)8
(7.7)19
(10.8)6
(4.7) 202 17.2
Tile 338(55.0)
39(26.0)
64(61.5)
65(36.9)
42(32.6)
548 46.7
Concrete 5(0.8)
1(0.7)
1(1.0)
0(0.0)
1(0.8)
08 0.7
Other12
(2.0)8
(5.3)2
(1.9)1
(0.6)15
(11.6)38 3.2
Floor
Mud/Cow dung 60(9.8)
42(28.0)
12(11.5)
39(22.2)
42(32.6)
195 16.6
Wood 8(1.3)
1(0.7)
1(1.0)
3(1.7)
3(2.3)
16 1.4
Cement 537(87.5)
104(69.3)
89(85.6)
134(76.1)
80(62.0)
944 80.5
Tile/Terrazzo8
(1.3)1
(0.7)2
(1.9)0
(0.0)1
(0.8)12 1.0
Other1
(0.2)2
(1.3)0
(0.0)0
(0.0)3
(2.3)06 0.5
Total 52.3 12.8 8.9 15.0 11.0 1173 100.0

ASSESSMENT OF NUTRITIONAL STATUS AND ASSOCIATED FACTORS IN NORTHERN PROVINCE
50
Table 04. Distribution of age of children by district
Characteristic
% Within District
Jaff
na
Kil
lino
chch
i
Ma
nnar
Vav
uniy
a
Mu
llati
veAll Districts
No %
Age of child(months)
0-5.927
(9.8)06
(9.1)10
(15.2)11
(16.4)03
(3.6)57 10.2
6.0-11.9 20(07.3)
02(03.0)
01(1.5)
06(9.0)
08(9.6)
37 6.6
12.0-23.960
(21.8)18
(27.3)12
(18.2)11
(16.4)15
(18.1) 116 20.8
24.0-35.963
(22.9)15
(22.7)14
(21.2)10
(14.9)11
(13.3)113 20.3
36.0-47.9 49(17.8)
10(15.2)
10(15.2)
18(26.9)
19(22.9)
106 19.0
48.0-59.956
(20.4)15
(22.7)19
(28.8)11
(16.4)27
(22.5) 128 23.0
Total 275(49.4)
66(11.8)
66(11.8)
67(12.0)
83(14.9)
557 100.0

ASSESSMENT OF NUTRITIONAL STATUS AND ASSOCIATED FACTORS IN NORTHERN PROVINCE
51
Table 05. Nutritional status of children under five
Background Characteristic
Height-for- age (%)
Stunting
Weight-for-height (%)
Wasting
Weight-for-age(%)
Underweight
Total No ofChildren
Sev
ere
(<-3
SD
)
Mo
dera
te(-
3–
-2.0
1)
Mil
dan
dN
orm
al
(>-2
SD
)
Sev
ere
(<-3
SD
)
Mo
dera
te(-
3–
-2.0
1)
Mil
dan
dN
orm
al
(>-2
SD
)
Sev
ere
(<-3
SD
)
Mo
dera
te(-
3–
-2.0
1)
Mil
dan
dN
orm
al
(>-2
SD
)
No %
Age of child (months)
<61
(1.9)4
(7.5)48
(90.6)0
(0.0)5
(9.4)48
(90.6)1
(1.9)6
(11.3)46
(86.8) 53 10.0
6-111
(2.9)4
(11.4)30
(85.7)0
(0.0)3
(8.6)32
(91.4)1
(2.9)3
(8.6)31
(88.6)35 6.6
12-236
(5.2)16
(13.9)93
(80.9)1
(0.9)17
(14.8)97
(84.3)7
(6.1)23
(20.0)85
(73.9) 115 21.7
24-357
(6.7)23
(21.9)75
(71.4)2
(1.9)22
(21.0)81
(77.1)8
(7.6)29
(27.6)68
(64.8)105 19.8
36-47 6(5.8)
27(26.2)
70(68.0)
3(2.9)
18(17.5)
82(79.6)
9(8.7)
32(31.1)
62(60.2)
103 19.5
48-594
(3.4)22
(18.6)92
(78.0)1
(0.8)25
(21.2)92
(78.0)11
(9.3)26
(22.0)81
(68.6) 118 22.3
HH status
Original 14(6.0)
37(15.8)
185(78.2)
6(2.6)
32(13.7)
196(83.8)
17(7.3)
52(22.2)
165(70.5)
234 44.4
Resettled11
(3.8)58
(19.8)224
(76.5)1
(0.3)58
(19.8)234
(79.9)20
(6.8)67
(22.9)206
(70.3) 293 55.6
Districts
Jaffna 15(5.7)
42(16.0)
206(78.3)
6(2.3)
42(16.0)
215(81.7)
22(8.4)
56(21.3)
185(70.3)
263 49.3
Killinochchi2
(3.1)7
(10.9)55
(85.9)0
(0.0)16
(25.0)48
(75.0)4
(6.3)11
(17.2)49
(76.6) 64 12.0
Mannar3
(5.0)13
(21.7)44
(73.3)0
(0.0)10
(16.7)50
(83.3)4
(6.7)16
(26.7)40
(66.7)60 11.3
Vavuniya 3(4.5)
12(17.9)
52(77.6)
1(1.5)
9(13,4)
57(85.1)
3(4.5)
19(28.4)
45(67.2)
67 12.6
Mullative2
(2.5)22
(27.8)55
(69.6)0
(0.0)13
(16.5)66
(83.5)4
(5.1)17
(21.5)58
(73.4) 79 14.8
Sex of child
Male 11(4.2)
47(18.1)
201(77.6)
3(1.2)
48(18.5)
208(80.3)
16(6.2)
52(20.1)
191(73.7)
259 49.0
Female14
(5.2)49
(18.1)207
(76.7)4
(1.5)42
(15.6)224
(83.0)21
(7.8)67
(24.8)82
(67.4) 270 51.0
Mother’s education*
No schooling 0(0.0)
1(16.7)
5(83.3)
0(0.0)
1(16.7)
5(83.3)
0(0.0)
4(66.7)
2(33.3)
6 1.2
Primary3
(7.7)5
(12.8)31
(79.5)0
(0.0)6
(15.4)33
(84.6)2
(5.1)11
(28.2)26
(66.7) 39 7.8
Secondary17
(4.8)68
(19.4)266
(75.8)6
(1.7)68
(19.4)277
(78.9)30
(8.5)81
(23.1)240
(68.4)351 70.2
Passed O’ Level 2(2.3)
14(15.9)
72(81.8)
1(1.1)
12(13.6)
75(85.2)
2(2.3)
16(18.2)
70(79.5)
88 17.6
Higher2
(12.5)1
(6.3)13
(81.3)0
(0.0)0
(0.0)16
(100.0)2
(12.5)1
(6.3)13
(81.3) 16 3.2
Overall 25(4.7)
96(18.1)
408(77.1)
7(1.3)
90(17.0)
432(81.7)
37(0.7)
119(22.5)
373(70.5)
529 100.0

ASSESSMENT OF NUTRITIONAL STATUS AND ASSOCIATED FACTORS IN NORTHERN PROVINCE
52
Table 06. Percentage of under-5 children who reported symptoms of respiratory illness and diarrhea during previous2 weeks, by background characteristics
Background characteristicTotal number of
children
% Reported illness Treatment for diarrhea
Cough or coldwith fever
Diarrhea Jeevanee
Age of child (months)
0-5.9 5706
(10.5)02
(3.5)0
(0.0)
6-11.9 3705
(13.5)02
(5.4)02
(100.0)
12-23.9 11617
(14.7)10
(8.6)07
(70.0)
24-35.9 11320
(17.7)07
(6.2)03
(42.9)
36-47.9 10619
(17.9)03
(2.8)01
(33.3)
48-59.9 128 14(11.0)
01(0.8)
0(0.0)
HH Status
Original 246 38(15.5)
13(5.3)
08(61.5)
Resettled 209 43(13.9)
12(3.9)
05(41.7)
Sex of child
Male 275 48(17.5)
16(5.8)
07(43.8)
Female 282 33(11.7)
09(3.2)
06(66.7)
District
Jaffna 275 52(18.9)
60(5.8)
09(56.2)
Killinochchi 66 08(12.1)
0(0.0)
0(0.0)
Mannar 66 06(9.2)
5(7.6)
02(40.0)
Vavuniya 6703
(4.5)1
(1.5)0
(0.0)
Mullative 8312
(14.5)3
(3.6)02
(66.7)
Mother’s education
No schooling 060
(0.0)0
(0.0)0
(0.0)
Primary 425
(11.9)01
(2.4)1
(100.0)
Secondary 36551
(14.0)16
(4.4)07
(43.8)
Passed O’ Level 9116
(17.8)5
(5.5)04
(80.0)
Higher 18 03(16.7)
2(11.1)
1(50.0)
Overall 522 75(14.4)
24(4.6)
13(52.0)

ASSESSMENT OF NUTRITIONAL STATUS AND ASSOCIATED FACTORS IN NORTHERN PROVINCE
53
Table 07. Percentage distribution of children who received Vitamin A mega dose supplement, de-worming tablets,vaccination and availability of CHDR, by background characteristics
Characteristic
% Within Districts
Jaff
na
Kill
ino
chch
i
Man
nar
Va
vuni
ya
Mul
lati
ve
Total Northern Province
No. %
Availability of CHDR
Yes253
(92.0)55
(84.6)61
(92.4)61
(91.0)68
(81.9) 498 89.6
No 22(8.0)
10(15.4)
5(7.6)
6(9.0)
15(18.1)
58 10.4
Vitamin A megadose(Children over 1 year)
Yes151
(66.2)37
(63.8)33
(61.1)35
(70.0)41
(56.9)297 64.3
No77
(33.8)21
(36.2)21
(38.9)15
(30.0)31
(43.1)165 35.7
De-worming tablets(Children over 1 year)
Yes143
(62.7)40
(69.0)29
(53.7)25
(50.0)51
(70.8) 288 62.3
No 85(37.3)
18(31.0)
25(46.3)
25(50.0)
21(29.2)
174 37.7
Measles/MR vaccination(Children over 09months)
Yes 214(97.3)
53(96.4)
48(88.9)
48(92.3)
69(94.5)
432 95.2
No 6(2.7)
2(3.6)
6(11.1)
4(7.7)
4(5.5)
22 4.8

ASSESSMENT OF NUTRITIONAL STATUS AND ASSOCIATED FACTORS IN NORTHERN PROVINCE
54
Table 08. Prevalence of low birth weight, and mean birth weight among children born in the5 years preceding the survey, by background characteristics
Background CharacteristicBirth Weight
< 2500g (%) ≥2500g (%) Total (%) Mean (kg)
Age of child (months)
0-5.9 07(12.7)
48(87.3)
55(10.2)
2.94
6-11.904
(11.1)32
(88.9)36
(6.7) 2.94
12-23.912
(10.4)103
(89.6)115
(21.3)2.98
24-35.9 25(22.9)
84(77.1)
109(20.2)
2.94
36-47.923
(22.8)78
(77.2)101
(18.7) 2.86
48-59.916
(13.0)107
(87.0)123
(22.8)2.93
HH Status
Original 43(17.8)
198(82.2)
241(44.9)
2.91
Resettled43
(14.5)253
(85.5)296
(55.1) 2.92
Sex of child
Male 36(13.6)
228(86.4)
264(49.0)
2.97
Female51
(18.5)224
(81.5)275
(51.0) 2.86
District
Jaffna51
(18.9)219
(48.5)270
(50.1)2.89
Killinochchi 06(9.5)
57(90.5)
63(11.7)
2.94
Mannar03
(4.8)60
(95.2)63
(11.7) 3.02
Vavuniya17
(26.6)47
(73.4)64
(11.9)2.85
Mullative 10(12.7)
69(87.3)
79(14.7)
2.93
Mother’s education
No schooling02
(33.3)04
(66.7)06
(1.2) 2.69
Primary 06(15.8)
32(84.2)
38(7.5)
2.84
Secondary62
(17.5)293
(82.5)355
(69.9) 2.91
Passed O’ Level11
(12.1)80
(87.9)91
(17.9)2.97
Higher 03(16.7)
15(83.3)
18(3.5)
3.03
Total84
(16.5)424
(83.5)508
(100.0) 2.92

ASSESSMENT OF NUTRITIONAL STATUS AND ASSOCIATED FACTORS IN NORTHERN PROVINCE
55
Table 09. Infant and young child feeding practices by background characteristics (children more than 6 months)
Characteristic
% Within Districts
Jaff
na
Kill
ino
chch
i
Man
nar
Vav
uni
ya
Mul
lati
ve
Total NorthernProvince
No %
Solid, semi-solid or softfood consumption
Yes 236(95.2)
55(93.2)
52(92.9)
49(87.5)
69(87.3)
461 92.6
No4
(1.6)2
(3.4)3
(5.4)6
(10.7)9
(11.4) 24 4.8
Don’t know8
(3.2)2
(3.4)1
(1.8)1
(1.8)1
(1.3) 13 2.6
Solid, semi-solid, or softfood other than liquidconsumption
1-238
(16.1)11
(20.8)19
(38.0)15
(30.6)35
(50.7)118 25.8
3-4 172(72.9)
37(69.8)
23(46.0)
31(63.3)
28(40.6)
291 63.7
5-626
(11.0)5
(9.4)8
(16.0)2
(4.1)5
(7.2) 46 10.1
Don’t know0
(0.0)0
(0.0)0
(0.0)1
(2.0)1
(1.4)02 0.4
Using a bottle with anipple
Yes84
(33.9)17
(28.8)14
(25.0)15
(26.8)33
(41.8) 163 32.7
No164
(66.1)42
(71.2)42
(75.0)40
(71.4)45
(57.0)333 66.9
Don’t know 0(0.0)
0(0.0)
0(0.0)
1(1.8)
1(1.3)
02 0.4
Table 10. Currently breastfed by age groups
Age groupCurrently breastfed Total
Yes No Don’t Know No. %
0-5.956
(98.2)1
(1.8)0
(0.0) 57 10.3
6.0-11.9 34(91.9)
3(8.1)
0(0.0)
37 6.7
12.0-23.9 88(75.9)
28(24.1)
0(0.0)
116 20.9
24.0-35.952
(46.4)60
(53.6)0
(0.0)112 20.1
36.0-47.915
(14.2)91
(85.8)0
(0.0)106 19.1
48.0-59.94
(3.1)123
(96.1)1
(0.8) 128 23.0
Total 44.8 55.0 0.2 556 100.0

ASSESSMENT OF NUTRITIONAL STATUS AND ASSOCIATED FACTORS IN NORTHERN PROVINCE
56
Table 11. Percentage of children aged 6-59 months, who were given food items belonging to thedifferent food groups,on the day preceding the interview, by background characteristics
Characteristic
% Within Districts
Jaff
na
Kill
ino
chch
i
Man
nar
Vav
uni
ya
Mu
llati
ve Total Northern Province
No %
Water 243(98.0)
60(100.0)
56(100.0)
55(98.2)
79(98.8)
493 98.6
Infant formula 126(51.9)
27(45.0)
28(50.0)
22(40.0)
48(61.5)
251 51.0
Medicinal water 56(22.7)
5(8.5)
11(20.4)
9(16.1)
15(19.0)
96 19.4
Sugar/Glucose water 69(27.8)
22(37.3)
16(28.6)
17(30.4)
29(37.2)
153 30.8
Jeevanee 4(1.6)
0(0.0)
2(3.8)
0(0.0)
3(3.8)
9 1.8
Cereals 106(43.3)
23(39.0)
19(33.9)
17(30.4)
28(35.4)
193 39.0
Rice cunjee47
(19.2)10
(16.9)10
(18.2)5
(9.4)22
(28.2)94 19.2
Grains230
(92.7)57
(96.6)53
(94.6)53
(94.6)69
(87.3)462 92.8
Vitamin A rich food101
(40.7)17
(28.8)28
(50.0)23
(41.0)27
(34.2)196
39.4
Roots and yams142
(57.3)32
(54.2)34
(60.7)24
(42.9)47
(59.5)279 56.0
Dark greenvegetables
113(45.6)
23(39.0)
22(39.3)
23(41.1)
34(43.0) 215 43.2
Yellow Fruits(mangoes, papaya)
85(34.3)
23(39.0)
25(45.5)
15(26.8)
25(31.6)
173 34.8
Other vegetables andfruits
96(38.7)
30(50.8)
24(42.9)
22(40.7)
43(54.4)
215 43.3
Organ meats7
(2.8)3
(5.1)10
(17.9)3
(5.5)5
(6.3)28 5.6
Chicken24
(9.8)7
(12.1)17
(30.9)6
(10.9)6
(7.9)60 12.3
Other meats7
(2.8)4
(6.9)4
(7.1)4
(7.1)7
(8.9)26 5.2
Eggs90
(36.4)32
(54.2)31
(56.4)23
(41.1)42
(53.2)218 44.0
Fish and sea foods90
(36.3)40
(67.8)39
(69.6)25
(45.5)40
(50.6)234 47.1
Pulses85
(34.3)15
(25.4)18
(32.1)15
(26.8)24
(30.4) 157 31.5
Coconuts and nuts147
(59.5)30
(50.8)31
(55.4)29
(51.8)42
(53.2) 279 56.1
Milk157
(64.3)36
(62.1)41
(74.5)32
(59.3)46
(58.2) 312 63.7
Milk products34
(13.8)7
(12.3)9
(16.4)11
(20.8)14
(18.2) 75 15.4
Oil79
(32.0)20
(33.9)18
(32.1)8
(14.3)25
(31.6) 150 30.2
Sugary food221
(89.1)55
(93.2)48
(85.7)45
(80.4)68
(86.1) 437 87.8
Spices (condiment)154
(62.6)35
(59.3)23
(41.1)22
(40.7)34
(43.0) 268 54.3
Total248
(49.8)59
(11.9)56
(11.3)56
(11.2)79
(15.9) 498 100.0

ASSESSMENT OF NUTRITIONAL STATUS AND ASSOCIATED FACTORS IN NORTHERN PROVINCE
57
Table 12. Nutrition Rehabilitation Programme
Characteristic
% Within District
Jaffn
a
Kill
ino
chch
i
Man
nar
Vav
uni
ya
Mu
llati
ve All Districts
No %
Enrolled infeedingprogramme
Yes211
(85.4)55
(91.7)40
(72.7)37
(66.1)54
(67.5)397 79.7
No36
(14.6)5
(8.3)15
(27.3)19
(33.9)26
(32.5) 142 25.7
Type of feedingprogramme* **
Thriposha181
(85.8)46
(86.6)35
(87.5)32
(86.5)52
(96.3) 346 87.2
CSB114
(54.0)38
(69.1)20
(50.0)17
(45.9)28
(51.9)217
54.7
BP100 16(7.6)
3(5.5)
1(2.5)
2(5.4)
4(7.4)
26 6.5
Plumpynut2
(0.9)3
(5.5)0
(0.0)0
(0.0)1
(1.9) 6 1.5
HEB10
(4.7)0
(0.0)1
(2.5)0
(0.0)3
(5.6)14 3.5
MMN32
(15.2)10
(18.2)0
(0.0)
7(18.9)
15(27.8)
64 16.1
*Only thoseenrolled in NRPwere selected** Multipleresponse question
Date of last visit
< 1 week 33(13.9)
2(3.6)
7(13.7)
9(21.2)
11(19.2)
62 13.1
1-3 weeks97
(39.5)29
(51.8)7
(13.7)10
(22.2)30
(39.0) 173 36.5
1 month49
(20.0)5
(8.9)8
(15.7)0
(0.0)9
(11.7)71 15.0
> 1 month 66(26.9)
20(35.7)
29(56.9)
26(57.8)
27(35.1)
168 35.4
Outcome ofnutritional statusof last visit*
Normal 131(63.6)
34(66.7)
31(83.8)
24(70.6)
34(66.7)
254 67.0
MAM32
(15.5)4
(7.8)2
(5.4)4
(11.8)10
(19.6) 52 13.7
SAM12
(5.8)5
(9.8)0
(0.0)2
(5.9)6
(11.8)25 6.6
Underweight 31(15.0)
8(15.7)
4(10.8)
4(11.8)
1(2.0)
48 12.7
*Only those whohave had a last visitto the clinic

ASSESSMENT OF NUTRITIONAL STATUS AND ASSOCIATED FACTORS IN NORTHERN PROVINCE
58
Table 13. Nutrition Rehabilitation Programme
Characteristic
% Within District
Jaff
na
Kil
lino
chch
i
Ma
nnar
Vav
uniy
a
Mu
llati
ve
All Districts
No %
BP 100 / Plumpy nut
Yes 8(3.3)
2(3.6)
0(0.0)
0(0.0)
2(2.5)
12 2.5
No 236(96.7)
54(96.4)
52(100.0)
49(100.0)
77(97.5)
468 97.5
Received frequency
Fortnight0
(0.0)0
(0.0)0
(0.0)0
(0.0)1
(50.0)01 8.3
Monthly5
(62.5)0
(0.0)0
(0.0)0
(0.0)0
(0.0)05 41.7
Irregular0
(0.0)0
(0.0)0
(0.0)0
(0.0)1
(50.0) 01 8.3
Not known2
(25.0)2
(100.0)0
(0.0)0
(0.0)0
(0.0) 04 33.3
First visit1
(12.5)0
(0.0)0
(0.0)0
(0.0)0
(0.0) 01 8.3
CSB
Yes 82(33.6)
33(58.9)
12(23.1)
8(16.3)
26(32.9)
161 33.5
No 162(66.4)
23(41.1)
40(76.9)
41(83.7)
53(67.1)
319 66.5
Received frequency
Fortnight3
(3.7)3
(9.1)0
(0.0)0
(0.0)2
(7.7)8 5.0
Monthly74
(91.4)30
(90.9)8
(66.7)7
(87.5)20
(76.9)139 86.9
Irregular1
(1.2)0
(0.0)1
(8.3)0
(0.0)4
(15.4)6 3.8
Not known1
(1.2)0
(0.0)3
(25.0)0
(0.0)0
(0.0) 4 2.5
First visit2
(2.5)0
(0.0)0
(0.0)1
(12.5)0
(0.0) 3 1.9
Thriposha
Yes 200(81.6)
41(73.2)
39(75.0)
42(84.0)
70(88.6)
392 81.3
No 45(18.4)
15(26.8)
13(25.0)
8(16.0)
9(11.4)
90 18.7
Received frequency
Fortnight6
(3.0)8
(19.5)4
(10.3)4
(9.5)8
(11.6)30 7.7
Monthly193
(96.5)24
(58.5)34
(87.2)35
(83.3)53
(76.8)339 86.7
Irregular1
(0.5)5
(12.2)0
(0.0)3
(7.1)8
(11.6)17 4.3
Not known0
(0.0)3
(7.3)0
(0.0)0
(0.0)0
(0.0)3 0.8
First visit0
(0.0)1
(2.4)1
(2.6)0
(0.0)0
(0.0) 2 0.5

ASSESSMENT OF NUTRITIONAL STATUS AND ASSOCIATED FACTORS IN NORTHERN PROVINCE
59
High Energy Biscuit
Yes 10(4.1)
0(0.0)
1(1.9)
0(0.0)
3(3.8)
14 2.9
No 235(95.9)
56(100.0)
51(98.1)
50(100.0)
76(96.2)
468 97.1
Received frequency
Fortnight2
(20.0)0
(0.0)0
(0.0)0
(0.0)0
(0.0)2 14.3
Monthly6
(60.0)0
(0.0)0
(0.0)0
(0.0)1
(33.3)7 50.0
Irregular0
(0.0)0
(0.0)0
(0.0)0
(0.0)1
(33.3)1 7.1
Not known2
(20.0)0
(0.0)1
(100.0)0
(0.0)1
(33.3) 4 28.6
First visit0
(0.0)0
(0.0)0
(0.0)0
(0.0)0
(0.0) 0 0.0
MMN (Sprinkles)
Yes 44(17.8)
12(20.7)
0(0.0)
7(13.2)
22(27.8)
85 17.3
No 203(82.2)
46(79.3)
54(100.0)
46(86.8)
57(72.2)
406 82.7
Received frequency
Fortnight3
(6.8)1
(8.3)0
(0.0)0
(0.0)4
(18.2)8 9.4
Monthly31
(70.5)8
(66.7)0
(0.0)7
(100.0)10
(45.5)56 65.9
Irregular2
(4.5)1
(8.3)0
(0.0)0
(0.0)2
(9.1)5 5.9
Not known6
(13.6)2
(16.7)0
(0.0)0
(0.0)4
(18.2)12 14.1
First visit2
(4.5)0
(0.0)0
(0.0)0
(0.0)2
(9.1)4
4.7
Iron Syrup
Yes 48(19.4)
6(10.0)
4(7.3)
0(0.0)
9(11.3)
67 13.5
No 199(80.6)
54(90.0)
51(92.7)
56(100.0)
71(88.8)
431 86.5
Total 247(49.6)
60(12.0)
55(11.0)
56(11.2)
80(16.1)
498 100.0

ASSESSMENT OF NUTRITIONAL STATUS AND ASSOCIATED FACTORS IN NORTHERN PROVINCE
60
Table 14: Prevalence of under nutrition: stunting, wasting and underweight by districts
Comparison of the prevalence of stunting between districts show that prevalence values forMannar (28 percent, CI 0.17 – 0.40) and Mullaitivu (30 percent, CI 0.2 – 0.41) wererelatively high with the lowest prevalence being reported in Kilinochchi (14.1 percent, CI0.06 – 0.23) (Table 2). On the other hand, wasting was highest in Mullaitivu (25 percent, CI0.14 – 0.36) with the prevalence in other districts ranging from 14 – 19 percent (Table xx).Prevalence of underweight in Mannar, Vavuniya and Jaffna ranged from 30 to 33 percentwith the low value of 23 percent (CI 0.13 – 0.34) in Kilinochchi.
District
Height-for- age (%)
Stunting
Weight-for-height(%)
Wasting
Weight-for-age (%)
Underweight
Total Noof
Children
<-2SD CI ≥ -2SD CI <-2SD CI ≥ -
2SD CI < -2SD CI ≥ -
2SD CI No (%)
Jaffna 57(21.7)
(0.17-0.27)
206(78.3)
(0.73-0.83)
50(19.0)
(0.14-0.24)
213(81.0)
(0.76-0.86)
79(30.0)
(0.24-0.36)
184(70.0)
(0.64-0.76)
263(49.3)
Killinochchi 9(14.1)
(0.06-0.23)
55(85.9)
(0.77-0.94)
16(25.0)
(0.14-0.36)
48(75.0)
(0.64-0.86)
15(23.4)
(0.13-0.34)
49(76.6)
(0.66-0.87)
64(12.0)
Mannar 17(28.3)
(0.17-0.40)
43(71.7)
(0.60-0.83)
10(16.7)
(0.07-0.26)
50(83.3)
(0.74-0.93)
20(33.3)
(0.21-0.45)
40(66.7)
(0.55-0.79)
60(11.3)
Vavuniya 15(22.4)
(0.12-0.32)
52(77.6)
(0.68-0.88)
10(14.9)
(0.06-0.23)
57(85.1)
(0.77-0.94)
22(32.8)
(0.22-0.44)
45(67.2)
(0.56-0.78)
67(12.6)
Mullative 24(30.4)
(0.20-0.41)
55(69.6)
(0.59-0.80)
13(16.5)
(0.08-0.25)
66(83.5)
(0.75-0.92)
22(27.8)
(0.18-0.38)
57(72.2)
(0.62-0.82)
79(14.8)
Total 122(22.9)
(0.19-0.26)
411(77.1)
(0.74-0.81)
99(18.6)
(0.15-0.22)
434(81.4)
(0.78-0.85)
158(29.6)
(0.26-0.34)
375(70.4)
(0.66-0.74)
533(100.0)

ASSESSMENT OF NUTRITIONAL STATUS AND ASSOCIATED FACTORS IN NORTHERN PROVINCE
61
ANNEXURE 3: QUESTIONNAIRE
Nutrition Assessment–Northern Districts of Sri Lanka –2011Department of Nutrition MRI/UNICEF
COMPLETE BEFORE THE INTERVIEW COMPLETE UPON DATA ENTRY
Date : |__|__| / |__|__| / 2011Day Month
District Cluster Household
District code10 = Jaffna 11 = Killi 12=MN13=Vavu 14= Mulai
|__|__| / |__|__| / 2011DayMonth
InterviewerName :
................................................................................................................
SupervisorName:
.................................................................................................................
Name ofRespondent:
CompleteAddress :
...............................................................................................................
...............................................................................................................
Area/Location ID:(write originalname)
A. Province _NP_________________________
B. District _______________________________
C. MOH area _______________________________
D. PHM area _______________________________
E. GN Division _______________________________
F. Village _______________________________
G. Household Number ________________________________
COMPLETEAFTER THEINTERVIEWStatus ofInterview:
1= Complete |___| 2=Partially complete |___|3= Refused |___| 4= Not available |___| Cluster no.
Date:
tpUg;gk; njhptpj;jy;:cq;fsJ FLk;gj;jpd; Ngh~hf;F epiyiaAk; czitg;ghJfhj;Jg; gf;Ftg;gLj;JtijAk; gw;wpa xU Ma;it ehq;fs; elhj;Jfpd;Nwhk;. ehd;cq;fsJ FLk;gj;ijg; gw;wpa rpy Nfs;tpfisf; Nfl;f tpUk;Gfpd;Nwd;. 05taJf;Ff; Fiwe;j cq;fsJ Foe;ijfspd; epiwiaAk; msitAk; ehq;fs;mstpLNthk;. ,e;j Ma;T epiwT ngWtjw;F toikahf Vwf;Fiwa xUkzpj;jpahy fhyj;ijnaLf;Fk;. ,e;j Maptpd; NghJ ePq;fs; toq;Fk; VjhtJjfty;fs; gpw egh;fs; mwpahj tifapy; Kw;wpYk; ,uf~pakhfg; Ngzg;gLk;. ,JRa tpUg;g mbg;gilapyhd Ma;thFk;. ePq;fs; tpUk;gpdhy; ,jpy; VjhtnjhUNfs;tpf;F my;yJ rfy Nfs;tpfSf;Fk; gjpyspf;fhky; tplyhk;. vdpDk; cq;fsJfUj;Jf;fs; mtrpak; vd;gjhy; ePq;fs; ,jpy; gq;Fgw;WtP\h;fs; vd ek;Gfpd;Nwhk;.ePq;fs; vd;dplk; VjhtJ Nfs;tp Nfl;f Ntz;Lkh? ,g;nghOJ ehd; Nfs;tpiaMuk;gpf;fyhkh?
YES Mk;______ NO ,y;iy____

ASSESSMENT OF NUTRITIONAL STATUS AND ASSOCIATED FACTORS IN NORTHERN PROVINCE
62
1. Household Questionnaire FLk;gk; gw;wpa tpdhf;fSk; gjpy;fSk;
1.1How many persons live in this household?,e;jf;FLk;gj;jpy;
vj;jid egh;fs; trpf;fpd;whh;fs;?___ ___
1.2 Current household status jw;Nghija FLk;g epiy1=Original Residence cz;ikahd tjptplk; (not displaced,lk;ngauhj)2=Resettled kPsf;FbNawpa (back to own place nrhe;j,lj;jpw;F kPz;Lk; jpUk;gp te;j )3=Relocated kPs;FbNawpa/no host families mutizg;Gf;FLk;gq;fspy;yhj4=OtherVida___
1.3 What is the sex of household head? FLk;gj; jiythpd;ghy;epiy vd;d?1= Male Mz; 2= Female ngz;___
1.4 Do you host displaced members in your house?,lk;ngah;e;J mutizf;fg;gl;l FLk;g mq;fj;jtuh?1=yes 2=no___
1.5 Are you relocated with host families?mutizg;Gf; FLk;gq;fSld; kPs;FbNawpatuh?1=yes 2=no___
1.6
Are there any family members who were born since April 14th,2011? 2011 Vg;uy; khjk; 14 Mk; Kjy; gpwe;j FLk;gmq;fj;jth;fs; ,Uf;fpd;wduh?
1=yes 2=no___
1.7 If Yes Date of birth|___ ___||___ ___||___ ___ ___ ___| 1.8 Gender 1=Male 2=Female ___
1.9
How many family members who has left since April 14 th, 2011?2011 Vg;uy; khjk; 14 Mk; Kjy; gphpe;J nrd;w FLk;g mq;fj;jth;fs;vj;jid Ngh;?
0 = No If yes, exact number Mk; vdpy;> rhpahdvz;zpf;ifiaf; Fwpg;gpLq;fs;___
1.10
How many family members who has arrived since April 14th,2011? 2011 Vg;uy; khjk; 14 Mk; Kjy; te;J Nrh;e;j FLk;gmq;fj;jth;fs; vj;jid Ngh;? 0 = No If yes, exact number___
1.11Has there any member of the family that died since April 14th, 2011? 2011Vg;uy; 01 Mk; jpfjpf;Fg; gpd;dh; Fwpj;j FLk;gj;jpd; vtNuDnkhUmq;fj;jth; ,we;jpUe;jpuh?
0 = No If yes exact numberIf No, skip to section ,y;iynadpy;> gphpT 2,w;F efUq;fs;___
1.12
What was the cause of death? mth; ,we;jikf;fhd fhuznkd;d?(write separately if more than one death occurred xd;Wf;F Nkw;gl;lkuzk; rk;gtpj;jpUe;jhy; ntt;Ntwhff; Fwpg;gpLq;fs;)
------------------------------------_________________________
1.13
What was the date of death? mth; ,we;j jpfjp vd;d?(Separately according to sequence njhlh; xOq;fpy; ntt;Ntwhff;Fwpg;gpLq;fs;)
|___ ___||___ ___||___ ___ ___ ___|
|___ ___||___ ___||___ ___ ___ ___|
1.14
Age of the dead person? (Years, month and days), we;j eghpd; taJvd;dthftpUe;jJ? (tUlq;fs;> khjq;fs;> ehl;fs;)(separately if more than one)
|___ ___||___ ___||___ ___ ___ ___|
|___ ___||___ ___||___ ___ ___ ___|
2. Household Characteristics tPl;bd; mikg;G2.1 What is the type of present housing? (By
observation) (Mark mostly used material)jw;NghJ trpf;Fk; tPl;bd; mikg;Gvt;thwhdJ? (mtjhdpj;jd; %yk;)(mjpfstpy; gad;gLj;jg;gl;l%yg;nghUl;fisf; Fwpg;gpLq;fs;)
2.1.1 Walls exterior:Rth;fspd;ntspg;Gwk;:
1= Cadjan fpLF2= Mud fspkz;3= Wood gyif4= Hard boards fbd ml;ilfs;5= Brick/Cabok nrq;fw;fs;6= Cement blocks rPnke;Jf; fw;fs;7= Other (specify): Vidait (Fwpg;gpLq;fs;):___
2.1.2 Roof:$iu:1= Cadjan/Thatch fpLfpdhy;> itf;Nfhypdhy;Ntag;gl;lJ2= Corrugated sheet/Tar sheet jfuj;jpdhy; Ntag;gl;lJ3= Asbestos m];ng];l;Nlh jfLfspdhy; Ntag;gl;lJ4= Tile XLfspdhy; Ntag;gl;lJ5= Concrete fhd;f;wPl;L ,lg;gl;lJ6= Other (specify): Vidait (Fwpg;gpLq;fs;):___
2.1.3 Floor:tPl;L epyk;:
1= Mud/Cow dung fsp / khl;Lr; rhdk;2= Wood gyif

ASSESSMENT OF NUTRITIONAL STATUS AND ASSOCIATED FACTORS IN NORTHERN PROVINCE
63
3. Health StatusclyhNuhf;fpa epiy3.1Name of the child Foe;ijapd; ngah;: 3.2 Sex of the child 3.3 Date of birth
A1 Male 2 Female ___ |___ ___||___ ___||___ ___ ___ ___|
B1 Male 2 Female ___ |___ ___||___ ___||___ ___ ___ ___|
C1 Male 2 Female ___ |___ ___||___ ___||___ ___ ___ ___|
3.4
No. of under 5 children in the familyFLk;gj;jpy;05 taJf;Ff;Fiwe;j Foe;ijfspd;vz;zpf;if ___ If 0 skip to section 4
3.5Mother of the child Foe;ijapd; jha; 1= Alive and together capUld; xd;whf tho;fpd;whh;2= Alive and separated capUld;gphpe;J tho;fpd;whh; 3= Dead ,we;Js;shh; 4 =Other Vida___
3.6 Father of the childFoe;ijapd; je;ij 1= Alive and together 2= Alive and separated 3= Dead 4 =Other___
3.7
What is the highest education level of Mother/caretaker of the child? Foe;ijapd; jhapdJ / ghJfhtyhpdJ Mff;$bafy;tpj; jifik ahJ?0= No School 1 – 13=Write year of education 14= Diploma 15= Degree and above ___ ___
Ask the questions for children listed in 3.1 mention the nameand ask separately for each child and record 3.1 ,y; gl;by;gLj;jg;gl;l Foe;ijfSf;fhd Nfs;tpfisf; Nfl;L> ngah;Fwpg;gpl;Lf; Nfl;L xt;nthU Foe;ij njhlh;gpYk;fpilf;Fk; gjpy;fisj; jdpj;jdpahfg; gjpe;Jnfhs;Sq;fs;
Child A (Name) Child B (Name) Child C (Name)
3.8 Did the child have diarrhoea during the last 2 weeks?fle;j 02 thuq;fspy; Foe;ijf;F the;jpNgjp ,Ue;jjh?
1= Yes Mk;2= No,y;iy ___If No, skip to3.10
1= Yes Mk;2= No,y;iy ___If No, skip to3.10
1= YesMk;2= No,y;iy ___If No, skip to 3.10
3.9 Did you give Jeevanee to the child? ePq;fs; Foe;ijf;F‘[Ptdpia ’ mUe;jf; nfhLj;jPh;fsh?
1= Yes2= No___
1= Yes2= No___
1= Yes2= No___
3.10 Did the child have cough or colds with fever & difficulty inbreathing (ARI) during the last 2 weeks?fle;j 02 thuqÊfspy; Foe;ijf;F ,UkYld; my;yJjbkDld; fha;r;ry; (ARI),Ue;jjh?
1= Yes2= No___
1= Yes2= No___
1= Yes2= No___
3.11 Does your child have CHDR? (inspect and obtain informationfor QES)cq;fJ Foe;ijf;FCHDR,Uf;fpd;wjh? (Nrhjpj;JQES,w;fhf jfty;fisg; ngw;Wf;nfhs;Sq;fs;)
1= Yes2= No___
1= Yes2= No___
1= Yes2= No___
3.12 Did your child get a vitamin A megadose in last 6 months?(check with CHDR)fle;j 6 khjq;fspDs; vj;jid jlitfs; tpl;lkpd; ‘V’(nkfhNlh];) Foe;ijf;Ff; toq;fg;gl;lJ?
1= Yes2= No___
1= Yes2= No___
1= Yes2= No___
3.13 Did your child get a deworming tablet in last 6 months? fle;j 6khjq;fspDs; vj;jid jlitfs; ér;rp kUe;J tpy;iyfs;/ghdpfs; Foe;ijf;F toq;fg;gl;ld?
1= Yes2= No ___
1= Yes2= No ___
1= Yes2= No ___
3.14 How many doses of Polio vaccine given since birth? (Check withCHDR) chpa tajpy; NghypNah nrhl;L (Polio Drops)kUe;J Foe;ijf;F toq;fg;gl;ljh?
No. of doses___
No. of doses___
No. of doses
___
3.15 Did the child get following vaccines? (Check with CHDR)Measles at 9 months / MR vaccine at 12 monthsFoe;ijf;F rpd;dKj;Jf;F 09 khj;jpy; /(MR)Kf;$l;Ltf;rpd; 12 khj;jpYk; toq;fg;gl;ljh? (CHDRml;iliag; ghh;j;J cWjpg;gLj;jpw; nfhs;Sq;fs;)
1= Yes2= No 3=NA ___
1= Yes2= No 3=NA ___
1= Yes2= No 3=NA ___
3= Cement rPnke;J4= Tile/Terrazzo epyXLfs; / nluhN]hf;fs;5= Other (specify): Vidait (Fwpg;gpLq;fs;):___

ASSESSMENT OF NUTRITIONAL STATUS AND ASSOCIATED FACTORS IN NORTHERN PROVINCE
64
4. IYCF Practices nrad;Kiwfs;
Child A (Name) Child B (Name) Child C (Name)
4.1 Was This child breastfed yesterday during the day or at night?New;W gfy; Neuj;jpy; my;yJ ,uT Neuj;jpy; ,e;jf;Foe;ijf;F jha;g; ghY}l;lg;gl;ljh?
1= Yes2= No8= Don’t Know___
1= Yes2= No8= Don’t Know___
1= Yes2= No8= Don’t Know___
4.2 Yesterday during the day or night, did He/She drink/eat any food group items listed below?New;W ,uT Neuj;jpy; my;yJ gfy;Neuj;jpy; Foe;ij fPNo gl;bay;gLj;jg;gl;l czT ghd tiffspy; Vjhtnjhd;iw rhg;gpl;ljh/mUe;jpajh?
No. Questions and Filters tpdhf;fSk;gjpy;fSk;
Child A (Name) Child B (Name) Child C (Name)
A Water ePh; 1=Yes2 = No 8=DK___
1=Yes 2 = No 8 DK___
1=Yes 2 = No 8 DK___
B Infant formula Foe;ijg; ghy; 1=Yes 2 = No 8 DK___
1=Yes 2 = No 8 DK___
1=Yes 2 = No 8 DK___
C Medicinal water kUe;Jg; ghdk; 1=Yes 2 = No 8 DK___
1=Yes 2 = No 8 DK___
1=Yes 2 = No 8 DK___
D SugarrPdp/Glucose water f;SNfh]; ePh; 1=Yes 2 = No 8 DK___
1=Yes 2 = No 8 DK___
1=Yes 2 = No 8 DK___
E Jeevanee[Ptdp 1=Yes 2 = No 8 DK___
1=Yes 2 = No 8 DK___
1=Yes 2 = No 8 DK___
F Cereals etjhdpaq;fs;(Nestum,Cerilac,Samposa, Thriposa)
1=Yes 2 = No 8 DK___
1=Yes 2 = No 8 DK___
1=Yes 2 = No 8 DK___
G Rice cunjee mhprpf; fQ;rp 1=Yes 2 = No 8 DK___
1=Yes 2 = No 8 DK___
1=Yes 2 = No 8 DK___
H Rice, Bread, rotti, pittu, dosai or otherfoods made from grains? NrhW ghz;>cnuhl;b> gpl;L> Njhir my;yJjhdpaq;fspypUe;J jahhpf;fg;gl;lVida czT tifs;
1=Yes 2 = No 8 DK___
1=Yes 2 = No 8 DK___
1=Yes 2 = No 8 DK___
I Pumpkin, Carrots or sweet potatoes thatare yellow or orange inside?cl;ghfj;jpy; kQ;ry; my;yJ MuQ;Repwq;fs; fhzg;gLk; tl;lf;fha;>ful;Lf;fpoq;F my;yJ tj;jhisf;fpoq;F
1=Yes 2 = No 8 DK___
1=Yes 2 = No 8 DK___
1=Yes 2 = No 8 DK___
J White potatoes, white yams, manioc,cassava, or any other foods made fromroots?ntz;zpw cUisf;fpoq;F> ntz;zpwf;fpoq;Ffs;> kunts;spf;fpoq;F> frhthmy;yJ Nth; tiffspypUe;J
1=Yes 2 = No 8 DK___
1=Yes 2 = No 8 DK___
1=Yes 2 = No 8 DK___
K Any dark green leafy vegetables such as kankun, etc? fq;Fq; Kjypad Nghd;w fUk;gr;ir epwkhd VjhtJ fPiufs;VjhtJ fUk;gr;irahd ,iy tifkuf;fwpfs;
1=Yes 2 = No 8 DK___
1=Yes 2 = No 8 DK___
1=Yes 2 = No 8 DK___
L Ripe mangoes or ripe papayas?fdpe;j khk;goq;fs; my;yJ fdpe;jgg;gahh;];fs;
1=Yes 2 = No 8 DK___
1=Yes 2 = No 8 DK___
1=Yes 2 = No 8 DK___
M Any other fruits or vegetables?VjhtJ gpw goq;fs; my;yJ fPiutiffs;
1=Yes 2 = No 8 DK___
1=Yes 2 = No 8 DK___
1=Yes 2 = No 8 DK___
N Liver, kidney, heart or other organ meats?<uy;> rpWePufr; rij> ,Ujag; ghfk;my;yJ Vida cWg;G ,iwr;rpfs;
1=Yes 2 = No 8 DK___
1=Yes 2 = No 8 DK___
1=Yes 2 = No 8 DK___
O Any chicken? VjhtJNfhop ,iwr;rp 1=Yes 2 = No 8 DK___
1=Yes 2 = No 8 DK___
1=Yes 2 = No 8 DK___
P Any meat such as beefs, pork, lamb, goat orduck?khl;biwr;rp> gd;wpapiwr;rp> nrk;kwpMl;biwr;rp> Ml;biwr;rp my;yJ thj;J,iwr;rp Nghd;wVjhtJ ,iwr;rpfs;
1=Yes 2 = No 8 DK___
1=Yes 2 = No 8 DK___
1=Yes 2 = No 8 DK___

ASSESSMENT OF NUTRITIONAL STATUS AND ASSOCIATED FACTORS IN NORTHERN PROVINCE
65
Q Eggs? Kl;ilfs; 1=Yes 2 = No 8 DK___
1=Yes 2 = No 8 DK___
1=Yes 2 = No 8 DK___
R Fresh or dried fish, shellfish, canned fish orseafood?gr;ir my;yJ cyh;e;j kPd;> tpyhq;FkPd;> jfuj;jpyilf;fg;gl;l kPd; my;yJflYzTfs;
1=Yes 2 = No 8 DK___
1=Yes 2 = No 8 DK___
1=Yes 2 = No 8 DK___
S Any foods made from cowpea, green gram,black gram or lentils?ft;gp> ghrpg;gaW> cOe;J my;yJgUg;G tiffspypUe;J jahhpf;fg;gl;l
1=Yes 2 = No 8 DK___
1=Yes 2 = No 8 DK___
1=Yes 2 = No 8 DK___
T Any Coconut, peanuts or other nuts?VjhtJ Njq;fha;> fliy my;yJ gUg;Gtiffs;
1=Yes 2 = No 8 DK___
1=Yes 2 = No 8 DK___
1=Yes 2 = No 8 DK___
U Milk ghy; 1=Yes 2 = No 8 DK___
1=Yes 2 = No 8 DK___
1=Yes 2 = No 8 DK___
V Cheese, curd, yogurt or other milkproducts? ghw;fl;b> Nahfl;> japh; my;yJVida ghy; gz;lq;fs;
1=Yes 2 = No 8 DK___
1=Yes 2 = No 8 DK___
1=Yes 2 = No 8 DK|___
W Any oil fats, butter or foods made with anyof these?VjhtJ vz;nza;f; nfhOg;Gfs;>ntz;nza; my;yJ,tw;wpy;Vjhtnjhd;wpdhy; jahhpf;fg;gl;l
1=Yes 2 = No 8 DK___
1=Yes 2 = No 8 DK___
1=Yes 2 = No 8 DK___
X Any sugary foods such as chocolates,sweets, candies, pastries, cakes or biscuits?nrhf;Nyw;W> ,dpg;Gfs;> fw;fz;Lfs;>Ng];l;hp];> Nff;> my;yJ gp];nfl;LNghd;w VjhtJ ,dpg;Gg; gz;lq;fs;
1=Yes 2 = No 8 DK___
1=Yes 2 = No 8 DK___
1=Yes 2 = No 8 DK___
Y Condiments for flavour, such as chillies,spices, herbs or fish powder? kpsfha;>thridj; jputpaq;fs;> %ypiffs;my;yJ kPd; J}s; Nghd;w RitA+l;Lk;
1=Yes 2 = No 8 DK___
1=Yes 2 = No 8 DK___
1=Yes 2 = No 8 DK___
No. Questions and filters tpdhf;fSk;
gjpy;fSk;A Did this child eat any solid, semi-solid, or
soft foods yesterday during the day or at
night?
(If No, skip to C)
New;W ,uT Neuj;jpy; my;yJ gfy;
1 = Yes
2 = No
8 = Don’t Know
A ___
1 = Yes
2 = No
8 = Don’t Know
A ___
1 = Yes
2 = No
8 = Don’t Know
A ___
B How many times did this child eat solid,
semi-solid or soft foods other than liquids
yesterday during the day or at night?
New;W gfy; Neuj;jpy; my;yJ ,uTNeuj;jpy; ,e;jf; Foe;ij jputg;gjhh;j;jq;fisj; jtpu jpz;k>miuj;jpz;kmy;yJ nkd;ikahd czT tiffis
1 = Yes
2 = No
8 = Don’t Know
Number of times
B ___
1 = Yes
2 = No
8 = Don’t Know
Number of times
B ___
1 = Yes
2 = No
8 = Don’t Know
Number of times
B ___
C Did this child drink anything from a bottle
with a a nipple yesterday during the day or
night?
New;W gfy; Neuj;jpy; my;yJ ,uTNeuj;jpy; ,e;jf; Foe;ij #g;gpia(fhk;ig) cilanthU Nghj;jypUe;J
1 = Yes
2 = No
8 = Don’t Know
C___
1 = Yes
2 = No
8 = Don’t Know
C___
1 = Yes
2 = No
8 = Don’t Know
C___

ASSESSMENT OF NUTRITIONAL STATUS AND ASSOCIATED FACTORS IN NORTHERN PROVINCE
66
5. Nutrition Rehabilitation Programme Ngh~hf;Fg; Gdh;tho;T epfo;r;rpj;jpl;lk;Child A (Name) Child B (Name) Child C (Name)
5.1 Have you ever been enrolled in anyfeeding progrmeVjhtJ ghY}l;ly;epfo;r;rpj;jpl;lj;jpy; vg;nghOjhtJePq;fs; cs;sPh;f;fg;gl;Ls;sPh;fsh?
1= Yes 2= NoIf No, skip to 5.16___
1= Yes 2= NoIf No, skip to 5.16___
1= Yes 2= NoIf No, skip to 5.16___
5.1.1 If yes specify (can be enter multipleresponse)
1=Triposha 4=Plumpynut2=CSB5=HEB3=BP100 6=MMN____
1=Triposha 4=Plumpynut2=CSB5=HEB3=BP100 6=MMN___
1=Triposha 4=Plumpynut2=CSB5=HEB3=BP100 6=MMN___
5.2 What was the date of last visit forClinic/weighing post (check with CHDR)Foe;ijapd; epiwia mstpLtjw;fhf,Wjpahf tp[ak; nra;j ehs; vJ?(CHDRml;ilapypUe;Jrhpghh;j;Jf;nfhs;Sq;fs;)
___ ______ ___Date Month___ ___ ___ ___ Year
___ ______ ___Date Month___ ___ ___ ___ Year
___ ______ ___Date Month___ ___ ___ ___ Year
5.3 Outcome of Nutrition Status at that visit(Check CHDR),Wjp tp[aj;jpd; NghJfz;lwpag;gl;l Ngh~hf;F epiy(CHDRml;ilapypUe;Jrhpghh;j;Jf;nfhs;Sq;fs;)
1=Normal 2=MAM3=SAM 4=Underweight5=Not visited___
1=Normal 2=MAM3=SAM 4=Underweight5=Not visited___
1=Normal 2=MAM3=SAM 4=Underweight5=Not visited___
5.4 Did the child receive following itemsat that visit me;j tp[aj;jpd; NghJ Foe;ijf;F gpd;tUtd fpilj;jdth?
Child A (Name) Child B (Name) Child C (Name)
5.5 BP 100 / Plummpy BP 100/rijg; gUg;G 1= Yes, 2= No___|__| If No, skip to 5.7
1= Yes, 2= No___|__| If No, skip to 5.7
1= Yes, 2= No___|__| If No, skip to 5.7
5.6 If yes how frequently received itMk;vdpy;> ,J vt;thW fpilj;jJ?
1=Fortnight 2=Monthly3=Irregular 4=Not known5=This is first visit___
1=Fortnight 2=Monthly3=Irregular 4=Not known5=This is first visit___
1=Fortnight 2=Monthly3=Irregular 4=Not known5=This is first visit___
5.7 CSB 1= Yes, 2= No___ If No, skip to 5.9
1= Yes, 2= No___ If No, skip to 5.9
1= Yes, 2= No___ If No, skip to 5.9
5.8 If yes how frequently received itMk;vdpy;> ,J vt;thW fpilj;jJ?
1= Fortnight ,uz;L thuk;2= Monthly khjhe;jk;3= Irregular toikahf4=Not known njhpahJ5= This is first visit ,Jjhd; Kjy; tp[ak;___
1=Fortnight 2=Monthly3=Irregular 4=Not known5=This is first visit___
1= Fortnight 2= Monthly3=Irregular 4=Not known5= This is first visit___
5.9 Thriposha ‘jphpNgh~h’ 1= Yes, 2= No___ If No, skip to 5.11
1= Yes, 2= No___ If No, skip to 5.11
1= Yes, 2= No___ If No, skip to 5.11
5.10 If yes how frequently received itMk;vdpy;> ,J vt;thW fpilj;jJ?
1= Fortnight 2= Monthly3= Irregular 4=Not known5= This is first visit___
1= Fortnight 2= Monthly3= Irregular 4=Not known5= This is first visit___
1= Fortnight 2= Monthly3= Irregular 4=Not known5= This is first visit___
5.11 High Energy Biscuits mjpf rf;jpepiwe;j gp];nfl;L
1= Yes, 2= No___ If No, skip to 5.13
1= Yes, 2= No___ If No, skip to 5.13
1= Yes, 2= No___ If No, skip to 5.13
5.12 If yes how frequently received it Mk;vdpy;> ,J vt;thW fpilj;jJ?
1= Fortnight 2= Monthly3= Irregular 4=Not Known5= This is first visit___
1=Fortnight 2=Monthly3=Irregular 4=Not known5=This is first visit ___
1=Fortnight 2=Monthly3=Irregular 4=Not known5=This is first visit ___
5.13 MMN (sprinkle) packets(njspfiury;) gf;fw;Wf;fs;
1= Yes, 2= No___ If No, skip to 5.15
1= Yes, 2= No___ If No, skip to 5.15
1= Yes, 2= No___ If No, skip to 5.15
5.14 If yes how frequently received it Mk;vdpy;> ,J vt;thW fpilj;jJ?
1= Fortnight 2= Monthly3= Irregular 4=Not known5= This is first visit___
1=Fortnight 2=Monthly3=Irregular 4=Not known5=This is first visit ___
1=Fortnight 2=Monthly3=Irregular 4=Not known5=This is first visit ___
5.15Iron Syrup ,Uk;Gr; rj;Jg; ghdp 1= Yes, 2= No___ 1= Yes, 2= No
___1= Yes, 2= No___

ASSESSMENT OF NUTRITIONAL STATUS AND ASSOCIATED FACTORS IN NORTHERN PROVINCE
67
Child’s anthropometry Foe;ijapd; cly; mstPLChild A (Name) Child B (Name) Child C (Name)
5.16 Date of birth of the childFoe;ijapd; gpwe;j jpfjp
___ ______ ___Date Month___ ___ ___ ___ Year
___ ______ ___Date Month___ ___ ___ ___ Year
___ ______ ___Date Month___ ___ ______Year
6.17 Sex of childFoe;ijapd;ghy;epiy
1 = Male 2 = Female ___ 1 = Male 2 = Female ___ 1 = Male 2 = Female ___
5.18 Date of measurements mstpl;ljpfjp
___ ______ ___Date Month___ ___ ___ ___ Year
___ ______ ___Date Month___ ___ ___ ___ Year
___ ______ ___Date Month___ ___ ___ ___ Year
5.19 Type of measure:mstPl;L tif 1= Length ePsk; 2=Heightcauk;___
1= Length ePsk; 2=Heightcauk;___
1= Length ePsk; 2=Heightcauk;___
5.20 Child’s height: Foe;ijapd;cauk
;___ ___ ___ . ___ cm ;___ ___ ___ . ___cm ;___ ___ ___ . ___cm
5.21 Child’s weight: ___ ___. ___kg ___ ___. ___kg ___ ___. ___kg
5.22 Oedema: 1= Yes 2 = No |__| 1= Yes 2 = No |__| 1= Yes 2 = No |__|
5.23Child’s birth weight Foe;ijgpwe;j NeukpUe;j epiw (in kg)(fpfp)(CHDRml;ilapypUe;J)
___ . ___ ___kg ___ . ___ ___kg ___ . ___ ___kg
6. Toilet Facilitieskyry$l trjpfs;6.1 Where do your household members go to the toilet?
cq;fsJ FLk;g mq;fj;jth;fs; vt;tifahd kyry$lq;fisgad;gLj;Jfpd;wdh;?
1= Flush latrinejz;zPubj;Jf; fOtf;$bakyry$lk;/toiletwith waterjz;zPUld; $ba kyry$lk;2= Traditional pit latrine ghuk;ghpa kyry$lf; Fop (nowater)jz;zPhpy;yhj / open pit jpwe;j Fop3= Communal latrine nghJ kyry$lk;4= No latrine (bush)kyry$lkpy;iy (nrbfs;)___
6.2 How did you dispose your child’s stool?cq;fsJ Foe;ijapd; kyj;ij (fopTfis) vt;thWmfw;Wfpd;wPh;fs;?
1= Flush latrine jz;zPubj;Jf; fOtf;$ba kyry$lk;/toilet with water jz;zPUld; $ba kyry$lk;2= Traditional pit latrine ghuk;ghpa kyry$lf; Fop (nowater) jz;zPhpy;yhj/ open pit jpwe;j Fop3= Communal latrine nghJ kyry$lk;4= No latrine (buried)kyry$lkpy;iy (Njhz;bg;Gijj;jy;)5= No latrine (bush)kyry$lkpy;iy (nrbfs;)___
7. Water Sources ePh; fpilf;Fk; %yq;fs;
7.1 What is the main source of drinking water?gpujhd FbePh; %yk; vJ?
1= Piped water Foha; ePh;2= Public tap nghJ nlg;G3= Tube wellFoha;f;fpzW/boreholeePh;f;Fop4= Protected well %ba fpzW5= Rain waterkioePh;6= Water tank ePh; jhq;fp7= RiverMW/Stream mUtp8= Pond ePh;f;Fl;il9= Unprotected well ghJfhg;gw;w fpzW10=Canal fhy;tha; ___ ___
7.2 What is the main source of water for washing and otherpurposes?fOTtjw;Fk;>gpw Nehf;fq;fSf;Fkhd gpujhd ePh; %yk;vJ?
1= Piped water 2= Public tap3= Tube well/borehole 4= Protected well5= Rain water 6= Water tank7= River / Stream8= Pond9= Unprotected well 10= Canal ___ ___

ASSESSMENT OF NUTRITIONAL STATUS AND ASSOCIATED FACTORS IN NORTHERN PROVINCE
68
7.3 Do you treat your drinking water?cq;fsJ FbePiuRj;jk; nra;J mUe;Jfpd;wPh;fsh?
1= Yes, using chlorine Mk;> FNshhpidg; gad;gLj;jp2= Yes, by boilingMk;> #lhf;Ftjd; %yk;3= Yes, by filtration Mk;> tbj;njLg;gjd; %yk;4= No,y;iy___
7.4 How long (In minutes) does it take to collect water from the source? (Going and return, walking)?(Write “0” if within the house or dwelling) ePh; %yj;jpypUe;J jz;zPiu vLj;J tUtjw;F vt;tsTNeuk; Efh;fpd;wJ (epkplj;jpy;) (nrd;W jpUk;gp tUtjw;F> ele;J nry;tjw;F) (tPl;bDs; my;yJtjptplj;jpDs;spUe;J vLj;J tUtnjdpy; “0” vdf; Fwpg;gpLq;fs;
________ Minutes
7.5 Do you wash hand after using toilet? ePq;fs; kyry$lk;nrd;w gpd;dh; cq;fsJ iffis rth;f;fhuj;jpdhy;fOTfpd;wPh;fsh?
1= Always with soap vg;nghOJk; rth;f;fhuj;jpdhy;2= Some times with soap rpy rkak; rth;f;fhuj;jpdhy;3= Without soap rth;f;fhuj;ijg; ghtpf;fhky;4= Do not wash fOTtjpy;iy9= No answer gjpypy;iy ___
7.6 Do you wash your hand before eating? ePq;fs; rhg;gpLtjw;FKd;dH cq;fsJ iffisrtu;f;fhuj;jpdhy;fOTfpd;wPHfsh?
1= Always with soap 2= Some times with soap3= Without soap 4= Do not wash 9= No answer ___
7.7 Do you wash your hands before feeding the child? ePq;fs;Foe;ijf;Fg; ghY}l;l Kd;dh; rth;f;fhuj;jpdhy;cq;fsJ iffisf; fOTfpd;wPh;fsh?
1= Always with soap 2= Some times with soap3= Without soap 4= Do not wash 9= No answer ___
8. Household AssetsFLk;gr;nrhj;Jf;fs;
8.1
What assets do you have now? (circle) jw;NghJcq;fsplk; vd;d tifahd nrhj;Jf;fs; ,Uf;fpd;wd /,lk;ngau;tjw;F Kd;dh;vt;tifahd nrhj;Jf;fs; ,Ue;jd? (tl;lkpLq;fs;)
ItemnghUl;fs; Now
A. JewelleryMguzq;fs; 1= Yes 2= No___
B. Equipments/tools for livelihood activity (axe, hoe…) tho;thjhur; nraw;ghl;bw;fhd fUtpfs;
/cgfuzq;fs; (Nfhlup> kz;ntl;b…)
1= Yes 2= No___
C. Water pumpePh; ,iwf;Fk; ,ae;jpuk; 1= Yes 2= No___
D. Electricity kpd;rhu trjp 1= Yes 2= No___
E. Solar Power #hpa rf;jp trjp 1= Yes 2= No___
F. Mosquito netEsk;G tiy 1= Yes 2= No___
G. FridgeFsph;rhjdg; ngl;b 1= Yes 2= No___
H. Sewing machineijay; ,ae;jpuk; 1= Yes 2= No___
I. Washing machineryit ,ae;jpuk; 1= Yes 2= No___
J. Television njhiyf;fhl;rpg; ngl;b 1= Yes 2= No___
K. Radio thndhypg; ngl;b 1= Yes 2= No___
L. Mobile phones ifalf;fj; njhiyNgrpfs; 1= Yes 2= No___
M. Land/CDMA Phone jiukhh;f;f / CDMA njhiyNgrp trjp 1= Yes 2= No___
N. Pesticide sprayer G+r;rpehrpdpj; njspfUtp 1= Yes 2= No___
O. Fishing boat, boat engine kPd;gpbg; glF 1= Yes 2= No___
P. BicycleJtpr;rf;futz;b 1= Yes 2= No___
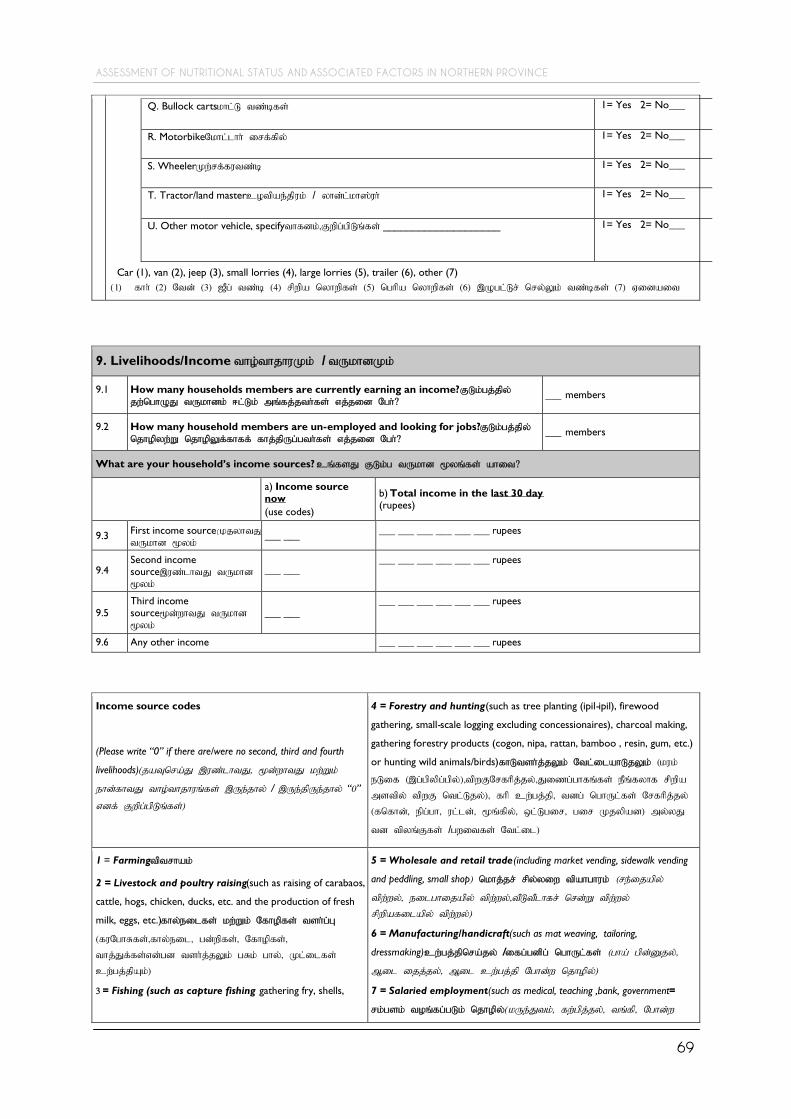
ASSESSMENT OF NUTRITIONAL STATUS AND ASSOCIATED FACTORS IN NORTHERN PROVINCE
69
Q. Bullock cartskhl;L tz;bfs; 1= Yes 2= No___
R. MotorbikeNkhl;lhh; irf;fpy; 1= Yes 2= No___
S. WheelerKw;rf;futz;b 1= Yes 2= No___
T. Tractor/land mastercotpae;jpuk; / yhd;l;kh];uh; 1= Yes 2= No___
U. Other motor vehicle, specifythfdk;>Fwpg;gpLq;fs; ____________________ 1= Yes 2= No___
Car (1), van (2), jeep (3), small lorries (4), large lorries (5), trailer (6), other (7)(1) fhh; (2) Ntd; (3) [Pg; tz;b (4) rpwpa nyhwpfs; (5) nghpa nyhwpfs; (6) ,Ogl;Lr; nry;Yk; tz;bfs; (7) Vidait
9. Livelihoods/Income tho;thjhuKk; / tUkhdKk;
9.1 How many households members are currently earning an income?FLk;gj;jpy;jw;nghOJ tUkhdk; <l;Lk; mq;fj;jth;fs; vj;jid Ngh;?
___ members
9.2 How many household members are un-employed and looking for jobs?FLk;gj;jpy;njhopyw;W njhopYf;fhff; fhj;jpUg;gth;fs; vj;jid Ngh;?
___ members
What are your household’s income sources?cq;fsJ FLk;g tUkhd %yq;fs; ahit?
a) Income sourcenow(use codes)
b) Total income in the last 30 day(rupees)
9.3 First income sourceKjyhtJtUkhd %yk;
___ ___ ___ ___ ___ ___ ___ ___ rupees
9.4Second incomesource,uz;lhtJ tUkhd%yk;
___ ______ ___ ___ ___ ___ ___ rupees
9.5Third incomesource%d;whtJ tUkhd%yk;
___ ______ ___ ___ ___ ___ ___ rupees
9.6 Any other income ___ ___ ___ ___ ___ ___ rupees
Income source codes
(Please write “0” if there are/were no second, third and fourth
livelihoods)(jaTnra;J ,uz;lhtJ> %d;whtJ kw;Wk;
ehd;fhtJ tho;thjhuq;fs; ,Ue;jhy; / ,Ue;jpUe;jhy; “0”
vdf; Fwpg;gpLq;fs;)
4 = Forestry and hunting(such as tree planting (ipil-ipil), firewood
gathering, small-scale logging excluding concessionaires), charcoal making,
gathering forestry products (cogon, nipa, rattan, bamboo , resin, gum, etc.)
or hunting wild animals/birds)fhLtsh;j;jYk; Ntl;ilahLjYk; (kuk;
eLif (,g;gpypg;gpy;)>tpwFNrfhpj;jy;>Jizg;ghfq;fs; ePq;fyhf rpwpamstpy; tpwF ntl;Ljy;)> fhp cw;gj;jp> tdg; nghUl;fs; Nrfhpj;jy;(fnfhd;> epg;gh> ul;ld;> %q;fpy;> xl;Lgir> gir Kjypad) my;yJ
td tpyq;Ffs; /gwitfs; Ntl;il)
1 = Farmingtptrhak;
2 = Livestock and poultry raising(such as raising of carabaos,
cattle, hogs, chicken, ducks, etc. and the production of fresh
milk, eggs, etc.)fhy;eilfs; kw;Wk; Nfhopfs; tsh;g;G
(fuNghRfs;>fhy;eil> gd;wpfs;> Nfhopfs;>thj;Jf;fs;vd;gd tsh;j;jYk; gRk; ghy;> Kl;ilfs;cw;gj;jpAk;)
3 = Fishing (such as capture fishing gathering fry, shells,
5 = Wholesale and retail trade(including market vending, sidewalk vending
and peddling, small shop) nkhj;jr; rpy;yiw tpahghuk; (re;ijapy;
tpw;wy;> eilghijapy; tpw;wy;>tPLtPlhfr; nrd;W tpw;wy;rpwpafilapy; tpw;wy;)
6 = Manufacturing/handicraft(such as mat weaving, tailoring,
dressmaking)cw;gj;jpnra;jy; /ifg;gdpg; nghUl;fs; (gha; gpd;Djy;>
Mil ijj;jy;> Mil cw;gj;jp Nghd;w njhopy;)
7 = Salaried employment(such as medical, teaching ,bank, government=
rk;gsk; toq;fg;gLk; njhopy;(kUe;Jtk;> fw;gpj;jy;> tq;fp> Nghd;w

ASSESSMENT OF NUTRITIONAL STATUS AND ASSOCIATED FACTORS IN NORTHERN PROVINCE
70
seaweeds, etc. ; and culturing fish, oyster, mussel, etc.) =
kPd;gpb (kPd;> ej;ijfs; gpbj;Jf; fhaitj;jy;>fly;jhtuq;fs; Nrfhpj;jy;> kw;Wk; kPd;> rpg;gp>ml;il tsh;j;jy;)Nghd;w njhopy;
murhq;fj; njhopy;fs;)
8 = Skilled LabourerNjh;r;rp ngw;w njhopyhsh;
9 = Daily/common labourerehshe;j /rhjuz $ypahs;
10 = Foreign Employment (such as working overseas outside of Sri Lanka)
11 = Other (specify) Vidait (Fwpg;gpLq;fs;) __________________
A. Paddy, highland crops and home gardening
9.7
Do you have any lands (paddy fields and highland)?
cq;fSf;F VjhtJ fhzpfs; ,Uf;fpd;wdth? (ney;tay;fs; kw;Wk; Vida epyq;fs;)
A. Habitat tho;tplk;
B. Yes, in use Mk;> gad;ghl;by;
C. Yes, not in use gad;ghl;by;iy
A. 1 yes 2 No ___
B. 1 yes 2 No ___
C. 1 yes 2 No___
9.8
If yes, what is the size of the land in acres?Mk; vdpy;>
fhzpapd; gug;gsT vd;d?(1 Acre Vf;fh; = 160 Perches Ngh;r;r];fs;)
A. Agriculture own nrhe;j tptrha epyk;
B. Agriculture Government mur tpt.
epyk;
C. Agriculture Leased Fj;jif tpt.epyk;
D. Agriculture Totalnkhj;j tpt.epyk;
A ………
B. ………
C. ………
D. ………
9.9
Do you cultivate paddy? ePq;fs; Ntshz;ik nra;fpd;wPh;fsh?
1 = No, has no interest in farming ,y;iy> Ntshz;ikapy; Mh;tk; fhl;Ltjpy;iy
2 = Would like to cultivate, but cannot Ntshz;ik nra;a tpUg;gk;> vd;whYk; KbahJ
3 = Yes, does cultivate Mk;>Ntshz;ik nra;fpd;Nwhk;
___
9.10
Do you cultivate high land (chena) crops? ePq;fs; Nkl;Lepyg; gaph;fisg;
gaphpLfpd;wPh;fsh?
1 = No, has no interest in farming ,y;iy> gaphpLtjpy; Mh;tk; fhl;Ltjpy;iy
2 = Would like to cultivate, but cannot gaphpLtjw;F tpUg;gk;> vd;whYk; KbahJ
3 = Yes, does cultivate Mk;> gaphpLfpd;Nwhk;
___
9.11
Do you cultivate home garden? ePq;fs; Njhl;lg; gaph;fis eLfpd;wPh;fsh?
1 = No, has no interest in gardening,y;iy> Njhl;lg; gaph; eLtjpy; Mh;tk; fhl;Ltjpy;iy
2 = Would like to cultivate, but cannot gaphpLtjw;F tpUg;gk;> vd;whYk; KbahJ
3 = Yes, does cultivate Mk;> gaphpLfpd;Nwhk;
___
B. Yala and Maha rpW kw;Wk; ngUk;Nghfq;fs;
9.12
Are you a farmer? ePq;fs; xU tptrhapah?
(Have you cultivated in the past or do you plan to cultivate in the future?fle;j fhyq;fspy;
ePq;fs; gaph;r;nra;Js;sPh;fsh my;yJ vjph;fhyj;jpy; gaph;r;nra;a vz;Zfpd;wPh;fsh?)
1 = Yes Mk;
2 = No ,y;iy(if no, skip to sectionC)
___

ASSESSMENT OF NUTRITIONAL STATUS AND ASSOCIATED FACTORS IN NORTHERN PROVINCE
71
9.13
Did you cultivate crops in the 2011 Yala season?2011 Mk; Mz;L rpWNghfj;jpy; ePq;fs;
gaph;fis el;Bh;fsh?1 = Yes Mk;
2 = No ,y;iy (Skip to 9.15,w;F efUq;fs;);
___
9.14
How was the Yala 2011 harvest compared with last year’s Yala (2010)?fle;j
rpWNghfj;Jld; (2010) xg;gpLk; NghJ 2011 Mk; Mz;L rpWNghf mWtil vt;thwpUe;jJ?1 = Better rpwe;jjhftpUe;jJ (2011 Mk; Mz;L 2010 Mk; Mz;il tplr; rpwe;jjhftpUe;jJ)
2= Same xNuasthftpUe;jJ
3 = WorseNkhrk; (2011 Mk; Mz;L 2010Mk; Mz;il tpl NkhrkhftpUe;jJ)
4 = Did not cultivate in 2010Mk; Mz;by; gaphpltpy;iy
___
9.15
Do you expect to cultivate in the 2011/12 Maha season? 2011-2012 ngUk;Nghfj;jpy;
ePq;fs; gaphpLtjw;F vjph;ghh;f;fpd;wPh;fsh?1 = Yes Mk;
2 = No ,y;iy
___
C. Livestockfhy;eil
9.16 Does your household own any livestock?cq;fsJ FLk;gj;jpw;Fr; nrhe;jkhd VjhtJ
fhy;eilfs; ,Uf;fpd;wdth?
1= Yes Mk; 2= No ,y;iy (but used to own MdhYk; gpwhpd;) 3= No ,y;;iy (never owned
xUNghJk; nrhe;jkhftpy;iy)
(If No, go to section D)
___
9.17 If your family owns livestock, please fill in the table below with the number of livestock owned.cq;fsJ FLk;gj;jpw;F
fhy;eilfs; nrhe;jkhftpUg;gpd;> jaTnra;J fPo;fhZk; ml;ltizia nrhe;jkhd fhy;eilfspd; vz;zpf;ifiaf;nfhz;L epug;Gq;fs;
Livestock typefhy;eil
,dk;
Number vz;zpf;if
9.17.1. Cattlefhy;eil A. ___ ___
9.17.2. BuffalovUik khL; B. ___ ___
9.17.3. PoultryNfhopfs; C. ___ ___
9.17.4. GoatsMLfs D. ___ ___
9.17.5. Piggd;wp E. ___ ___
9.17.6. OtherVidait F. ___ ___
D. Fishing kPd;gpb
9.18 Is your household involved in any fishing activities?cq;fsJ FLk;gk; VjhtJ
kPd;gpbj;jy; nraw;ghLfspy; <LgLfpd;wjh?
1= Yes 2= No (if No, go to section 10)
___

ASSESSMENT OF NUTRITIONAL STATUS AND ASSOCIATED FACTORS IN NORTHERN PROVINCE
72
9.19 If yes, what fishing activities are you
involved with?
Mk; vdpy;> ePq;fs; <LgLk; kPd;gpbj;jy;nraw;ghLfs; ahit?(kpf Kf;fpakhdijtl;lkpLq;fs;)
1= Boat owner glFr; nrhe;jf;fhuh;
2= Crew member, open sea FO cWg;gpdh;>
jpwe;j fly;
3= Crew member, lagoon fishing FO
cWg;gpdh;> fsg;G kPd;gpbj;jy;
4= Fish vendor kPd; tpahghhp
5= Net mending tiy jpUj;Jeh;
6= Boat repair glF gOJghh;g;gth;
7= Engine repair vd;[pd; gOJghh;g;gth;
8= Fish processing kPd; gjdply;
9= Sale of fishing gear/accessories kPdgpb
cgfuzq;fs; /cjphpg;ghfq;fs; tpw;gid
10= Other Vidait
___ ___
9.20 How is the fishing this year, compared to last year (2010)? fle;j Mz;Lld; (2010)
xg;gpLk; NghJ ,e;j Mz;L kPd;gpb vt;thwpUf;fpd;wJ?
1 = Better, rpwe;jJ (2011 Mk; Mz;L 2010 Mk; Mz;il tplr; rpwe;jJ)
2 = SamexNuasthdJ
3 = Worse, NkhrkhdJ (2011 Mk; Mz;L 2010 Mk; Mz;il tpl NkhrkhdJ)
___
10. Household Expenditure FLk;gr; nrytpdk;
How much money did your household spend on the following food items inthe last one week? fle;j xU thuj;jpy; gpd;tUk; czT tiffSf;F cq;fsJFLk;gk; vt;tsT gzj;ijr; nryT nra;jJ?
Rupees spent in the last 7daysfle;j 7 ehl;fspy;nryT nra;j gzk; - &gha;
10.1 Rice NrhW ___ ___ ___ ___ ___
10.2 Wheat flour NfhJik ___ ___ ___ ___ ___
10.3 Bread ghz; / Chapati rg;gj;jp / Roti cnuhl;b / Hoppers / String hoppers ___ ___ ___ ___ ___
10.4 Pulses rijg;gUg;G/ / Dhal / Gram ___ ___ ___ ___ ___
10.5 FishkPd; ___ ___ ___ ___ ___
10.6 Meat (beef, pork, chicken, mutton) ,iwr;rp (khl;biwr;rp> gd;wpapiwr;rp>Nfhopapiwr;rp)
___ ___ ___ ___ ___
10.7 Eggs Kl;ilfs; ___ ___ ___ ___ ___
10.8 Curd japh; ___ ___ ___ ___ ___
10.9 Palm oil, vegetable oil, coconut oil, fats Njq;fha; vz;nza;> ghk; xapy;> kuf;fwpvz;nza;
___ ___ ___ ___ ___
10.10 Milk (liquid and powder) ghy; khT (jputk; my;yJ J}s;) ___ ___ ___ ___ ___
10.11 Vegetables (including leaves) kuf;fwp tif (fPiufs; mlq;fyhf) ___ ___ ___ ___ ___
10.12 Fruits goq;fs; ___ ___ ___ ___ ___
10.13 Coconut and coconut products (except oil) Njq;fhAk; Njq;fha;g; nghUl;fSk; ___ ___ ___ ___ ___
10.14 Sugar rPdp / Jaggary rf;fiu ___ ___ ___ ___ ___
10.15Prepared food jahhpj;j czT (food and drinks from restaurants and stalls czTtpLjpfspypUe;Jk; filfspypUe;Jk; fpilf;Fk; czT> ghdq;fs;) ___ ___ ___ ___ ___
10.16Special nutritional food tpN~l Ngh~hf;F czT (Thriposha jphpNgh~h, FBF, CSB etcKjypad.) ___ ___ ___ ___ ___
10.17All other food items Vida czT ghd tiffs; (Tea, NjdPh; coffee Nfhg;gp etcKjypad) ___ ___ ___ ___ ___

ASSESSMENT OF NUTRITIONAL STATUS AND ASSOCIATED FACTORS IN NORTHERN PROVINCE
73
How much money did your household spend on the following non-fooditems in the last one month? fle;j xU khjj;jpy; gpd;tUk; czT rhuhjnghUl;fSf;F cq;fsJ FLk;gk; vt;tsT gzj;ijr; nryT nra;jJ?
Rupees spent in the last 30 daysfle;j 30 ehl;fspy; nryT nra;jgzk; - &gha;
10.18 Payments on debts gw;Wf;fs; kPjhd nfhLg;gdTfs; ___ ___ ___ ___ ___
10.19 Milling Miyj;njhopy; ___ ___ ___ ___ ___
10.20 House rent tPl;L thlif ___ ___ ___ ___ ___
10.21 Education fy;tp ___ ___ ___ ___ ___
10.22
Consumable households items (e.g. soap, candles, matches, detergent) )czT
rhuhj nghUl;fs; (c-k;:- rth;fhuk;> nkOFth;j;jpfs;> jPg;ngl;bfs;> ryitj;J}s;fs;)
___ ___ ___ ___ ___
10.23 Cooking fuel rikay; vhpnghUs /firewood tpwF ___ ___ ___ ___ ___
10.24 Transportation and communications (busses, phones etc.) Nghf;Ftuj;J ___ ___ ___ ___ ___
10.25Livelihood inputs tho;thjhu cs;sPLfs; (tools fUtpfs;, seeds tpijfs; etc
Kjypad) ___ ___ ___ ___ ___
10.26Veterinary services and animal feed kpUf itj;jpa NritfSk; tpyq;Fj;
jPdpAk;___ ___ ___ ___ ___
10.27 Hiring labor njhopyhsiu thliff;F mkh;j;Jjy; ___ ___ ___ ___ ___
10.28 Alcohol rhuhak / Beer gpah; / Toddi gdk; rhuhak / Tobacco / Beetle Nut ___ ___ ___ ___ ___
10.29Gifts to others Vidath;fSf;fhd ntFkhdg; nghUl;fs; (sharing of resources
tsq;fs; gfph;T)
___ ___ ___ ___ ___
10.30 Water jz;zPh; trjp ___ ___ ___ ___ ___
10.31 Electricity kpd;rhu trjp ___ ___ ___ ___ ___
10.32 House constructions and repairs tPl;L eph;khzq;fSk; jpUj;jq;fSk; ___ ___ ___ ___ ___
10.33Other household items Vida tPl;Lg; nghUl;fs;(kitchenware rikayiwg;
ghj;jpuq;fs;, furniture jsghlq;fs; etc Kjypad)___ ___ ___ ___ ___
10.34 Medicine and health care kUe;Jk; Rfhjhug; guhkhpg;Gk; ___ ___ ___ ___ ___
10.35 Clothing and shoes MilfSk; mzpfSk; ___ ___ ___ ___ ___
10.36 Celebrations and social events nfhz;lhl;lq;fSk; r%f epfo;r;rpfSk; ___ ___ ___ ___ ___
10.37 Fines and taxesjz;lq;fSk; thpfSk; ___ ___ ___ ___ ___
10.38 All other non-food items nfhz;lhl;lq;fs; ___ ___ ___ ___ ___
11. Household Food Consumption FLk;g czT Efh;T
11.1 How many meals do household members in the following age groups eat per day?gpd;tUk; taJj; njhFjpiar; Nrh;e;j FLk;gmq;fj;jth;fs; ehnshd;Wf;F vj;jid jlitfs; czT cl;nfhs;Sfpd;whh;fs;?.
Age GrouptaJj; njhFjp No. of mealsczT cl;nfhs;Sk;jlit
11.1.1 A, Children 0-1 year taJf;Ff; Fiwe;j Foe;ij A, ___
11.1.2 B, Children >1-5 years Fiwe;j-,ilg;gl;l Foe;ij B, ___
11.1.3 C, Children >5-18 years Fiwe;j-,ilg;gl;l gps;isfs; C, ___
11.1.4 D, Members older than 18 years taJf;F Nkw;gl;l taJ te;jth;fs; D, ___

ASSESSMENT OF NUTRITIONAL STATUS AND ASSOCIATED FACTORS IN NORTHERN PROVINCE
74
11.2
1. How many days (in past 7 days) did your household eat the following food items? (Write number for e.g. 5)2. What were the main and secondary sources of this food item? (Use codes below)gpd;tUk; czT tiffis fle;j (7ehl;fspy;) cq;fsJ FLk;g mq;fj;jth;fs; vj;jid jlitfs; cl;nfhz;ldh;? (jlitfspd; vz;zpf;ifiaf; Fwpg;gpLq;fs;>cjhuzkhf: 5),e;j czTg; nghUl;fspd; gpujhd kw;Wk; ,uz;lhk;epiy %yq;fs; ahit? (fPo;fhZk; ,uf~paf; FwpaPl;il vOJq;fs;)
Food groups czT tif
a) Number ofdays eaten in thelast week fle;jthuj;jpy; czTcl;nfhz;lehl;fs;vz;zpf;if(0 - 7 days ehl;fs;)
b) Main foodsource gpujhdczT %yk;(1 - 8,use codesFwpaPl;ilg;gad;gLj;Jq;fs;)
c) Secondary food source,uz;lhk;epiy czT%yq;fs;(1 - 8,use codes FwpaPl;ilg;gad;gLj;Jq;fs;)
11.2ARice and other cereals mhprpAk; Vidaetjhdpaq;fSk;(finger millet tpuy; jpid etcKjypad)
___ ___ ___
11.2BTubers fpoq;F tiffs;(potatocUisf;fpoq;F , sweet potatotj;jhisf;fpoq;F , cassava frhth etc Kjypad)
___ ___ ___
11.2C Bread ghz;/ Chapti rg;gj;jp/ Roti cnuhl;b ___ ___ ___
11.2D Pulses gUg;G tif / Dhal gUg;G ___ ___ ___
11.2D Fish kPd; ___ ___ ___
11.2EMeat ,iwr;rp tif (beef khl;biwr;rp, pork,gd;wpapiwr;rp chicken Nfhopapiwr;rp)
___ ___ ___
11.2F Eggs Kl;ilfs; ___ ___ ___
11.2G Dairy ghy; tif (curd japW, liquid milk jputg;ghy;, powder milk ghy; khT etc Kjypad)
___ ___ ___
11.2H Coconut products Njq;fha; cw;gj;jpfs;, palmoil ghk; xapy;, vegetable oil kuf;fwp vz;nza;,fats nfhOg;G etc Kjypad.
___ ___ ___
11.2I Vegetables kuf;fwp tiffs; (including leavesfPiufs; mlq;fyhf)
___ ___ ___
11.2J Fruits goq;fs; ___ ___ ___
11.2K Sugar rPdp / Jaggary rf;fiu ___ ___ ___
11.2L Alcohol rhuhak; / Beer gpah;/ Toddi gdk; rhuhak; ___ ___ ___
Food sources:czT %yq;fs;1 = Own productionnrhe;j cw;gj;jp2 = Purchase at the marketre;ijf; nfhs;tdT3 = Purchase at the MPCSgNeh$rf nfhs;tdT4 = Exchange of goods or servicesgz;lq;fs;my;yJ Nritfs; ghpkhw;wk;
5 = Borrowedfldhf thq;fpa6 = Received as giftntFkhdkhff; fpilj;j7 = Food aidczT khdpak;8 = Other, specifyVidait> Fwpg;gpLq;fs;:
11.3
How many days will your food stock or money to buy food last?,Wjpahf cq;fsJ czTf; fsQ;rpak; my;yJ czitthq;Ftjw;fhd gzk; vj;jid ehl;fSf;Fg; NghJkhdJ?
1= Less than 1 week thuj;jpw;Ff; Fiwa2= Two weeks to 1 month ,uz;L fpoik Kjy; 1 khjk;tiu3= 1 month to 3 months 1 khjk; Kjy; 3 khjk; tiu4= More than 3 months 3 khjq;fSf;F Nky;5= No food cztpy;iy/ no cash gzkpy;iy)

ASSESSMENT OF NUTRITIONAL STATUS AND ASSOCIATED FACTORS IN NORTHERN PROVINCE
75
12. Coping Strategy caph; thOk; topKiwfs;
12.1
Does your household have enough food to feed all the family members at all times? vy;yhNeuq;fspYk; rfy FLk;g mq;fj;jth;fSf;Fk; cztspf;f cq;fsJ FLk;gj;jpy; NghjpaczT ,Ue;jjh?1 = Yes Mk; 2 = No ,y;iy
___
12.2
In the past 7 days, where there times when you did not have enough food or money to buy food?fle;j 07 ehl;fspy; Nghjpa cztpy;yhky; my;yJ czit thq;f gzkpy;yhky;,Ue;jPh;fsh?1 = Yes Mk; 2 = No ,y;iy
___
If yes, how many days in the past 7 days has your household had to:Mk; vdpy;> fle;j 07ehl;fspy; vj;jid ehl;fs; cq;fsJ FLk;gj;jpw;F mt;thwpUf;f Neh;e;jjJ?
Number of daysehl;fspd;vz;zpf;if(0 - 7)
12.3 Rely on less preferred and less expensive foodsFiwe;j tpUg;gKila kw;Wk; kypthdczTfspy; jq;fpapUe;jik ___ days
12.4 Borrow food, or rely on help from a friend or relative fldhf czTfis thq;fpaik my;yJez;gh;fsplkpUe;J my;yJ cwtpdh;fsplkpUe;J fpilj;j cjtpapy; jq;fpapUe;jik
___ days
12.5 Purchase food on credit fld; mbg;gilapy; czTfis thq;fpaik ___ days
12.6 Consume seed stock held for next season mLj;j gaph;r;nra;if fhyj;jpw;fhfr; Nrkpj;Jitj;jpUe;j jhdpaq;fis Efu Nehpl;lik
___ days
12.7 Have household members eat elsewhere FLk;g mq;fj;jth;fs; NtWvq;fhtJ nrd;Wrhg;gpl;lik
___ days
12.8 Limit portion size at mealtimes czT Ntisfspd; NghJ cztpd; msit tiuaWj;jik ___ days
12.9 Restrict consumption by adults in order for small children to eat taJ te;jth;fs; Efh;e;jczit rpW Foe;ijfs; cz;Zk; nghUl;L tiuaWj;jik
___ days
12.10 Reduce number of meals eaten in a day xU ehspy; cz;Zk; czT Ntisapd;vz;zpf;ifiaf; Fiwj;jik
___ days
12.11 Skip entire days without eating cz;zhky; KO ehl;fisAk; fopj;jik ___ days
12.12In the past 30 days, were there times when you did not have enough food or money to buyfood?fle;j 30 ehl;fspy; Nghjpa cztpy;yhky; my;yJ czit thq;f gzkpy;yhky;,Ue;jPh;fsh?
1 = Yes Mk; ___2 = No ,y;iy ___
If yes, have your household done any of the following?Mk; vdpy;> cq;fsJ FLk;gk; gpd;tUtdtw;wpy; vjidNkw;nfhz;Ls;sJ?1 = Yes Mk; 2 = No ,y;iy ;
12.13 Did you sell any household articlestPl;Lg; nghUl;fistpw;gid nra;jik 1 = Yes 2 = No ___
12.14 Did you sell any other major assets? (Car, Motor cycle, Tractor) 1 = Yes 2 = No ___
12.15 Sold jewellery Mguzq;fis tpw;gid nra;jikIf the answer is yes,gjpy; Mk; vdpy;___How many pounds last in month? fle;j khjj;jpy; vj;jidgTd;fs;______
12.16PawningMguzq;fis mlFitj;jik
If the answer is yes,gjpy; Mk; vdpy;___How many pounds last in month? fle;j khjj;jpy;vj;jid gTd;fs; ______
12.17 Sold agriculturaltptrha/ livelihood tools,tho;thjhuf; fUtp rhjdq;fs; seeds tpijfs;etcKjypatw;iwtpw;gid nra;jik
1 = Yes 2 = No ___
12.18 Sold building materials fl;blg; nghUl;fis tpw;gid nra;jik 1 = Yes 2 = No ___
12.19 Sold HH furniture tPl;Lj; jsghlq;fis tpw;gid nra;jik 1 = Yes 2 = No ___
12.20 Used savings Nrkpg;Gfis cgNahfpj;jik 1 = Yes 2 = No ___
12.21 Borrowed money from relatives cwtpdh;fsplkpUe;J/neighbours mayth;fsplkpUe;Jfldhfg; gzk; thq;fpaik
1 = Yes 2 = No ___If no skip to 12.23
12.22 If yes did you have to pay interest 1 = Yes 2 = No ___
12.23 Reduced expenditures on health and education Rfhjhu> fy;tp rhh; nrytpdq;fisf;Fiwj;jik
1 = Yes 2 = No ___

ASSESSMENT OF NUTRITIONAL STATUS AND ASSOCIATED FACTORS IN NORTHERN PROVINCE
76
13. Humanitarian Assistance kdpjhgpkhd cjtp
13.1 Did your household or any member of your household receive foodassistance during the past three month? cq;fsJ FLk;gj;jpw;F my;yJcq;fsJ FLk;gj;jpd; vtNuDnkhU mq;fj;jtUf;F fle;j %d;W khj fhyg;gFjpapy; czT cjtp fpilj;jjh?1= Yes 2= No If No, skip to 13.3
___
13.2 If yes, what kind offood assistance?(circle all that apply)Mk; vdpd;> vd;dtifahd czTcjtp fpilj;jJ?(Vw;Gilavy;yhtw;iwAk;tl;lkpLq;fs;)
1. General Food Distribution nghJthd czT tpepNahfk; (MPCS, WFP)2. NGOmrhep/Community basic food aid rKjha mbg;gil czT khdpak;3. School mealsghlrhiy czT4. Therapeutic feedingrpfpr;ir rhh; cztspj;jy; (in health care center Rfhjhug; guhkhpg;G
epiyaj;jpy; ormy;yJ hospitalitj;jparhiyapy;)5. Food for workNtiyf;fhd /traininggapw;rpf;fhd czT6. Samurdhi food ration rKh;j;jp czT epthuzk;7. Complementary food Fiwepug;G czT (vegetables,kuf;fwp tea,NjdPh;
spices,thridj;jputpak; soya meatNrhah ,iwr;rp)8. Supplementary feedingFiwepug;G cztspj;jy; : High energy biscuits mjpfstpy; rf;jp
epiwe;j gp];nfl;Lf;fs;9. Supplementary feedingFiwepug;G cztspj;jy : CSB, TriposhajphpNgh~h___
Which of the following have you received gpd;tUtdtw;wpy; cq;fSf;Ff; fpilj;jit vit (in the last 3 monthsfle;j 03khjq;fspy;)?0 = Did not receivefpilf;ftpy;iy1 = Did receivefpilj;jd
13.3 Cash for work Ntiyf;fhd gzk; ___
13.4 Government cash grants murhq;fg; gz khdpaq;fs; ___
13.5 Other cash assistance Vida gz cjtp ___
13.6 Samurdhi vouchers rKh;j;jp epthuz Kj;jpiufs; ___
13.7 Other vouchers Vida epthuz Kj;jpiufs; ___
13.8 Construction material, building fl;bl> eph;khz %yg;nghUl;fs; ___
13.9Agricultural assistance tptrha rhh; cjtp (tools fUtp rhjdq;fs; /seeds tpijfs;, re-stocking of cattle fhy;eilfs; kWNrpg;G etc Kjypad.)
___
13.10Other livelihood assistance Vida tho;thjhu cjtp (sewing machines etc ijay;,ae;jpuq;fs; Kjypad)
___