Embed Size (px)
Citation preview
CLIMATE AND PRECIPITATION
The precipitation vary from just more than 500 mm in the east to less than 100 mm in the west. The precipitation is seasonally variable and erratic. The average below normal and above normal bands are indicated below with the precipitation deviation from that for the last 3 years. On the long term the extraordinary precipitation events of 1973 to 1976 and 1988 prove to have major effect on groundwater resources in terms of major recharge available for a number of years after the event.
GEOLOGY
The main rock types in the areas are depicted in the map below. Unconsolidated sand, calcrete, calcarenite, aeolinite, conglomerate, clay, silcrete and limestone are present along paleo drainage areas, with the Kalahari basin the area of wide distribution and depth. In the Karoo basin and other areas argillaceous sediments are widespread and at depth. Part of the sediments is the calcareous rocks of the Ghaap Plato. Into these and other rocks basic dolerite and diabase intruded. Igneous intrusive and extrusive rocks of different ages cover large areas. Metamorphic rocks are common in the Namaqualand area.
HYDROGEOLOGY
As indicated on the map, the unconsolidated rocks host intergranular aquifers with limited yield due to the fine and clayey material. Higher yield is the exception. Fractured aquifers can be present in most rock types with faulting and dolerite intrusions the major contributor to fracturing.Karsts in calcareous rocks on the Ghaap Plato can yield large volumes of water of good quality. Most of the rocks host a combination of intergranular and fractured aquifers. The aquifers listed are dependent on precipitation for recharge. This recharge vary with frequency of precipitation, rock type, plant and soil cover, river bed infiltration, preferred path infiltration to name dot? a few. Studies from the area indicate that with a threshold precipitation of more than 20 mm less than 1% to seldom more than 10% of precipitation can infiltrate to reach the groundwater. During excessive precipitation events a larger percentage of the vast volumes of precipitation infiltrate.
GROUNDWATER RESOURCESREGIONAL AND LOCAL
OBSERVATION NETWORKS.
The regional Water and Forestry office (DWAF) is responsible for the regional groundwater observation networks. The aim of these networks is to observe natural groundwater trends and water resource reactions to large-scale abstraction. Within the same area, the Catchments Management Agencies (CMA) may also operate large-scale abstraction and compliance observation networks. Water Users Associations (WUA) representing a group of water users can also manage observation networks in their area or will feed into the CMA networks. Individual water users like mines, municipalities, irrigators, industrial users are also expected to make groundwater observations to define the impact of their activities on water resources. Compliance of these users is reported to the CMA. It is also expected that these users keep records of their observations, capture observations onto databases and evaluate the trends. On request these users may be expected to report on their observations. Observation equipment can vary from common dipmeter readings to complicated electronic measuring and logging devices.
GROUNDWATER OBSERVATIONS
TRENDS AND STATUS OF GROUNDWATER RESOURCES
.
CRITERIA FOR REGIONAL OBSERVATION NETWORKS
A regional groundwater observation network is aimed at observing regionally representative water quantity (water levels) and water quality trends. It is impossible or too costly to observe trends at all boreholes or areas. It is therefore essential that observation points be chosen carefully. Natural factors that could influence changes in groundwater include the host rock, the precipitation, the evapotranspiration, drainage, vegetation to name but a few.Natural factors that influence groundwater conditionsThe host rock geology contributes to the water level and quality of water in the aquifer. In the Northern Cape (NC) region sediments of the Kalahari, fractures in the sedimentary Karoo, weathering and fractures in the crystalline rocks and karst in the dolomite host groundwater. Observations should be located to account for lateral and vertical groundwater occurrence.The precipitation, intensity and timing thereof also influence the positions and timing of groundwater observations. The precipitation in the Northern Cape region is summe r precipitation that varies from 600 to 200 mm in the east to a winter precipitation that varies from almost 0 to 400 mm in the west. The evaporation is also a major contributor with evaporation rates of more than 2000 mm from the west receding to between 1000 and 2000 mm. This evaporation to a large extent determines the evapotranspiration of plants and in riverbeds where plants do occur, water levels and quality is influenced. A network needs to account for the east west variation in precipitation and evapo-transpiration.
WATER USE IN CATCHMENTS AND STRESSED CATCHMENTS
The status of water use in each catchments can be evaluated by comparing the reserve determinations of each catchments with the registered water use for each catchments. For the 92 quaternary catchments of the area 31 reserves have been determined and if compared with the water use in each it is evident that 6 catchments are over allocated.
It is essential that extensive observation networks are operated in catchments where the allocation water is close to the potential of the catchments. Groundwater trends in red and orange catchments must therefore be observed for impacts. In these catchments extensive irrigation, mine/ industrial and municipal use take place. These economic activities are dependent on sustainable water resources based on long-term groundwater resource observations.
The map below indicate the areas where groundwater observations are made and the type of observation. In the area rainwater samples, groundwater samples are taken for recharge and quality purposes, with water level end use observations with dip, logging devices.
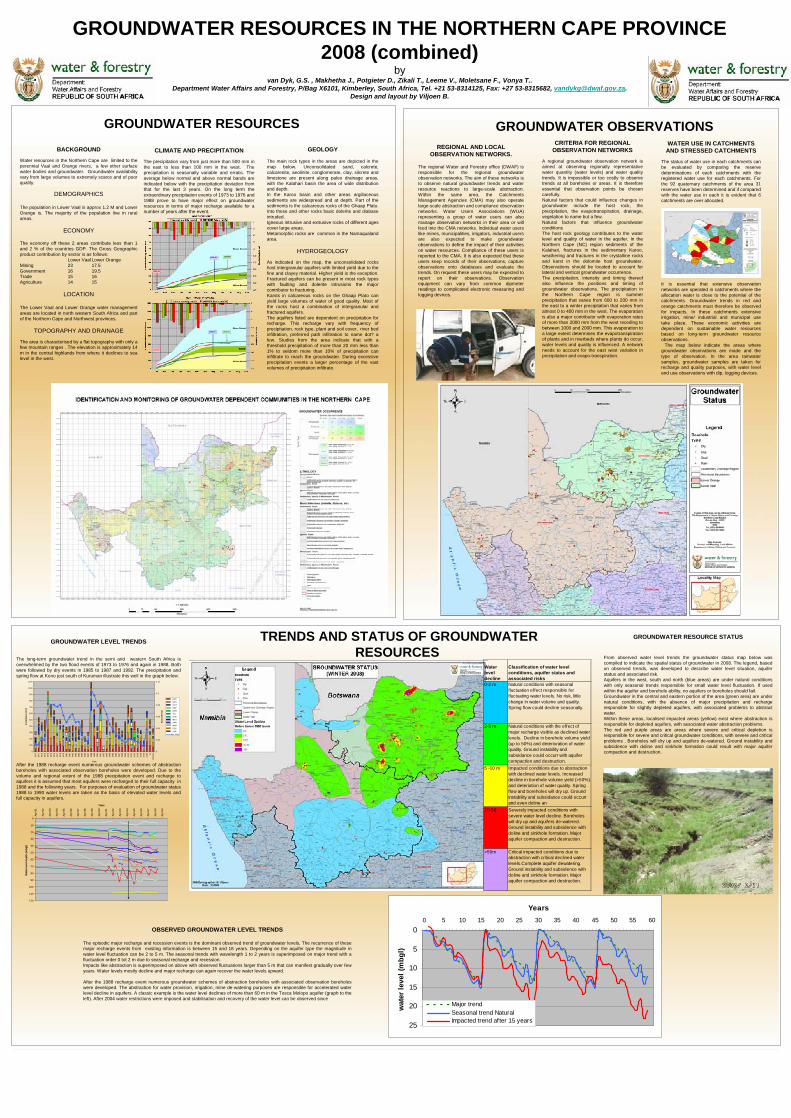
GROUNDWATER RESOURCES IN THE NORTHERN CAPE PROVINCE 2008 (combined)
byvan Dyk, G.S. , Makhetha J., Potgieter D., Zikali T., Leeme V., Moletsane F., Vonya T..
Department Water Affairs and Forestry, P/Bag X6101, Kimberley, South Africa, Tel. +21 53-8314125, Fax: +27 53-8315682, [email protected] and layout by Viljoen B.
BACKGROUND
Water resources in the Northern Cape are limited to the perennial Vaal and Orange rivers, a few other surface water bodies and groundwater. Groundwater availability vary from large volumes to extremely scarce and of poor quality.
DEMOGRAPHICS
The population in Lower Vaal is approx 1.2 M and Lower Orange is. The majority of the population live in rural areas.
ECONOMY
The economy off these 2 areas contribute less than 1 and 2 % of the countries GDP. The Gross Geographic product contribution by sector is as follows:
Lower Vaal Lower OrangeMining 23 17.5Government 16 19.5Trade 15 16Agriculture 14 15
LOCATION
The Lower Vaal and Lower Orange water management areas are located in north western South Africa and part of the Northern Cape and Northwest provinces.
TOPOGRAPHY AND DRAINAGE
The area is characterised by a flat topography with only a few mountain ranges . The elevation is approximately 14 m in the central highlands from where it declines to sea level in the west.
0
100
200
300
400
500
600
700
800
900
1000
1100
1970
1971
1972
1973
1974
1975
1976
1977
1978
1979
1980
1981
1982
1983
1984
1985
1986
1987
1988
1989
1990
1991
1992
1993
1994
1995
1996
1997
1998
1999
2000
2001
2002
2003
2004
2005
2006 A
vM
edia
n
Year
prec
ipita
tion
(mm
)
0
0.02
0.04
0.06
0.08
0.1
0.12
flow
(m3/
sek)
DEC NOV OCT SEP AUG JUL JUN MAY APR MAR FEB JAN Ave Flow
0
10
20
30
40
50
60
70
80
90
100
110
120
Apr
-91
Apr
-92
Apr
-93
Apr
-94
Apr
-95
Apr
-96
Apr
-97
Apr
-98
Apr
-99
Apr
-00
Apr
-01
Apr
-02
Apr
-03
Apr
-04
Apr
-05
Apr
-06
Apr
-07
Apr
-08
Apr
-09
Time
Wat
erle
vel d
epth
(mbg
l)
Water level decline
Classification of water level conditions, aquifer status and associated risks
0-2 m Natural conditions with seasonal fluctuation effect responsible for fluctuating water levels. No risk, little change in water volume and quality. Spring flow could decline seasonally.
2-5 m Natural conditions with the effect of major recharge visible as declined water levels. Decline in borehole volume yield (up to 50%) and deterioration of water quality. Ground instability and subsidance could occurr with aquifer compaction and destruction.
5 -10 m Impacted conditions due to abstraction with declined water levels. Increased decline in borehole volume yield (>50%) and deteriotion of water quality. Spring flow and boreholes will dry up. Ground instability and subsidance could occurr and even doline an
10-50 Severely impacted conditions with severe water level decline. Boreholes will dry up and aquifers de-watered. Ground instability and subsidence with doline and sinkhole formation. Major aquifer compaction and destruction.
>50m Critical impacted conditions due to abstraction with critical declined water levels.Complete aquifer dewatering. Ground instability and subsidence with doline and sinkhole formation. Major aquifer compaction and destruction.
GROUNDWATER LEVEL TRENDS
The long-term groundwater trend in the semi arid western South Africa is overwhelmed by the two flood events of 1973 to 1976 and again in 1988. Both were followed by dry events in 1985 to 1987 and 1992. The precipitation and spring flow at Kono just south of Kuruman illustrate this well in the graph below.
After the 1988 recharge event numerous groundwater schemes of abstraction boreholes with associated observation boreholes were developed. Due to the volume and regional extent of the 1988 precipitation event and recharge to aquifers it is assumed that most aquifers were recharged to their full capacity in 1988 and the following years. For purposes of evaluation of groundwater status 1988 to 1990 water levels are taken as the basis of elevated water levels and full capacity in aquifers.
GROUNDWATER RESOURCE STATUS
From observed water level trends the groundwater status map below was compiled to indicate the spatial status of groundwater in 2008. The legend, based on observed trends, was developed to describe water level situation, aquifer status and associated risk.Aquifers in the west, south and north (blue areas) are under natural conditions with only seasonal trends responsible for small water level fluctuation. If used within the aquifer and borehole ability, no aquifers or boreholes should fail. Groundwater in the central and eastern portion of the area (green area) are under natural conditions, with the absence of major precipitation and recharge responsible for slightly depleted aquifers, with associated problems to abstract water.Within these areas, localised impacted areas (yellow) exist where abstraction is responsible for depleted aquifers, with associated water abstraction problems.The red and purple areas are areas where severe and critical depletion is responsible for severe and critical groundwater conditions, with severe and critical problems . Boreholes will dry up and aquifers de-watered. Ground instability and subsidence with doline and sinkhole formation could result with major aquifer compaction and destruction.
OBSERVED GROUNDWATER LEVEL TRENDS
The episodic major recharge and recession events is the dominant observed trend of groundwater levels, The recurrence of these major recharge events from existing information is between 15 and 18 years. Depending on the aquifer type the magnitude in water level fluctuation can be 2 to 5 m. The seasonal trends with wavelength 1 to 2 years is superimposed on major trend with a fluctuation order 0 tot 2 m due to seasonal recharge and recession. Impacts like abstraction is superimposed on above with observed fluctuations larger than 5 m that can manifest gradually over few years. Water levels mostly decline and major recharge can again recover the water levels upward.
After the 1988 recharge event numerous groundwater schemes of abstraction boreholes with associated observation boreholes were developed. The abstraction for water provision, irrigation, mine de-watering purposes are responsible for accelerated water level decline in aquifers. A classic example is the water level declines of more than 60 m in the Tosca Molopo aquifer (graph to the left). After 2004 water restrictions were imposed and stabilisation and recovery of the water level can be observed since
0
5
10
15
20
25
0 5 10 15 20 25 30 35 40 45 50 55 60
Years
wat
er le
vel (
mbg
l)
Major trendSeasonal trend NaturalImpacted trend after 15 years

CLIMATE AND PRECIPITATION
The precipitation varies from just more than 500 mm in the east to less than 100 mm in the west. The precipitation is seasonally variable and erratic. The average below normal and above normal bands are indicated below with the precipitation deviation from that for the last 3 years. In the long term the extraordinary precipitation events of 1973 to 1976 and 1988 prove to have major effect on groundwater resources in terms of major recharge available for a number of years after the event.
GEOLOGY
The main rock types in the areas are depicted in the map below. Unconsolidated sand, calcrete, calcarenite, aeolinite, conglomerate, clay, silcrete and limestone are present along paleo drainage areas, with the Kalahari basin the area of wide distribution and depth. In the Karoo basin and other areas argillaceous sediments are widespread and at depth. Part of the sediments is the calcareous rocks of the Ghaap Plato. Into these and other rocks basic dolerite and diabase intruded. Igneous intrusive and extrusive rocks of different ages cover large areas to the east. Metamorphic rocks are common in the Namaqualand area.
HYDROGEOLOGY
As indicated on the map the unconsolidated rocks host intergranular aquifers with limited yield due to the fine and clayey material. Higher yield is the exception. Fractured aquifers can be present in most rock types with faulting and dolerite intrusions the major contributor to fracturing.Karsts in calcareous rocks on the Ghaap Plato can yield large volumes of water of good quality. Most of the rocks host a combination of intergranular and fractured aquifers. The aquifers listed are dependent on precipitation for recharge. This recharge vary with frequency of precipitation, rock type, plant and soil cover, river bed infiltration, preferred path infiltration to name but a few. Studies from the area indicate that with a threshold precipitation of more than 20 mm less than 1% to seldom more than 10% of precipitation can infiltrate to reach the groundwater. During excessive precipitation events a larger percentage of the vast volumes of precipitation infiltrate.
.
GROUNDWATER RESOURCES IN THE NORTHERN CAPE PROVINCE 2008
byvan Dyk, G.S. , Makhetha J., Potgieter D., Zikali T., Leeme V., Moletsane F., Vonya T..
Department Water Affairs and Forestry, P/Bag X6101, Kimberley, South Africa, Tel. +21 53-8314125, Fax: +27 53-8315682, [email protected] and layout by Viljoen B.
BACKGROUND
Water resources in the Northern Cape are limited to the perennial Vaal and Orange rivers, a few other surface water bodies and groundwater. Groundwater availability vary from large volumes to extremely scarce and of poor quality.
LOCATIONAND DEMOGRAPHICS
The Lower Vaal and Lower Orange water management areas are located in north western South Africa in the Northern Cape and Northwest provinces. The population in Lower Vaal is approx 1.2 M and Lower Orange 400 000. The majority of the population live in rural areas with a few urban centres.
ECONOMY
The economy off these 2 areas contribute less than 1 and 2 % of the countries GDP. The Gross Geographic product contribution by sector is as follow:
Lower Vaal Lower OrangeMining 23 17.5Government 16 19.5Trade 15 16Agriculture 14 15
TOPOGRAPHY AND DRAINAGE
The area is characterised by a flat topography with only a few mountain ranges. The elevation is approximately 1400m in the central high lands from where it declines to sea level in the west.

REGIONAL AND LOCAL OBSERVATION NETWORKS.
The regional Water and Forestry office (DWAF) is responsible for the regional groundwater observation networks. The aim of these networks is to observe natural groundwater trends and water resource reactions to large-scale abstraction. Within the same area, the Catchments Management Agencies (CMA) may also operate large-scale abstraction and compliance observation networks. Water Users Associations (WUA ) representing a group of water users can also manage observation networks in their area or will feed into the CMA networks. Individual water users like mines, municipalities, irrigators, and industrial users are also expected to make groundwater observations to define the impact of their activities on water resources. Compliance of these users is reported to the CMA. It is also expected that these users keep records of their observations, capture observations onto a database(s) and evaluate the trends. On request these users may be expected to report on their observations. Observation equipment can vary from common dip meter readings to complicated electronic measuring and logging devices.
.
CRITERIA FOR REGIONAL OBSERVATION NETWORKS
A regional groundwater observation network is aimed at observing regionally representative water quantity (water levels) and water quality trends. It is imposable impossible or too costly to observe trends at all boreholes or areas. It is therefore essential that observation points be chosen carefully. Natural factors that could influence changes in groundwater include the host rock, the precipitation, the evapotranspiration, drainage, and vegetation, to name but a few.The host rock geology contributes to the water level and quality of water in the aquifer. In the Northern Cape (NC) region sediments of the Kalahari, fractures in the sedimentary Karoo, weathering and fractures in the crystalline rocks and karst in the dolomite host groundwater. Observations should be located to account for lateral and vertical groundwater occurrence.The precipitation, intensity and timing thereof also influence the positions and timing of groundwater observations. The precipitation in the Northern Cape region is summer precipitation that varies from 600 to 200 mm in the east, to a winter precipitation that varies from almost 0 to 400 mm in the west. The evaporation is also a major contributor with evaporation rates of more than 2000 mm from the west receding to between 1000 and 2000 mm. This evaporation to a large extent determines the evapotranspiration of plants and in riverbeds, where plants do occur, water levels and quality are influenced. A network needs to account for the east-west variation in precipitation and evapotranspiration.
WATER USE IN CATCHMENTS AND STRESSED CATCHMENTS
The status of water use in each catchments can be evaluated by comparing the reserve determinations of each catchments with the registered water use for each catchments. For the 92 quaternary catchments of the area, 31 reserves have been determined and if compared with the water use in each, it is evident that 6 catchments are over-allocated.
It is essential that extensive observation networks are operated in catchments where the allocation water is close to the potential of the catchments. Groundwater trends in red and orange catchments must therefore be observed for impacts. In these catchments extensive irrigation, mine/ industrial and municipal use takes place. These economic activities are dependent on sustainable water resources, based on long-term groundwate r resource observations.
The map below indicates the areas where groundwater observations are made, as well as the type of observation. In the area rainwater samples and groundwater samples are taken for recharge and quality purposes with water level end use observations with dip, logging devices.
GROUNDWATER OBSERVATIONS IN THE NORTHERN CAPE PROVINCE 2008
byvan Dyk, G.S. , Makhetha J., Potgieter D., Zikali T., Leeme V., Moletsane F., Vonya T..
Department Water Affairs and Forestry, P/Bag X6101, Kimberley, South Africa, Tel. +21 53-8314125, Fax: +27 53-8315682, [email protected] and layout by Viljoen B.

.
TRENDS AND STATUS OF GROUNDWATER RESOURCESIN THE NORTHERN CAPE PROVINCE 2008
byvan Dyk, G.S. , Makhetha J., Potgieter D., Zikali T., Leeme V., Moletsane F., Vonya T..
Department Water Affairs and Forestry, P/Bag X6101, Kimberley, South Africa, Tel. +21 53-8314125, Fax: +27 53-8315682, [email protected] and layout by Viljoen B.
GROUNDWATER LEVEL TRENDS
The long-term groundwater trend in the semi-arid western South Africa is overwhelmed by the two flood events of 1973 to 1976 and again in 1988. Both were followed by dry events in 1985 to 1987 and 1992. The precipitation and spring flow at Kono just south of Kuruman illustrate this in the graph below.
After the 1988 recharge event, numerous groundwater schemes of abstraction boreholes with associated observation boreholes were developed. Due to the volume and regional extent of the 1988 precipitation event and recharge to aquifers, it is assumed that most aquifers were recharged to their full capacity in 1988 and the following years. For purposes of evaluation of groundwater status, 1988 to 1990 water levels are taken as the basis of elevated water levels and full capacity in aquifers.
0
100
200
300
400
500
600
700
800
900
1000
1100
1970
1971
1972
1973
1974
1975
1976
1977
1978
1979
1980
1981
1982
1983
1984
1985
1986
1987
1988
1989
1990
1991
1992
1993
1994
1995
1996
1997
1998
1999
2000
2001
2002
2003
2004
2005
2006 A
vM
edia
n
Year
prec
ipita
tion
(mm
)
0
0.02
0.04
0.06
0.08
0.1
0.12
flow
(m3/
sek)
DEC NOV OCT SEP AUG JUL JUN MAY APR MAR FEB JAN Ave Flow
GROUNDWATER RESOURCE STATUS
From observed water level trends the map showing groundwater status below was compiled to indicate the spatial status of groundwater in 2008. The legend is based on observed trends and was developed to describe water level situation, aquifer status and associated risk.Aquifers in the west, south and north (blue areas) are under natural conditions with only seasonal trends responsible for small water level fluctuation. If used within the aquifer and borehole ability, no aquifers or boreholes should fail. Groundwater in the central and eastern portion of the area (green area) is under natural conditions, with the absence of major precipitation and recharge responsible for slightly depleted aquifers, with associated problems to abstract water.Within these areas localised impacted areas (yellow) exist where abstraction is responsible for depleted aquifers, with associated water abstraction problems.The red and purple areas are areas where severe and critical depletion is responsible for severe and critical groundwater conditions with severe and critical problems. Boreholes will dry up and aquifers de-watered. Ground instability and subsidence with doline and sinkhole formation could result in major aquifer compaction and destruction.
0
10
20
30
40
50
60
70
80
90
100
110
120
Apr-91
Apr-92
Apr-93
Apr-94
Apr-95
Apr-96
Apr-97
Apr-98
Apr-99
Apr-00
Apr-01
Apr-02
Apr-03
Apr-04
Apr-05
Apr-06
Apr-07
Apr-08
Apr-09
Time
Wat
erle
vel d
epth
(mbg
l)
OBSERVED GROUNDWATER LEVEL TRENDS
The episodic major recharge and recession events are the dominant observed trends of groundwater levels. The recurrence of these major recharge events from existing information is between 15 and 18 years. Depending on the aquifer type, the magnitude in water level fluctuation can be 2 to 5m. The seasonal trends with wavelength 1 to 2 years is superimposed on major trend with fluctuation order of 0 tot 2m due to seasonal recharge and recession. Impacts, like abstraction, are superimposed on above with observed fluctuations larger than 5m that can manifest gradually over few years. Water levels mostly decline and major recharge can again recover the water levels upward.
The abstraction for water provision, irrigation and mine dewatering purposes is responsible for accelerated water level decline in aquifers. In well fields for water provision a few water levels declined to below 10 m. The biggest decline of water levels is more than 60 m in the Tosca Molopo aquifer (graph to the left). This was in reaction to over-abstraction for irrigation purposes. After 2004 water restrictions were imposed and stabilisation and recovery of the water level can be observed since then. At Sishen and Sishen South mine dewatering is also responsible for declines in excess of 50 m. These mines have extensive observation networks and agreements with proximate landowners and water users.
0
5
10
15
20
25
0 5 10 15 20 25 30 35 40 45 50 55 60
Years
wat
er le
vel (
mbg
l)
Major trendSeasonal trend NaturalImpacted trend after 15 years
5 -10 m Impacted conditions due to abstraction with declined water levels. Increased decline in borehole volume yield (>50%) and deterioration of water quality. Spring flow and boreholes will dry up. Ground instability and subsidence could occur and even doline an ?
10-50 Severely impacted conditions with severe water level decline. Boreholes will dry up and aquifers de-watered. Ground instability and subsidence with doline and sinkhole formation. Major aquifer compaction and destruction.
>50m Critical impacted conditions due to abstraction with critical declined water levels.Complete aquifer dewatering. Ground instability and subsidence with doline and sinkhole formation. Major aquifer compaction and destruction.