Embed Size (px)
Citation preview
Application of Hybrid Functional Groups to Predict ATP BindingProteins
Andreas N. MbahCenter for Bioinformatics & Computational Biology, Department of Biology, Jackson StateUniversity, Jackson, MS 39217, USA
AbstractThe ATP binding proteins exist as a hybrid of proteins with Walker A motif and universal stressproteins (USPs) having an alternative motif for binding ATP. There is an urgent need to find areliable and comprehensive hybrid predictor for ATP binding proteins using whole sequenceinformation. In this paper the open source LIBSVM toolbox was used to build a classifier at 10-fold cross-validation. The best hybrid model was the combination of amino acid and dipeptidecomposition with an accuracy of 84.57% and Mathews correlation coefficient (MCC) value of0.693. This classifier proves to be better than many classical ATP binding protein predictors. Thegeneral trend observed is that combinations of descriptors performed better and improved theoverall performances of individual descriptors, particularly when combined with amino acidcomposition. The work developed a comprehensive model for predicting ATP binding proteinsirrespective of their functional motifs. This model provides a high probability of success formolecular biologists in predicting and selecting diverse groups of ATP binding proteinsirrespective of their functional motifs.
1. IntroductionRecent advances in the next generation sequencing and human genome projects haveresulted in rapid increase of protein sequences, thus widening the protein sequence-structuregap [1, 2], leading to diverse protein functions from common family. Computationprediction tools for predicting protein structure and function are highly needed to narrow thewidening gap [3]. The ATP binding proteins (ATP-BPs) are a diverse family of proteins interms of amino acid sequences, function, and their three-dimensional structures. Theseproteins hydrolyze ATP to provide the energy necessary to drive biochemical reactions inthe cell [4]. There are two distinct functional groups of ATP binding proteins.
The first functional group has the Walker A motif [GXXXXGK (T/S) or G-4X-GK (T/S)] intheir sequences for ATP binding [5]. Many members are transmembrane proteins and areresponsible for transporting a wide variety of substrates across extra- and intracellularmembranes [6]. The biochemical functions of ATP binding proteins are well exhibitedwithin the ABC transporters group. In bacteria cell, ABC transporters pump substances suchas sugars, vitamins, and metal ions into the cell, while in eukaryotes they transportmolecules out of the cell [7]. They are also known to transport lipids and play a protective
Copyright © 2013 Andreas N. Mbah.
This is an open access article distributed under the Creative Commons Attribution License, which permits unrestricted use,distribution, and reproduction in any medium, provided the original work is properly cited.
Correspondence should be addressed to Andreas N. Mbah; [email protected].
Conflict of InterestsThe author reports no conflict of interests in this work including the mentioned trademarks.
NIH Public AccessAuthor ManuscriptISRN Comput Biol. Author manuscript; available in PMC 2014 April 09.
Published in final edited form as:ISRN Comput Biol. ; 2014: 581245–. doi:10.1155/2014/581245.
NIH
-PA Author Manuscript
NIH
-PA Author Manuscript
NIH
-PA Author Manuscript
role to the developing fetus against xenobiotics [7]. ABC transporters are crucial in thedevelopment of multidrug resistance, with the ATP binding sites exploitable as targets forchemotherapeutic agents [8]. The mechanism of action in multidrug transportation isunclear. However, one model called hydrophobic vacuum cleaner states that, in P-glycoprotein, the drugs are bound indiscriminately from the lipid phase based on theirhydrophobicity [9].
The second evolutionary diverse functional class of ATP binding proteins is called universalstress proteins (USPs). The universal stress proteins (USPs) are found in diverse group oforganisms like archaea, eubacteria, yeast, fungi, and plants; their expressions are triggeredby variety of environmental stressors [10]. These stressors might include but are not limitedto starvation of nutrients such as carbon, nitrogen, phosphate, sulfate and the required aminoacid and variety of toxicants and other agents such as heavy metals, oxidants, acids, heatshock, DNA damage, phosphate, uncouplers of the electron transport chain, and ethanol [11,12]. The USPs bind to ATP through the ATP binding motif [G-2X-G-9X-G(S/T)] [13].Members of the USPs will segregate into two groups based on whether or not they bind toATP [13].
Experimental efforts are underway to determine the function of newly discovered proteins[14], but these experimental methods are costly and time consuming and at times areunsuccessful, due to the complexity involved in protein crystallization process. Severalmethods had been studied based on predicting ATP binding residues from their knownstructural features but with low accuracies [15, 16]. Some predictors of ATP bindingproteins have been developed with promising results such as those in [17, 18], includingGreen et al. [19] article on an effective method to recognize ATP binding proteins by testingparallel cascade identification and KNN. Unfortunately these methods were adapted to ATPbinding proteins containing only the classical Walker A motif [G-4X-GK (T/S)] in theirsequences. The objective of this research reported here was to introduce a classifier builtfrom a pool of protein sequences containing both ATP binding motifs of G-4X-GK (T/S)and G-2X-G-9X-G(S/T). To achieve the objective, support vector machine (SVM) approachis proposed which predicts protein functions based on the discriminative features that mapprotein sequences to biological functions [20–23] using the sequence pool ATP hybridmotifs.
There is a need to develop an automated predictor for ATP binding USP encoded proteins tospeed experimental designs and study how these proteins function under diverseenvironmental stressors. This research has developed hybrid ATP binding protein predictorusing the open source LIBSVM toolbox classification. The best model was the combinationof amino acid and dipeptide composition of the sequences with an accuracy of 84.57% andMathews correlation coefficient (MCC) value of 0.693%. This model shows a strikingoverall performance in sensitivity (82.46%), specificity (87.00%), and precision (87.85%)with area under the ROC curve (AUC) value of 0.849219. The general trend shows thatcombinations of descriptors perform better and improved the overall performances ofindividual descriptors, particularly when combined with amino acid composition. Thismodel provides a high probability of success for molecular biologists in predicting andselecting diverse motif groups of ATP binding proteins.
2. Materials and Method2.1. Datasets
Balanced datasets of ATP and non-ATP binding proteins were constructed from the UniProtprotein database (UniProt release 2011_11) (http://www.uniprot.org/), Protein Data Bank(http://www.rcsb.org/pdb/home/home.do), IMG/M database (http://img.jgi.doe.gov/cgi-bin/
Mbah Page 2
ISRN Comput Biol. Author manuscript; available in PMC 2014 April 09.
NIH
-PA Author Manuscript
NIH
-PA Author Manuscript
NIH
-PA Author Manuscript
m/main.cgi), and published literatures [24–26] which contain diverse universal stressproteins.
2.1.1. Extraction of Walker A Motif Dataset—A total of 2000 protein sequences whichbelong to Walker A motif positive dataset were retrieved. Redundancy due to homologoussequences was removed using CD-HIT [27] and PISCES [28] servers at a threshold of 25%.This threshold statistically retains adequate number of protein sequences for analysis as wellas avoids bias that might result from high homology. Dataset obtained was manuallyreviewed through literature search and information from the protein data bank [2] to ensurethey represent ATP binding proteins. A total of 100 sequences were randomly selected fromthe original dataset and retained for training and testing to represent Walker A motif positive(ATP binding) dataset. The Walker A motif negative dataset (non-ATP binding) was takenfrom Yu et al. 2006 [29]. This was the “negative” dataset used for nucleic acid bindingproteins. This is because ATP binding proteins are members of nucleotide binding proteinfamily; hence the negative dataset used in [29] for predicting nucleotide binding proteinfamily was considered useful. Redundancy was also maintained at 25% threshold and eachprotein was verified to be non-ATP binding using both the literature and protein data bankinformation. A total of 100 sequences were also randomly selected from [29] and retainedfor training and testing to represent Walker A motif negative (non-ATP binding) dataset.
2.1.2. Extraction of USP Protein Dataset—The extracted USP sequences were testedfor the presence or absence of the G-2X-G-9X-G(S/T) motif in their sequences using theNCBI conserved domain search tool [30]. The USP sequences were divided into two groupsbased on the presence or absence of ATP binding motif [13].The redundancy was alsomaintained at 25% threshold and 100 sequences were selected for each class of proteins(200 sequences in total).
The overall summary of the data prepared for analysis was as follows: (i) 100 ATP bindingproteins with Walker A motif; (ii) 100 without ATP binding proteins without Walker Amotif, (iii) 100 USP sequences with ATP binding motif [G-2X-G-9X-G(S/T)], and (iv) 100USP sequences without ATP binding motif [G-2X-G-9X-G(S/T)].The 400 sequences wereseparated into two hybrid groups as follows: 200 ATP binding sequences and 200 sequenceswithout ATP binding motifs and were used to generate the feature vector. The feature vectorwas generated from the entire sequences of the proteins (not only the ATP-binding domains)via PROFEAT server using 1497 descriptor set [31]. Physicochemical and sequenceattributes of biologically informative were prioritized for investigation. The attributes wereincorporated into LIBSVM classifier to find the best hybrid model for predicting ATPbinding proteins.
2.2. LIBSVM ClassifierSupport vector machines (SVM) recognized objects to be classified as points in a high-dimensional space needing a hyperplane to separate them [32].The biological molecules arerepresented with descriptor set. With a proper mapping furnished by a kernel function, SVMclassifiers separate transformed data with a hyperplane in a high-dimensional space topredict the correct classification of protein functional classes. SVMs have been widely usedin supervised classification problems in bioinformatics, such as [33–36]. The LIBSVMpackage which is freely downloadable at (http://www.csie.ntu.edu.tw/~cjlin/libsvm) wasadopted and used to evaluate the attributes and build the final classifier, using the radialbasis function (RBF) as the kernel function [37–39].
A “grid-search” was employed to select the proper values of the parameter of RBF and thepenalty parameter (C) of the soft margin SVM. C was set to 2−5, 2−3,…, 215 and γ to 2−15,
Mbah Page 3
ISRN Comput Biol. Author manuscript; available in PMC 2014 April 09.
NIH
-PA Author Manuscript
NIH
-PA Author Manuscript
NIH
-PA Author Manuscript
2−13,…, 23. All the combinations of C and γ were tested and the pair with the best cross-validation accuracy for each feature set or combination of feature sets was selected. Asmaller γ value makes the decision boundary smoother. The SVM training parameter C isthe regularization factor, which controls the tradeoff between low training error and largemargin [37, 40]. Throughout this work, the parameter C was maintained at C = 4 after trialand error assessment as the best value. The optimal value of γ was obtained for eachdescriptor set for best results. The entire sets of attributes were evaluated in terms of theirassociation with ATP binding protein and a final subset with good predictive power wasselected. In this research a 10-fold cross validation (10CV) was implemented. The objectiveof training is to maximize the ability of the SVM predictor to discriminate between classeswhile avoiding overfitting.
2.3. Tenfold Cross-Validation AnalysisThe technique to evaluate any newly developed method has become a major challenge toinvestigators. The jack-knifing leave-one-out cross-validation (LOOCV) [41–43] is thepopular technique for evaluating models. During this procedure one sequence is used fortesting and the left over sequences are used for training. This process is repeated many timesand each sequence is used once for testing. Even though this method is popular, it iscomputer intensive with considerable labor time.
In this work, 10-fold cross-validation was used to train and test the dataset with sequencesrandomly partitioned into ten sets. This cross-validation ensures that the dataset was split atthe protein level in addition to the stratified partition, thus ensuring a more rigorousevaluation. During the procedure, the positive and negative data samples are distributedrandomly into 10 sets or the so-called fold. In each of the 10 round steps, 9 of the 10 sets areused to construct a classifier (training), and then the classifier is evaluated using theremaining set (testing). This procedure was repeated ten times in a manner where each setwas used for testing [44, 45]. The overall performance was the average of the performancesof all the 10 sets.
2.4. The LIBSVM Performance EvaluationThe standard parameters used in evaluating the performance of the LIBSVM are indicatedbelow. The overall accuracy (Acc) is the intuitive measurement of the performance on abalance dataset where as Matthew’s correlation coefficient (MCC) [46] is more realistic thanAcc in measuring performance when using an unbalanced dataset [47, 48]. When both MCCand Acc values are high, the overall performance of the predicted model is better. Inaddition to Acc and MCC, the following parameters below were also calculated. Sensitivityis the percentage of correctly predicted binding proteins to the total binding proteins.
True positive (TP).
True negative (TN).
False positive (FP) (false alarm).
False negative (FN).
False positive rate (FPR).
Sensitivity/recall or True positive rate (TPR) TPR = TP/P = TP/(TP + FN).
Precision = TP/(TP + FP).
Accuracy (Acc) = (TP + TN)/(P + N) = (TP + TN)/(TP + TN + FP + FN).
Specificity (SPC) SPC = TN/N= TN/(FP + TN) = 1 − FPR.
Mbah Page 4
ISRN Comput Biol. Author manuscript; available in PMC 2014 April 09.
NIH
-PA Author Manuscript
NIH
-PA Author Manuscript
NIH
-PA Author Manuscript
Matthew’s correlation coefficient (MCC).
((TP × TN) − (FP × FN))/[sqrt ((TN + FN) × (TN + FP) × (TP + FN) × (TP + FP))] OR
(1)
Here TP is the number of true positives (ATP-BPs), TN is the number of true negatives (nonATP-BPs), FP is the number of false positives, and FN is the number of false negatives. 2.5.Area under the ROC Curve (AUC) for LIBSVM. It is a plot between true positive proportion(TP/TP + FN) and false positive proportion (FP/FP + TN). The StatsDirect was usedpackage to plot ROC and calculates the area under the ROC curve directly by an extendedtrapezoidal rule [49]. The confidence interval was constructed using DeLong’s varianceestimate [50] embedded in the statistic package.
3. Results and DiscussionThe ATP binding proteins are known to play key roles in the biochemical functioning of thecell. In signaling pathways ATP molecules are substrates for protein kinase phosphorylation.It is difficult to identify ATP binding proteins due to lack of experimentally determinedprotein structures [51–53]. This is because the growth of protein sequences from variousgenomic projects exceeds the capacity of experimental techniques in determining proteinstructures and their binding reactions which are time consuming and at times unsuccessful.Therefore there is an urgent need to develop automated expert methods for determining thefunctional class of proteins such ATP binding proteins from their primary sequenceinformation.
The general assumption here is that every protein that binds to ATP molecule either USPs orthose having Walker A motif will have some common features embedded in their sequences.In both the USP (G-2X-G-9X-G(S/T)) and Walker A (G-4X-GK (T/S))motifs, the G, K, T,and S denote glycine, lysine, threonine, and serine, respectively, and X denotes any aminoacid residue. The lysine (K) residue in the Walker A motif is crucial for nucleotide binding[54] in this class of proteins. It interacts with the phosphate groups of the nucleotide andwith the magnesium ion, which coordinates the β - and γ -phosphates of the ATP molecule[55, 56].
The universal stress proteins bind to ATP through the ATP binding motif G-2X-G-9X-G(S/T), with the-G(S)/T as essential residues for ATP binding and phosphorylation [13].Therefore, members of this class of proteins will segregate into two groups, based onwhether or not they bind to ATP [13, 57]. Thus, it is important to identify ATP bindingUSPs and other ATP binding proteins. Several methods have been studied based onpredicting ATP interacting residues if the protein structures are known, with some resultsshowing very low accuracies [15, 16, 58, 59]. This work has predicted ATP binding proteinsin general with high accuracy irrespective of their structural information using SVMclassifier. The training and prediction statistics for each of the descriptor sets used werevisualized and discussed below. The visualizations were constructed using Tableau PublicSoftware (http://www.tableausoftware.com/public).
The objective in this report was to find the best descriptor set which can be use to build apredictive model for a reliable and effective server for predicting ATP-BPs in general,irrespective of their subfunctional classes. Throughout this work, the parameter C wasmaintained at C = 4, while the optimal value of γ for each descriptor was obtained and usedin evaluating their performances. Their performances were evaluated based on five
Mbah Page 5
ISRN Comput Biol. Author manuscript; available in PMC 2014 April 09.
NIH
-PA Author Manuscript
NIH
-PA Author Manuscript
NIH
-PA Author Manuscript
computed parameters consisting of their accuracies, sensitivities, specificities, precisions,and MCC, after a 10-fold cross validation (CV10).
The performance of pseudo amino acid composition was evaluated with only accuracy dueto lack of sufficient sequence information. The lengths of the color coded descriptors wereused as a measure of their performances. In terms of accuracy the best descriptor was thecombination of amino acid with dipeptide composition (84.57%), followed by amino acidcomposition alone (83.64%), dipeptide composition (83.17%), and Norm M-Bautocorrelation in that order (Figure 1).The pseudo amino acids and Quasi sequence orderdescriptors performed poorly compared to the other descriptors. However, the overallperformances of the other descriptors were better as most of them registered accuracy valuesgreater than 70.00%. These high performers might be due to the rigorous refinement ofprotein sequences. Thus protein function classification with SVM classifiers can beimproved drastically using rigorously refined protein sequences.
The individual performances of amino acid composition (83.64%) and dipeptidecomposition (83.17%) were increased to 84.57% when both descriptors were combinedtogether. This indicates that the combination of descriptors can enhance the individualperformance of other descriptors, particularly those combining with amino acidcomposition. This is a binary classification problem involving a balance dataset andaccuracy (Acc) is the best parameter for evaluating performance based on balance datasetwhere as Matthew’s correlation coefficient (MCC) is more realistic than Acc when using anunbalanced dataset [47, 48]. But when both MCC and Acc values are high, the overallperformance of the predicted model is better.
The performances of the models were evaluated based on MCC (Figure 2). The pyramidalview and the length of the color coded descriptors were used for performance visualization.The best performer was amino acid and dipeptide composition in combination (0.6931)followed by amino acid composition (0.6765), dipeptide composition (0.6637), and NormM-B autocorrelation (0.6449) in that order. This order is in line with their performancesmeasured using accuracy as the parameter. This result justifies the performance of theoverall model. In general the combination of descriptor sets performs better than individualdescriptors, particularly when combined with amino acid composition.
Therefore from the statistical point of view the use of combination sets particularly withamino acid composition tend to give better prediction performance than individual-sets [53].The amino acid composition generally increases the overall accuracies of other descriptorsin combination. One of the shortcoming of amino acid composition as a descriptor is that thesame amino acid composition may correspond to diverse sequences due to the loss ofsequence order [28, 60]. This sequence order information can be partially covered bycombination with dipeptide composition, but dipeptide composition itself lacks informationon the fraction of the individual residue in the sequence, as such a combination set isexpected to give a better prediction result [27, 61] as shown above due to masking effect.
The models were further investigated based on their sensitivity to predict ATP-BPs and theresults displayed in pyramidal view (Figure 3). The most sensitive descriptor was aminoacid composition (0.875) followed by dipeptide composition (0.8381), amino acid/dipeptidecomposition in combination (0.8246), and Norm M-B autocorrelation (0.8224) in that order.
These descriptors were among the best four performers in terms of Acc and MCC.Evaluation based on specificity indicates that amino acid composition (0.87) was morespecific followed by using the entire feature set (0.8478), Quasi sequence order descriptors(0.8333), and dipeptide composition (0.8257) in that order (Figure 4). This informationhighlights the vital role played by amino acid composition in protein function predictions in
Mbah Page 6
ISRN Comput Biol. Author manuscript; available in PMC 2014 April 09.
NIH
-PA Author Manuscript
NIH
-PA Author Manuscript
NIH
-PA Author Manuscript
general. Interestingly the Quasi sequence order descriptors (0.9626) had the highestprecision followed by amino acid and dipeptide composition in combination (0.8785), entirefeature set (0.8692), and Transition (0.8411) in that order (Figure 5).
The overall model evaluation shows that the amino acids and dipeptide composition was thebest model for predicting ATP-BPs from diverse functional classes using whole sequenceinformation. The use of “all the descriptor” set did not generally result in a better model inclassification. The “all features” descriptor accuracy was 79.9% against 84.57% for aminoacids/dipeptide in combination. This finding is in accordance with [62, 63], on their work onmolecular descriptors for predicting compounds of specific properties using “all features”set. The reduction in accuracy might be due to noise generated by the use of manyoverlapping and redundant descriptors. Hence the accuracy of the classifier algorithms canbe severely degraded by the presence of noisy or irrelevant features, or if the feature scalesare not consistent with their importance in solving the classification problem in question.The performance of the SVM model using ROC plot (Figure 6) has a value of AUC of0.849219. This highlights a better model based on whole sequence analysis.
4. ConclusionsThe prediction of ATP-binding proteins has been exploited using a battery of descriptor setsand a hybrid functional group. Also for the first time the prediction of ATP binding inuniversal stress proteins had been investigated using the support vector machine. The besthybrid model was the combination of amino acid and dipeptide composition of thesequences with an accuracy of 84.57% and Mathews correlation coefficient (MCC) value of0.693. The general trend is that combination of descriptors will perform better and improvethe overall performances of individual descriptors, particularly when combined with aminoacid composition. This model provides a high probability of success for molecular biologistsin predicting and selecting diverse groups of ATP binding proteins.
AcknowledgmentsThe research reported was supported by the National Institutes of Health (NIH-NIGMS-1T36GM095335) and theNational Science Foundation (EPS-0903787; EPS-1006883). The content is solely the responsibility of the authorand does not necessarily represent the official views of the funding agencies.
References1. Bairoch A, Apweiler R. The SWISS-PROT protein sequence database and its supplement TrEMBL
in 2000. Nucleic Acids Research. 2000; 28(1):45–48. [PubMed: 10592178]
2. Berman HM, Westbrook J, Feng Z, et al. The protein data bank. Nucleic Acids Research. 2000;28(1):235–242. [PubMed: 10592235]
3. Guo J, Chen H, Sun Z, Lin Y. A novel method for protein secondary structure prediction using dual-layer SVM and profiles. Proteins. 2004; 54(4):738–743. [PubMed: 14997569]
4. Bustamante C, Chemla YR, Forde NR, Izhaky D. Mechanical processes in biochemistry. AnnualReview of Biochemistry. 2004; 73:705–748.
5. Walker JE, Saraste M, Runswick MJ, Gay NJ. Distantly related sequences in the alpha- and beta-subunits of ATP synthase, myosin, kinases and other ATP-requiring enzymes and a commonnucleotide binding fold. The EMBO Journal. 1982; 1(8):945–951. [PubMed: 6329717]
6. Hirokawa N, Takemura R. Biochemical and molecular characterization of diseases linked to motorproteins. Trends in Biochemical Sciences. 2003; 28(10):558–565. [PubMed: 14559185]
7. Gedeon C, Behravan J, Koren G, Piquette-Miller M. Transport of glyburide by placental ABCtransporters: implications in fetal drug exposure. Placenta. 2006; 27(11–12):1096–1102. [PubMed:16460798]
Mbah Page 7
ISRN Comput Biol. Author manuscript; available in PMC 2014 April 09.
NIH
-PA Author Manuscript
NIH
-PA Author Manuscript
NIH
-PA Author Manuscript
8. Maxwell A, Lawson DM. The ATP-binding site of type II topoisomerases as a target forantibacterial drugs. Current Topics in Medicinal Chemistry. 2003; 3(3):283–303. [PubMed:12570764]
9. Ashida H, Oonishi T, Uyesaka N. Kinetic analysis of the mechanism of action of the multidrugtransporter. Journal of Theoretical Biology. 1998; 195(2):219–232. [PubMed: 9822564]
10. Kvint K, Nachin L, Diez A, Nystrom T. The bacterial universal stress protein: function andregulation. Current Opinion in Microbiology. 2003; 6(2):140–145. [PubMed: 12732303]
11. Nystrom T, Neidhardt FC. Cloning, mapping and nucleotide sequencing of a gene encoding auniversal stress protein in Escherichia coli. Molecular Microbiology. 1992; 6(21):3187–3198.[PubMed: 1453957]
12. Diez A, Gustavsson N, Nystrom T. The universal stress protein a of Escherichia coli is required forresistance to DNA damaging agents and is regulated by a RecA/FtsK-dependent regulatorypathway. Molecular Microbiology. 2000; 36(6):1494–1503. [PubMed: 10931298]
13. Sousa MC, Mckay DB. Structure of the universal stress protein of Haemophilus influenzae.Structure. 2001; 9(12):1135–1141. [PubMed: 11738040]
14. Promponas VJ, Ouzounis CA, Iliopoulos I. Experimental evidence validating the computationalinference of functional associations from gene fusion events: a critical survey. Briefings inBioinformatics. 2012
15. Chauhan JS, Mishra NK, Raghava GP. Identification of ATP binding residues of a protein fromitsprimary sequence. BMC Bioinformatics. 2009; 10:article 434.
16. Guo T, Shi Y, Sun Z. A novel statistical ligand-binding site predictor: application to ATP-bindingsites. Protein Engineering, Design and Selection. 2005; 18(2):65–70.
17. Chen K, Mizianty MJ, Kurgan L. ATPsite: sequence-based prediction of ATP-binding residues.Proteome Science. 2011; 9(supplement 1):article S4.
18. Zhang YN, Yu DJ, Li SS, Fan YX, Huang Y, Shen HB. Predicting protein-ATP binding sites fromprimary sequence through fusing bi-profile sampling of multi-view features. BMC Bioinformatics.2012; 13:article 118.
19. Green JR, Korenberg MJ, David R, Hunter IW. Recognition of adenosine triphosphate bindingsites using parallel cascade system identification. Annals of Biomedical Engineering. 2003; 31(4):462–470. [PubMed: 12723687]
20. Garg A, Bhasin M, Raghava GPS. Support vector machine-based method for subcellularlocalization of human proteins using amino acid compositions, their order, and similarity search.The Journal of Biological Chemistry. 2005; 280(15):14427–14432. [PubMed: 15647269]
21. Ahmad S, Gromiha MM, Sarai A. Analysis and prediction of DNA-binding proteins and theirbinding residues based on composition, sequence and structural information. Bioinformatics.2004; 20(4):477–486. [PubMed: 14990443]
22. Xiao X, Wang P, Chou KC. GPCR-CA: a cellular automaton image approach for predicting G-protein-coupled receptor functional classes. Journal of Computational Chemistry. 2009; 30(9):1414–1423. [PubMed: 19037861]
23. Kumar M, Gromiha MM, Raghava GPS. Prediction of RNA binding sites in a protein using SVMand PSSM profile. Proteins. 2008; 71(1):189–194. [PubMed: 17932917]
24. Williams BS, Isokpehi RD, Mbah AN, et al. Functional annotation analytics of bacillus genomesreveals stress responsive acetate utilization and sulfate uptake in the biotechnologically relevantbacillus megaterium. Bioinformatics and Biology Insights. 2012; 6:275–286. [PubMed: 23226010]
25. Isokpehi RD, Mahmud O, Mbah AN, et al. Developmental regulation of genes encoding universalstress proteins in Schistosoma mansoni. Gene Regulation and Systems Biology. 2011; 5:61–74.[PubMed: 22084571]
26. Mbah AN, Mahmud O, Awofolu OR, Isokpehi RD. Inferences on the biochemical andenvironmental regulation of universal stress proteins from Schistosomiasis parasites. Advancesand Applications in Bioinformatics and Chemistry. 2013; 6:15–27. [PubMed: 23696708]
27. Li W, Jaroszewski L, Godzik A. Clustering of highly homologous sequences to reduce the size oflarge protein databases. Bioinformatics. 2001; 17(3):282–283. [PubMed: 11294794]
28. Wang G, Dunbrack RL Jr. PISCES: a protein sequence culling server. Bioinformatics. 2003;19(12):1589–1591. [PubMed: 12912846]
Mbah Page 8
ISRN Comput Biol. Author manuscript; available in PMC 2014 April 09.
NIH
-PA Author Manuscript
NIH
-PA Author Manuscript
NIH
-PA Author Manuscript
29. Yu X, Cao J, Cai Y, Shi T, Li Y. Predicting rRNA-, RNA-, and DNA-binding proteins fromprimary structure with support vector machines. Journal of Theoretical Biology. 2006; 240(2):175–184. [PubMed: 16274699]
30. Marchler-Bauer A, Zheng C, Chitsaz F, et al. CDD: conserved domains and protein three-dimensional structure. Nucleic Acids Research. 2013; 41:D348–D352. [PubMed: 23197659]
31. Li ZR, Lin HH, Han LY, Jiang L, Chen X, Chen YZ. PROFEAT: a web server for computingstructural and physicochemical features of proteins and peptides from amino acid sequence.Nucleic Acids Research. 2006; 34:W32–W37. [PubMed: 16845018]
32. Bikadi Z, Hazai I, Malik D, et al. Predicting P-glycoprotein-mediated drug transport based onsupport vector machine and three-dimensional crystal structure of P-glycoprotein. PLoS ONE.2011; 6(10):Article ID e25815.
33. Lo SL, Cai CZ, Chen YZ, Chung MCM. Effect of training datasets on support vector machineprediction of protein-protein interactions. Proteomics. 2005; 5(4):876–884. [PubMed: 15717327]
34. Brown MP, Grundy WN, Lin D, et al. Knowledge-based analysis of microarray gene expressiondata by using support vector machines. Proceedings of the National Academy of Sciences of theUnited States of America. 2000; 97(1):262–267. [PubMed: 10618406]
35. Furey TS, Cristianini N, Duffy N, Bednarski DW, Schummer M, Haussler D. Support vectormachine classification and validation of cancer tissue samples using microarray expression data.Bioinformatics. 2000; 16(10):906–914. [PubMed: 11120680]
36. Chou KC, Cai YD. Predicting protein-protein interactions from sequences in a hybridization space.Journal of Proteome Research. 2006; 5(2):316–322. [PubMed: 16457597]
37. Matheny ME, Resnic FS, Arora N, Ohno-Machado L. Effects of SVM parameter optimization ondiscrimination and calibration for post-procedural PCI mortality. Journal of BiomedicalInformatics. 2007; 40(6):688–697. [PubMed: 17600771]
38. Javed, F.; Chan, GS.; Savkin, AV., et al. RBF kernel based support vector regression to estimatethe blood volume and heart rate responses during hemodialysis. Proceedings of the AnnualInternational Conference of the IEEE Engineering in Medicine and Biology Society (EMBC ’09);2009. p. 4352-4355.
39. Chang CC, Lin CJ. Training nu-support vector classifiers: theory and algorithms. NeuralComputation. 2001; 13(9):2119–2147. [PubMed: 11516360]
40. Cherkassky V, Ma Y. Practical selection of SVM parameters and noise estimation for SVMregression. Neural Networks. 2004; 17(1):113–126. [PubMed: 14690712]
41. Chou KC, Zhang CT. Prediction of protein structural classes. Critical Reviews in Biochemistry andMolecular Biology. 1995; 30:275–349. [PubMed: 7587280]
42. Chen C, Chen L, Zou X, Cai P. Prediction of protein secondary structure content by using theconcept of Chou’s pseudo amino acid composition and support vector machine. Protein andPeptide Letters. 2009; 16(1):27–31. [PubMed: 19149669]
43. Ding H, Luo L, Lin H. Prediction of cell wall lytic enzymes using chou’s amphiphilic pseudoamino acid composition. Protein and Peptide Letters. 2009; 16(4):351–355. [PubMed: 19356130]
44. Bondia J, Tarin C, Garcia-Gabin W, et al. Using support vector machines to detect therapeuticallyincorrect measurements by the MiniMed CGMS. Journal of Diabetes Science and Technology.2008; 2:622–629. [PubMed: 19885238]
45. Chen S, Zhou S, Yin FF, Marks LB, Das SK. Investigation of the support vector machinealgorithm to predict lung radiation-induced pneumonitis. Medical Physics. 2007; 34(10):3808–3814. [PubMed: 17985626]
46. Matthews BW. Comparison of the predicted and observed secondary structure of T4 phagelysozyme. Biochimica et Biophysica Acta. 1975; 405(2):442–451. [PubMed: 1180967]
47. Bao L, Cui Y. Prediction of the phenotypic effects of non-synonymous single nucleotidepolymorphisms using structural and evolutionary information. Bioinformatics. 2005; 21(10):2185–2190. [PubMed: 15746281]
48. Dobson RJ, Munroe PB, Caulfield MJ, Saqi MAS. Predicting deleterious nsSNPs: an analysis ofsequence and structural attributes. BMC Bioinformatics. 2006; 7:article 217.
49. Hanley JA, Mcneil BJ. The meaning and use of the area under a receiver operating characteristic(ROC) curve. Radiology. 1982; 143(1):29–36. [PubMed: 7063747]
Mbah Page 9
ISRN Comput Biol. Author manuscript; available in PMC 2014 April 09.
NIH
-PA Author Manuscript
NIH
-PA Author Manuscript
NIH
-PA Author Manuscript
50. Delong ER, DeLong DM, Clarke-Pearson DL. Comparing the areas under two or more correlatedreceiver operating characteristic curves: a nonparametric approach. Biometrics. 1988; 44(3):837–845. [PubMed: 3203132]
51. Chothia C, Lesk AM. The relation between the divergence of sequence and structure in proteins.The EMBO Journal. 1986; 5(4):823–826. [PubMed: 3709526]
52. Lesk AM, Chothia C. How different amino acid sequences determine similar protein structures: thestructure and evolutionary dynamics of the globins. Journal of Molecular Biology. 1980; 136(3):225–270. [PubMed: 7373651]
53. Hilbert M, Bohm G, Jaenicke R. Structural relationships of homologous proteins as a fundamentalprinciple in homology modeling. Proteins. 1993; 17(2):138–151. [PubMed: 8265562]
54. Hanson PI, Whiteheart SW. AAA+ proteins: have engine, will work. Nature Reviews MolecularCell Biology. 2005; 6(7):519–529.
55. Ferguson KM, Higashijima T, Smigel MD, Gilman AG. The influence of bound GDP on thekinetics of guanine nucleotide binding to G proteins. The Journal of Biological Chemistry. 1986;261(16):7393–7399. [PubMed: 3086311]
56. Jurnak F, Mcpherson A, Wang AHJ, Rich A. Biochemical and structural studies of the tetragonalcrystalline modification of the Escherichia coli elongation factor Tu. The Journal of BiologicalChemistry. 1980; 255(14):6751–6757. [PubMed: 6993478]
57. Zarembinski TI, Hung LIW, Mueller-Dieckmann HJ, et al. Structure-based assignment of thebiochemical function of a hypothetical protein: a test case of structural genomics. Proceedings ofthe National Academy of Sciences of the United States of America. 1998; 95(26):15189–15193.[PubMed: 9860944]
58. Saito M, Go M, Shirai T. An empirical approach for detecting nucleotide-binding sites on proteins.Protein Engineering, Design and Selection. 2006; 19(2):67–75.
59. Sobolev V, Sorokine A, Prilusky J, Abola EE, Edelman M. Automated analysis of interatomiccontacts in proteins. Bioinformatics. 1999; 15(4):327–332. [PubMed: 10320401]
60. Schapire RE, Singer Y. Boostexter: a boosting-based system for text categorization. MachineLearning. 2000; 39(2–3):135–168.
61. Ong SA, Lin HH, Chen YZ, Li ZR, Cao Z. Efficacy of different protein descriptors in predictingprotein functional families. BMC Bioinformatics. 2007; 8:article 300.
62. Xue L, Bajorath J. Molecular descriptors in chemoinformatics, computational combinatorialchemistry, and virtual screening. Combinatorial Chemistry and High Throughput Screening. 2000;3(5):363–372. [PubMed: 11032954]
63. Xue L, Godden JW, Bajorath J. Evaluation of descriptors and mini-fingerprints for theidentification of molecules with similar activity. Journal of Chemical Information and ComputerSciences. 2000; 40(5):1227–1234. [PubMed: 11045818]
Mbah Page 10
ISRN Comput Biol. Author manuscript; available in PMC 2014 April 09.
NIH
-PA Author Manuscript
NIH
-PA Author Manuscript
NIH
-PA Author Manuscript
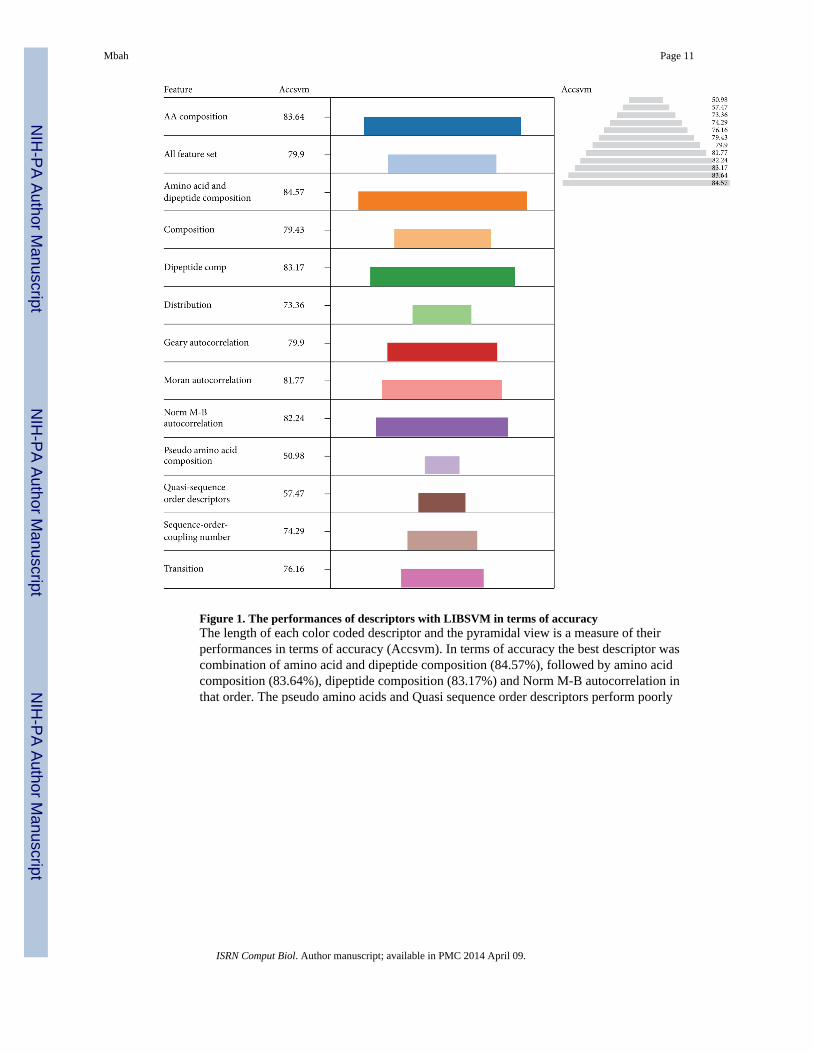
Figure 1. The performances of descriptors with LIBSVM in terms of accuracyThe length of each color coded descriptor and the pyramidal view is a measure of theirperformances in terms of accuracy (Accsvm). In terms of accuracy the best descriptor wascombination of amino acid and dipeptide composition (84.57%), followed by amino acidcomposition (83.64%), dipeptide composition (83.17%) and Norm M-B autocorrelation inthat order. The pseudo amino acids and Quasi sequence order descriptors perform poorly
Mbah Page 11
ISRN Comput Biol. Author manuscript; available in PMC 2014 April 09.
NIH
-PA Author Manuscript
NIH
-PA Author Manuscript
NIH
-PA Author Manuscript
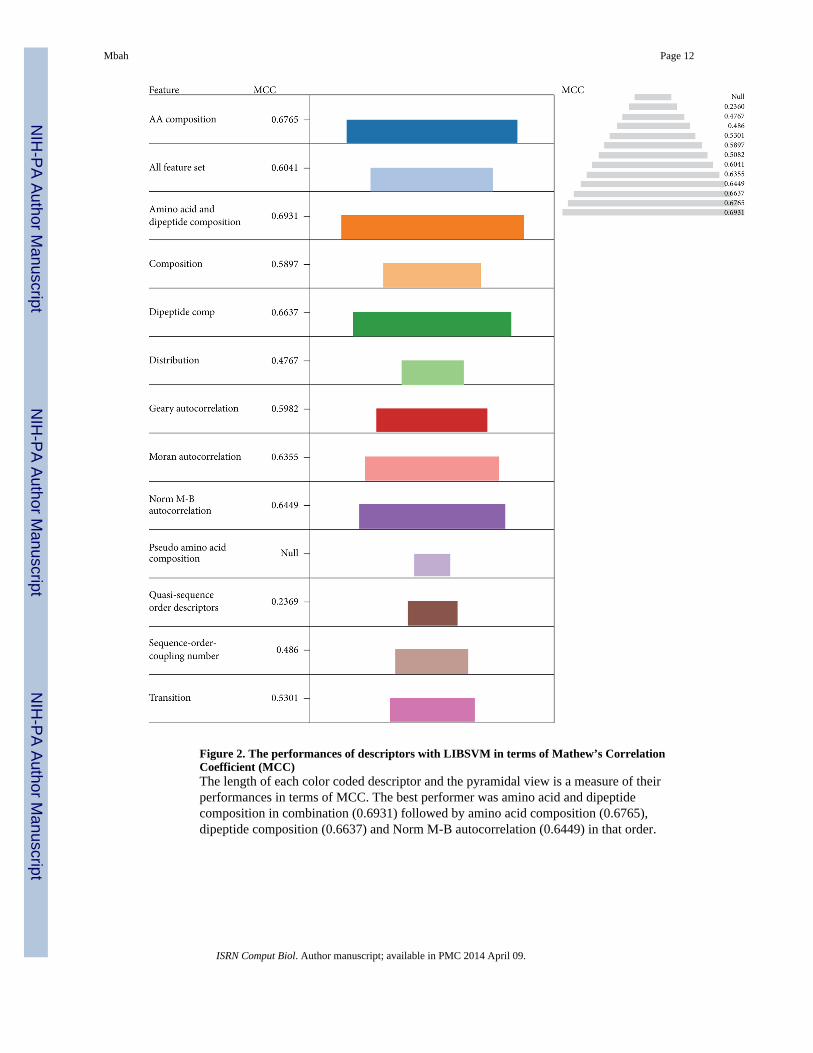
Figure 2. The performances of descriptors with LIBSVM in terms of Mathew’s CorrelationCoefficient (MCC)The length of each color coded descriptor and the pyramidal view is a measure of theirperformances in terms of MCC. The best performer was amino acid and dipeptidecomposition in combination (0.6931) followed by amino acid composition (0.6765),dipeptide composition (0.6637) and Norm M-B autocorrelation (0.6449) in that order.
Mbah Page 12
ISRN Comput Biol. Author manuscript; available in PMC 2014 April 09.
NIH
-PA Author Manuscript
NIH
-PA Author Manuscript
NIH
-PA Author Manuscript
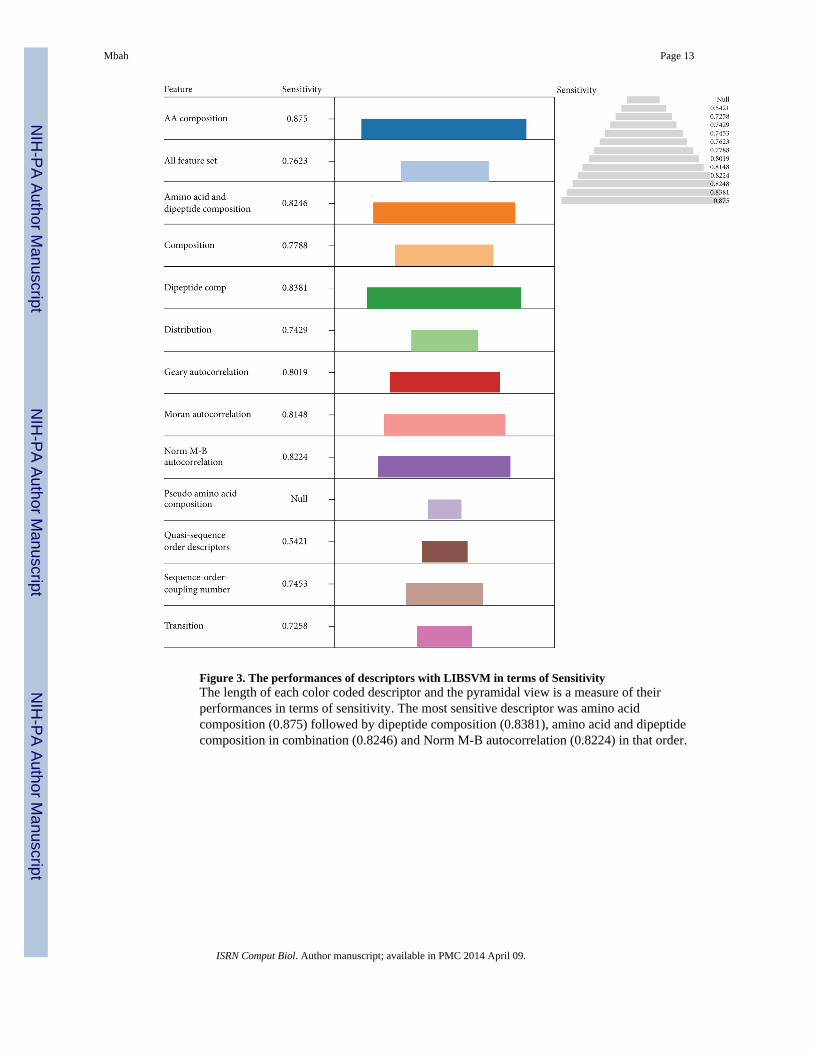
Figure 3. The performances of descriptors with LIBSVM in terms of SensitivityThe length of each color coded descriptor and the pyramidal view is a measure of theirperformances in terms of sensitivity. The most sensitive descriptor was amino acidcomposition (0.875) followed by dipeptide composition (0.8381), amino acid and dipeptidecomposition in combination (0.8246) and Norm M-B autocorrelation (0.8224) in that order.
Mbah Page 13
ISRN Comput Biol. Author manuscript; available in PMC 2014 April 09.
NIH
-PA Author Manuscript
NIH
-PA Author Manuscript
NIH
-PA Author Manuscript
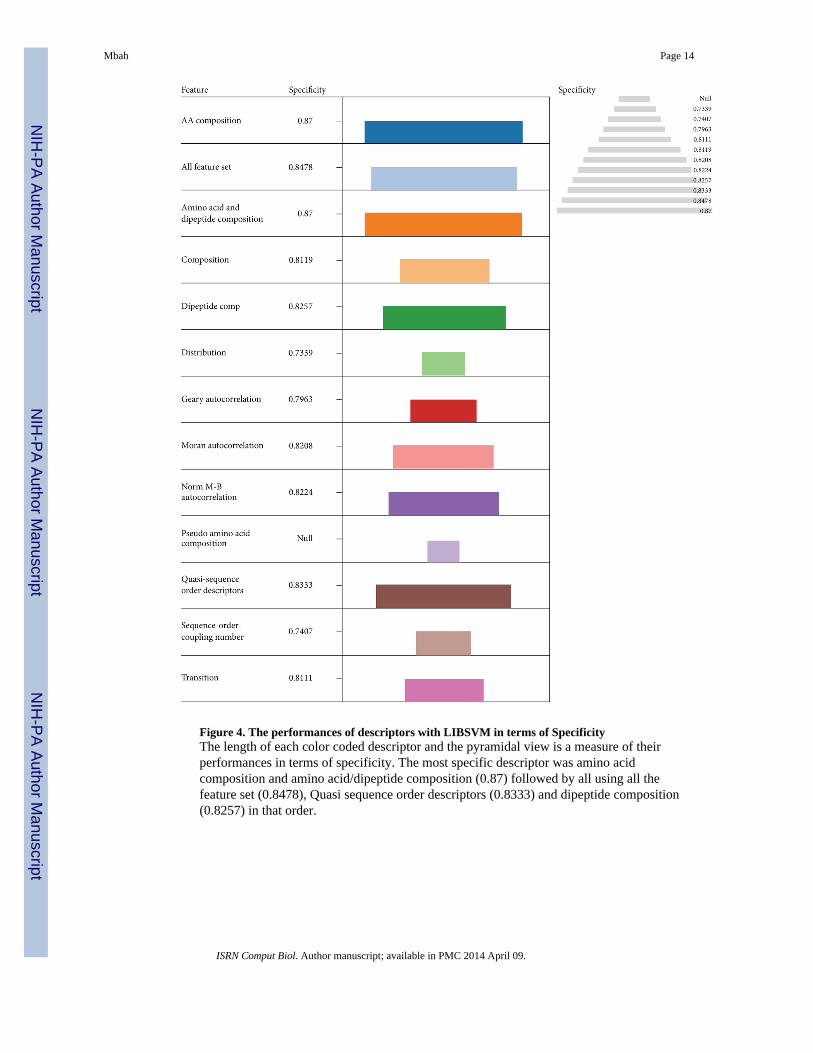
Figure 4. The performances of descriptors with LIBSVM in terms of SpecificityThe length of each color coded descriptor and the pyramidal view is a measure of theirperformances in terms of specificity. The most specific descriptor was amino acidcomposition and amino acid/dipeptide composition (0.87) followed by all using all thefeature set (0.8478), Quasi sequence order descriptors (0.8333) and dipeptide composition(0.8257) in that order.
Mbah Page 14
ISRN Comput Biol. Author manuscript; available in PMC 2014 April 09.
NIH
-PA Author Manuscript
NIH
-PA Author Manuscript
NIH
-PA Author Manuscript
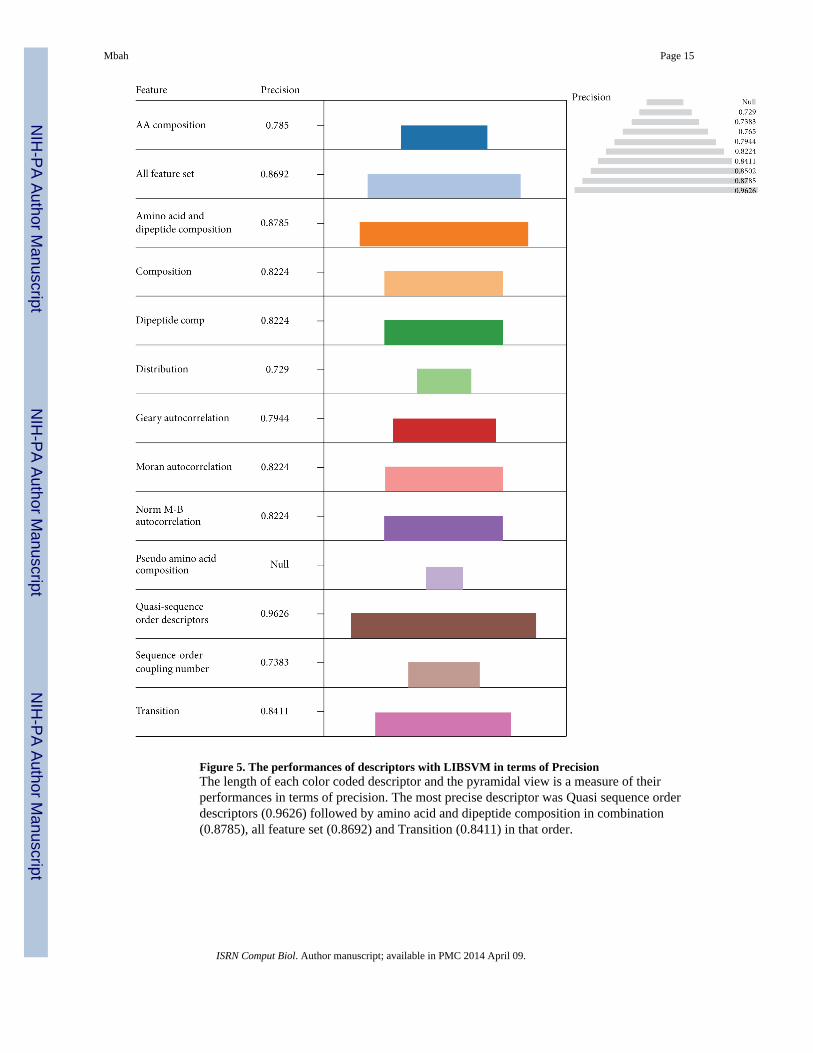
Figure 5. The performances of descriptors with LIBSVM in terms of PrecisionThe length of each color coded descriptor and the pyramidal view is a measure of theirperformances in terms of precision. The most precise descriptor was Quasi sequence orderdescriptors (0.9626) followed by amino acid and dipeptide composition in combination(0.8785), all feature set (0.8692) and Transition (0.8411) in that order.
Mbah Page 15
ISRN Comput Biol. Author manuscript; available in PMC 2014 April 09.
NIH
-PA Author Manuscript
NIH
-PA Author Manuscript
NIH
-PA Author Manuscript
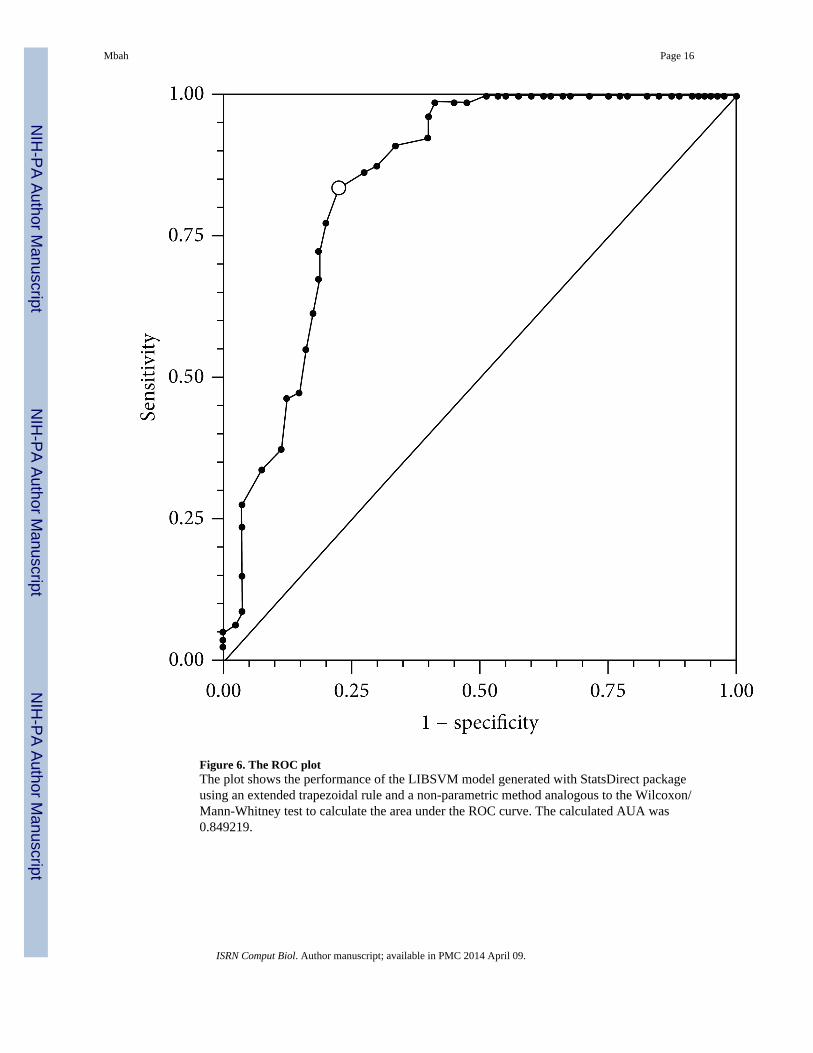
Figure 6. The ROC plotThe plot shows the performance of the LIBSVM model generated with StatsDirect packageusing an extended trapezoidal rule and a non-parametric method analogous to the Wilcoxon/Mann-Whitney test to calculate the area under the ROC curve. The calculated AUA was0.849219.
Mbah Page 16
ISRN Comput Biol. Author manuscript; available in PMC 2014 April 09.
NIH
-PA Author Manuscript
NIH
-PA Author Manuscript
NIH
-PA Author Manuscript