Embed Size (px)
Citation preview

A FINITE ELEMENT ANALYSIS OF A BOA CONSTRICTOR SKULL
AND
THE DESIGN OF A JAW BONE TRANSDUCER
by
AVINASH REDDY TADI
A THESIS
Submitted in partial fulfillment of the requirements
for the degree of Master of Science in the
Department of Aerospace Engineering and Mechanics
in the Graduate School of
The University of Alabama
TUSCALOOSA, ALABAMA
2011

Copyright Avinash Reddy Tadi 2011
ALL RIGHTS RESERVED

ii
ABSTRACT
The purpose of this research is to analyze the finite element model of a Boa constrictor
skull and design a transducer at the jaw bone to measure the forces applied during feeding. The
concepts in mechanics are applied to simulate and study the behavior of jaws while feeding.. In
this study, the images of the skull of a boa constrictor were scanned to obtain the precise size and
shape of each of the bones inside. The specimen was scanned using the X-ray micro tomography
procedure. This process left several regions in the finite element model unconnected. These
regions are corrected using the software HYPERMESH. The loading and boundary conditions
along with the various properties like the Elastic modulus, Poisson’s ratio are given to the FE
model in ABAQUS before analyzing it. Electrical resistance strain gauges are simulated to have
attached to the jawbone at two different points. The strain measured is then used to find out the
forces that caused it, by using the various concepts and principles in solid and continuum
mechanics. Electrical resistance strain gauges, numerical methods, moments of inertia are some
of the commonly used terms in this analysis.
iii
DEDICATION
To my dear parents,
Shri. GangiReddy Tadi and Smt. SaradaReddy Tadi.

iv
LIST OF ABBREVIATIONS AND SYMBOLS
FEA Finite element analysis
GF Gauge Factor
in. Inch
mm. Millimeter
cm. Centimeter
g gram
3D Three dimensional
CT Computed tomography
*.INP Input file
Gpa Giga Pascal
C Centigrade
F Force
A Cross sectional Area
Stress
Strain
Longitudinal Strain
Transverse Strain
Microstrain
L Total Length
Change in length
v
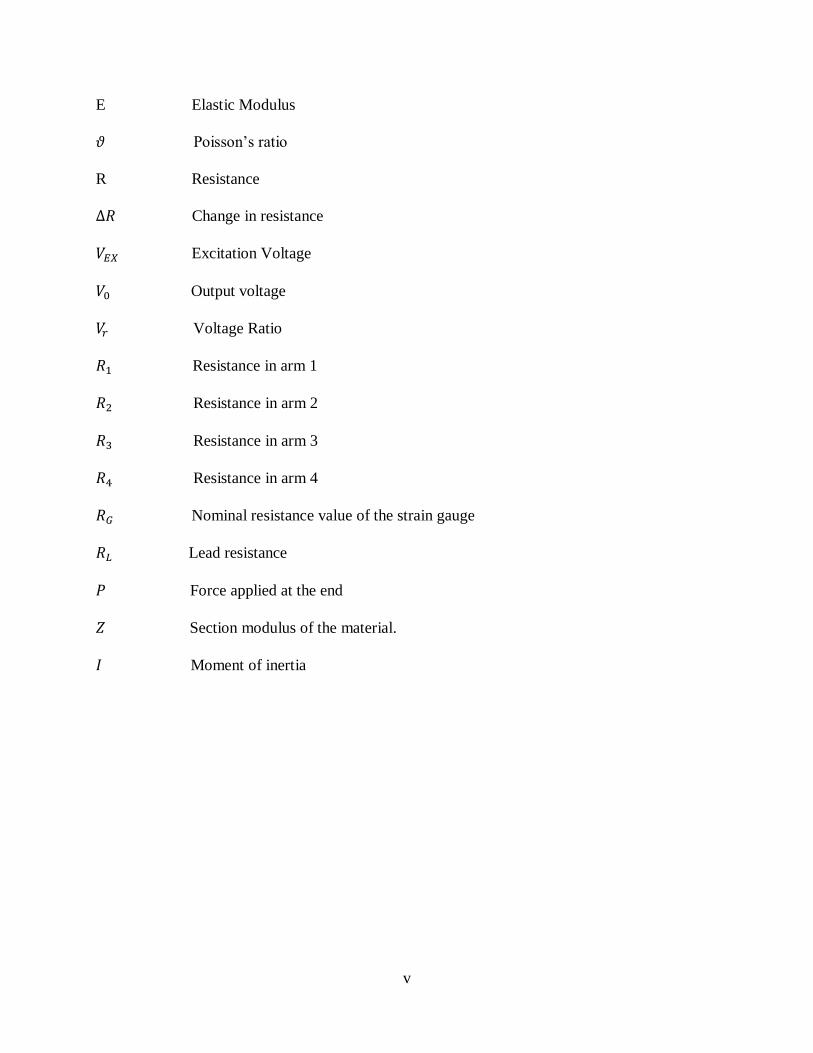
E Elastic Modulus
Poisson’s ratio
R Resistance
Change in resistance
Excitation Voltage
Output voltage
Voltage Ratio
Resistance in arm 1
Resistance in arm 2
Resistance in arm 3
Resistance in arm 4
Nominal resistance value of the strain gauge
Lead resistance
Force applied at the end
Section modulus of the material.
Moment of inertia

vi
ACKNOWLEDGEMENTS
It is with a deep sense of gratitude that I acknowledge the excellent guidance, patience
and support of my advisor Dr. Mark E. Barkey throughout my studies and the period of this
thesis. Also, I would like to express my sincere thanks and appreciation to my committee
members, Dr. John E. Jackson and Dr. James Richardson for their valuable comments and
suggestions.
I wish to thank my parents, Shri. GangiReddy Tadi and Smt. SaradaReddy Tadi, who
have always been a source of moral support, inspiration and encouragement. Finally, I wish to
thank all my friends for being there and making my stay in Tuscaloosa a very memorable one.

vii
CONTENTS
ABSTRACT…………………………………………………………………………………….. .ii
DEDICATION……………………………………………………………………………………iii
LIST OF ABBREVIATIONS AND SYMBOLS……………………………………………..….iv
ACKNOWLEDGEMENTS…………………………………………………………………..…..vi
LIST OF FIGURES……………………………………………………………..……………..…ix
CHAPTER 1: INTRODUCTION………………………………………………..……………..…1
CHAPTER 2: LITERATURE REVIEW……………………………….………..……………..…4
2.1 FINITE ELEMENT ANALYSIS………………………………………..………..………..…4
2.2 STRUCTURAL ANALYSIS………………………………………..……………………..…5
2.3 STRAIN GAUGE…………………..……………………………..….…………………..…5
2.4 BOA CONSTRICTORS………………………………………….…….…………………..…7
CHAPTER 3: MESHING AND MODELLING PROCEDURES………………………..………9
3.1 SPECIMEN…………………………………………………………..……………………..…5
3.2. MICROTOMOGRAPHY……………………….…………………..……………………..…5
3.3. FEA MODELING………………………………………..……………………...………..…10
3.4. COMPONENTS………………………………………..…………………….....………..…11
3.5. ANALYSIS OF THE MODEL…………………..…………………….....……..……..…22
3.5.1. MESHING IN HYPERMESH……..…………………….....………....……..…22
3.5.2. CORRECTING THE MODEL……..………….……………….....……..……..…22
3.5.3 EXPORTING THE MODEL FROM HYPERMESH……….....……..…….…..…23
3.5.4. IMPORTING THE MODEL INTO ABAQUS……….....……………....……..…23
3.5.5. PREPARING THE ABAQUS MODEL……….....……………………...……..…23
viii
3.5.6. EXAMINING THE ABAQUS MODEL……….....……………………..……..…24
3.6. JAW ANALYSIS……….....…………………………………………………….....……..…25
3.7 MATERIAL PROPERTIES………………………………………………….....…….…..…28
3.8 TITANIUM AS AN IMPLANT MATERIAL………………………………….....……..…28
CHAPTER 4: DESIGN OF THE TRANSDUCER………………..……………………...…..…29
4.1. FORCE TRANSDUCERS……………………………………….....………………...…..…29
4.1.1. CONCEPT OF MEASURING FORCES…………….......………………...…..…29
4.1.2. ELECTRICAL RESISTANCE STRAIN GAUGE MEASUREMENTS…………29
4.2. STRAIN GAUGE……………………………………….....…………………….…...…..…30
4.3. STRAIN MEASUREMENT………………………….....…………………….……...…..…31
4.3.1. STRESS AND STRAIN…………….....…………………….……...…..………...32
4.3.2. STRAIN GAUGE MEASUREMENT…………………….……...……..………...33
4.3.3 STRAIN GAUGE EQUATIONS…………………….……...…………..………...38
4.4. DESIGN OF THE TRANSDUCER…………………………...……...…………..………...39
CHAPTER 5: RESULTS AND CONCLUSIONS…………………………….…..…..………...44
5.1 COMPARISON OF THE THEORETICAL AND EXPERIMENTAL VALUES ………....44
REFERENCES…………………….……...…………………………………….....…..………...50

ix
LIST OF FIGURES
3.1: Full Model of the Boa skull in ABAQUS……………………………………………..……11
3.2: Central part of the Boa skull in ABAQUS………………………………………….………12
3.3: Jaw upper part of the Boa skull in ABAQUS……………………………………….………13
3.4: Mandible part of the Boa skull in ABAQUS………………………………………..………14
3.5: Maxilla part of the Boa skull in ABAQUS…………………………………………….……15
3.6: Pterygoid part of the Boa skull in ABAQUS………………………………………….……16
3.7: Quadrate part of the Boa skull in ABAQUS……………………………………………...…17
3.8: Spine part of the Boa skull in ABAQUS……………………………………………………18
3.9: Supratemporal part of the Boa skull in ABAQUS…………………………………………..19
3.10: Vomer part of the Boa skull in ABAQUS…………………………………………………20
3.11: Jaw bone before the analysis in ABAQUS………………………………………………...26
3.12: Jaw bone after the analysis in ABAQUS…………………………………………………..27
4.1: Wheatstone bridge…………………………………………………………………………..34
4.2: Quarter Bridge………………………………………………………………………………35
4.3: Cantilever with two strain gauges…………………………………………………………..35
4.4: Wheatstone half bridge……………………………………………………………………...36
4.5: Wheatstone full bridge………………………………………………………………………37
4.6: A Cantilever beam…………………………………………………………………………..39
4.7: Cantilever beam with the two strain gauges. ……………………………………………….42

x
4.8: Wheatstone full bridge………………………………………………………………………43
5.1: Jaw bone before the analysis in ABAQUS………………………………………………….47
5.2: Jaw bone with the boundary conditions, strain gauges & the applied loads……..…………48
5.3: Jaw bone after the analysis in ABAQUS……………………………………………………49

1
CHAPTER 1
INTRODUCTION
In the field of engineering analysis, Finite Element Analysis (FEA) has been a useful
analysis tool in many industries since the late 1970’s because of the phenomenal increase in
computing power and the rapid decline in the cost of computers. FEA has been developed to an
incredible precision and present day supercomputers are now able to produce accurate results for
all kinds of parameters[1]. FEA as an engineering analysis tool has undergone development over
the last half century. Modern FEA programs simulate static, dynamic, linear, nonlinear, thermal,
modal, and random vibrations[2]. FEA provides solutions to the tasks of failure and fatigue
prediction due to known or unknown stresses by finding the areas in a structure and allowing
designers to see all of the theoretical stresses within the structure. This method of product design
and testing is superior to the manufacturing costs which would accrue if each sample was
actually built and tested.[3]
Dr. Scott Boback had the idea of making the mechanical models of live snakes. In this
research, a boa constrictor skull is modeled and analyzed using FEA with the purpose to design a
jaw bone transducer. By using FEA, the transducer can be designed before making a prototype.
The primary interest in this research is the Boa constrictor skull.
The Boa constrictor skull is a highly evolved complex structure. It is characterized by
mobility, flexibility, and a greatly reduced number of bones, with numerous joints to allow the
snake to swallow prey far larger than its head[4]. The bones within the snake skull are not fused,

2
but loosely attached by ligaments. This allows the expansion and flexion of the skull itself
necessary to engulf prey. The two bottom jaws are not fused together as in mammals [4].
The jaws were given the material properties of Titanium. Titanium is a low density,
strong, corrosion resistant material and easily fabricated. The two most useful properties of the
metal form are corrosion resistance and the highest strength-to-weight ratio of any metal. It is
often used for surgical implants. A variety of implants of many designs are made from this metal
in its pure form or the alloy form. Strength and long lasting properties of a material are the most
desired properties of any material to be used in bone implants.
This research mainly revolves around the forces acting on the jaw and their measurement
using a transducer.
Thesis organization :
The current study is conducted in two phases.
Phase 1:
1. Analyzing the meshed model of the Boa constrictor skull to check for irregularities and
accuracy of the meshing and other aspects.
2. Analyzing each and every component in the skull for its compatibility with the other
components surrounding it in the skull.
3. Building necessary connectors in between the components.
4. Applying proper boundary conditions and loads to check the flow of stresses from one
end to the other end of the skull.
3
Phase 2:
1. Simulating strain gauges on the jawbone to record the strain in the jaw bone when forces
are applied.
2. Design a transducer in such a way that it uses the strain recorded to find out the forces
applied automatically.
In phase 1, the software packages ABAQUS and HYPERMESH are extensively used for all
the main steps like meshing, applying loads and boundary conditions, analyzing the stress flow,
to build the connectors. Thus the objective of the research is to save a lot of manufacturing costs
of the specimen by running a simulation and analyzing it in FEA.
This thesis starts with an introductory chapter (Chapter 1). A brief background on FEA, The
objectives and phases of this research are stated.
Chapter 2 reviews the related literature.
Chapter 3 presents the details of the specimen, meshing techniques, modeling procedures,
steps of analysis. This chapter is the core of the thesis as the validity of the model is determined
in this chapter.
Chapter 4 describes the construction of a transducer, working of a strain gauge and its
application to measure stresses.

4
CHAPTER 2
LITERATURE REVIEW
In this chapter, the general aspects of Finite Element analysis, Structural analysis, Strain
gauges and the biological aspects of Boa constrictors are reviewed.
2.1. FINITE ELEMENT ANALYSIS
Finite Element analysis is less expensive than physical experiments but still requires
substantial preparation and execution time. There has been a considerable interest in developing
and applying design of experiments methods.[5] Improvements in the experiments require better
modeling and simulation. Theoretical and experimental investigations of metals and metal
models have been extensively carried out using various techniques.[6] On the other hand,
complicated mechanisms usually in metal assemblies and machinery has been a great interest to
researchers. Many researchers have been focusing on computer modeling and simulation of the
models. Research methodologies have been formulated to solve many complicated problems
arising in the modeling and simulation.
The process in which the system is subdivided into their individual components or
elements whose behavior is readily understood and then rebuilding the original system from such
components to study its behavior is a natural way in which an engineer carries out his
experiments or studies.[7]
The existence of a unified treatment of standard discrete problems leads us to the first
definition of the finite element analysis as a method of approximation to continuum problems
such that,[7]
5
a. The continuum is divided into a finite number of parts or elements, the behavior of which
is specified by a finite number of parameters and
b. The solution of the complete system as an assembly of its elements follows precisely the
same rules as those applicable to standard discrete problems.
2.2. STRUCTURAL ANALYSIS
Structural analysis is the prediction of the performance of a given structure under
prescribed loads and other external effects. The analysis of a structure usually involves
determination of stresses, moments, deflections and support reactions[8].
Many structures are arranged in symmetric forms. A symmetric structure is linearly
elastic. The response of the entire structure under any general loading can be obtained from the
response of one of its portions separated by the axes of symmetry. It is sufficient to analyze a
portion of the symmetric structure. This reduces the computational effort required in the analysis
of symmetric structures.
Structures can either have a single axis of symmetry or multiple axes of symmetry.
2.3 STRAIN GAUGE
The strain gauge was invented by Edward E. Simmons and Arthur C. Ruge in 1938. A
strain gauge typically consists of an insulating flexible backing which supports a metallic foil
pattern. The gauge is attached to the object by a suitable adhesive. As the specimen deforms, the
foil deforms, causing its electrical resistance to change. This resistance change, usually measured
using a Wheatstone bridge, is related to the strain by the quantity known as the GF, gauge factor.
There are a number of different applications for strain gages.[9]
Experimental stress analysis. Diagnosis on machines and failure analysis.
multi axial stress fatigue testing, proof testing

6
residual stress
vibration measurement
torque measurement
bending and deflection measurement
compression and tension measurement
strain measurement
The deformation of an object can be measured by mechanical, optical, acoustical, pneumatic,
and electrical means. The earliest strain gages were mechanical devices that measured strain by
measuring the change in length and comparing it to the original length of the object.[10]
The most widely used characteristic that varies in proportion to strain is electrical resistance.
The capacitance and inductance-based strain gages are also constructed, but these devices'
sensitivity to vibration and their mounting requirements, and circuit complexity have limited
their application[10].
The metallic foil-type strain gage consists of a grid of wire filament (a resistor) of
approximately 0.001 in. (0.025 mm) thickness, bonded directly to the strained surface by a thin
layer of epoxy resin[11].
When a load is applied to the surface, the resulting change in surface length is communicated
to the resistor and the corresponding strain is measured in terms of the electrical resistance of the
foil wire, which varies linearly with strain[10]. The foil diaphragm and the adhesive bonding
agent must work together in transmitting the strain, while the adhesive must also serve as an
electrical insulator between the foil grid and the surface. When choosing a strain gage, one must
consider the strain characteristics of the sensor, and its stability and temperature sensitivity[10].
The most desirable strain gage materials are also sensitive to temperature variations and tend to

7
change resistance as they age. For tests of short duration, this may not be a serious concern, but
for continuous industrial measurement, one must include temperature and drift
compensation.[12]
Each strain gage wire material has its characteristic gage factor, resistance, temperature
coefficient of gage factor, thermal coefficient of resistivity, and stability. Typical materials
include Constantan (copper-nickel alloy), Nichrome V (nickel-chrome alloy), platinum alloys, or
semiconductor materials. The most popular alloys used for strain gages are copper-nickel alloys
and nickel-chromium alloys.[13]
The piezoresistive characteristics of germanium and silicon exhibit substantial
nonlinearity and temperature sensitivity, and also have gage factors more than fifty times, and
sensitivity more than a 100 times, that of metallic wire or foil strain gages[13].
The first semiconductor (silicon) strain gages were developed for the automotive
industry. As opposed to other types of strain gages, semiconductor strain gages depend on the
piezoresistive effects of silicon or germanium and measure the change in resistance with stress as
opposed to strain. [14]
In summary, the ideal strain gage is small size and mass, low cost, easily mounted and
attached, and highly sensitive to strain but insensitive to ambient or process temperature
variations.
2.4 BOA CONSTRICTORS:
A Boa Constrictor skeleton consists primarily of the skull, vertebrae, and ribs. The
primary interest in this research is the skull. The skull is a highly evolved complex structure
which is characterized by mobility, flexibility, and a greatly reduced number of bones, with
numerous joints to allow swallowing prey far larger than its head. There are also several hinge

8
joints located at various points that allow the movement and slight rotation of certain segments.
Most of the bones within the skull are not fused, but rather loosely attached by ligaments. This
allows the expansion and flexion of the skull to engulf prey. The two bottom jaws are not fused
together as in mammals. Instead, the dental bones are connected via a ligament
This research mainly revolves around the forces acting on the jaw and their measurement
using a transducer.
9
CHAPTER 3
MESHING AND MODELLING PROCEDURES
3.1. SPECIMEN
A Boa constrictor specimen was collected in Panama by H. C. Clark. It was made
available to The University of Texas High-Resolution X-ray CT Facility for scanning by Dr.
Jessie Maisano of The University of Texas at Austin and Mr. Alan Resetar of the Field Museum.
The specimen was scanned by the X ray microtomography procedure by Matthew Colbert on 27
April 2004 along the coronal axis for a total of 555 slices. The basic 3D model of the specimen is
obtained from the process MicroTomography.
3.2. Microtomography:
Microtomography uses x-rays to create cross-sections of a 3D-objects that later can be
used to recreate a virtual model without destroying the original model[15]. Tomography is a
technique for digitally cutting a specimen open using X-rays to reveal its interior details. A CT
image is typically called a slice[16]. A typical digital image is composed of pixels (picture
elements), a CT slice image is composed of voxels (volume elements). The term micro is used to
indicate that the pixel sizes of the cross-sections are in the micrometer range.[17]
By directing the X-rays through the slice plane from multiple orientations and measuring
their resultant decrease in intensity, a CT image can be produced. A specialized algorithm is then
used to reconstruct the distribution of X-ray attenuation in the slice plane[18]. By acquiring a
stacked, contiguous series of CT images, data describing an entire volume can be obtained. The

10
software allows reconstruction of objects from the stack of 2D sections, after interactive
thresholding[19]. Using a specialized surface rendering algorithm, these 3D models were
reconstructed.
The CT scans were converted into an .inp file (INPUT FILE) for ABAQUS by Dr.
Mohammed Akhter at Creighton University in Lincoln, Nebraska. However, this process is
imperfect and several regions in the finite element model were unconnected and the model was
not scaled properly. The scaling of the model was done by Dr. Mark Barkey in HYPERMESH
and ABAQUS.
3.3. FEA MODELING
The FEA modeling consisted of four steps:
• Importing the model.
• Examining the mesh for defects and correcting them.
• Specification of the material property.
• Specification of boundary and loading conditions.

11
3.4. COMPONENTS
The final model consists of nine components assembled into a single model. The 9
components are
1. Central
2. Jaw upper
3. Mandible
4. Maxilla
5. Pterygoid
6. Quadrate
7. Spine
8. Supratemporal
9. Vomer

12
The picture below shows all the 9 components of the boa skull assembled into one single
component.
Figure 3.1: Full Model of the Boa skull in ABAQUS

13
Central:
Figure 3.2: Central part of the Boa skull in ABAQUS

14
Jaw upper:
Figure 3.3: Jaw upper part of the Boa skull in ABAQUS

15
Mandible:
Figure 3.4: Mandible part of the Boa skull in ABAQUS

16
Maxilla :
Figure 3.5: Maxilla part of the Boa skull in ABAQUS

17
Pterygoid:
Figure 3.6: Pterygoid part of the Boa skull in ABAQUS
18
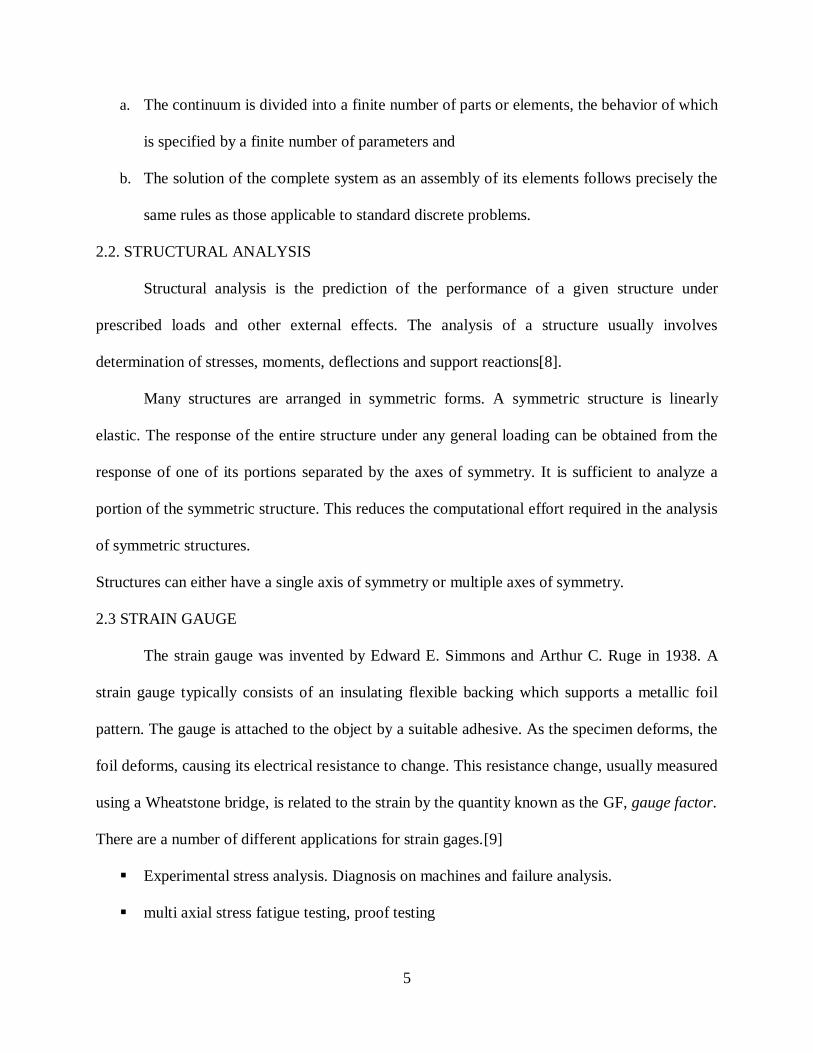
Quadrate :
Figure 3.7: Quadrate part of the Boa skull in ABAQUS

19
Spine:
Figure 3.8: Spine part of the Boa skull in ABAQUS

20
Supratemporal:
Figure 3.9: Supratemporal part of the Boa skull in ABAQUS
21
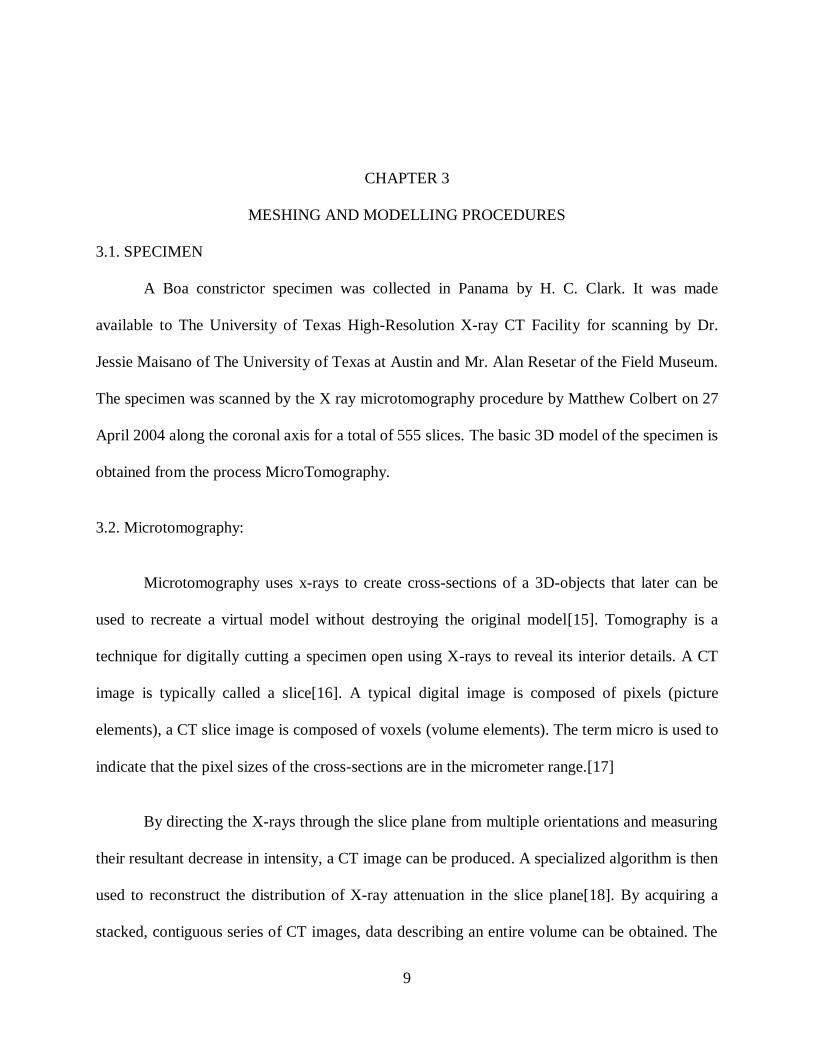
Vomer:
Figure 3.10: Vomer part of the Boa skull in ABAQUS

22
Though there are 9 different parts in the boa skull the stress flows through only a few
parts, when there is a bite. From the full assembly, it can be seen that the model has symmetry
along the Z-axis. This enables us to use the principles of symmetric geometry structural analysis.
3.5. ANALYSIS OF THE MODEL
The total analysis of the model has been performed in several steps as described below.
3.5.1. MESHING IN HYPERMESH
The model is meshed in HYPERMESH. The entire model is an assembly of 9
components which can be viewed and worked on separately in HYPERMESH. Each and every
part has a connection to one or more parts in the model. Since the model is obtained through the
process of Micro tomography, and not modeled specifically in HYPERMESH, but from the 3-D
model of the snake, there is a possibility of having unconnected regions in the model. These
unconnected regions are basically loose chunks of flesh in the real model. These can be found
attached to the bones or in the space between the arrangements of the bones. The meshing
software assumes these loose chunks of flesh also to be a part of the model and does the
meshing. Therefore, the model in HYPERMESH had many unconnected regions which had to be
corrected in the final model.
3.5.2. CORRECTING THE MODEL
The meshed model is corrected in HYPERMESH. Separately, each of the 9 components
is thoroughly examined for any unconnected regions. The unconnected regions, or the free
elements, are then deleted from the component. This is to make the component free of any
unconnected regions and thus making it compatible for the continuous stress flow without any
breaks when the forces are applied. HYPERMESH has the option to delete the elements after
they are meshed. All the brick elements are checked for their connectivity with the adjacent
23
brick elements. All the nodes and elements are checked for their degrees of freedom,
connectivity and other aspects.
3.5.3 EXPORTING THE MODEL FROM HYPERMESH
After the components are corrected, all the components are individually exported from
HYPERMESH to be used in ABAQUS. This is to check the proper stress flow in the
components and their compatibility to be used in the complete model. In HYPERMESH, the
ABAQUS module is used in the preferences to export the components. The components are
exported as *.INP files which can be used to work in ABAQUS. While exporting the model, the
nodes and elements are of the primary interest. This *.INP file consists of the nodes and
elements of a corrected model. Other than the nodes and elements no other properties of the
components are exported.
3.5.4. IMPORTING THE MODEL INTO ABAQUS:
The *.INP file generated from HYPERMESH is used in ABAQUS to check the
consistency of the component. This file consists of the elements and nodes of the meshed
component. After the *.INP file is opened in ABAQUS, it is given the material properties, loads
and boundary conditions and is submitted for analysis. The analysis is monitored to check for
any unconnected regions in the component. After the analysis is complete, the component is
checked for the stresses at different points on the component to check for the stress flow.
3.5.5. PREPARING THE ABAQUS MODEL
The component is given the material properties, loads and boundary conditions. The
component is encastered at one end and forces are applied at the other end. This makes the model
a typical cantilever which is completely fixed at one end and forces applied at other end. The
forces used are either a concentrated or a pressure force.

24
3.5.6. EXAMINING THE ABAQUS MODEL
After completing the analysis in ABAQUS, the following steps are performed to check the
consistency of the component.
1. Stresses at different points on the surfaces: With the help of the ABAQUS/CAE interface,
the stress at different points is examined.
2. Stress flow inside the component by cutting the component at various sections.
3. Monitoring the deformation of the model.
4. Monitoring the analysis for any unconnected regions or elements.
25
3.6. JAW ANALYSIS
The main interest in this research is to analyze the jawbone. The lower jaw bone of the
boa called the Mandible and the upper jaw bone Maxilla are analyzed in this research. When a
boa catches its prey in its mouth, these are the two main bones inside its mouth that hold a firm
grip on the prey. In order to have a firm grip, the boa uses a certain amount of force to catch the
pray. This results in a non-uniformly distributed pressure force on the upper and the lower jaw.
As a result stresses are formed in the jaws of the boa.

26
The figure below shows the model of the jaw bone before the analysis.
Figure 3.11 Jaw bone before the analysis in ABAQUS

27
The figure below shows the model of the jaw bone after the analysis.
Figure 3.12 Jaw bone after the analysis in ABAQUS

28
3.7 MATERIAL PROPERTIES
The jaws were given the material properties of Titanium. Titanium is a low density,
strong, corrosion resistant material and easily fabricated [20]. The two most useful properties of
the metal form are corrosion resistance and the highest strength-to-weight ratio of any metal[21].
It is often used for surgical implants. Titanium is important as an alloying agent with aluminum
and other metals [22].
3.8 TITANIUM AS AN IMPLANT MATERIAL
Titanium, because of its unique properties, is the material of choice for bone implants.
Since the late forties, titanium has been used as a material used in the implants and it is until
recently that much research and attention is conducted on improving the properties of this
biomaterial [23]. Strength and long lasting properties of a material are the most desired
properties of any material to be used in bone implants. Several methods may be employed to
modify the surface structure of titanium implants, which all may lead to altered chemical and
mechanical properties of the metal surface [24]. A variety of implants of many designs are made
from this metal in its pure form or the alloy form [25].
Basic properties of Titanium:
Elastic Modulus : 116 GPa
Poisson’s ratio : 0.32
Density : 4.506 g /
Melting Point: 1668 C
Boiling Point: 3287 C

29
CHAPTER 4
DESIGN OF THE TRANSDUCER
4.1. FORCE TRANSDUCERS
There are many types of force sensors or load cells to measure force. Force transducers
are devices used to directly measuring forces within a mechanical system.
4.1.1. CONCEPT OF MEASURING FORCES
There are many reasons why there is a need to directly measure forces. Each system
needs a correct amount of force to be applied on it. Overweight or underweight below a specified
level would probably destroy the system or sometimes give inaccurate results because of the
underweight. To overcome these situations it is very important to know the forces acting on the
system. The basic limitation of all measurement sciences is that all measurements are relative.
Therefore, all sensors contain a reference point against which the quantity to be measured must
be compared. A force transducer is a device that converts the force applied into a measurable
electrical signal. The force transducer works on the principle of a Piezoresistive effect.
4.1.2. ELECTRICAL RESISTANCE STRAIN GAUGE MEASUREMENTS
It describes the changing electrical resistance of a material due to applied mechanical
stress. It has been known that metal films, semi conductors and film resistors are characterized
by a resistance variation when mechanical stress is applied. The deformation sensitivity of a
resistor can be described with the gauge factor that is defined as the ratio of fractional change in
resistance to the fractional change in geometrical sizes. The gauge factor is separate for both
currents that are parallel and perpendicular to the direction of the strain. The gauge factor is

30
independent of the properties of the resistor material. The piezoresistive effect is the basis of
operation in the majority of mechanical sensor types, including pressure and acceleration
sensors. The great advantage of piezoresistive effect is that static pressure and force
measurement can be accurately measured and there is no interference of any other effects. The
only concerns are the temperature dependence and long term stability when designing
piezoresistive mechanical sensors. [26]
4.2. STRAIN GAUGE
An ideal strain gage changes resistance due to the deformations of the surface to which it
is attached. In real time applications, temperature, material properties, the adhesive that bonds
the gage to the surface, and the stability of the metal all affect the detected resistance. When
selecting a strain gage, the strain characteristics of the sensor, its stability and temperature
sensitivity are to be considered. The most used strain gage materials are also sensitive to
temperature variations and tend to change resistance as they age. For tests and experiments that
run for long periods of time, these factors must be compensated. Each strain gage wire material
has its characteristic gage factor, resistance, temperature coefficient of gage factor, thermal
coefficient of resistivity, and stability.
Typical materials include Constantan (copper-nickel alloy), Nichrome V (nickel-chrome
alloy), platinum alloys (usually tungsten), Isoelastic (nickel-iron alloy), or Karma-type alloy
wires (nickel-chrome alloy), foils, or semiconductor materials. The most popular alloys used for
strain gages are copper-nickel alloys and nickel-chromium alloys. [27]
After the characteristics of germanium and silicon were discovered, these materials
exhibited substantial nonlinearity and temperature sensitivity and they also had gage factors

31
more than fifty times, and sensitivity more than a 100 times, that of metallic wire or foil strain
gages. Silicon wafers are more elastic than metallic ones. An ideal strain gage must return
readily to its original shapes.
An ideal strain gage is small in size and mass, low in cost, easily attached, and highly
sensitive to strain but insensitive to ambient or process temperature variations.
4.3. STRAIN MEASUREMENT
4.3.1. STRESS AND STRAIN
External forces when applied to an object which is stationary, the results are stress and
strain. Stress is defined as the object's internal resisting forces. Stress can be calculated by
dividing the force (F) applied by the unit area (A):
Strain is defined as the amount of deformation per unit length of an object when a load is
applied. Strain is calculated by dividing the total deformation of the original length by the
original length (L).
The values for strain are less than 0.005 inch/inch and are often expressed in micro-strain
units denoted by .
32
It was discovered that metallic conductors subjected to mechanical strain exhibit a change
in their electrical resistance [28]. All strain gages convert mechanical motion into an electronic
signal and a change in capacitance, inductance, or resistance is proportional to the strain
experienced by the sensor. If a wire is held under tension, it gets slightly longer and its cross-
sectional area is reduced. The change in resistance is proportion to the strain sensitivity of the
resistance of the wire.
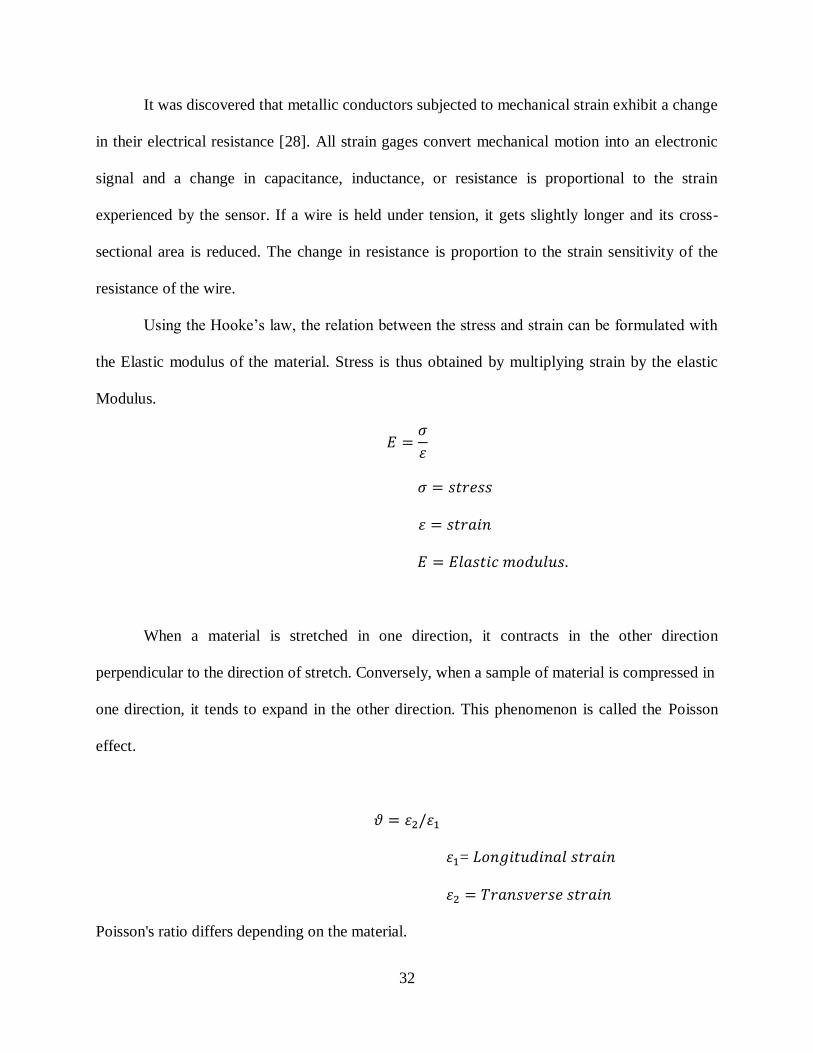
Using the Hooke’s law, the relation between the stress and strain can be formulated with
the Elastic modulus of the material. Stress is thus obtained by multiplying strain by the elastic
Modulus.
When a material is stretched in one direction, it contracts in the other direction
perpendicular to the direction of stretch. Conversely, when a sample of material is compressed in
one direction, it tends to expand in the other direction. This phenomenon is called the Poisson
effect.
=
Poisson's ratio differs depending on the material.

33
4.3.2. STRAIN GAUGE MEASUREMENT
An external tensile force increases the resistance and external compressive force
decreases the resistance by contracting it. The strain gauge should be properly mounted onto the
test specimen so that the strain is accurately transferred from the test specimen.
A strain gauge’s sensitivity to strain is expressed as the gauge factor (GF). Gauge factor
is defined as the ratio of fractional change in electrical resistance to the fractional change in
length (strain)
It is the coefficient expressing strain gage sensitivity. General-purpose strain gages use
copper nickel or nickel-chrome alloy for the resistive element, and the gage factor is
approximately 2.
Strain-initiated resistance change is extremely small. The strain measurements rarely
involve quantities larger than a few mill strain. Therefore, measuring strain requires accurate
measurement of very small changes in resistance. Thus, for strain measurement a Wheatstone
bridge is formed to convert the resistance change to a voltage change.
A Wheatstone bridge measures the unknown electrical resistance by balancing two arms
of a bridge circuit, one arm of which includes the unknown component.

34
The general Wheatstone bridge shown below, consists of four resistive arms with an
excitation voltage, , that is applied across the bridge.
Figure 4.1 Wheatstone bridge
The output voltage,[32]
From this equation, it is apparent that when the voltage output will be zero. Under
these conditions, the bridge is said to be balanced. Any change in resistance in any arm of the
bridge will result in a nonzero output voltage.
If is replaced in the above figure with an active strain gauge, any changes in the strain
gauge resistance will unbalance the bridge and produce a nonzero output voltage. If the nominal
resistance of the strain gauge is designated as , then the strain-induced change in resistance,
.[32]

35
Assuming , the above equation can be written as[32]
*
Figure 4.2 Quarter Bridge
By using two strain gauges in the bridge, the effect of temperature can be avoided. The
sensitivity of the bridge can be doubled by making both gauges active, although in different
directions.
The figure below shows a bending beam application with one bridge mounted in tension
( ) and the other mounted in compression ( ).
Figure 4.3 Cantilever with two strain gauges

36
The figure below shows the configuration of a Wheatstone half bridge yields an output
voltage that is linear and approximately doubles the output of the quarter bridge circuit.[32]
Figure 4.4 Wheatstone half bridge
The sensitivity of the circuit can be further increased by making all four of the arms of
the bridge active strain gauges, and mounting two gauges in tension and two gauges in
compression.

37
The figure below shows the full bridge circuit.[32]
Figure 4.5 Wheatstone full bridge
The equations given here for the Wheatstone bridge circuits assume an initially balanced
bridge that generates zero output when no strain is applied. In reality resistance tolerances and
strain induced by gauge application will generate some initial offset voltage. This initial offset
voltage is typically handled in two ways.
A special offset-nulling, or balancing, circuit to adjust the resistance in the bridge to
rebalance the bridge to zero output.
By measuring the initial unstrained output of the circuit and compensate in software.
38
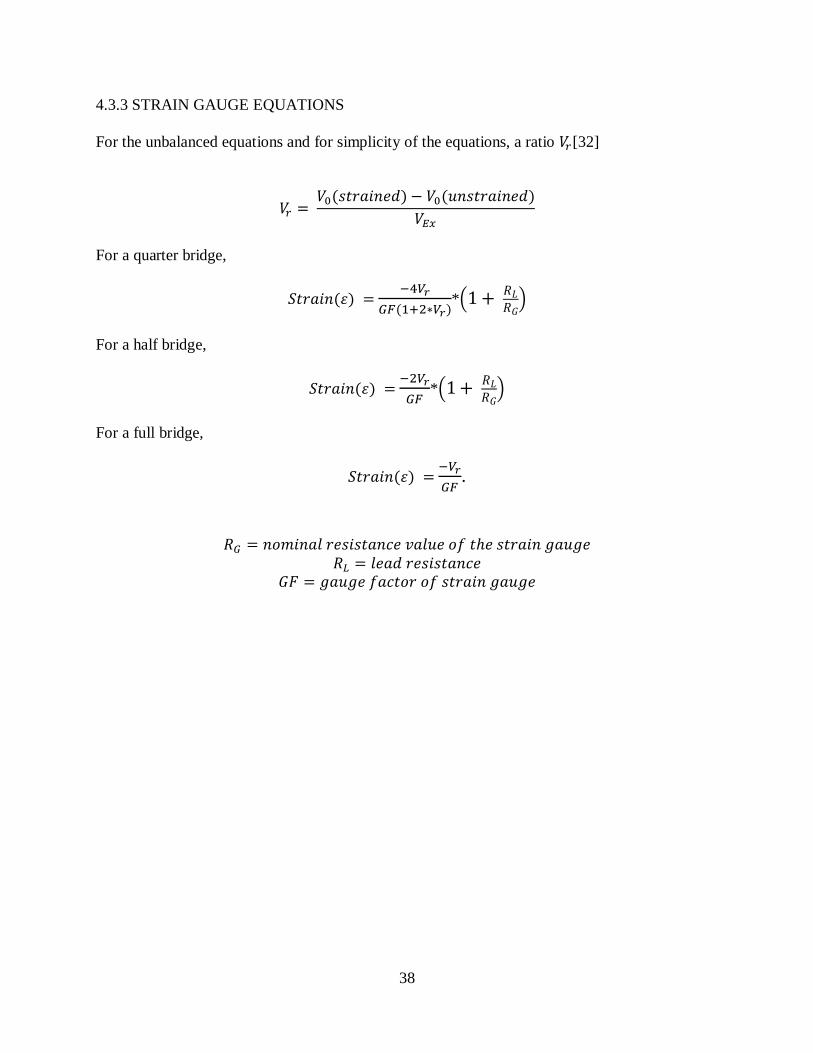
4.3.3 STRAIN GAUGE EQUATIONS
For the unbalanced equations and for simplicity of the equations, a ratio [32]
For a quarter bridge,
*
For a half bridge,
*
For a full bridge,
.

39
4.4. DESIGN OF THE TRANSDUCER
In this study, the entire model of the jawbone, for which the analysis is done, is assumed
to be a cantilever. A cantilever is a beam supported at only one end and load at the other end.
Strain gauges are mounted on the cantilever to measure the strain in the cantilever when forces
are applied.
Case 1:
A cantilever, as shown above, with a load P at the free end and a strain gauge at point a at
a distance of from the free end.
Figure 4.6: A Cantilever beam
For the cantilever, Moment at point is
40
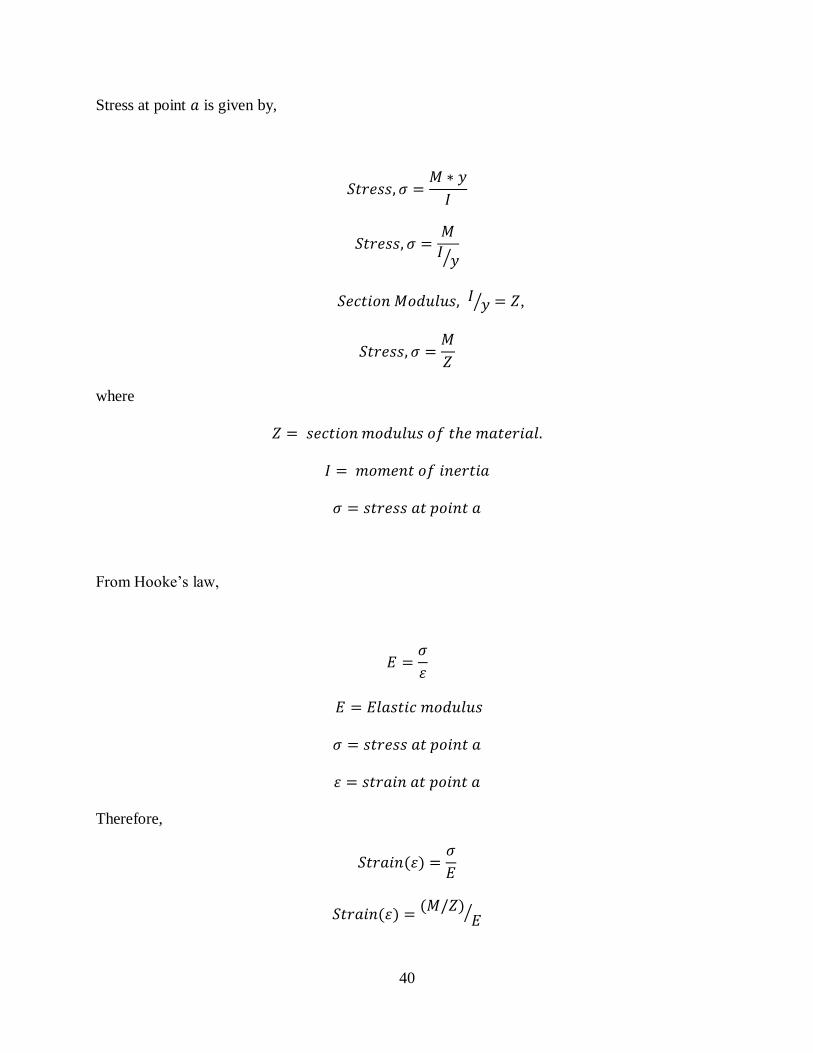
Stress at point is given by,
,
where
From Hooke’s law,
Therefore,

41
This is the theoretical strain value for the applied load at point which is at a distance
of from the free end.
Case 2 :
In another case, where the distance from the free end is unknown, but only the distance
between the two strain gauges is known.
In this study, strain gauges are fixed at two different points, and from the free end.
Let be the distance between the two strain gauges.
And
Now,
From the equation derived above, are all constants, and can be found
experimentally from the Wheatstone bridge.
42
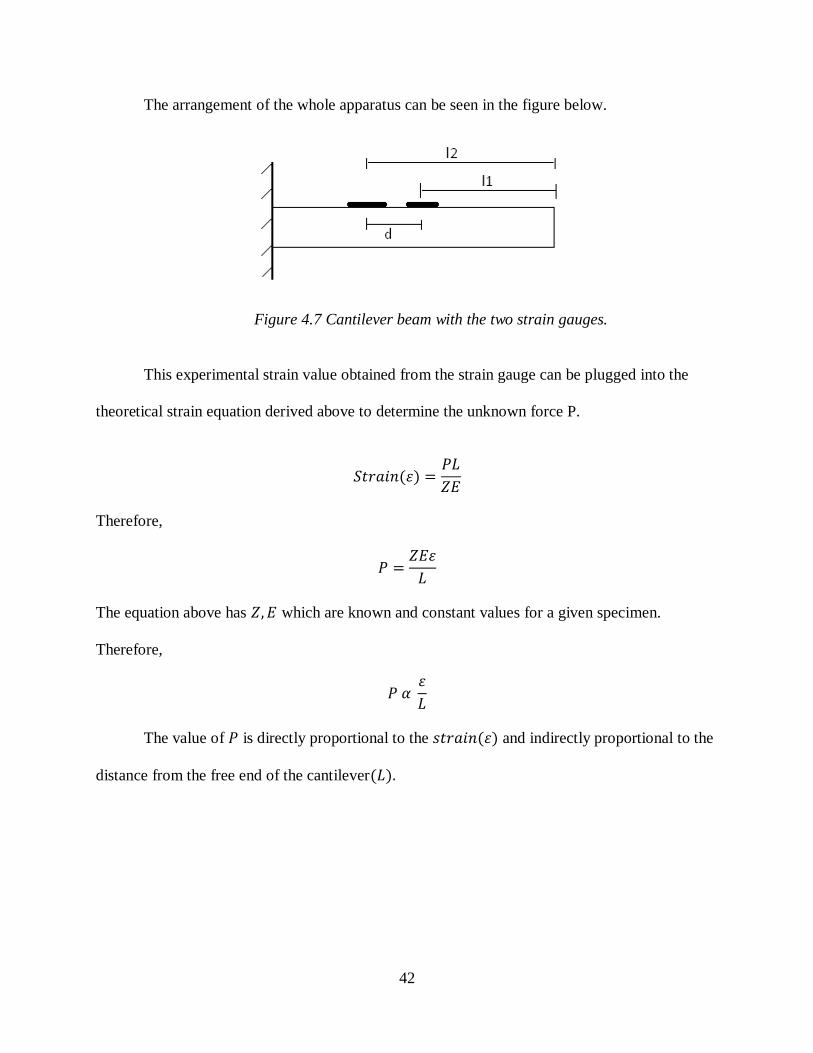
The arrangement of the whole apparatus can be seen in the figure below.
Figure 4.7 Cantilever beam with the two strain gauges.
This experimental strain value obtained from the strain gauge can be plugged into the
theoretical strain equation derived above to determine the unknown force P.
Therefore,
The equation above has which are known and constant values for a given specimen.
Therefore,
The value of is directly proportional to the and indirectly proportional to the
distance from the free end of the cantilever
43
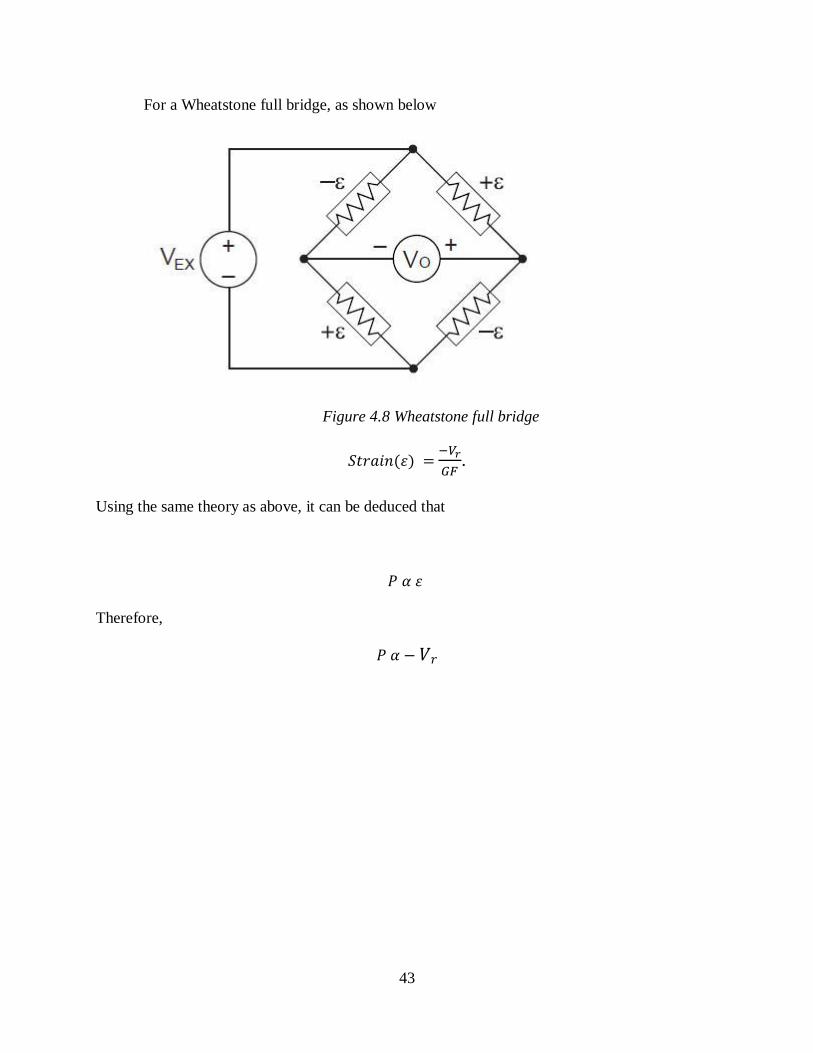
For a Wheatstone full bridge, as shown below
Figure 4.8 Wheatstone full bridge
.
Using the same theory as above, it can be deduced that
Therefore,

44
CHAPTER 5
RESULTS AND CONCLUSIONS
The theory and mathematical procedure explained in the previous chapter is used to obtain
the results.
COMPARISON OF THE THEORETICAL AND EXPERIMENTAL VALUES FOR THE
CANTILEVER WITH A LOAD AT THE FREE END.
A Titanium cantilever beam with length 150mm, cross sectional dimensions 10mm*10mm.
A concentrated load acting downwards is applied at the free end.
A) A strain gauge is fixed at a point from the free end.
The material properties,
Elastic modulus, E = 116000
Section modulus,
=116.67
Load at free end,
Distance from the free end,
Strain at the point where the strain gauge is fixed,
Using the FEA software ABAQUS, this strain value for all the given dimensions and
conditions is found out to be

45
This gives a difference of 4.5 %. The error is mainly due to the quality of the mesh.
B) A strain gauge is fixed at a point from the free end.
The material properties,
Elastic modulus, E = 116000
Section modulus,
=116.67
Load at free end,
Distance from the free end,
Strain at the point where the strain gauge is fixed,
Using the FEA software ABAQUS, this strain value for all the given dimensions and
conditions is found out to be
This also gives a difference of 4.5 %. The error is due to the quality of the mesh.
The same theory can be applied to the jaw bone of the boa constrictor. In the analysis,
the jawbone is treated as a cantilever. It is fixed at one end, and concentrated force acting
downward is applied at the free end.

46
Applying the same theory that is explained in the previous section, the strain gauge is
fixed at some point from the free end of the jaw. When an unknown force is applied at the free
end, strain is produced at the point of interest. This strain is displayed by the strain gauge which
in turn is used to calculate the amount of unknown force applied at the free end. The strain
gauge can either be connected to a quarter, half or a full bridge according to the known
parameters and required sensitivity.
47
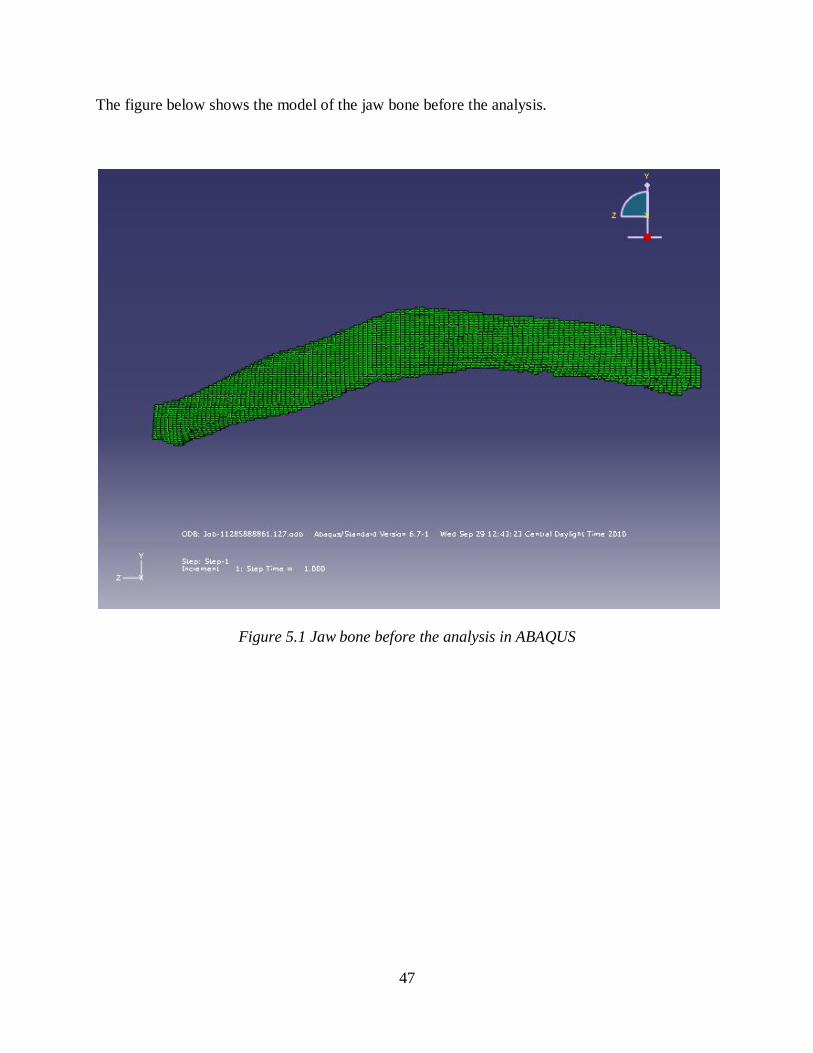
The figure below shows the model of the jaw bone before the analysis.
Figure 5.1 Jaw bone before the analysis in ABAQUS

48
The figure below shows the model of the jaw bone with the boundary conditions, location of the
strain gauges and the applied loads.
Figure 5.2 Jaw bone with the boundary conditions, location of strain gauges & the applied
loads.

49
The figure below shows the model of the jaw bone after the analysis.
Figure 5.3 Jaw bone after the analysis in ABAQUS
50
REFERENCES
1. Maple: programming, physical and engineering problems By Victor Aladjev, Marijonas
Bogdevicius.
2. Designers introduction to FEA., Paul Dvorak.,
3. Introduction to FEA., VTech Material Science and Engineering.
4. Integrated Principles of Zoology., Cleveland P. Hickman, Jr, Larry S. Roberts, Allan
Larson, Helen I'Anson. Washington and Lee University.
5. Progress in cold roll bonding of metals, Long Li, Kotobu Nagai and Fuxing Yin.
6. The finite element method: its basis and fundamentals By O. C. Zienkiewicz, R. L.
Taylor, Robert Leroy Taylor, J. Z. Zhu.
7. The Use of Scaffolding Approach to Enhance Students’ Engagement in Learning
Structural Analysis. Djwantoro Hardjito.
8. Structural Engineering Handbook., Richard Liew, Shanmugam N W, Yu. C H.,Vishay
Precision Group.
9. Transactions in Measurement and control.,Vol III By OMEGA
10. Instrument Engineers' Handbook, Third Edition: Process Measurement and Analysis., by
Bela Liptak.
11. Design, development and testing of a four-component milling dynamometer for the
measurement of cutting force and torque by Suleyman Yaldiz, Faruk unsacar, Haci
Saglam and Hakan Isik.
12. Experimental Mechanics., L. J. Weymouth, J. E. Starr and J. Dorsey.
13. A User-Friendly, High-Sensitivity Strain Gauge by Horacio V. Estrada Ph.D., University
of North Carolina Charlotte, Michael L. Nagy, BFGoodrich Advanced Micro Machines,
James W. Siekkinen Ph.D., BFGoodrich Advanced Micro Machines.
14. The Piezoresistive Effect and its Applications by Hollander, Lewis E. Vick, Gerald L.
Diesel, T. J.,Lockheed Research Laboratory, Palo Alto, California.

51
15. MicroComputed Tomography: Methodology and Applications By Stuart R. Stock,
Northwestern University, Evanston, Illinois, USA.
16. Acquisition, optimization and interpretation of X-ray computed tomographic imagery:
applications to the geosciences by Richard A. Ketcham, William D. Carlson.
17. X-ray Computed MicroTomography systems based on laboratory sources – possibilities
and limitations. By J. Bielecki , S. Bożek , J. Lekki , Z. Stachura and W. M. Kwiatek.
18. An introduction to MICRO CT SCAN, MCT oct2008
19. Comparison Insight Bone Measurements by Histomorphometry and microCT by Daniel
Chappard, Nadine Retailleau-Gaborit, Erick Legrand, Michel Félix Basle , and Maurice
Audran.
20. CRC handbook of materials science By Charles T. Lynch
21. Website : http://www.titaniumprocessingcenter.com/titanium-for-sale.htm
22. CRC handbook of chemistry and physics by By David R. Lide
23. Analysing the optimal value for titanium implant roughness in bone attachment using a
tensile test by H.J. Ronold, S.P. Lyngstadaas, J.E. Ellingsen.
24. Mechanical, thermal, chemical and electrochemical surface treatment of titanium. By
Lausmaa J.
25. Titanium: the implant material of today by R Van Noort.
26. Sensors in biomedical applications: fundamentals, technology & applications By Gábor
Harsányi.
27. Monitoring and safety evaluation of existing concrete structures. By Fédération
internationale du béton.
28. Wiley Survey of instrumentation and measurement. By Stephen A. Dyer
29. http://www.omega.com/Literature/Transactions/volume3/strain.html#sendes
30. http://www.eidactics.com/Downloads/Refs- Methods/NI_Strain_Gauge_tutorial.pdf
31. Instrument Engineers' Handbook, Fourth Edition., Volume 2., Bela Liptak, CRC Press
LLC, 1995, Stmford, Connecticut.

52
32. Springer Handbook of Experimental Solid Mechanics., By William N. Sharpe, Jr.,
William N. Sharpe.