Embed Size (px)
Citation preview

Professor Bogdan DIMA1, PhD
E-mail: [email protected]
Senior Researcher Ştefana Maria DIMA
E-mail: [email protected]
Flavia BARNA, PhD
E-mail: [email protected]
Miruna NĂCHESCU, PhD
E-mail: [email protected]
Faculty of Economics and Business Administration
West University of Timisoara
HOW TO TRADE USING THE (SHANNONIAN) TRANSFER
ENTROPY?
AN APPLICATION FOR CENTRAL AND EASTERN EUROPEAN
MARKETS
Abstract. Transfer entropies have been frequently used in the quantification of
statistical coherence between various time series with prominent applications in
financial markets. The authors consider that (Shannonian) transfer entropy may be
used to describe the functional linkages between financial markets, to detect
various types of asymmetries in the interaction between two systems and,
consequently, to distinguish between driving and responding forces in such
interactions. This last property has relevance in trading diversified portfolios on
multiple markets. The authors illustrate such application for a group of six Central
and Eastern European markets. The results show that for a time span between
2001 and 2012, these markets are dominated from the viewpoint of net information
flows by WIG and S&P 500 indexes. The article reports the performances for
individual portfolios which mimic the indexes’ structure as well as for a global
portfolio with weights based on individual net information flows.
Keywords: Financial markets, (Shannonian) transfer entropy, Global
portfolio, CEE.
JEL Classification: G15, G11
1. BACKGROUND AND RELATED LITERATURE
Interest in emerging markets has been growing and literature highlights the benefits
of international portfolio diversification on emerging markets. Still, despite the
benefits of investing on emerging markets, these stocks represent just a very small
1 Acknowledgement: The authors would like to thank to the participants at 13th International Balkan
Workshop on Applied Physics and Materials Science, 4-6 July, Constanţa, România and at
International Conference TIMTED 2013 Current Economic Trends in Emerging and Developing
Countries, 6-8 June, Timişoara, Romania - for their useful comments and suggestions.

Bogdan Dima, Stefana Dima, Flavia Barna, Miruna Nachescu
_________________________________________________________________
share of investors’ equity holdings when relative stock market capitalization is
taken into account.
The stock exchanges of Central and Eastern Europe (CEE) are relatively small
emerging markets, still underdeveloped and economically unimportant compared
to western stock markets; many of which (like Tallinn, Riga or Bratislava) still
belong to the group of smallest exchanges in the world. The best developed
markets among the CEE countries are the markets in the Czech Republic, Hungary
and Poland, with market liquidity comparable to Western European stock markets.
The official markets and partly the regulated markets have rather strict listing
requirements allowing foreign investors to have relatively low information costs on
the official market segment. With the exception of Warsaw Stock Exchange, only a
minority of companies is listed on the official market, the unregulated free market
having the highest number of listings. This may be due to overly strict listing
requirements and high disclosure standards on the official market segment and
partly on the regulated market. Companies listed on the official market are required
to publish/disclose their financial information according to the International
Financial Reporting Standards (IFRSs), but only some provide financial
information in English. These relatively high standards entail additional costs for
the listed companies. However, since the exchanges and companies in Central and
Eastern Europe have to build up confidence in order to attract domestic and foreign
investors these rules probably have a positive impact diminishing the information
costs for investors.
The different regulatory requirements and institutional arrangements of the CEE
exchanges induce relatively high overall transaction costs due to high information
costs and low liquidity. This reduces the interest of foreign investors in CEE
stocks.
Claessens et al. (2002) investigate the reasons for the migration of companies in
emerging economies to international financial centers. Domestic companies do
hardly use the exchanges for external funding. When the financial sector of an
economy is successfully developed, the companies have increased opportunities to
access international exchanges and, thus, the largest companies will go abroad
(Schröder and Köke, 2002). This causes a reduction of liquidity for the domestic
stock exchanges and diminishes the chances of these exchanges to develop
successfully.
Harvey (1995) shows that “adding emerging market assets to the portfolio problem
significantly shifts the investment opportunity set”, and that risk adjusted returns
are 50% higher after their inclusion in the portfolio, mainly due to market
segmentation. In the pre-integration period, aggregate investment in emerging
markets was a good strategy. Nowadays, emerging markets are very much
integrated into world capital markets. The segmentation premium they enjoyed in
the 80’s had eroded, and in the post-integration period, passive indexing strategies
are no longer enough to add value. Using diversified index funds of emerging
market equities does not improve portfolio’s performance as aggregate emerging

How to Trade Using the (Shannonian) Transfer Entropy
________________________________________________________________ markets act similar to other asset classes. Aggregate diversification across all
emerging markets is no longer enough to create value. Thus, other strategies as
country and stock selection strategies become imperative. Still, investment in
emerging market equities can still be very valuable to global investors, as long as
they do not simply buy an index of all emerging market countries, but instead
select what they invest in.
The case of transition countries in Central and Eastern Europe (CEE) is a particular
one and the literature investigating financial contagion in the respective economies
is rather vague (usually focusing on Hungary, Poland and the Czech Republic) and
no consensus has been reached in regard to the existence of financial contagion.
Authors like Wang and Moore (2008) investigate the co-movement of the three
major CEE markets mentioned above with the aggregate euro zone market and find
that the increase in stock market co-movements can only be explained by financial
contagion.
MacDonald (2001) was one of the first researchers to find evidence of
cointegration of the CEE stock markets with mature stock markets such as
Germany, the United Kingdom and the United States, fact partially confirmed by
Syllignakis and Kouretas (2006).
Syriopoulos (2006) reveals that the international cointegration linkages of the stock
markets of the CEE countries with developed stock markets are stronger than the
intraregional linkages among the CEE stock markets. On the other hand, authors
like Gilmore and McManus (2002) and Yuca and Simga-Mugan (2000) find that
the CEE stock markets are not cointegrated. Such differences of opinions in the
early literature can be justified by the structural instability of the long-term
international cointegration linkages, due to financial crises (Jochum et al.,1999;
Voronkova, 2004).
The study of Kizys and Pierdzioch (2011) shows that the Czech Republic showed
the strongest correlation with the Western economies and that the intraregional
linkages of the stock markets of the Czech Republic, Hungary, and Poland have
considerably changed over time. The cointegration linkages with the U.S. stock
market strengthened in terms of both fundamentals and speculative bubbles during
the market jitters caused by the financial crisis of 2008. The financial crisis of 2008
hit hard the stock markets of the CEE countries. After an analysis of the CEE stock
markets, Kizys and Pierdzioch (2011) conclude that the collapse of these markets
during the recent financial crisis is likely to reflect both a correlated transatlantic
deterioration of fundamentals and contagion effects due to the international
spillover of speculative bubbles originating in the U.S. stock market.
Weller and Morzuch (2000) show that both historically and recently, default risk
has been lower in CEE countries than in other emerging economies.
The acute need to describe the functional linkages between financial markets led
recently to the use of econophysics’ methods in quantitative finance. Econophysics
is one of the active research areas where many statistical methods are applied to
investigate financial systems. In the framework of econophysics, it has become

Bogdan Dima, Stefana Dima, Flavia Barna, Miruna Nachescu
_________________________________________________________________
steadily evident that market interactions are highly nonlinear, unstable and long-
ranged. Also, it seems that all agents involved in a given stock market exhibit
interconnectedness and correlations which represent an important internal force of
the market. The correlation functions one uses to study the internal cross-
correlations between various market activities, have two major limitations: they
measure only linear relations, although it is clear that linear models do not
faithfully reflect real market interactions and determine whether two time series
have correlated movement (without indicating which series affects which).
Schreiber (2000) introduced the concept of (Shannonian) transfer entropy (STE) in
order to measure dependency in time between two variables. The transfer entropy
provides more detailed information concerning the excess (or lack) of information
in various parts of the underlying distribution resulting from updating the
distribution, on the condition that a second time series is known. In the key context
of financial time series, the risk valuation of large changes, such as spikes or
sudden jumps, is of crucial significance. Information entropies are primarily
important because there are various coding theorems which endow them with an
operational meaning, and not because of intuitively pleasing aspects of their
definitions.
Kwon and Yang (2008) use the method of transfer entropy and focus quantitatively
on the direction of information flow between the index data and the price of
individual companies. They conclude that there is a stronger flow of information
from the stock index to the individual stocks than vice versa, and that transfer
entropy for both directions has positive correlations.
Marschinski and Kantz (2002) apply the transfer entropy method to the analysis of
financial time series and calculate the information flow between the Dow Jones and
DAX stock indices.
The effective transfer entropy (ETE) was originally introduced by Marschinski and
Kantz (2002) and it was further substantiated in Syriopoulos (2006). The ETE, in
contrast to the TE, accounts for the finite size of a real data set.
Transfer entropies have been frequently used in the quantification of statistical
coherence between various time series with prominent applications in financial
markets. The transfer entropy may be used in order to detect various types of
asymmetries in the interaction between two systems and, consequently, to
distinguish between driving and responding forces. Such property of the transfer
entropy may be considered in trading diversified portfolios on multiple markets.
The transfer entropy for two discrete and stationary processes, I and J , measures
how much the dynamics of the process J influences the transition probabilities for
process I (Kwon and Yang, 2008a, 2008b).The transfer entropy may be used to
detect asymmetry in the interaction between two systems and to distinguish driving
and responding elements (Kwon and Oh, 2012). Transfer entropy is a model-free
measure estimated as the Kullback-Leibler distance between transition
probabilities. One major advantage of such measure is that allows quantifying the
information transfer without linear dynamics restrictions (Dimpfl and Peter, 2012).

How to Trade Using the (Shannonian) Transfer Entropy
________________________________________________________________ Based on this literature, we formulate the following research hypothesis:
H: There are information flows between and within developed and CEE stock
markets, which, due to information imperfections, may be used to establish efficient
trading rules and may be involved in portfolio management operations.
2. METHODOLOGICAL FRAMEWORK
The model
Suppose that each individual market Mi is formed by “bounded rational” agents
who are trading Ni homogenous financial assets. As key decisional variables
involved in the choice of their portfolio’ structures, these agents consider the costs,
returns and risks associated with various types of financial assets, as well as the
available incomes from own and borrowed sources.
If the investors are “neutral to risk”, then the portfolio optimization objective will
consist in ensuring a “balanced” return-to-risk ratio. Also, in order to minimize the
transaction costs by preserving the chosen structure over a multi-period
management time horizon, the agents will consider not only the current but also the
forecasted values of the involved variables. The dynamic choice of portfolio’
structure problem for the current period t on a particular market M1 can be
formally described as:
1
1
1
1 1 1 1
1 1
1 1 1* 1 1* 1 1*
1 1 1 1 1 1
1 1* 1 1*
1 1 1 1
1 1 1*
1 1
1
, 0, 1N t
M M M M
it it it iti j
N t D t M tM M M M M M M
ij ij ij lj lj sj sji j l j s j
Z t D tM M M M
uj uj lj lju j l j
N tM M M
ij ij iji j
M M
ij ij
x x
x c c k k L L
Y Y B B
x
x R R1
1*
1 1
1
N t
iji j
MAX
Hence x are the weights of an individual asset i, λ are the “strategic” assets (the
assets that are included at least at a minimal level in order to “anchor” the
portfolio); c are the costs associated with trading and holding the assets; k are the
weighted costs of borrowed financial resources; L are the liquid resources kept in
portfolio for prudential and speculative reasons, Y are the net incomes from work
and capital, from the current period or thesaurized from previous periods; B is the
amount of borrowed resources, η are the returns of assets and R their associated
risks. * denotes the forecasted levels of the involved variables.
The anticipations are formed according to a mixed mechanism, which incorporates
Bogdan Dima, Stefana Dima, Flavia Barna, Miruna Nachescu
_________________________________________________________________
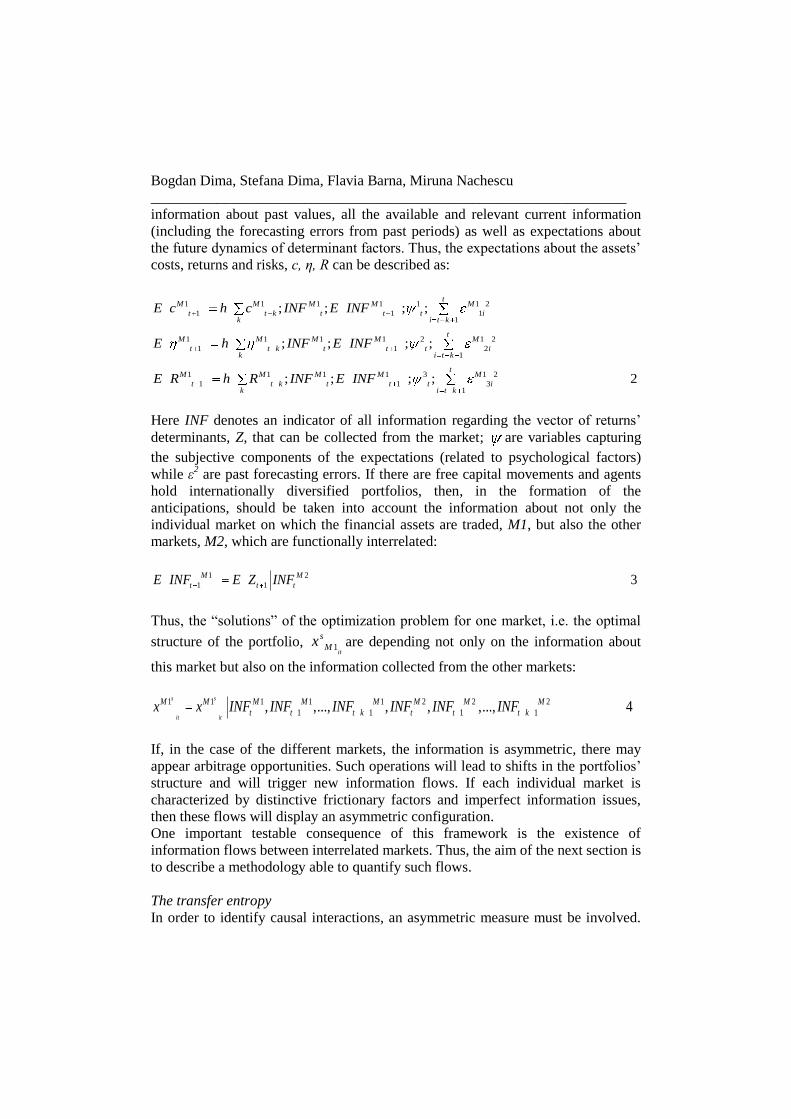
information about past values, all the available and relevant current information
(including the forecasting errors from past periods) as well as expectations about
the future dynamics of determinant factors. Thus, the expectations about the assets’
costs, returns and risks, c, η, R can be described as:
1 1 1 1 1 1 2
1 1 11
1 1 1 1 2 1 2
1 1 21
1 1 1 1 3 1 2
1 1 31
; ; ; ;
; ; ; ;
; ; ; ; 2
tM M M M M
t t k t t t ik i t k
tM M M M M
t t k t t t ik i t k
tM M M M M
t t k t t t ik i t k
E c h c INF E INF
E h INF E INF
E R h R INF E INF
Here INF denotes an indicator of all information regarding the vector of returns’
determinants, Z, that can be collected from the market; are variables capturing
the subjective components of the expectations (related to psychological factors)
while ε2 are past forecasting errors. If there are free capital movements and agents
hold internationally diversified portfolios, then, in the formation of the
anticipations, should be taken into account the information about not only the
individual market on which the financial assets are traded, M1, but also the other
markets, M2, which are functionally interrelated:
1 2
1 1 3M M
t t tE INF E Z INF
Thus, the “solutions” of the optimization problem for one market, i.e. the optimal
structure of the portfolio, 1it
s
Mx are depending not only on the information about
this market but also on the information collected from the other markets:
1 1 1 1 1 2 2 2
1 1 1 1, ,..., , , ,..., 4s s
it it
M M M M M M M M
t t t k t t t kx x INF INF INF INF INF INF
If, in the case of the different markets, the information is asymmetric, there may
appear arbitrage opportunities. Such operations will lead to shifts in the portfolios’
structure and will trigger new information flows. If each individual market is
characterized by distinctive frictionary factors and imperfect information issues,
then these flows will display an asymmetric configuration.
One important testable consequence of this framework is the existence of
information flows between interrelated markets. Thus, the aim of the next section is
to describe a methodology able to quantify such flows.
The transfer entropy
In order to identify causal interactions, an asymmetric measure must be involved.

How to Trade Using the (Shannonian) Transfer Entropy
________________________________________________________________ For instance, such measure can be provided by the “transfer entropy” (Schreiber,
2000). Formally, the transfer entropy can be defined (see Jizba et. al., 2012:14) as:
1 1 2 3 1 1 2 3 1
1 1 2 3 1 1 1 2 3
, ... ... ...
; ... ... ; ... (5)
m m m m m l m
m m m l m m m
Y X t t t t t t t t t t t t
t t t t t t t t t t t t
T m l H X X X X X H X X X X X Y Y
I X X X X X Y Y I X X X X X
In other words, the transfer entropy represents:
+ Gain of information about 1mt
X caused by the whole history of X and Y up to
time tm
− Gain of information about 1mt
X caused by the whole history of X up to time tm
= Gain of information about1mt
X caused purely by the whole history of Y up to time
tm.
For two concurrently sampled time series X and Y, the (Shannonian) transfer
entropy from Y to X, ,Y XT k l , can be expressed as:
1
1
1
,, , log 6
k l
t t tk l
Y X t t t ak
t t
p x x yT k l p x x y
p x x
It can be noticed that the most common settings of the parameters imply k=l=1.
However, other time frames may be considered depending on the time structures of
the involved variables.
In order to implement the transfer entropy estimation, we assimilate the
probabilities with the relative data frequencies. The whole series is divided into N
discrete bins and to every bin is assigned a sample data value. The number of data
points per bin divided by the length of the time series constitutes the relative
frequency. Obviously, the estimation depends on the number of bins chosen (the
so-called “alphabet length”). To ensure some comparability with previous results
(see for instance Kwon and Yang, 2008a, 2008b, Jizba et. al., 2012), we conduct
calculations at a pre-fixed alphabet length N = 3. More precisely, for the log returns
of indexes,1ln lnt t tr P P , we define the discrete partition At as: At=2 if rt>0
(“upward move”), At=1, if rt<0 (“ downward move”), and, respectively, At=0 if rt>0
(“flat”). By applying this procedure, we obtain unequal probabilities for the three
states, which enable us to highlight some of markets’ intrinsic mechanisms.
Consequently, we estimate the transfer entropy for all possible pairs of indexes.
Based on such estimations, the results are used to construct the net information
flows (the outgoing minus incoming transfer entropy), NIF, and we seek to

Bogdan Dima, Stefana Dima, Flavia Barna, Miruna Nachescu
_________________________________________________________________
determinate the dominant and subordinate flows.
Furthermore, we involve from the N considered markets the information dominant
ones, M (the markets for which1..
maxM
ii N
NIF NIF ) as to generate trading signals
for the subordinate markets. With this purpose, we consider a simple rule based on
moving averages constructed on a rolling window w, MAM
(w), and applied on the
dominant indexes, such as:
Entry long, at current period t, when MAM
t(w)> MAM
t-w+1(w) and hold the trading
position for a pre-determined trading horizon th.
Such rule implies an automatic exit from the trading positions at the end of the th
trading period regardless of the outcomes. The length of the window, w, as well as
this trading period may be selected by searching in a reference interval (between
wmin and wmax) according to an evaluation rule for the results (for instance, by
choosing that pair of window length and trading period for which a maximum
average return per trade is obtained).
International data
Data represents daily close values for the indexes of the analyzed markets. The data
set was obtained by combining data from the Yahoo financial portal and from
http://www.stooq.com which provides financial data. The gathered data was
synchronized by removing periods without trading activity (weekends, night time
and holidays) for the stock exchanges taken into account. Of course, such
procedure has the disadvantage that the observations which are separated in real
time may become close neighbors in the synchronized time series. However, there
are only a few observations comparing with the regular data and so the procedure
does not lead to significant statistical errors.
3. RESULTS AND DISCUSSION
The transfer entropy is estimated for all possible pairs of indexes. The results are
reported in Exhibit 1. For the full sample, among the Central and Eastern European
indexes, the most substantial transfers are the ones between WIG, PX, BUX and
ATX. The weakest information linkages are attached to SAX and RTS indexes. For
the developed markets, the DAX index seems to be the least connected to the
others.
In order to identify the structural changes in the involved processes, the data
sample is splitted in two sub-periods (2001-2007 and, respectively, 2007-2012) and
the transfer entropy is re-estimated for each sub-period. The outcome indicates that
the current financial turbulence has led to a decrease in the levels of transfer
entropy. This “decoupling” evolution may be viewed as an expression of the
increased uncertainty about markets’ evolutions, changes in trading strategies and
portfolios, according to higher levels of risk aversion.

How to Trade Using the (Shannonian) Transfer Entropy
________________________________________________________________ Exhibit 1. Transfer entropy for Central and Eastern European indexes
A) Panel “A”: full sample (01/10/2001- 10/01/2012)
Y→ X SAX ATX PX WIG BUX RTS
SAX 0.00007 0.00059 0.00008 0.00023 0.00122
ATX 0.00091 0.00089 0.00032 0.00022 0.00050
PX 0.00080 0.00049 0.00007 0.00081 0.00104
WIG 0.00079 0.00598 0.00753 0.00686 0.00616
BUX 0.00116 0.00026 0.00028 0.00003 0.00052
RTS 0.00057 0.00043 0.00034 0.00024 0.00101
SP500 0.00054 0.00437 0.00841 0.00100 0.00361 0.00527
FTSE100 0.00062 0.00016 0.00186 0.00026 0.00028 0.00064
CAC40 0.00042 0.00023 0.00131 0.00017 0.00047 0.00042
DAX 0.00077 0.00056 0.00098 0.00000 0.00026 0.00027
(continuation)
Y→ X SP500 FTSE100 CAC40 DAX
SP500 0.00550 0.00566 0.00406
FTSE100 0.00055 0.00020 0.00096
CAC40 0.00083 0.00075 0.00029
DAX 0.00051 0.00049 0.00021
B) Panel “B”: subsample (01/10/2001- 01/09/2007)
Y→ X SAX ATX PX WIG BUX RTS
SAX 0.00045 0.00139 0.00014 0.00054 0.00135
ATX 0.00151 0.00046 0.00092 0.00026 0.00070
PX 0.00143 0.00089 0.00062 0.00087 0.00130
WIG 0.00085 0.00485 0.00437 0.00758 0.00664
BUX 0.00108 0.00001 0.00135 0.00035 0.00069
RTS 0.00119 0.00103 0.00097 0.00079 0.00178
SP500 0.00096 0.00530 0.00773 0.00177 0.00582 0.00821
FTSE100 0.00127 0.00058 0.00122 0.00051 0.00071 0.00126
CAC40 0.00051 0.00065 0.00088 0.00030 0.00091 0.00119
DAX 0.00142 0.00055 0.00042 0.00015 0.00013 0.00049
(continuation)
Y→ X SP500 FTSE100 CAC40 DAX
SP500 0.00954 0.00864 0.00640
FTSE100 0.00067 0.00072 0.00175
CAC40 0.00189 0.00050 0.00033
DAX 0.00092 0.00010 0.00034
C) Panel “B”: subsample (01/09/2007-10/01/2012)
Y→ X SAX ATX PX WIG BUX RTS
SAX 0.00057 0.00065 0.00016 0.00030 0.00222
ATX 0.00134 0.00349 0.00003 0.00101 0.00183
PX 0.00122 0.00083 0.00052 0.00168 0.00241

Bogdan Dima, Stefana Dima, Flavia Barna, Miruna Nachescu
_________________________________________________________________ WIG 0.00123 0.00747 0.01391 0.00646 0.00824
BUX 0.00176 0.00113 0.00158 0.00028 0.00116
RTS 0.00115 0.00064 0.00154 0.00061 0.00090
SP500 0.00065 0.00407 0.01124 0.00048 0.00208 0.00405
FTSE100 0.00061 0.00057 0.00376 0.00067 0.00045 0.00080
CAC40 0.00089 0.00035 0.00431 0.00014 0.00023 0.00150
DAX 0.00089 0.00108 0.00396 0.00013 0.00055 0.00101
(continuation)
Y→ X SP500 FTSE100 CAC40 DAX
SP500 0.00287 0.00317 0.00217
FTSE100 0.00038 0.00100 0.00224
CAC40 0.00001 0.00129
DAX 0.00017 0.00111 0.00036
Comparing the transfer entropy values between developed and emergent markets, it
appears that the latter markets are receiving more information from S&P 500 than
from the continental markets. These results are consistent with other evidences
from the literature. For instance, as Kizys and Pierdzioch (2011:154) note:
“Transatlantic cointegration linkages with U.S. fundamentals and U.S. speculative
bubbles strengthened to a much more significant extent than continental
cointegration linkages with fundamentals and speculative bubbles estimated for
Germany and the United Kingdom. Intraregional cointegration linkages of
speculative bubbles among the CEE countries also became stronger during the
recent financial crisis, but there is hardly evidence that the crisis triggered stronger
intraregional cointegration linkages of fundamentals”. However, opposite to other
findings (Syriopoulos, 2006), we have no confirmation of CEE stock markets'
interactions with developed stock markets, stronger than the intraregional
connections.
The net information flows for an individual index X, X X i i X
i
NIF TE TE ,
provides a synthetic picture of the hierarchical relationships between markets.
Exhibit 2 reports the corresponding values for the Central and Eastern European
indexes.

How to Trade Using the (Shannonian) Transfer Entropy
________________________________________________________________ Exhibit 2. Net inflows for Central and Eastern European countries (full
sample: 01/10/2001- 10/01/2012)
Y→ All indexes Net information flows
WIG 0.02658
SP500 0.01893
DAX 0.00203
FTSE100 0.00196
PX 0.00184
CAC40 0.00130
BUX 0.00097
ATX 0.00091
SAX 0.00065
RTS 0.00049
Usually, in the estimation of the transfer entropy, the order (k,l) is set to 1 for two
reasons: firstly, to make computation faster and, secondly, to ensure an adequate
sampling. Nevertheless, we explore the potential explanatory utility of higher-order
transfer entropy by choosing various lengths of delays. The results are show in
Exhibit 3.
Exhibit 3. Transfer entropy for various time frames
A) k=3, l=5
Y→ X SAX ATX PX WIG BUX RTS
SP500 0.00169 0.00135 0.00123 0.00126 0.00116 0.00176
FTSE100 0.00118 0.00100 0.00111 0.00092 0.00095 0.00146
CAC40 0.00160 0.00136 0.00141 0.00123 0.00111 0.00174
DAX 0.00109 0.00117 0.00132 0.00104 0.00117 0.00116
B) k=20, l=20
Y→ X SAX ATX PX WIG BUX RTS
SP500 0.00398 0.00404 0.00461 0.00419 0.00391 0.00461
FTSE100 0.00378 0.00372 0.00459 0.00391 0.00362 0.00407
CAC40 0.00407 0.00375 0.00427 0.00372 0.00379 0.00459
DAX 0.00426 0.00415 0.00425 0.00417 0.00369 0.00416
C) k=42, l=42
Y→ X SAX ATX PX WIG BUX RTS
SP500 0.00846 0.00786 0.00827 0.00874 0.00799 0.00823
FTSE100 0.00773 0.00765 0.00781 0.00780 0.00762 0.00817
CAC40 0.00818 0.00777 0.00800 0.00792 0.00802 0.00839
DAX 0.00775 0.00771 0.00790 0.00774 0.00786 0.00832

Bogdan Dima, Stefana Dima, Flavia Barna, Miruna Nachescu
_________________________________________________________________
Even if the absolute levels of transfer entropy increase, the overall hierarchy of the
indexes does not change for higher delays. However, at higher orders, there is an
augment in the relative impact of continental markets over Central and Eastern
European ones (especially from the CAC 40 and FTSE100). This implies that the
investors are reacting, firstly, to the new information arrived from the transatlantic
and regional markets on “short-run” and, subsequently, to the news from the
continental markets on “long-run”.
Globally, these indexes are dominated, from the perspective of the information
flows, by WIG and, respectively, S&P 500. A comparative analysis of the Central
and Eastern European markets reveals some potential explanations for the key role
played in the area by Poland’ capital market (Exhibit 4). The significant level of
market capitalization, relative higher levels of market’ liquidity as well as good
market turnovers, all these are based on sound regulatory and supervisory
frameworks as well as on improved market mechanisms.
Exhibit 4. Main characteristics of Central and Eastern European markets
(averages for 2000-2011)
Czech
Republic Poland
Slovak
Republic
Russian
Federation Austria
Euro
area
Market
capitalization
of listed
companies
(% of GDP) 24.25 27.58 5.92 56.25 27.17 61.25
Stocks traded,
total value
(% of GDP) 14.00 11.17 0.83 33.58 12.42 72.00
Stocks traded,
turnover ratio (%) 58.83 40.08 21.92 62.75 44.17 116.58
Source of data: World Bank (2013)
Since the distribution of colors over the recurrence plots for S&P 500 and,
respectively, WIG (log) returns, which employ color-spectrum visualization for
indexes, is not even, the null of truly random and without structure processes might
be rejected for them. Thus, it can be argued that the returns for these information
dominant indexes display a certain degree of predictability. Such predictability is a
key requirement for using these indexes in order to evaluate the entry in trading
opportunities for the considered markets.

How to Trade Using the (Shannonian) Transfer Entropy
________________________________________________________________
Exhibit 5. Recurrence plots for the (log) returns of S&P 500 and WIG
Notes: the embedding dimension of 80 and the time delay of 1 for S&P 500 and,
respectively, 36 and 2 are computed from the False Nearest Neighbors method and
Average Mutual Information method.
Based on this, we identify the upward trends in WIG and S&P 500 and we generate
the trading signals for the emergent indexes, according to the mentioned rule.
Consequently, we estimate the quality of these signals. In order to obtain more
realistic results, we consider a 0.5% trading fees from each entry, respectively, exit
prices. The outcomes are reported in Exhibit 6.
Exhibit 6. Portfolios outcomes
A) Panel “A”: full sample (01/10/2001- 10/01/2012)
PX BUX SAX RTS ATX
Global
portfolio
Average return per trade (%) 2.10 2.56 1.31 5.25 2.50 2.48
Standard deviation of returns (%) 7.19 8.27 7.46 12.61 7.09 6.54
Sharpe ratio 0.29 0.31 0.18 0.42 0.35 0.38
Sortino ratio 0.55 0.63 0.37 0.90 0.64 0.72
Number of trades 1123 1123 1123 1123 1123 5615
B) Panel “B”: subsample (01/10/2001- 01/09/2007)
PX BUX SAX RTS ATX
Global
portfolio
Average return per trade (%) 2.35 2.92 1.63 5.73 2.81 2.80
Standard deviation of returns (%) 7.45 8.60 7.85 13.03 7.24 6.75
Sharpe ratio 0.32 0.34 0.21 0.44 0.39 0.41
WIG S&P 500

Bogdan Dima, Stefana Dima, Flavia Barna, Miruna Nachescu
_________________________________________________________________
Sortino ratio 0.60 0.70 0.45 0.96 0.70 0.79
Number of trades 974 974 974 974 974 4870
C) Panel “B”: subsample (01/09/2007-10/01/2012)
PX BUX SAX RTS ATX
Global
portfolio
Average return per trade (%) 0.43 0.17 -0.81 2.13 0.42 0.38
Standard deviation of returns (%) 4.90 5.04 3.32 8.89 5.59 4.40
Sharpe ratio 0.09 0.03 -0.24 0.24 0.07 0.09
Sortino ratio 0.16 0.06 -0.37 0.44 0.13 0.15
Number of trades 149 149 149 149 149 745
Notes: The global portfolio is composed by PX, BUX, SAX, RTS, and ATX
portfolios. The weights are computed as the ratio between individual information
flows as reported in Exhibit and their global level. The rolling window w is set
equal with 11 successive trading days and the pre-determined trading horizon th is
equal with 15 successive trading days. A 0.5% trading fees is applied for each
entry and, respectively, exit trade.
The best results are obtained in terms of return-to-risk Sharpe and Sortino ratios for
RTS and BUX indexes, while the worst appear to be the ones for SAX. The
average returns per trade are almost five times larger for RTS in comparison with
SAX.
Also, we evaluate the performances of a full portfolio composed by all indexes.
The allocation weights in the structure of such portfolio, αi, for an individual index
i, are established according to the relative net information flows:
1
7ii N
ii
NIF
NIF
The idea behind this allocation mechanism is to attach higher weights to the
markets which are net information suppliers. Thus, the composition of the full
portfolio will reflect the information hierarchy between markets, aiming to ensure a
higher degree of structural stability.
The figures from the last column of Exhibit 5 highlight that such a global portfolio
performs relatively well with the return-to-risk ratios being approximately equal
with almost the double of the worst performances. The assessment of the full
portfolio results does not count for the risks induced by the markets' interactions.
Still, the methodology used in the choice of weights addresses, indirectly, this
issue, since it is based on the information flows. Thus, it might be argued that the
structure of this portfolio is relatively stable over time.

How to Trade Using the (Shannonian) Transfer Entropy
________________________________________________________________ Furthermore, in order to check the robustness of the results, we re-estimate these
for two sub-periods (2001- end of 2006, and respectively 2007-2012). It appears
that there are significant differences in the configuration of the performances
between these sub-periods. While for the first reference period, the return-to-risk
ratios are somehow better compared to the full sample, the situation is worsening
for the second sub-period with looses on the SAX market and net returns being less
than one quarter of the full sample. Hence, the financial turbulence is wiping out a
substantial amount of performances. Also, there are less trading signals in the
second sub-period. Still, important differences exist in indexes' time behavior. The
relative smallest looses are in the case of RTS. Since this market has the lowest
level of net information flow, this may suggest that such evolutions are not only the
direct consequence of markets’ institutions and mechanisms, but also a product of
the integration in the international capital movements.
4. SUMMARY, IMPLICATIONS AND EXTENSIONS
We find that the (Shannonian) transfer entropy may be used to quantify the
information flows between markets and to implement multi-markets trading
strategies. We empirically test this for a group of Central and Eastern European
markets. These markets appear to be dominated by the information which flows
from WIG and S&P 500 indexes. We estimate the outcomes of a trading strategy,
based on the changes on these markets, both for the other individual markets and
for a global portfolio. The weights of this global portfolio are chosen based on the
relative net information flows and its structure is kept unchanged for the entire
analysis period. The best results are obtained in terms of return-to-risk ratios for
RTS and BUX indexes. However, these results are less robust over time and are
sensitive to the financial turbulence climate. Overall, it appears that the degree of
information openness and integration in the international flows are key
determinants of the performances of a trading strategy based on information
linkages.
Such results can be viewed as being relevant not only for practitioners, but also
from a conceptual point of view, as they highlight the asymmetric nature of the
interactions between markets. Thus, this approach may be seen as a possible step in
building up a broader analysis of market imperfections, as these can emerge under
the impact of internal frictionary factors and as a consequence of information
“contamination” processes.
This outcome may be extended in several ways. One direction for follow-up
research would be to involve other types of transfer entropy (for instance, the
Rényi’s information transfer as in Jizba et. al., 2012). A second way of extending
the research would be to involve some explicit determinants of information
transfers (such as the variables from the dynamic choice of portfolio’ structure
problem or other more macroeconomic variables). Thirdly, other types of more
sophisticate trading strategies may be considered. Finally, institutional

Bogdan Dima, Stefana Dima, Flavia Barna, Miruna Nachescu
_________________________________________________________________
characteristics of the markets may be considered. By using transfer entropies with
more complex constructive features and by considering a broader explanatory
framework, this approach may be further enriched.
REFERENCES
[1] Claessens, S., Klingebiel, D. and Schmukler, S.L. (2002), Explaining the
Migration of Stocks from Exchanges in Emerging Economies to
International Centres ; CEPR Discussion Paper 3301;
[2] Dimpfl, T. and Peter, F.J. (2012), Using Transfer Entropy to Measure
Information Flows between Financial Markets. Universität Tübingen SFB
649 Discussion Paper 2012-051;
[3] Gilmore, C.G. and McManus, G.M. (2002), International Portfolio
Diversification: US and Central European Equity Markets; Emerging
Markets Review, 3(1), 69-83;
[4] Harvey, C.R. (1995), Predictable Risk and Returns in Emerging Markets;
Review of Financial Studies, 8(3), 773-816;
[5] Jochum, C., Kirchgässner, G. and Platek, M. (1999), A Long-run
Relationship between Eastern European Stock Markets? Cointegration
and the 1997/98 Crisis in Emerging Markets ; Weltwirtschaftliches Archiv,
135(3), 454-479;
[6] Kizys, R. and Pierdzioch, C. (2011), The Financial Crisis and the Stock
Markets of the CEE Countries; Czech Journal of Economics and Finance,
61(2), 153-172;
[7] Kwon, O. and Oh, G. (2012), Asymmetric Information Flow between
Market Index and Individual Stocks in Several Stock Markets;
Europhysics Letters, 97(2), 28007-28007;
[8] Kwon, O. Yang, J.-S. (2008a), Information Flow between Composite
Stock Index and Individual Stocks . Physica A: Statistical Mechanics and
its Applications, 387(12), 2851-2856;
[9] Kwon, O. and Yang, J.-S. (2008b), Information Flow between Stock
Indices; Europhysics Letters, 82(6), 68003-68003;
[10] Jizba, P., Kleinert, H. and Sheefat, M. (2012), Rényi’s Information
Transfer between Financial Time Series ; available at:
http://arxiv.org/pdf/1106.5913 v3.pdf;
[11] MacDonald, R. (2001), Transformation of External Shocks and Capital
Market Integration; In: The New Capital Markets in Central and Eastern
Europe, edited by M. Schröder, 268-283. Heidelberg: Springer;
[12] Marschinski, R. and Kantz, H. (2002), Analyzing the Information Flow
between Financial Time Series . The European Physical Journal B -
Condensed Matter and Complex Systems, 30(2), 275-281;

How to Trade Using the (Shannonian) Transfer Entropy
________________________________________________________________ [13] Schreiber, T. (2000), Measuring Information Transfer . Physical Review
Letters, 85(2), 461-464;
[14] Schröder, M. and Köke, J. (2002), The Prospects of Capital Markets in
Central and Eastern Europe ; ZEW Discussion Papers 02-57;
[15] Syllignakis, M. and Kouretas, G.P. (2006), Long and Short-Run Linkages
in CEE Stock Markets: Implications for Portfolio Diversification and
Stock Market Integration; William Davidson Institute Working Paper 832;
[16] Syriopoulos, T. (2006), Risk and Return Implications from Investing in
Emerging European Stock Markets; Journal of International Financial
Markets, Institutions, and Money, 16(3), 283–299;
[17] Voronkova, S. (2004), Equity Market Integration in Central European
Emerging Markets: A Cointegration Analysis with Shifting Regimes; International Review of Financial Analysis, 13(5), 633-647;
[18] Wang, P. and Moore, T. (2008), Stock Market Integration for the
Transition Economies: Time-Varying Conditional Correlation Approach ;
The Manchester School, 76(1), 116–133;
[19] Weller, C.E. and Morzuch, B. (2000), International Financial Contagion:
Why are Eastern Europe's Banks not Failing when Everybody else's
are?”; Economics of Transition, 8(3), 639–663;
[20] World Bank (2013), World Development Indicators Database;
http://databank.worldbank.org;
[21] Yuca, A. and Simga-Mugan, C. (2000), Linkages among Eastern
European Stock Markets and the Major Stock Exchanges; Russian and
East European Finance and Trade, 36(6), 54–69.