Embed Size (px)
Citation preview
MID YEAR BUDGET &
PERFORMANCE
ASSESSMENT REPORT
31 DECEMBER 2015
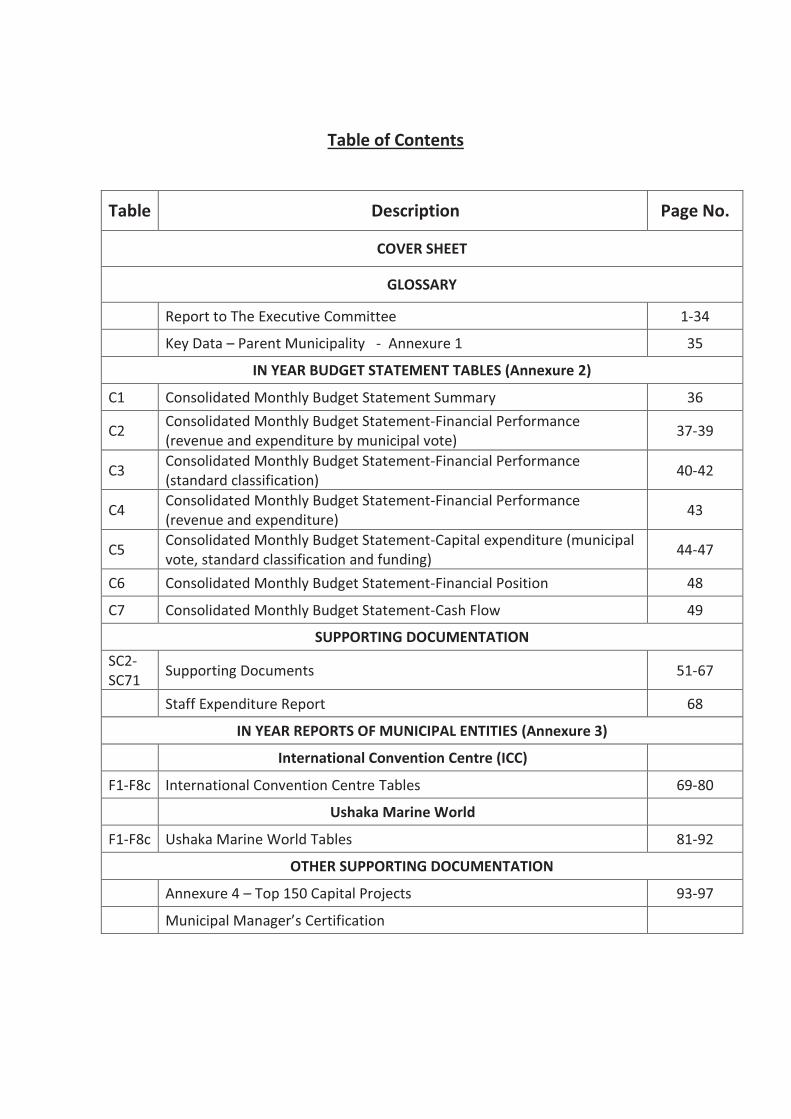
Table of Contents
Table Description Page No.
COVER SHEET
GLOSSARY
Report to The Executive Committee 1-34
Key Data – Parent Municipality - Annexure 1 35
IN YEAR BUDGET STATEMENT TABLES (Annexure 2)
C1 Consolidated Monthly Budget Statement Summary 36
C2 Consolidated Monthly Budget Statement-Financial Performance
(revenue and expenditure by municipal vote) 37-39
C3 Consolidated Monthly Budget Statement-Financial Performance
(standard classification) 40-42
C4 Consolidated Monthly Budget Statement-Financial Performance
(revenue and expenditure) 43
C5 Consolidated Monthly Budget Statement-Capital expenditure (municipal
vote, standard classification and funding) 44-47
C6 Consolidated Monthly Budget Statement-Financial Position 48
C7 Consolidated Monthly Budget Statement-Cash Flow 49
SUPPORTING DOCUMENTATION
SC2-
SC71 Supporting Documents 51-67
Staff Expenditure Report 68
IN YEAR REPORTS OF MUNICIPAL ENTITIES (Annexure 3)
International Convention Centre (ICC)
F1-F8c International Convention Centre Tables 69-80
Ushaka Marine World
F1-F8c Ushaka Marine World Tables 81-92
OTHER SUPPORTING DOCUMENTATION
Annexure 4 – Top 150 Capital Projects 93-97
Municipal Manager’s Certification
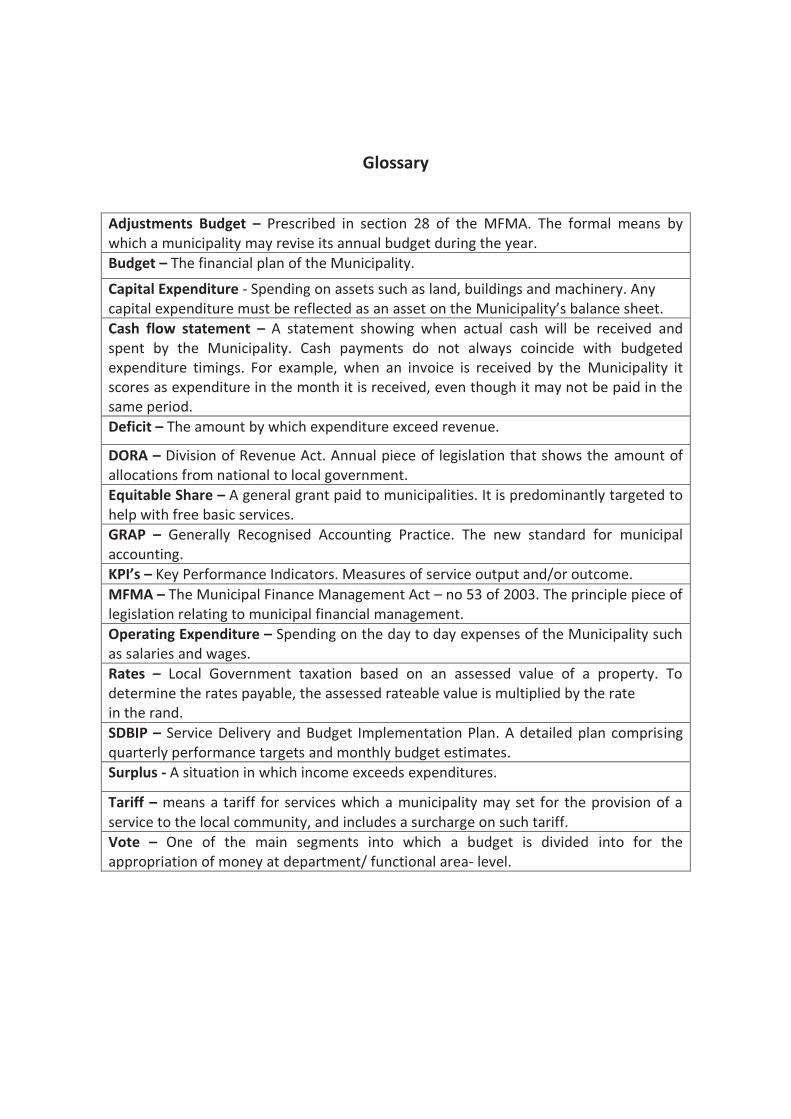
Glossary
Adjustments Budget – Prescribed in section 28 of the MFMA. The formal means by
which a municipality may revise its annual budget during the year.
Budget – The financial plan of the Municipality.
Capital Expenditure - Spending on assets such as land, buildings and machinery. Any
capital expenditure must be reflected as an asset on the Municipality’s balance sheet.
Cash flow statement – A statement showing when actual cash will be received and
spent by the Municipality. Cash payments do not always coincide with budgeted
expenditure timings. For example, when an invoice is received by the Municipality it
scores as expenditure in the month it is received, even though it may not be paid in the
same period.
Deficit – The amount by which expenditure exceed revenue.
DORA – Division of Revenue Act. Annual piece of legislation that shows the amount of
allocations from national to local government.
Equitable Share – A general grant paid to municipalities. It is predominantly targeted to
help with free basic services.
GRAP – Generally Recognised Accounting Practice. The new standard for municipal
accounting.
KPI’s – Key Performance Indicators. Measures of service output and/or outcome.
MFMA – The Municipal Finance Management Act – no 53 of 2003. The principle piece of
legislation relating to municipal financial management.
Operating Expenditure – Spending on the day to day expenses of the Municipality such
as salaries and wages.
Rates – Local Government taxation based on an assessed value of a property. To
determine the rates payable, the assessed rateable value is multiplied by the rate
in the rand.
SDBIP – Service Delivery and Budget Implementation Plan. A detailed plan comprising
quarterly performance targets and monthly budget estimates.
Surplus - A situation in which income exceeds expenditures.
Tariff – means a tariff for services which a municipality may set for the provision of a
service to the local community, and includes a surcharge on such tariff.
Vote – One of the main segments into which a budget is divided into for the
appropriation of money at department/ functional area- level.
REPORT TO
THE EXECUTIVE
COMMITTEE
1
FMB /2015/16 2015-01-19
MID YEAR BUDGET & PERFORMANCE ASSESSMENT REPORT: 31 DECEMBER 2015
The purpose of this report is to comply with Sections 52(d) and 72 of the Municipal Finance Management
Act (MFMA), and Sections 33 and 34 of the Municipal Budget and Reporting Regulations as promulgated in
the Government Gazette No 32141 of 17 April 2009, which requires that specific financial particulars be
reported on and in the formats prescribed.
The report also provides a high level overview of the organisations’ financial viability and sustainability.
BACKGROUND
Section 52(d) of the Municipal Finance Management Act (MFMA) states:
“The Mayor of a municipality must within 30 days of the end of each quarter, submit a report to Council on
the implementation of the budget and the financial state of the municipality;”
Section 72(1)(a)(b) of the Municipal Finance Management Act (MFMA) states:
“The accounting officer of a municipality must by 25 January of each year assess the performance of the
Municipality during the first half of the financial year and submit a report on such assessment to the
Mayor, National Treasury and Provincial Treasury: …”.
Sections 33 and 34 of the Municipal Budget and Reporting Regulations states:
“A mid-year budget and performance assessment of a Municipality must be in the format specified in
Schedule C, and within five working days of 25 January each year, the Municipal Manager must make the
mid-year budget and performance assessment public by placing it on the municipal website…”
The Mid-Year Report and Supporting Tables of eThekwini Municipality and it’s Municipal Entities prepared
in accordance with the Municipal Budget and Reporting Regulations are attached (Pages 35-97).
eThekwini Municipality
REPORT TO THE EXECUTIVE COMMITTEE
2
STATE OF THE ECONOMY
Overview
International Economy
The global economy has been stuck in a holding pattern during 2015, characterised by slow investment
growth which was exacerbated by poor business and consumer confidence, slow investment growth, weak
productivity and series of indecision regarding economic policies for both the public and private sectors.
Despite plenty of technological opportunities and new emerging markets, the global economy lacked a
positive dynamic and was put into a holding pattern which is unlikely to change in the next 12 to 24
months. The growth rate for the world economy has been projected as a modest 2,8% in 2016, up from
2,5% in 2015.
The US economy is expected to be resilient during 2016 in spite of having only solid domestic but weak
global demand, a strong dollar, weak investment and slow productivity growth. Companies may find it
difficult as labour costs increase, labour productivity slackens and interest rates increases.
Recovery is likely to continue In the Eurozone, with domestic demand and exports being the main drivers.
Investment and productivity is likely to improve in the next decade to pave the way for increased growth.
In the Asia-Pacific region, growth is unlikely to improve in 2016 with China’s economy continues to shift
toward a model more dominated by domestic consumption and services, which implies a gradual reduction
in growth. Moreover, China has sufficient policy buffers and tools to address the risk of a more pronounced
slowdown, including relatively low public debt levels and regulations restricting savings outside of the
banking system.
The prolonged decline in commodity prices, as well as weak growth in Nigeria and South Africa has caused
overall growth in 2015 to come in at 3,4% - almost 1,5% lower than 2014. The region still has a lot of
potential for economic expansion in the medium-to-long term, mainly due to its diverse demographic
market; however, several political and institutional constraints need to be overcome.
At the 21st
Conference of the Parties (COP21), held in Paris, two hundred and ninety-five countries adopted
the Paris Agreement which aims to limit global warming to below 20C and with a promise to keep it below
1,50C.
National Economy
The reinstatement of Pravin Gordhan as Finance Minister has reassured investors that the government will
stick to responsible budgeting. This followed after the JSE all-share index lost R196,6 billion and the rand
reached record lows. Gordhan’s first task will be to promote and strengthen the fiscal discipline and
prudence that had characterised the government’s management of public finances.
The credit rating agency Moody’s has lowered the country’s credit-rating to negative, from stable to BAA2.
Higher interest rates and taxes, likely in 2016, will suppress economic growth further, risking credit rating
downgrades.
The CPI inflation rate is expected to average 5,8% year-on-year for 2016. Higher inflation in South Africa
over the next few months will be due to statistical base effects, state administered price increases and
other factors outside the influence of the SARB. Inflation expectations are driven by these exogenous
factors over the period, and so will not be much impacted by raising interest rates. The slight downward
3
trend in the rand price of oil, SA’s key import, has assisted in keeping CPI inflation around the 4,5% year-
on-year mark in 2015, although the impact of the drought is starting to be felt.
The FNB/BER’s consumer confidence index (CCI) fell deeper into negative territory during the 4th quarter of
2015 when the economy contracted and household expenditure virtually stalled. The economic outlook
index recorded -24 (similar to 1993/94), and the time to buy durable goods index to -21 (similar to 2008/09
recession), as the vast majority of consumers believe that South Africa's economic prospects will
deteriorate further over the next year. The confidence levels of high income consumers plunged by 15
index points to a 13-year low of -14”. The high income group in South Africa accounts for the bulk of
consumer spending, and as a consequence the sharp drop in confidence will negatively impact Household
Consumption Expenditure (HCE), and so likely GDP growth, causing the GDP growth outcome for the full
year to be likely closer to 1,0% y/y than 1,5% y/y. Other surveys show retailers are experiencing poor
conditions, while the industrial sector has not yet lifted out of recession this year, interest rates and taxes
have increased and are likely to do so again, while the drought has intensified.
The country’s automotive sector has received a boost with the launch of the combi metre production
facility by Hesto Harnesses in KwaZulu-Natal. The company manufactures wiring harnesses for the
automotive industry from a factory situated in Stanger and supplies automotive electrical distribution
systems to original equipment manufacturers in South Africa. The company is a beneficiary of the
Automotive Production and Development Programme and the Automotive Incentive Scheme and has thus
far created over 2,200 sustainable jobs
South Africa and China has signed agreements worth R94-billion. Agreements were signed in various
sectors including a waiver of visa requirements for diplomatic and official passport holders, the
establishment of a China Cultural Centre in South Africa and cooperation between South African and
Chinese revenue and customs departments. South African state owned enterprises including Eskom,
Transnet, the Industrial Development Corporation, SA National Space Agency and the SA Nuclear
Corporation also signed deals with Chinese institutions. Total trade between South Africa and China grew
from R118 billion in 2009 to R271 billion by the end of 2013.
The Department of Trade and Industry (dti) has welcomed Chinese company YI LI DA - SA’s R150 million
blanket factory which is expected to create 1000 direct jobs in Boksburg, Gauteng. The Chinese company
opened the eco-friendly factory that will produce textile products using recycled polyester products such as
plastic mineral water bottles.
The KZN’s Human Settlement Department has received R308 million from the national department to fund
additional projects. The KZN Human Settlements Department was ranked the top performing provincial
department in housing delivery in the country last year and this year.
Local Highlights
The eThekwini Municipality received its first clean audit in 16 years. Clean audits means financial
statements are free from material misstatements and there is no reporting on performance objectives or
non-compliance with legislation.
Plans are underway to build residential accommodation above the Bridge City Shopping Centre, as well as
on the northern side of the complex. The interchange of the M25 will also connect Bridge City and the
Phoenix Industrial Park and is a key transport link for Durban.
4
Development Update
Dube Tradeport
The Dube TradePort Corporation has been successful in attracting R 1, 4 billion in private sector investment
to date. The first phase of the Dube TradeZone development has attracted a considerable sum of the total
investment value that Dube TradePort has been able to secure in the last 36 months. A number of
investments including Samsung Electronics, which is involved in the manufacturing of televisions and
monitors; Brenco Reelin, who are active in the refurbishment of train bearings and seals and Rossi SA who
are involved in the assembly, repair and distribution of gearboxes that are destined for the mining industry.
DB Schenker - another large multinational logistics and warehousing company is also located within Dube
TradeZone. All of these organisations are currently fully operational within the zone and bring a mix of
services and facilities to the business platform, which, in the long term is hoping to add value to other
industries down the value chain within surrounding developments. Eureka Capital SA is another large
investor within Dube City, a mixed-use commercial property development that has invested in a 21, 500m ²
six-story building. The building will house offices as well as an innovation centre, which will add value to a
number of knowledge-intensive technology industries.
Ntshongweni Regional Economic Hub
This development is set to unlock opportunities for regional growth along the western corridor. The
proposed development will be anchored by a regional retail facility, logistics and distribution activities
residential development.
Cornubia
This multi-billion rand human settlement development is KwaZulu-Natal’s biggest and comprises
residential, commercial and industrial components in a single location. This public-private partnership is the
province’s first (and only) Cabinet Lekgotla-endorsed Priority Project. The development has generated
significant interest from the private sector and is also situated on the planned ‘Go Durban’ rapid rail route.
Clairwood Logistics Park
The Clairwood Logistics Park is located at the old Clairwood Race Course and is set to meet the growing
demand for A-grade logistics space and distribution facilities in the South of Durban. It will create an
estimated 18,000 jobs during the 4-year construction period and more than 4,000 jobs after completion in
December 2020. The Capital Property Fund purchased the site and will invest approximately R3, 5 billion to
develop it. This includes an R110 million roads and infrastructure update surrounding the facility.
Finningley Development
This is a multibillion-rand project proposed along the south of Durban on the Sapphire Coast. It is a mixed-
use and integrated development with a focus on cutting-edge innovation and sustainable green technology
that will include resorts, schools, research facilities, an airport, as well as residential, agricultural and
industrial developments.
Point Waterfront Project
The Point Waterfront is being developed per the Development Framework Plan by the eThekwini
Municipality. The Durban Point Waterfront Development Company is the primary developer and is
presently working to revitalise development according to this new Plan. The company has applied for an
5
amendment to the Scheme Clauses and the Environmental Authorisation to allow for a number of changes,
which will enhance the development opportunities and benefits for Durban.
The Small Craft Harbour is no longer proposed and this will allow the promenade to be extended and this
will eventually accommodate water sports clubs facilities, the seine netters and parking for the public
beneath the walkway. Vetch’s Pier will not be impacted on by new development proposals as all
construction will be located behind the building setback line to eliminate developments in the seashore
zone and improve beach access to the public. The land use will includes proposals for a mix of residential,
office, hotels, and retail and entertainment facilities.
EThekwini Film City
This is one of the largest private investments in the city to be located on the Natal Command site on the
Durban beachfront. This R7 billion project will comprise a number of components that work together to
ensure economic viability. The development will be anchored by eThekwini Film Studios which will consist
of sound stages and production workshops, the Walk of Fame, a television studio, editing suites, a back lot
set area Midway Centre and a museum of South African cinema. This development will become the hub for
the film industry and is expected to create 17,000 jobs during the construction phase and more than 8,000
jobs during operations.
Keystone Park
Keystone Park is a 152-hectare logistics and light industrial precinct on the N3 near the Hammarsdale
interchange. This R6 billion economic catalyst project for the Hammarsdale/Mpumulanga region received
regulatory approval to commence development during 2014 and is now being constructed as a fully
serviced precinct to accommodate logistics facilities. The construction phase is expected to create 3,500
jobs and over 6,000 direct jobs during operations.
CONCLUSION
GDP growth rates have been pegged below 3% for the global, national and local economies in 2016 as the
challenges of commodity prices, political conflict and persistent unemployment may continue to feature.
The local economy will once again be buoyed by the run-up to the 2022 Commonwealth Games which will
hopefully see an increase in tourism numbers which will impact positively on the hospitality industry
sectors.
In the midst of the usual challenges from the various spheres, the city will continue to strive towards the
adoption and practice of smart-city concepts by seeking to combine creativity with new technology,
especially amongst our youth. The city has also made significant advances in the informal economy; green
economy; investment incentives and more recently on the City Planning Commission consultation, all of
which will assist in fine-tuning a long-term growth strategy for the eThekwini region.
KEY DATA: PARENT MUNICIPALITY (ANNEXURE 1 - PAGE 35)
Annexure 1 includes certain Key Financial Performance Indicators for the Parent Municipality (i.e.
excluding municipal entities).
6
IN YEAR BUDGET STATEMENT TABLES: DECEMBER 2015 REPORT (ANNEXURE 2)
The consolidated financial results (including entities) for the month ended 31 December 2015 are
attached, consisting of the prescribed tables in terms of Government Gazette 32141 of 17 April 2009 as
indicated in Annexures 2, Pages 36-49.
Table C1 (Page 36) provides a high level summation of the operating and capital budgets, actuals to date,
financial position and cash flow.
Table C2 (Pages 37-39 is an overview of the budgeted financial performance in relation to revenue and
expenditure per standard classification.
Table C3 (Pages 40-42) shows budgeted financial performance in relation to the revenue and expenditure
as well as the operating surplus or deficit.
Table C4 (Page 43) is a view of the budgeted financial performance in relation to the revenue by source
and expenditure by type.
Table C5 (Pages 44-47) reflects the capital programme in relation to capital expenditure by municipal
vote; capital expenditure by standard classification; and funding sources required to fund the capital
budget, including information on capital transfers from national and provincial departments.
Table C6 (Page 48) reflects the performance to date in relation to the financial position of the
municipality.
Table C7 (Page 49) indicates the cash flow position and cash/cash equivalents
BUDGET PERFORMANCE ANALYSIS: PARENT MUNICIPALITY
Summary Statement of Financial Performance (Page 60: Table SC10)
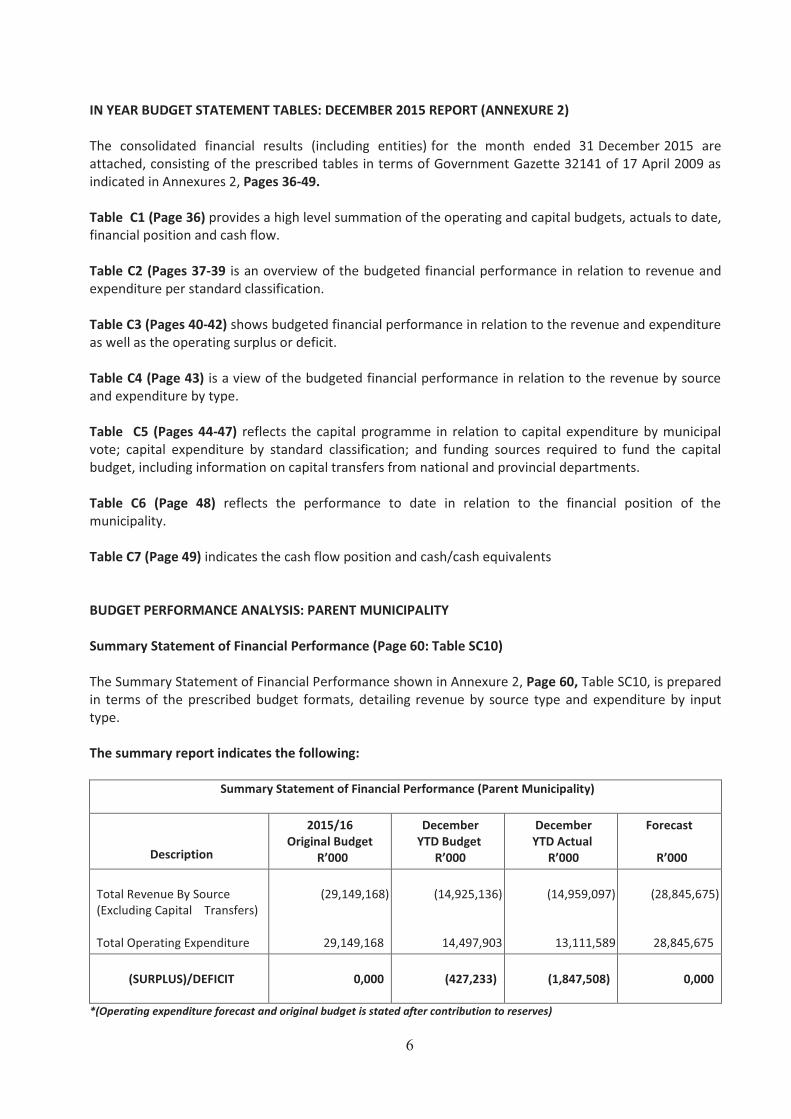
The Summary Statement of Financial Performance shown in Annexure 2, Page 60, Table SC10, is prepared
in terms of the prescribed budget formats, detailing revenue by source type and expenditure by input
type.
The summary report indicates the following:
Summary Statement of Financial Performance (Parent Municipality)
Description
2015/16
Original Budget
R’000
December
YTD Budget
R’000
December
YTD Actual
R’000
Forecast
R’000
Total Revenue By Source
(Excluding Capital Transfers)
Total Operating Expenditure
(29,149,168)
29,149,168
(14,925,136)
14,497,903
(14,959,097)
13,111,589
(28,845,675)
28,845,675
(SURPLUS)/DEFICIT
0,000
(427,233) (1,847,508)
0,000
*(Operating expenditure forecast and original budget is stated after contribution to reserves)
7
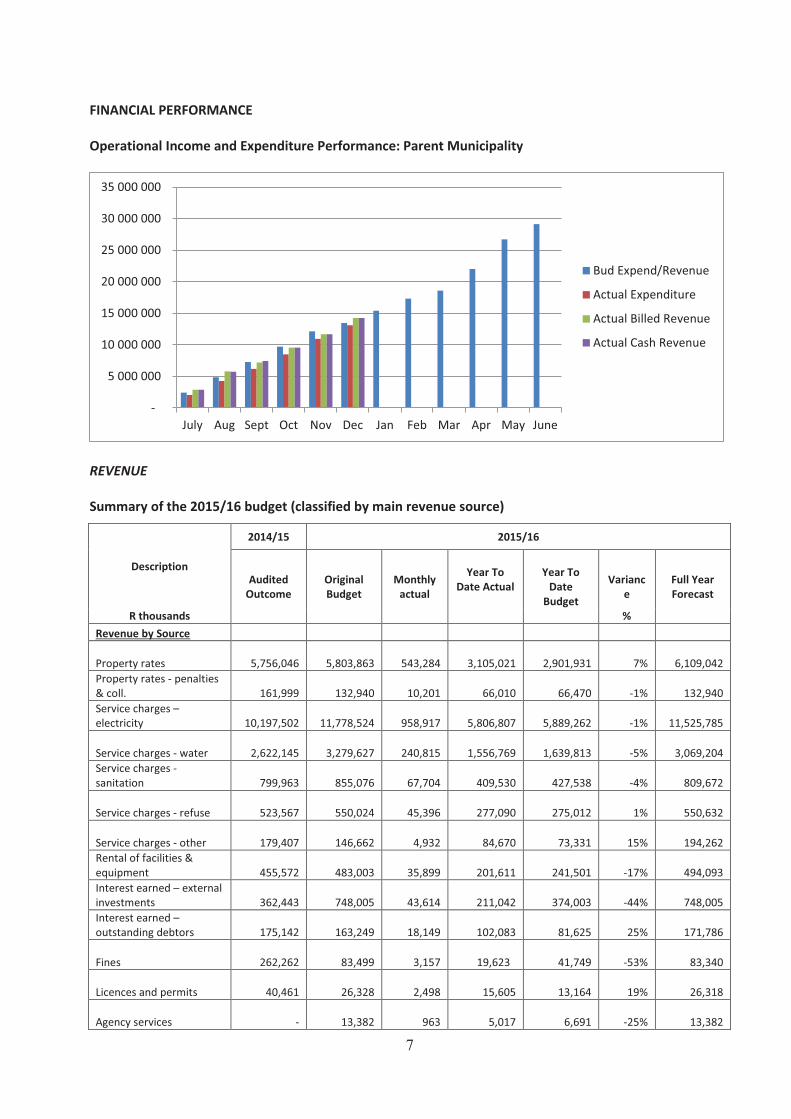
FINANCIAL PERFORMANCE
Operational Income and Expenditure Performance: Parent Municipality
REVENUE
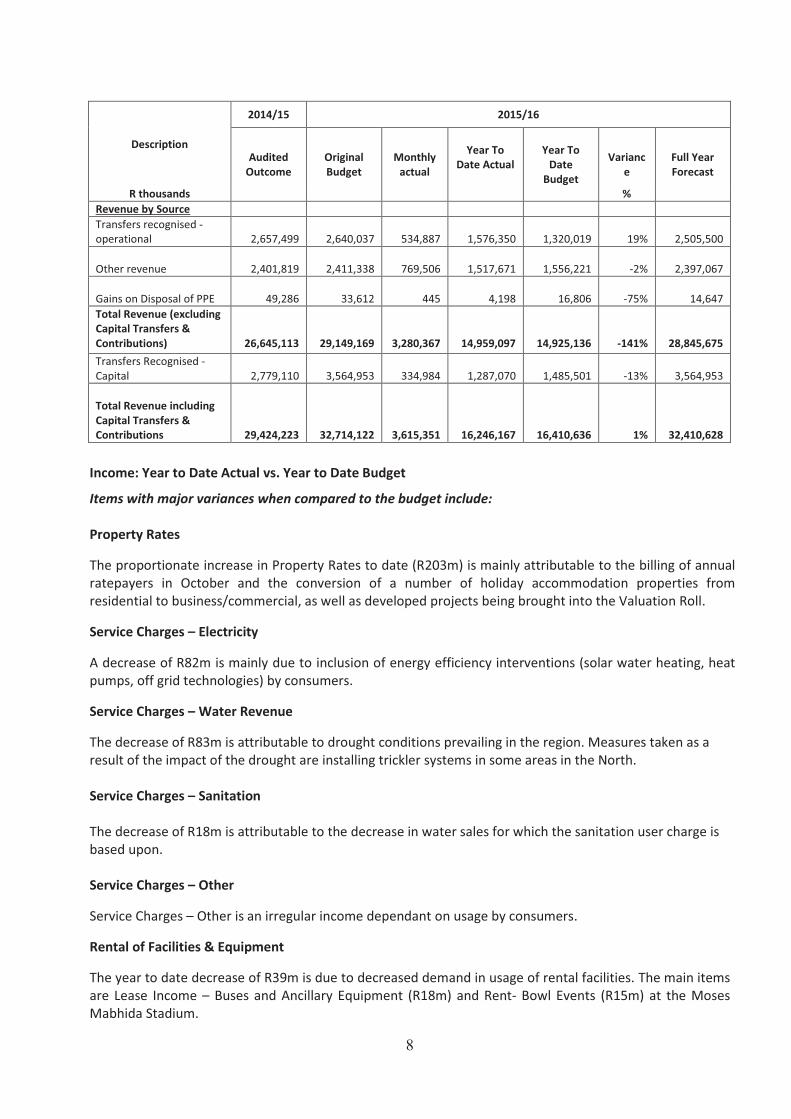
Summary of the 2015/16 budget (classified by main revenue source)
Description
2014/15 2015/16
Audited
Outcome
Original
Budget
Monthly
actual
Year To
Date Actual
Year To
Date
Budget
Varianc
e
Full Year
Forecast
R thousands
%
Revenue by Source
Property rates
5,756,046
5,803,863
543,284
3,105,021 2,901,931 7%
6,109,042
Property rates - penalties
& coll.
161,999
132,940
10,201
66,010
66,470
-1%
132,940
Service charges –
electricity
10,197,502
11,778,524
958,917
5,806,807 5,889,262 -1%
11,525,785
Service charges - water
2,622,145
3,279,627
240,815
1,556,769 1,639,813 -5%
3,069,204
Service charges -
sanitation
799,963
855,076
67,704
409,530 427,538 -4%
809,672
Service charges - refuse
523,567
550,024
45,396
277,090 275,012 1%
550,632
Service charges - other
179,407 146,662 4,932
84,670 73,331 15% 194,262
Rental of facilities &
equipment
455,572 483,003
35,899
201,611 241,501 -17% 494,093
Interest earned – external
investments
362,443
748,005
43,614
211,042 374,003 -44%
748,005
Interest earned –
outstanding debtors
175,142
163,249
18,149
102,083 81,625 25%
171,786
Fines
262,262 83,499
3,157
19,623 41,749 -53% 83,340
Licences and permits
40,461
26,328
2,498
15,605 13,164 19%
26,318
Agency services
-
13,382 963
5,017 6,691 -25%
13,382
-
5 000 000
10 000 000
15 000 000
20 000 000
25 000 000
30 000 000
35 000 000
July Aug Sept Oct Nov Dec Jan Feb Mar Apr May June
Bud Expend/Revenue
Actual Expenditure
Actual Billed Revenue
Actual Cash Revenue
8
Description
2014/15 2015/16
Audited
Outcome
Original
Budget
Monthly
actual
Year To
Date Actual
Year To
Date
Budget
Varianc
e
Full Year
Forecast
R thousands
%
Revenue by Source
Transfers recognised -
operational
2,657,499
2,640,037 534,887
1,576,350 1,320,019 19%
2,505,500
Other revenue
2,401,819
2,411,338
769,506
1,517,671 1,556,221 -2%
2,397,067
Gains on Disposal of PPE
49,286
33,612 445
4,198 16,806 -75%
14,647
Total Revenue (excluding
Capital Transfers &
Contributions)
26,645,113
29,149,169
3,280,367
14,959,097
14,925,136
-141%
28,845,675
Transfers Recognised -
Capital
2,779,110
3,564,953 334,984
1,287,070 1,485,501 -13%
3,564,953
Total Revenue including
Capital Transfers &
Contributions
29,424,223 32,714,122 3,615,351
16,246,167 16,410,636 1% 32,410,628
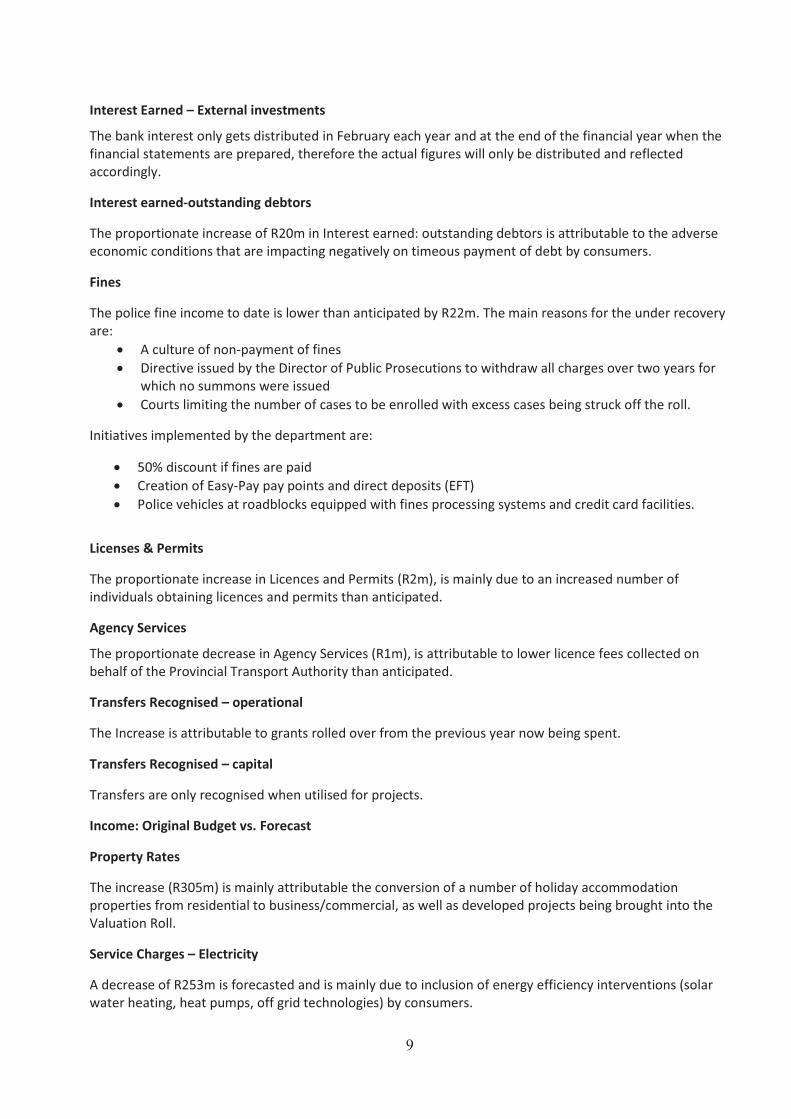
Income: Year to Date Actual vs. Year to Date Budget
Items with major variances when compared to the budget include:
Property Rates
The proportionate increase in Property Rates to date (R203m) is mainly attributable to the billing of annual
ratepayers in October and the conversion of a number of holiday accommodation properties from
residential to business/commercial, as well as developed projects being brought into the Valuation Roll.
Service Charges – Electricity
A decrease of R82m is mainly due to inclusion of energy efficiency interventions (solar water heating, heat
pumps, off grid technologies) by consumers.
Service Charges – Water Revenue
The decrease of R83m is attributable to drought conditions prevailing in the region. Measures taken as a
result of the impact of the drought are installing trickler systems in some areas in the North.
Service Charges – Sanitation
The decrease of R18m is attributable to the decrease in water sales for which the sanitation user charge is
based upon.
Service Charges – Other
Service Charges – Other is an irregular income dependant on usage by consumers.
Rental of Facilities & Equipment
The year to date decrease of R39m is due to decreased demand in usage of rental facilities. The main items
are Lease Income – Buses and Ancillary Equipment (R18m) and Rent- Bowl Events (R15m) at the Moses
Mabhida Stadium.
9
Interest Earned – External investments
The bank interest only gets distributed in February each year and at the end of the financial year when the
financial statements are prepared, therefore the actual figures will only be distributed and reflected
accordingly.
Interest earned-outstanding debtors
The proportionate increase of R20m in Interest earned: outstanding debtors is attributable to the adverse
economic conditions that are impacting negatively on timeous payment of debt by consumers.
Fines
The police fine income to date is lower than anticipated by R22m. The main reasons for the under recovery
are:
· A culture of non-payment of fines
· Directive issued by the Director of Public Prosecutions to withdraw all charges over two years for
which no summons were issued
· Courts limiting the number of cases to be enrolled with excess cases being struck off the roll.
Initiatives implemented by the department are:
· 50% discount if fines are paid
· Creation of Easy-Pay pay points and direct deposits (EFT)
· Police vehicles at roadblocks equipped with fines processing systems and credit card facilities.
Licenses & Permits
The proportionate increase in Licences and Permits (R2m), is mainly due to an increased number of
individuals obtaining licences and permits than anticipated.
Agency Services
The proportionate decrease in Agency Services (R1m), is attributable to lower licence fees collected on
behalf of the Provincial Transport Authority than anticipated.
Transfers Recognised – operational
The Increase is attributable to grants rolled over from the previous year now being spent.
Transfers Recognised – capital
Transfers are only recognised when utilised for projects.
Income: Original Budget vs. Forecast
Property Rates
The increase (R305m) is mainly attributable the conversion of a number of holiday accommodation
properties from residential to business/commercial, as well as developed projects being brought into the
Valuation Roll.
Service Charges – Electricity
A decrease of R253m is forecasted and is mainly due to inclusion of energy efficiency interventions (solar
water heating, heat pumps, off grid technologies) by consumers.
10
Service Charges – Water Revenue
The decrease of R 210m is attributable to drought conditions prevailing in the region. Measures taken as a
result of the impact of the drought are installing trickler systems in some areas in the North and providing
water via water tankers.
Service Charges – Sanitation Revenue
The decrease of R 45m is attributable to the decrease in water sales for which the sanitation user charge is
based upon.
Service Charges – Refuse Revenue
The increase in income is due to services being rolled out to new customers.
Rental of Facilities & Equipment
The increase of R11m is due to an anticipated increase in income from commercial tenancies collection in
the second half of the year.
Licenses & Permits
The proportionate increase in Licences and Permits is mainly due to an increased number of individuals
obtaining licences and permits than anticipated.
Transfers Recognised – Operational
The forecasted decrease (R135m) is attributable to the recalling of unspent conditional grants (PTIS and
NDPG) by National Treasury. However, negotiations are taking place with National Treasury and should the
outcome be favourable the forecast would be amended accordingly.
Other Revenue
The decrease is attributable to decreases in various minor items of Revenue.
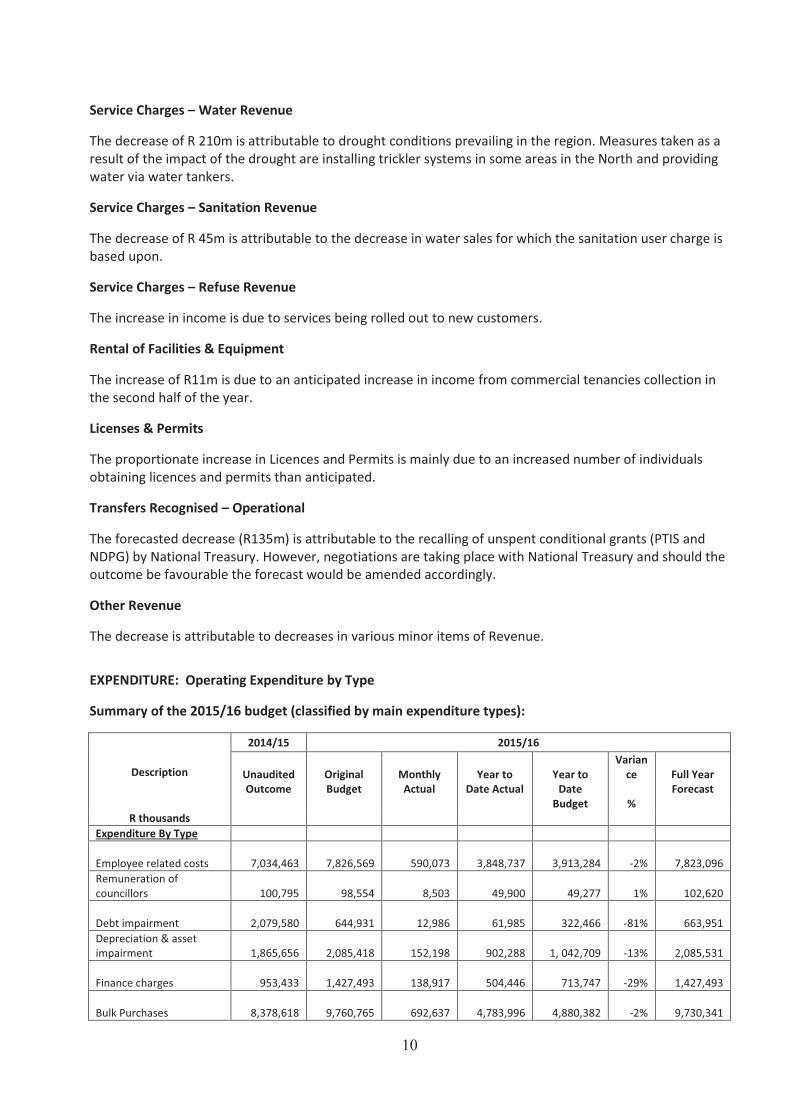
EXPENDITURE: Operating Expenditure by Type
Summary of the 2015/16 budget (classified by main expenditure types):
Description
2014/15 2015/16
Unaudited
Outcome
Original
Budget
Monthly
Actual
Year to
Date Actual
Year to
Date
Budget
Varian
ce
%
Full Year
Forecast
R thousands
Expenditure By Type
Employee related costs
7,034,463
7,826,569 590,073
3,848,737 3,913,284 -2%
7,823,096
Remuneration of
councillors
100,795
98,554 8,503 49,900 49,277 1%
102,620
Debt impairment
2,079,580
644,931 12,986 61,985 322,466 -81%
663,951
Depreciation & asset
impairment
1,865,656
2,085,418 152,198 902,288 1, 042,709 -13%
2,085,531
Finance charges
953,433
1,427,493 138,917 504,446 713,747 -29%
1,427,493
Bulk Purchases
8,378,618
9,760,765 692,637
4,783,996 4,880,382 -2%
9,730,341
11
Description
R thousands
2014/15 2015/16
Unaudited
Outcome
Original
Budget
Monthly
Actual
Year to
Date Actual
Year to
Date
Budget
Varian
ce
%
Full Year
Forecast
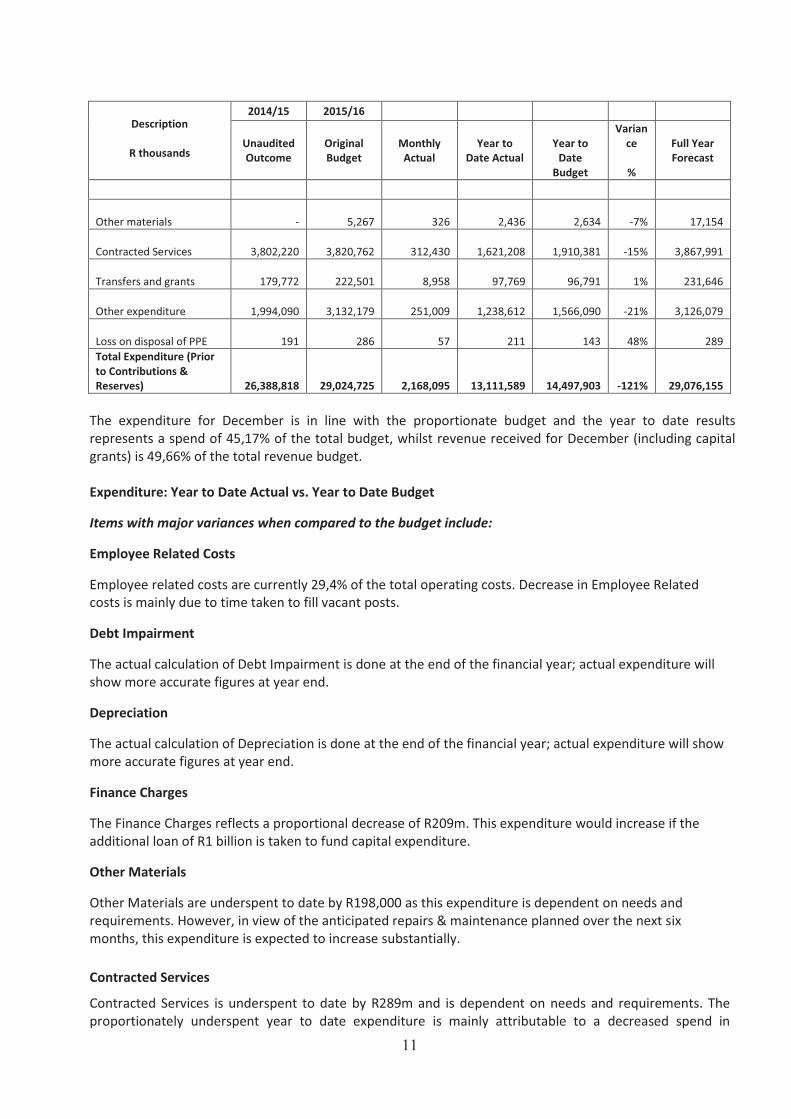
Other materials
- 5,267 326 2,436 2,634 -7% 17,154
Contracted Services
3,802,220 3,820,762 312,430
1,621,208
1,910,381 -15% 3,867,991
Transfers and grants
179,772
222,501 8,958 97,769 96,791 1%
231,646
Other expenditure
1,994,090
3,132,179 251,009
1,238,612 1,566,090 -21%
3,126,079
Loss on disposal of PPE
191
286 57 211 143 48%
289
Total Expenditure (Prior
to Contributions &
Reserves)
26,388,818
29,024,725 2,168,095
13,111,589 14,497,903 -121%
29,076,155
The expenditure for December is in line with the proportionate budget and the year to date results
represents a spend of 45,17% of the total budget, whilst revenue received for December (including capital
grants) is 49,66% of the total revenue budget.
Expenditure: Year to Date Actual vs. Year to Date Budget
Items with major variances when compared to the budget include:
Employee Related Costs
Employee related costs are currently 29,4% of the total operating costs. Decrease in Employee Related
costs is mainly due to time taken to fill vacant posts.
Debt Impairment
The actual calculation of Debt Impairment is done at the end of the financial year; actual expenditure will
show more accurate figures at year end.
Depreciation
The actual calculation of Depreciation is done at the end of the financial year; actual expenditure will show
more accurate figures at year end.
Finance Charges
The Finance Charges reflects a proportional decrease of R209m. This expenditure would increase if the
additional loan of R1 billion is taken to fund capital expenditure.
Other Materials
Other Materials are underspent to date by R198,000 as this expenditure is dependent on needs and
requirements. However, in view of the anticipated repairs & maintenance planned over the next six
months, this expenditure is expected to increase substantially.
Contracted Services
Contracted Services is underspent to date by R289m and is dependent on needs and requirements. The
proportionately underspent year to date expenditure is mainly attributable to a decreased spend in
12
Buildings (R86m), Structures (R38m), Network Maintenance (R9m), Rail Sidings (R14m), Roads & Streets –
General (R26m), Lines & Signs- Other (R6m) and other smaller items of expenditure.
Contracted Services include Repairs & Maintenance.
Repairs and Maintenance expressed as a percentage of Operating Expenditure is 9,68% and is slightly under
the norm set by National Treasury of 10-11%. Repairs & Maintenance include work performed by external
contractors as well as own staff. Internal repair refers to maintenance costs charged out between
departments. This percentage is expected to increase by year end.
Other Expenditure
A decrease in Other Expenditure of R327m is mainly attributable to a decreased spend in General Expenses.
The main areas of underspending are Asset Management (R8m), Brand Advertising (R13m), Water (R59m),
Fuel and Oil (R19m), Hire of Plant & Vehicle (R19m), Inner City Sustainable Cleaning Programme (R9m),
Licence & Registration Fees (R10m), Economic Development Program (R10m), Special events (R10m),
Urban Improvement Precinct (R8m), and various other smaller items of expenditure. The spending patterns
are similar to the previous year and an acceleration of spending is anticipated in the ensuing months.
Expenditure: Original Budget vs. Forecast
Employee Related Costs
Decrease in Employee Related Costs is due to time taken to fill vacant posts. However, with many
departments currently in the process of restructuring, a more informed forecast will be made in the
ensuing months.
Debt Impairment
In view of the present economic climate an increase in debt to be impaired is anticipated.
Bulk Purchases
The decrease of R 30m in Bulk Purchases – Water is attributable to the decrease in sales (Refer Service
Charges note).
Transfers and Grants
The forecasted increase in Transfers and Grants (R9m) is a result of a Council resolution for the installation
and reticulation of Flamingo Court with water pipes and meters. The expenditure will be regularized via an
adjustments budget report to be submitted to Council in February 2016.
STAFF EXPENDITURE REPORT (PAGE 68)
The Staff Expenditure Report is submitted in terms of Section 66 of the Municipal Finance Management Act,
which states that the Accounting Officer of a Municipality must, in a format and for periods as may be
prescribed, report to the Council on all expenditure incurred by the municipality on staff salaries, wages,
allowances and benefits, and in a manner that discloses such expenditure per type of expenditure, namely-
a) Salaries and wages
b) Contributions for pensions and medical aid
c) Travel, motor car, accommodation, subsistence and other allowances
d) Housing benefits and allowances
e) Overtime payments
f) Loans and advances
g) Any other type of benefit or allowance related to staff
13
CAPITAL EXPENDITURE AND FUNDING: (PARENT MUNICIPALITY)
The Capital expenditure report reflected in Annexure 2, Page Numbers 44-47 Table C5, has been
prepared on the basis of the format required to be lodged electronically with National Treasury and is
categorised by municipal vote. The capital expenditure is funded from the four sources viz.:
· Government Grants;
· Public Contributions and Donations;
· Borrowings;
· Internally Generated Funds
Capital Budget Performance: Parent Municipality (Excluding Municipal Entities)
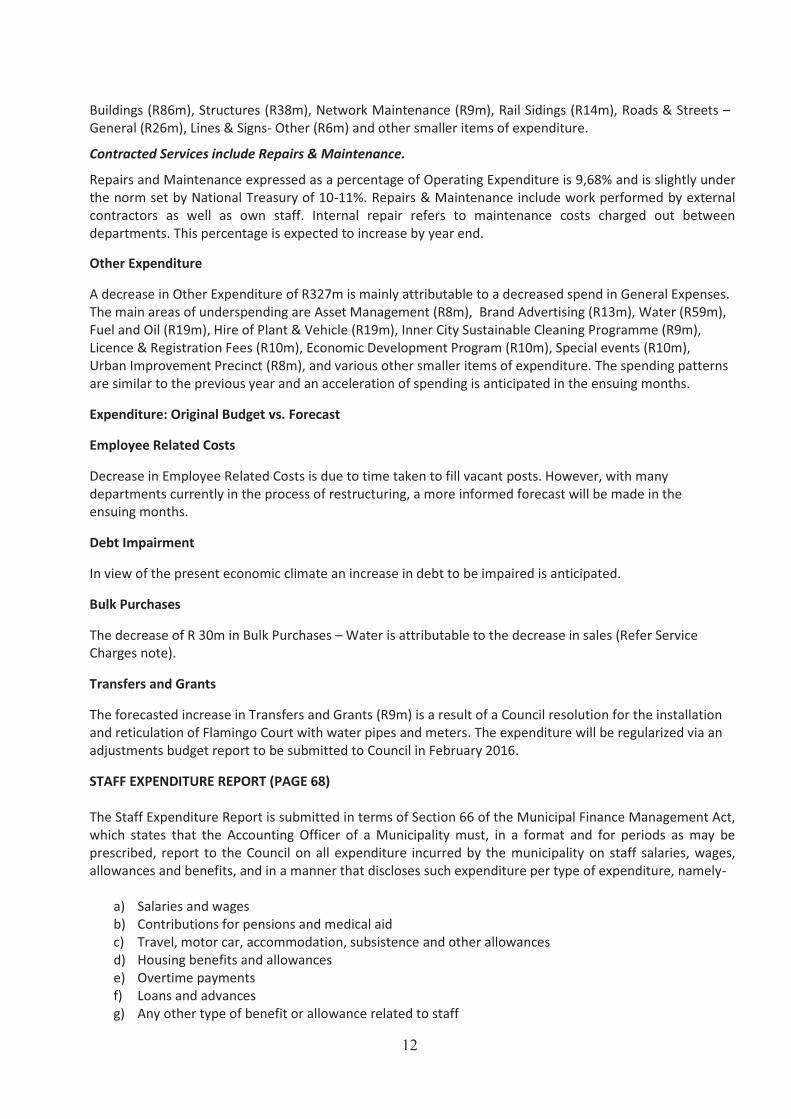
In the sixth month of trading only 33,28% (December 2014: 49,31%) of the capital budget has been spent.
However as in the case of past years there would be an acceleration of spending in the ensuing months and
whilst departments are forecasting a 102,12% spend, more accurate projections will unfold in the months
to follow.
Progressive Capital Budget vs. Actual
The following Chart compares the actual spend on capital against the total approved capital budget of the
parent municipality, and does not include the capital spend by municipal entities.
-
1 000 000
2 000 000
3 000 000
4 000 000
5 000 000
6 000 000
7 000 000
July Aug Sept Oct Nov Dec Jan Feb Mar Apr May June
Budgeted Expenditure
Actual Expenditure
Summary Statement of Capital Expenditure : December 2015
Description
2015/16
Budget
R’000
December
YTD Budget
R’000
December
YTD Actual
R’000
Forecast
R’000
Total Capital Expenditure
Total Capital Financing
5,969,188
5,969,188
2,088,618
2,088,618
1,986,294
1,986,294
6,072,050
6,072,050
14
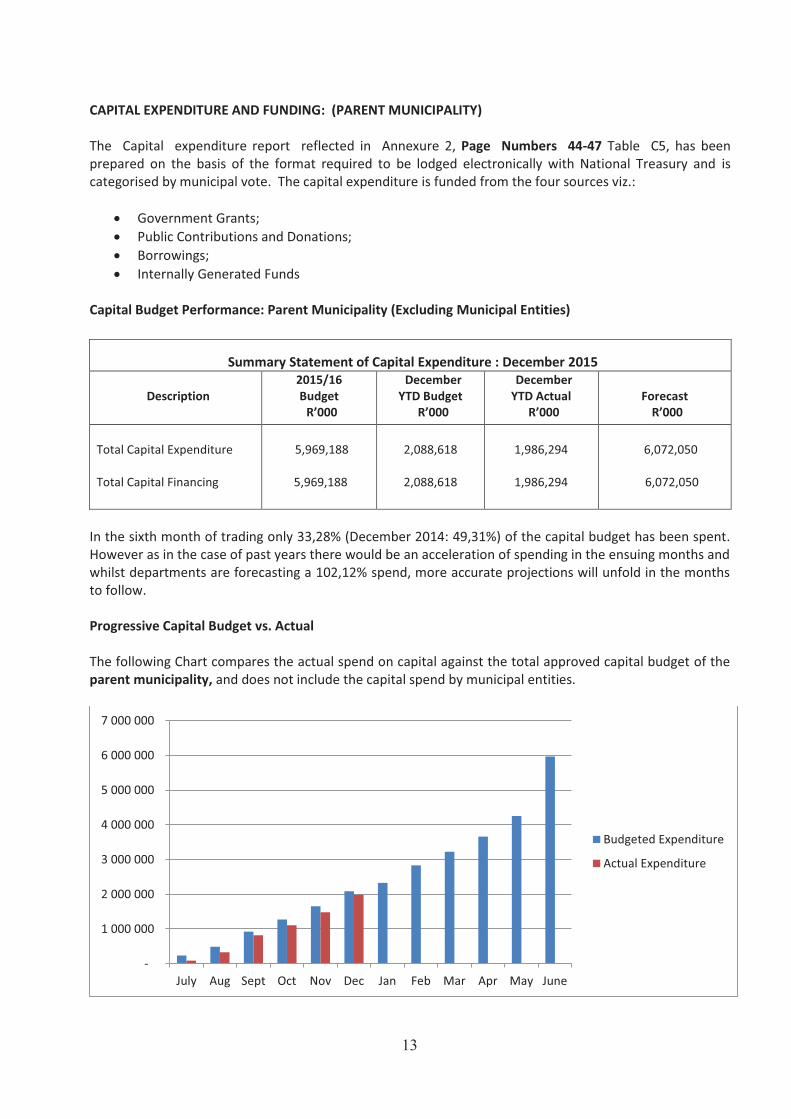
The main areas of the capital spend are as follows (Parent Municipality):
Departments Note Original
Budget
Actual
YTD
Spend
Unpaid
Invoice
Total YTD
Spend
Total
YTD %
Spend
As a %
of
Overall
Spend
Forecast
F/Cast
%
Spend
R’000 R’000 R’000 R’000 % R’000 %
Housing 1 1,218,930 314,394 0,000 314,394 25,79 15,83 1,218,930 100,00
Water 2 813,191 257,168 0,000 257,168 31,62 12,95 813,189 100,00
Sanitation 3 558,701 88,165 0,000 88,165 15,78 4,44 557,415 99,77
Solid Waste 4 84,198 26,809 0,000 26,809 31,84 1,35 105,310 125,07
Governance,&
International Rel. 5 18,280 2,787 0,000 2,787 15,24 0,14 14,245 77,93
Finance 6 112,886 39,360 0,000 39,360 34,87 1,98 200,503 177,62
OCM:Zonal Plans 7 234,000 2,464 0,000 2,464 1,05 0,12 234,000 100,00
Engineering 8 626,487 163,844 3,534 167,378 26,72 8,43 626,487 100,00
Electricity 9 636,422 211,581 0,000 211,581 33,25 10,65 643,008 101,03
CES : Health &
Security Services 10 206,823 51,910 0,000 51,910 25,10 2,61 207,723 100,43
CES: Safety &
Security Services 11 89,198 36,100 0,000 36,100 40,47 1,82 89,520 100,36
Economic Dev. &
Planning 12 245,081 36,177 0,000 36,177 14,76 1,82 235,849 96,23
EThekwini Transport
Authority 13 1,014,874 556,608 146,389 702,997 69,27 35,39 1,014,874 100,00
OCM : IT & Metro
Police 14 92,917 43,760 0,000 43,760 47,10 2,20 93,797 100,95
Corporate Human
Resources 15 17,200 5,244 0,000 5,244 30,49 0,26 17,200 100,00
Total
5,969,188 1,836,371 149,923 1,986,294 33,28 100,00 6,072,050 101,72
In certain instances the forecasted spend is higher than the original budget as a result of re-prioritising
projects to accelerate service delivery. The re-prioritisation will be regularized via an adjustments budget
report to be submitted to Council in February 2016.
Notes
Housing
Challenges in the implementation of Projects:
· The Cornubia Housing awards for seven contractors were delayed due to challenges around unit
cost and funding. The BAC had approved the awards on 5th October after negotiations. Inview of
the festive season, the contractors are due to commence construction in February 2016.
· The Alternative Technology Program was only recently finalized. The 12 projects utilizing
Alternative Technology is also due to commence construction in February 2016.
15
The unit has reprioritized its capital spend and an adjustment budget was submitted to Executive
Committee in November 2015 and which will be ratified when the adjustments budget is tabled at Council
in February 2016 in terms of the MFMA.
Water
Challenges in the implementation of Projects:
· Umnini Reservoir delayed due to problems experienced with land acquisition (R15m). The land
construction will only commence in May 2016.
· Delay in the awarding of the pressure reducing valves contract WS6609 (WTB 2015/010)
Construction will commence in May 2016.
· Zwelibomvu Reservoir delayed due to land issues relating to the demands by Ndimande family
(R17m).
· Ensimbini Reservoir – Construction was delayed due to SCM, EIA and WULA delays, Contract
appeals, lengthy process
· Western and Northern Aqueducts – delays due to sporadic unrest, violence and demands from
communities
Umnini Reservoir - Timeous reporting to Committee for the transfer of budget to other projects. 2016/17
budget in the process of being revised. Zwelibomvu - Deal brokered with the Ndimande family has
collapsed due to unrealistic demands. A revised design changing the reservoir footprint has been done and
authority has been requested from Council. Ensimbini Reservoir – Acceleration of design input to finalise
outcomes. Department to reduce times for items that are within their control with respect to EIA, WULA
and SCM. Western and Northern Aqueducts – Significant delays have been caused but work is proceeding
at present – professional teams are dealing with issues as and when they arise.
Sanitation
Challenges in implementation of Projects:
· Ablution projects – All contracts have only now been awarded with the exception of the modular
structures and containers contract that is still in the process. Work will now commence.
Solid Waste
Challenges in implementation of Projects:
· Moratorium was placed on acquiring of vehicles.
Contracts for sweepers have been approved, awaiting letter of award. Contract for Landfill Compactors and
D7 Dozer is to be submitted to BEC on 18 January 2016.
Governance and International Relations
Challenges in implementation of Projects:
· Project CSA 2563 – Air conditioning upgrade evaluation has now been completed by Architecture
and a Report has been submitted to BEC. Tender award is now awaited and expenditure
anticipated thereafter.
16
· Savings caused by the delays in evaluation of CSA 2563 will be used to complete the installation of
CCTV/PA systems and trunking infrastructure at City Hall, a report has been submitted in this
regard.
Finance
Challenges in implementation of Projects:
· The major challenges being experienced are with respect to building refurbishments and/or
enhancements of a similar nature.
· There are certain projects that have been held back by items such as scaffolding requests for
windows and paintings.
· All works on Florence Mkhize Building affecting the 10th floor have been put on hold due to
waterproofing issues.
· The air conditioning is a challenge as it requires a complete shutdown of the server to prevent
overheating. This shutdown is problematic due to various system enhancements on the go and
certain system runs being delayed.
· The procurement of vehicles through RT 57-2015 contract is dependent on the National Treasury’s
BAC decision. A request was sent to National Treasury requesting an authority to use the contract;
however this has been going back and forth. Several reports were sent and came back for
amendments. Awaiting outcome of National Treasury - BAC meeting on this issue.
There have been monthly meetings with Architecture as well as regular feedback from the line
departments to ascertain the progress made. The challenges relating to projects that have obtained design
approval are being fast tracked to ensure implementation. Items that require scaffolding are not quite so
straightforward and these projects may have to be curtailed and delayed for later years. The 10th
floor
waterproofing has been fast tracked. With respect to the new SCM building, a portion of the funds have
been reprioritized to construct an archives room for contracts section and purchasing department.
OCM: Zonal Plans
Challenges in implementation of Projects:
· Only 27 of 78 wards have submitted projects for 2015/16 in respect of the zonal budget.
· Projects can take up to eight months to implement.
· Environmental Impact Assessment and land acquisitions can delay project implementation.
Projects are identified or still being identified by departments that will be undertaken in 2015/16. In future
years departments will be requested to provide projects during the budget approval process and therefore
avoid block sums. Departments are liaising with Councillors to identify projects to be undertaken during the
year.
Engineering
Challenges in implementation of Projects:
· Significant progress has been made on projects and it is anticipated that actual expenditure will be
increased in the next few months.
· Majority of the expenditure will be recorded in the latter part of the financial year and the unit is
confident of meeting expenditure targets.
17
Electricity
Challenges in implementation of Projects:
· Smart Metering Project – A tender was awarded to a consultant to pilot this project. Timelines
were not adhered to resulting in delayed rollout of the project. R15m remains unspent to date for
this financial year.
· Klaarwater/Umgeni OHTL - The project requires refurbishment of aging Tower Structures and
overhead lines to a value of R30m and has been delayed by two years owing to the lack of in-house
skilled artisans required to work at high altitudes. The first tender to engage external contractors
had been unresponsive and a new tender has been issued to Procurement for re-advertising.
· Communications Networks – Challenges were faced with the appointed contractor who failed to
perform as per agreed specifications. The tender has been resubmitted to the Bid Committee and
new offers are being awaited. Only R8m of the allocated budget of R18m is expected to be spent in
the 2015/16 financial year.
Community and Emergency Services (HSS)
Challenges in implementation of Projects:
· New Central Library – Tender document was approved at BEC and was submitted to BAC; it was
referred back to BEC to address some questions. BEC went through issues and re-affirmed their
decision. A legal opinion as well as an Internal Audit opinion has to be obtained prior to
resubmission to BAC. Legal opinion has been provided; Internal Audit is expected to provide their
opinion which is awaited for. A meeting with Internal Audit is being arranged.
· Agriculture – PQ orders in progress, the bulk of the budget will be reprioritized.
· Kings Park Pool – At design stage, cash flow and procurement schedule not yet received by line
department, declared as savings.
· Shallcross Pool CSA 2096– Project is progressing within the cash flow projection.
· Rachel Finlayson Pool – Construction in progress, currently working on the options of considering
length and depth to meet Common Wealth Games standards within the existing tender.
· Inanda Swimming Pool – BSC 17/08/2015, Advert 21/08/2015, Contractors are on site and project
is progressing within cash projections.
· Specialised Equipment – Tender closed on the 18th of September 2015. Submitted to BAC on
02/11/2015. Letter of award to be issued.
· Whetstone library - The Contractor abandoned the site in October and is in breach of the principal
building contract. A registered letter has been issued indicating the breach and request to return to
site. Awaiting consultation with Legal.
· Kwa-Muhle Museum underpinning - The contractor was awarded on the 7/09/2015. Delays were
experienced due to health and safety file as well as AMAFA compliance. Health and safety file has
been approved. AMAFA application has been confirmed. Contractor is on site.
· Architectural Services not meeting Bid Committee dates.
· Compliance e.g. WULA and EIA e.g. Howlong Park (Project handed over to Dev. Eng.), Umkhumbi
Sport field.
18
Community and Emergency Services (SSS)
Challenges in implementation of Projects:
· Specialist Support Vehicles: Fire – EXCO approval obtained, request to obtain quotations supported
by BAC. City Manager’s approval obtained, awaiting letter of award. Due to long lead time, will not
be delivered by 30 June. Commitment for 2016/17.
· Fire & Emergency Training Centre – emanating from discussions with Architectural Services, agreed
project subject to reallocation via the adjustments budget process to provide for professional fees
only.
· Renovations and Alterations: Hammarsdale - emanating from discussions with Architectural
Services, agreed project subject to reallocation via the adjustments budget process to allow for
resolution of legal issues pertaining to land.
· Renovations and Alterations: Prospecton - emanating from discussions with Architectural Services,
agreed project subject to reallocation via the adjustments budget process to provide for
professional fees only.
In direct consultation with Architectural Services regarding three development projects inview of delayed
awards being made, budgets to provide for professional fees in the current financial year and work being
packaged to be undertaken in 2016/17. Specialist support Vehicles – is being progressed through BAC with
the assistance of City Fleet.
Economic Development Planning
Challenges in implementation of Projects:
· Environmental land acquisition – the budget for land acquisition will be spent at the end of the
financial year. During the course of the year, valuations are requested, negotiations with land
owners are undertaken, sales agreements are signed and the necessary approvals obtained. As
such, actual expenditure only takes place in the last quarter.
· There have been delays with the implementation of some of the capital budget projects, due to the
finalization of technical specifications. The implementation of the Kwa Mnyandu link road in Umlazi
has been affected; due to a change in the technical solution to provide the link road from Griffiths
Mxenge Road in Umlazi D-Section to Umlazi’s T & Q Sections.
· Further delays expected due to the Project Manager from the implementing department
abandoning the three projects, new person to be assigned.
· Beachfront Project – Implementation is now on track.
Real Estates and the Environmental Planning and Climate Protection Department hold quarterly land
acquisition liaison meetings to discuss progress in each land acquisition project. These meetings are held to
ensure that the capital budget is spent within the financial year. The three projects are being addressed
with the Architecture Department to have them expedited. It is anticipated that most of the construction
phase in implementing these projects, along with the associated expenditure will be undertaken in the
second half of the financial year.
eThekwini Transport Authority
Challenges in implementation of Projects:
· IRPTN construction is in progress.
19
Taxi ranks related projects are on track and the budget will be fully spent by the end of the financial year.
Corporate Human Resources
The design of the Kloof Training Centre has been completed and the SCM process will begin shortly.
THE TOP 150 PROJECTS (PAGES 93-97)
The top 150 projects are in terms of value. The percentage spend on these projects as at 31 December
2015 is approximately 28,7%. Detailed information on the top 150 projects is indicated on Annexure 4,
hereto.
GRANT UTILISATION – 31 DECEMBER 2015
Detailed information on the grants and subsidies for the 2015/2016 financial year is reflected on Table
SC6/SC7, pages 55-57
A high level summary of the information is as follows:-
Description Original Budget
(R’000)
YTD Actual
Received
(R’000)
YTD
Utilisation
(R’000)
Total Grants and Subsidies Received/
utilised
6,204,990
2,973,265
2,863,420
Percentage received/utilised of original
budget
47,92%
46,15%
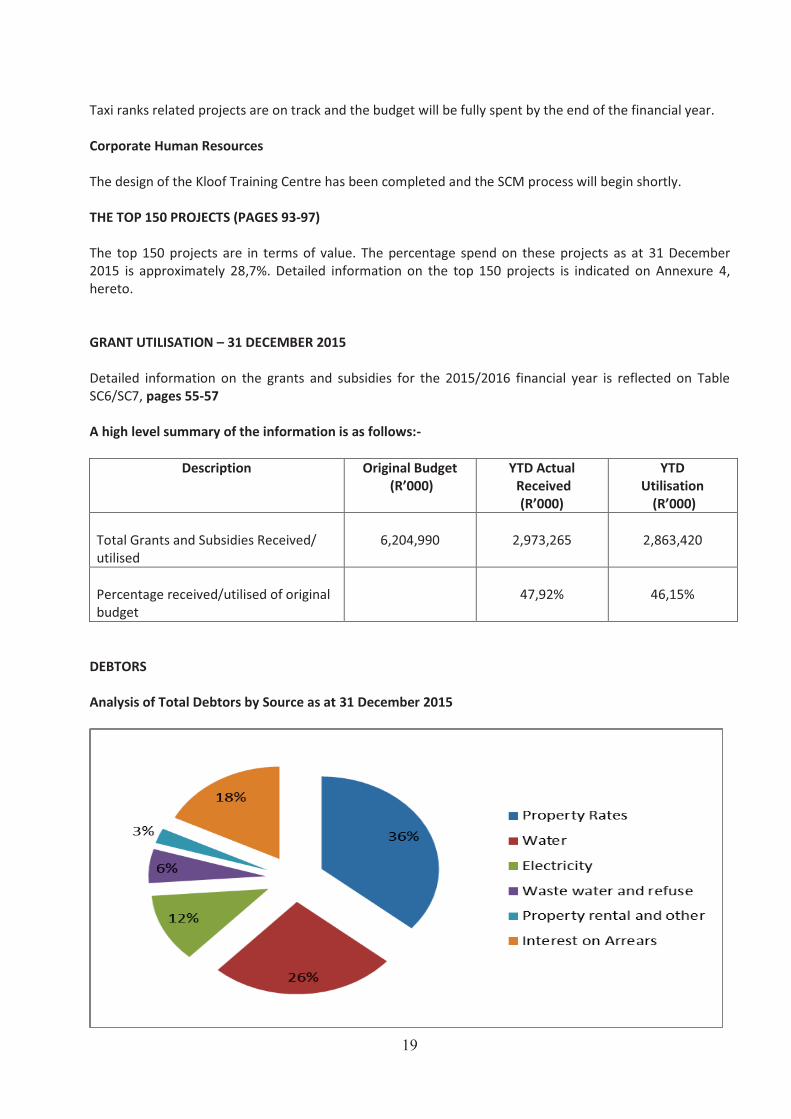
DEBTORS
Analysis of Total Debtors by Source as at 31 December 2015
20
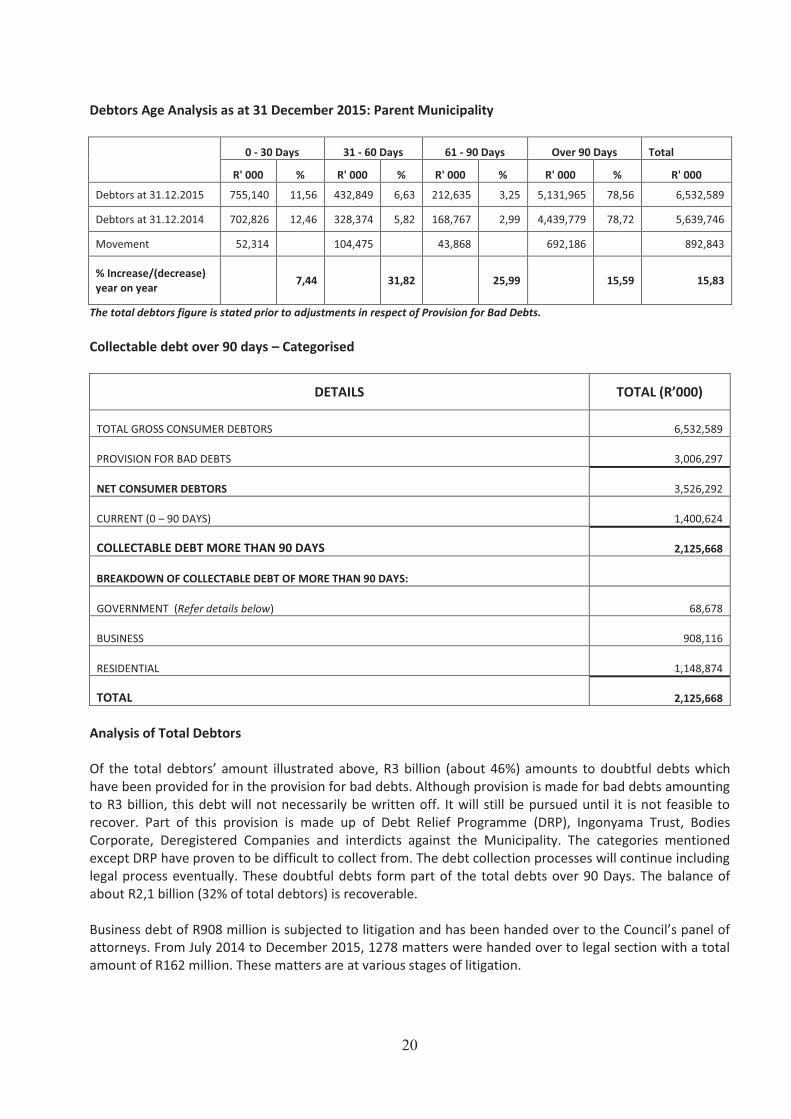
Debtors Age Analysis as at 31 December 2015: Parent Municipality
0 - 30 Days 31 - 60 Days 61 - 90 Days Over 90 Days Total
R' 000 % R' 000 % R' 000 % R' 000 % R' 000
Debtors at 31.12.2015 755,140 11,56 432,849 6,63 212,635 3,25 5,131,965 78,56 6,532,589
Debtors at 31.12.2014 702,826 12,46 328,374 5,82 168,767 2,99 4,439,779 78,72 5,639,746
Movement 52,314 104,475 43,868 692,186 892,843
% Increase/(decrease)
year on year 7,44 31,82 25,99 15,59 15,83
The total debtors figure is stated prior to adjustments in respect of Provision for Bad Debts.
Collectable debt over 90 days – Categorised
DETAILS TOTAL (R’000)
TOTAL GROSS CONSUMER DEBTORS 6,532,589
PROVISION FOR BAD DEBTS 3,006,297
NET CONSUMER DEBTORS 3,526,292
CURRENT (0 – 90 DAYS) 1,400,624
COLLECTABLE DEBT MORE THAN 90 DAYS 2,125,668
BREAKDOWN OF COLLECTABLE DEBT OF MORE THAN 90 DAYS:
GOVERNMENT (Refer details below) 68,678
BUSINESS 908,116
RESIDENTIAL 1,148,874
TOTAL 2,125,668
Analysis of Total Debtors
Of the total debtors’ amount illustrated above, R3 billion (about 46%) amounts to doubtful debts which
have been provided for in the provision for bad debts. Although provision is made for bad debts amounting
to R3 billion, this debt will not necessarily be written off. It will still be pursued until it is not feasible to
recover. Part of this provision is made up of Debt Relief Programme (DRP), Ingonyama Trust, Bodies
Corporate, Deregistered Companies and interdicts against the Municipality. The categories mentioned
except DRP have proven to be difficult to collect from. The debt collection processes will continue including
legal process eventually. These doubtful debts form part of the total debts over 90 Days. The balance of
about R2,1 billion (32% of total debtors) is recoverable.
Business debt of R908 million is subjected to litigation and has been handed over to the Council’s panel of
attorneys. From July 2014 to December 2015, 1278 matters were handed over to legal section with a total
amount of R162 million. These matters are at various stages of litigation.
21
Debt from Residential Properties includes:
· Rates & Services consumed in households with a property value of less than R250,000 which
would qualify for the Debt Relief Program amounting to R552m.
· Rates & Services consumed in properties owned by “private” individuals in the Ingonyama Trust
area. These do not form part of the Ingonyama Trust Debt as listed on the Government Schedule
below, but rather a separate matter.
· Deceased and Insolvent estates.
Irrecoverable Debt
An amount of R690,858 was written off in the first quarter of the year because all reasonable notifications
and cost-effective legal avenues had been exhausted to recover these amounts. An amount of R259,968
out of R690,858 was written off because the cost to recover the debt did not warrant further action as the
debt was R2,500 and below.
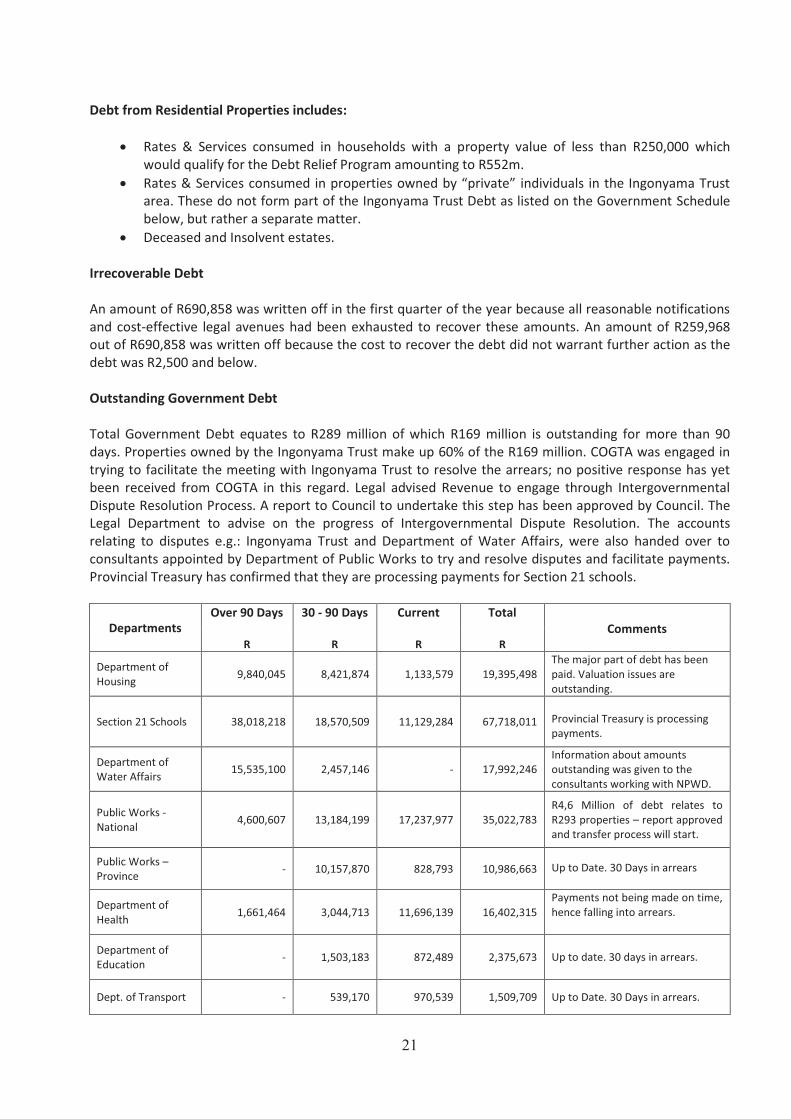
Outstanding Government Debt
Total Government Debt equates to R289 million of which R169 million is outstanding for more than 90
days. Properties owned by the Ingonyama Trust make up 60% of the R169 million. COGTA was engaged in
trying to facilitate the meeting with Ingonyama Trust to resolve the arrears; no positive response has yet
been received from COGTA in this regard. Legal advised Revenue to engage through Intergovernmental
Dispute Resolution Process. A report to Council to undertake this step has been approved by Council. The
Legal Department to advise on the progress of Intergovernmental Dispute Resolution. The accounts
relating to disputes e.g.: Ingonyama Trust and Department of Water Affairs, were also handed over to
consultants appointed by Department of Public Works to try and resolve disputes and facilitate payments.
Provincial Treasury has confirmed that they are processing payments for Section 21 schools.
Departments
Over 90 Days 30 - 90 Days Current Total
Comments
R R R R
Department of
Housing 9,840,045 8,421,874 1,133,579 19,395,498
The major part of debt has been
paid. Valuation issues are
outstanding.
Section 21 Schools 38,018,218 18,570,509 11,129,284 67,718,011
Provincial Treasury is processing
payments.
Department of
Water Affairs 15,535,100 2,457,146 - 17,992,246
Information about amounts
outstanding was given to the
consultants working with NPWD.
Public Works -
National 4,600,607 13,184,199 17,237,977 35,022,783
R4,6 Million of debt relates to
R293 properties – report approved
and transfer process will start.
Public Works –
Province - 10,157,870 828,793 10,986,663 Up to Date. 30 Days in arrears
Department of
Health 1,661,464 3,044,713 11,696,139 16,402,315
Payments not being made on time,
hence falling into arrears.
Department of
Education - 1,503,183 872,489 2,375,673
Up to date. 30 days in arrears.
Dept. of Transport - 539,170 970,539 1,509,709 Up to Date. 30 Days in arrears.
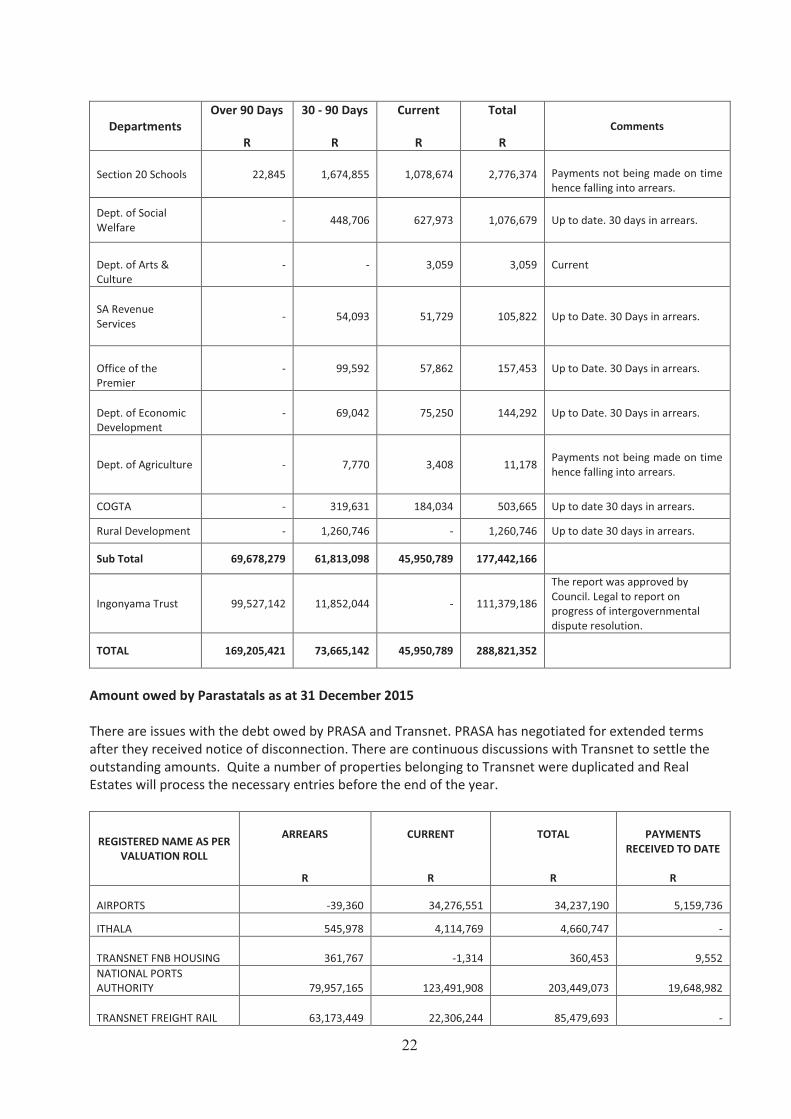
22
Departments
Over 90 Days
R
30 - 90 Days
R
Current
R
Total
R
Comments
Section 20 Schools 22,845 1,674,855 1,078,674 2,776,374
Payments not being made on time
hence falling into arrears.
Dept. of Social
Welfare - 448,706 627,973 1,076,679
Up to date. 30 days in arrears.
Dept. of Arts &
Culture
- - 3,059 3,059 Current
SA Revenue
Services
- 54,093 51,729 105,822 Up to Date. 30 Days in arrears.
Office of the
Premier
- 99,592 57,862 157,453 Up to Date. 30 Days in arrears.
Dept. of Economic
Development
- 69,042 75,250 144,292 Up to Date. 30 Days in arrears.
Dept. of Agriculture - 7,770 3,408 11,178
Payments not being made on time
hence falling into arrears.
COGTA - 319,631 184,034 503,665 Up to date 30 days in arrears.
Rural Development - 1,260,746 - 1,260,746 Up to date 30 days in arrears.
Sub Total 69,678,279 61,813,098 45,950,789 177,442,166
Ingonyama Trust 99,527,142 11,852,044 - 111,379,186
The report was approved by
Council. Legal to report on
progress of intergovernmental
dispute resolution.
TOTAL 169,205,421 73,665,142 45,950,789 288,821,352
Amount owed by Parastatals as at 31 December 2015
There are issues with the debt owed by PRASA and Transnet. PRASA has negotiated for extended terms
after they received notice of disconnection. There are continuous discussions with Transnet to settle the
outstanding amounts. Quite a number of properties belonging to Transnet were duplicated and Real
Estates will process the necessary entries before the end of the year.
REGISTERED NAME AS PER
VALUATION ROLL
ARREARS
R
CURRENT
R
TOTAL
R
PAYMENTS
RECEIVED TO DATE
R
AIRPORTS -39,360 34,276,551 34,237,190 5,159,736
ITHALA 545,978 4,114,769 4,660,747 -
TRANSNET FNB HOUSING 361,767 -1,314 360,453 9,552
NATIONAL PORTS
AUTHORITY 79,957,165 123,491,908 203,449,073 19,648,982
TRANSNET FREIGHT RAIL 63,173,449 22,306,244 85,479,693
-
23
REGISTERED NAME AS PER
VALUATION ROLL
ARREARS
R
CURRENT
R
TOTAL
R
PAYMENTS
RECEIVED TO DATE
R
TRANSNET PROPERTY 1,554,915 4,196,156 5,751,071 49,275
TRANSNET LIGHTHOUSE -142,290 3,339 -138,951 -
TRANSNET PIPELINES 103,041 2,874,640 2,977,681 475,445
TRANSNET ENG - 12,129,095 12,129,095 2,021,516
TRANSNET SOC - 309,123 309,123 -
PRASA 40,214,045 11,559,892 51,773,937 20,811,310
TOTAL 185,728,709 215,260,404 400,989,113 48,175,816
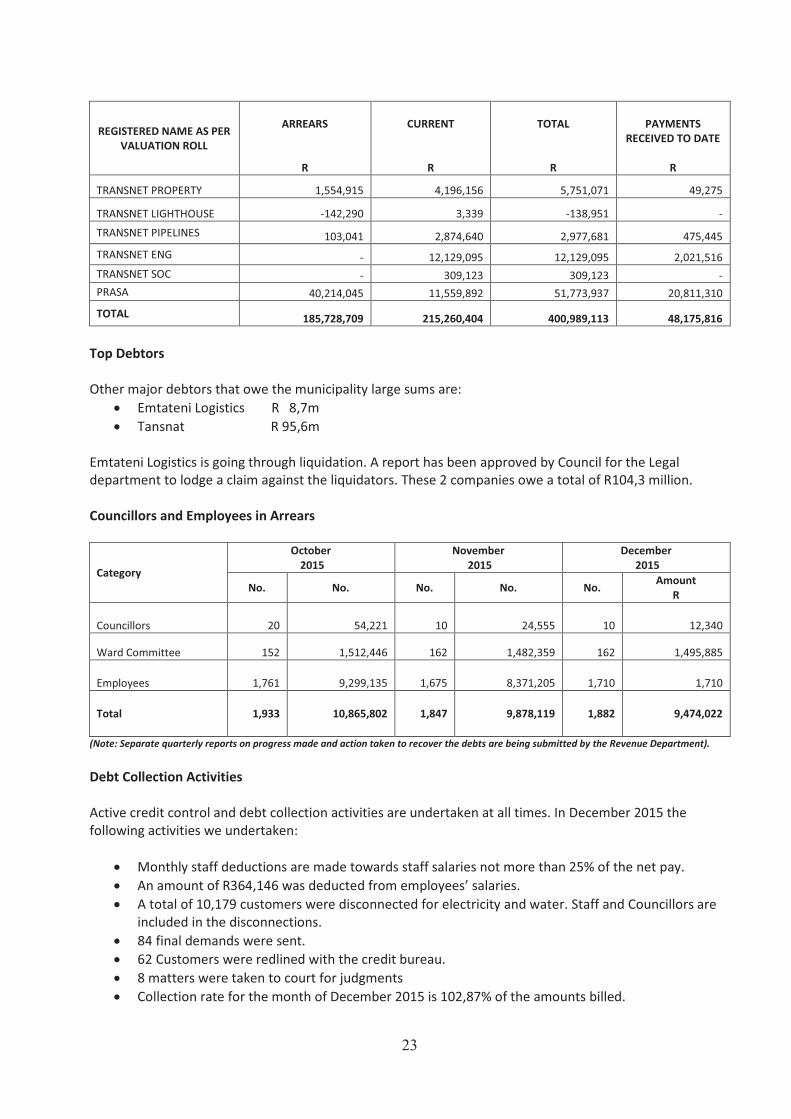
Top Debtors
Other major debtors that owe the municipality large sums are:
· Emtateni Logistics R 8,7m
· Tansnat R 95,6m
Emtateni Logistics is going through liquidation. A report has been approved by Council for the Legal
department to lodge a claim against the liquidators. These 2 companies owe a total of R104,3 million.
Councillors and Employees in Arrears
Category
October
2015
November
2015
December
2015
No. No. No. No. No. Amount
R
Councillors 20 54,221 10 24,555 10 12,340
Ward Committee 152 1,512,446 162 1,482,359 162 1,495,885
Employees 1,761 9,299,135 1,675 8,371,205 1,710 1,710
Total 1,933 10,865,802 1,847 9,878,119 1,882 9,474,022
(Note: Separate quarterly reports on progress made and action taken to recover the debts are being submitted by the Revenue Department).
Debt Collection Activities
Active credit control and debt collection activities are undertaken at all times. In December 2015 the
following activities we undertaken:
· Monthly staff deductions are made towards staff salaries not more than 25% of the net pay.
· An amount of R364,146 was deducted from employees’ salaries.
· A total of 10,179 customers were disconnected for electricity and water. Staff and Councillors are
included in the disconnections.
· 84 final demands were sent.
· 62 Customers were redlined with the credit bureau.
· 8 matters were taken to court for judgments
· Collection rate for the month of December 2015 is 102,87% of the amounts billed.
24
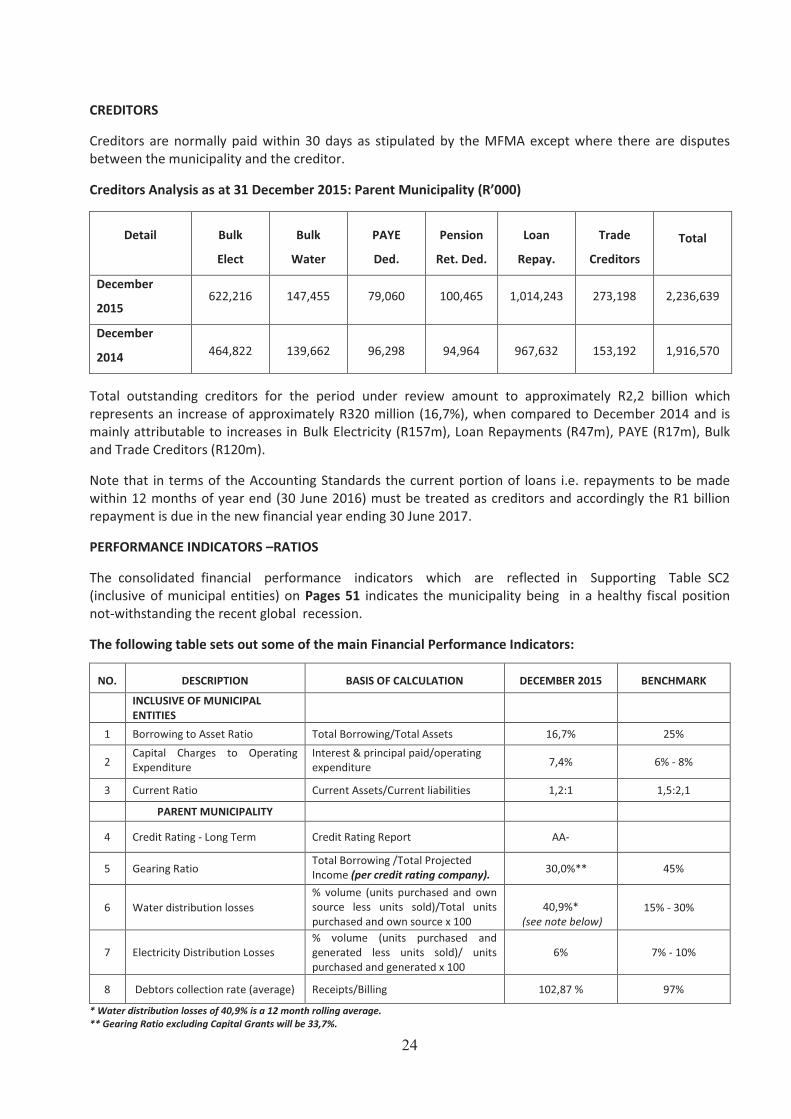
CREDITORS
Creditors are normally paid within 30 days as stipulated by the MFMA except where there are disputes
between the municipality and the creditor.
Creditors Analysis as at 31 December 2015: Parent Municipality (R’000)
Detail
Bulk
Elect
Bulk
Water
PAYE
Ded.
Pension
Ret. Ded.
Loan
Repay.
Trade
Creditors
Total
December
2015 622,216 147,455 79,060 100,465 1,014,243 273,198 2,236,639
December
2014
464,822
139,662
96,298
94,964
967,632
153,192
1,916,570
Total outstanding creditors for the period under review amount to approximately R2,2 billion which
represents an increase of approximately R320 million (16,7%), when compared to December 2014 and is
mainly attributable to increases in Bulk Electricity (R157m), Loan Repayments (R47m), PAYE (R17m), Bulk
and Trade Creditors (R120m).
Note that in terms of the Accounting Standards the current portion of loans i.e. repayments to be made
within 12 months of year end (30 June 2016) must be treated as creditors and accordingly the R1 billion
repayment is due in the new financial year ending 30 June 2017.
PERFORMANCE INDICATORS –RATIOS
The consolidated financial performance indicators which are reflected in Supporting Table SC2
(inclusive of municipal entities) on Pages 51 indicates the municipality being in a healthy fiscal position
not-withstanding the recent global recession.
The following table sets out some of the main Financial Performance Indicators:
NO.
DESCRIPTION
BASIS OF CALCULATION
DECEMBER 2015
BENCHMARK
INCLUSIVE OF MUNICIPAL
ENTITIES
1 Borrowing to Asset Ratio Total Borrowing/Total Assets 16,7% 25%
2 Capital Charges to Operating
Expenditure
Interest & principal paid/operating
expenditure 7,4% 6% - 8%
3 Current Ratio Current Assets/Current liabilities 1,2:1 1,5:2,1
PARENT MUNICIPALITY
4 Credit Rating - Long Term Credit Rating Report AA-
5 Gearing Ratio Total Borrowing /Total Projected
Income (per credit rating company). 30,0%** 45%
6 Water distribution losses
% volume (units purchased and own
source less units sold)/Total units
purchased and own source x 100
40,9%*
(see note below)
15% - 30%
7 Electricity Distribution Losses
% volume (units purchased and
generated less units sold)/ units
purchased and generated x 100
6% 7% - 10%
8 Debtors collection rate (average) Receipts/Billing 102,87 % 97%
* Water distribution losses of 40,9% is a 12 month rolling average.
** Gearing Ratio excluding Capital Grants will be 33,7%.
25
1. Borrowing to Asset Ratio
This ratio indicates the extent to which net assets are funded from loan funds. Whilst it is desirable to curb
external borrowings, one must understand that the huge backlogs in infrastructure and service delivery are
being addressed. Although the 16,7% ratio appears favourable, the municipality’s cash flows and ability to
service debt must be considered when determining the extent of borrowings.
2. Capital Charges to Operating Expenditure
Capital charges to operating expenditure (the measure of the cost of borrowing in relation to the operating
expenditure) is 7,4% as at 31 December 2015 which is within the norm set by National Treasury of 6% - 8%.
This percentage will increase as repayments are made.
3. Current Ratio
The ratio measures the short term liquidity, that is, the extent to which the current liabilities can be paid
from current assets. The higher the ratio, the healthier is the situation. Whilst the ratio (1,2:1) is below the
(1,5:2,1) benchmark there is sufficient cash to meet creditor obligations.
4. Credit Rating
The short term (A1+) and long term credit rating of AA - received by the City is the highest given to a
municipality in South Africa.
The municipality needs a credit rating to demonstrate its ability to meet its financial obligation. Potential
lenders also use this rating to assess the City’s credit risk, which in turn affects the pricing of any
subsequent loan taken.
5. Gearing ratio
The Gearing Ratio is calculated on the same basis as used by the Credit Rating Company (Borrowing over
Total Projected Income inclusive of all grant income), was approximately 30,0% as at 31 December
2015, which compares favourably with the norm set by National Treasury of 45%. However, the Gearing Ratio, excluding Capital Grants is approximately 33,7%.
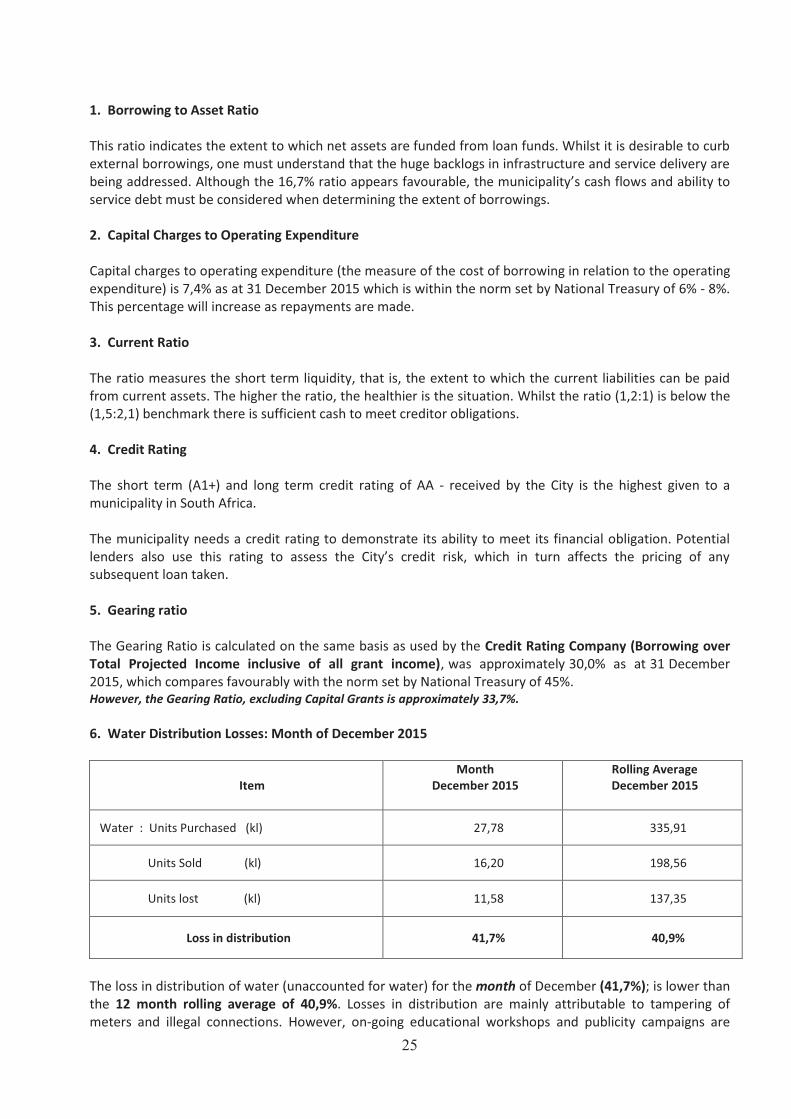
6. Water Distribution Losses: Month of December 2015
Item
Month
December 2015
Rolling Average
December 2015
Water : Units Purchased (kl) 27,78 335,91
Units Sold (kl) 16,20 198,56
Units lost (kl) 11,58 137,35
Loss in distribution 41,7% 40,9%
The loss in distribution of water (unaccounted for water) for the month of December (41,7%); is lower than
the 12 month rolling average of 40,9%. Losses in distribution are mainly attributable to tampering of
meters and illegal connections. However, on-going educational workshops and publicity campaigns are
26
aimed at encouraging defaulting customers to declare their illegal connections so that they can be
regularised. The high water loss for the month of December is being investigated.
7. Electricity Distribution Losses
The 6% estimated average loss in distribution is below the benchmark of 7% - 10%.
The losses are mainly due to illegal connections mostly concentrated in areas around informal settlements,
as well as cable theft. Strategies have been applied to effectively deal with the problem by carrying out
meter sweeps and as an added initiative to reduce theft, the Unit has taken major steps to educate and
inform the public of the dangers of electricity theft and equipment tampering via Road Shows (targeted at
high theft areas) and Radio Talk Shows.
Sales figures cannot be provided on a monthly basis due to electricity consumption being estimated and
not read monthly. Furthermore, with the usage of prepaid electricity, monthly readings will not be true
reflection to calculate losses and can be misleading. As a result electricity losses are quantified on a yearly
basis.
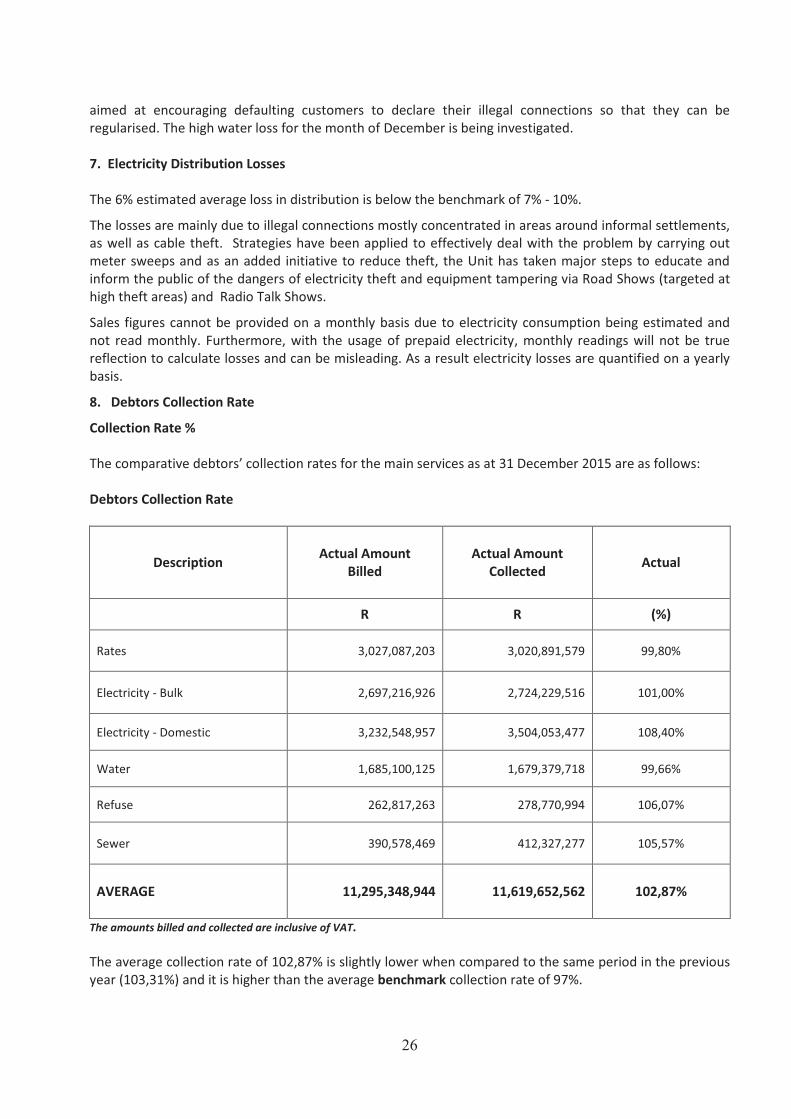
8. Debtors Collection Rate
Collection Rate %
The comparative debtors’ collection rates for the main services as at 31 December 2015 are as follows:
Debtors Collection Rate
Description
Actual Amount
Billed
Actual Amount
Collected
Actual
R R (%)
Rates 3,027,087,203 3,020,891,579 99,80%
Electricity - Bulk 2,697,216,926 2,724,229,516 101,00%
Electricity - Domestic 3,232,548,957 3,504,053,477 108,40%
Water 1,685,100,125 1,679,379,718 99,66%
Refuse 262,817,263 278,770,994 106,07%
Sewer 390,578,469 412,327,277 105,57%
AVERAGE 11,295,348,944
11,619,652,562
102,87%
The amounts billed and collected are inclusive of VAT.
The average collection rate of 102,87% is slightly lower when compared to the same period in the previous
year (103,31%) and it is higher than the average benchmark collection rate of 97%.
27
FINANCIAL ANALYSIS
Borrowings (Parent Municipality)
The total loans outstanding at 31 December 2015 amounted to approximately R9,72 billion.
The municipality is extremely mindful that any borrowing of a long term nature has to be sustainable and
affordable and is in compliance with Chapter 6 of the MFMA and the municipality’s Borrowing Policy and
Financial Strategy. These values are entrenched in the municipality’s Integrated Development Plan, and the
Financial Strategy gives effect to these values.
Investments and Cash Management (Page 54: SC5): PARENT MUNICIPALITY
Investments made with the various financial institutions are strictly in compliance with Municipal Finance
Management Act and in terms of the Investment Framework Policy and Guidelines. The total value of cash
and investments for the Parent Municipality amounted to approximately R6,46 billion, represents
approximately 90 Days Cash on Hand and includes the latest tranches of grants received from National
Treasury that is yet to be spent. The Balance Sheet remains strong with total assets well in excess of
liabilities.
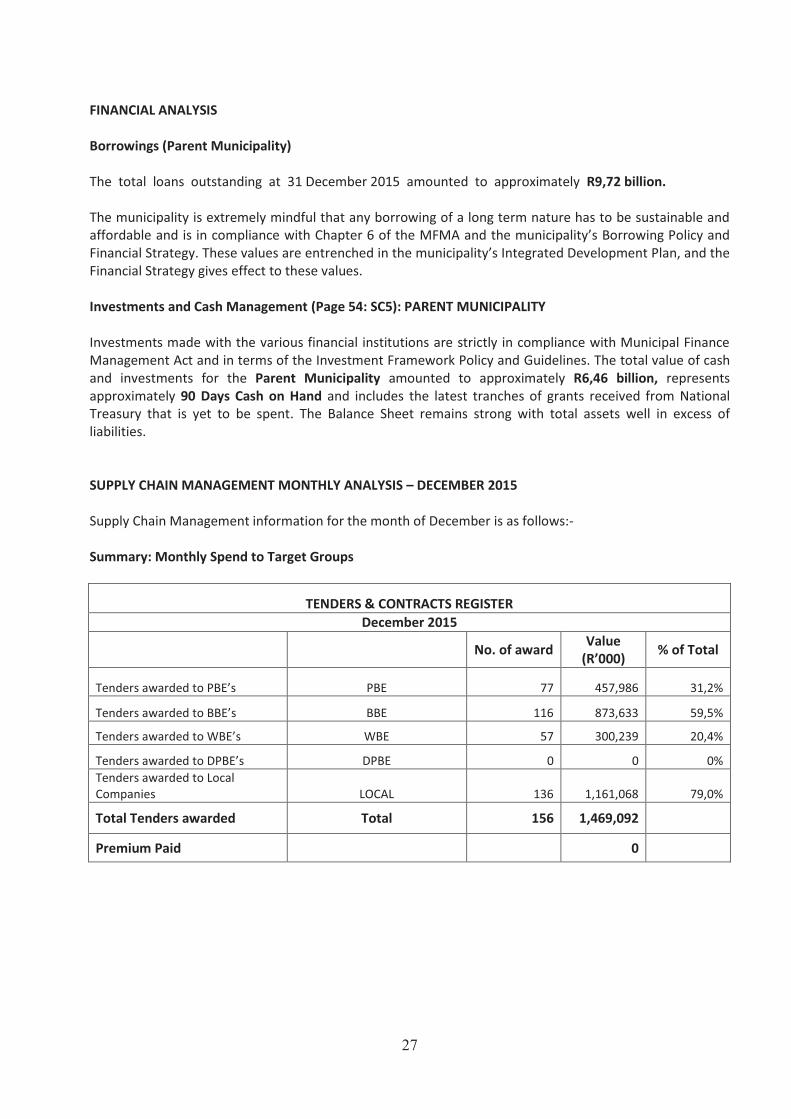
SUPPLY CHAIN MANAGEMENT MONTHLY ANALYSIS – DECEMBER 2015
Supply Chain Management information for the month of December is as follows:-
Summary: Monthly Spend to Target Groups
TENDERS & CONTRACTS REGISTER
December 2015
No. of award
Value
(R’000) % of Total
Tenders awarded to PBE’s PBE 77 457,986 31,2%
Tenders awarded to BBE’s BBE 116 873,633 59,5%
Tenders awarded to WBE’s WBE 57 300,239 20,4%
Tenders awarded to DPBE’s DPBE 0 0 0%
Tenders awarded to Local
Companies LOCAL 136 1,161,068 79,0%
Total Tenders awarded Total 156 1,469,092
Premium Paid 0
28
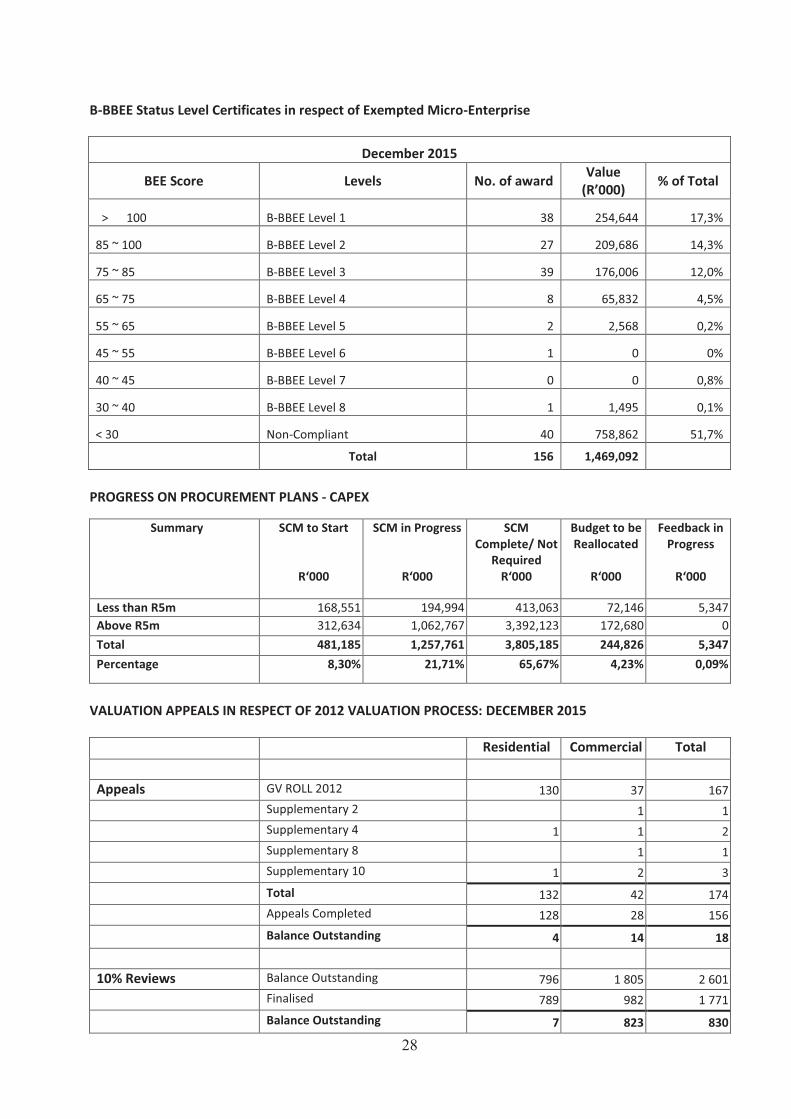
B-BBEE Status Level Certificates in respect of Exempted Micro-Enterprise
December 2015
BEE Score Levels No. of award Value
(R’000) % of Total
> 100 B-BBEE Level 1 38 254,644 17,3%
85 ~ 100 B-BBEE Level 2 27 209,686 14,3%
75 ~ 85 B-BBEE Level 3 39 176,006 12,0%
65 ~ 75 B-BBEE Level 4 8 65,832 4,5%
55 ~ 65 B-BBEE Level 5 2 2,568 0,2%
45 ~ 55 B-BBEE Level 6 1 0 0%
40 ~ 45 B-BBEE Level 7 0 0 0,8%
30 ~ 40 B-BBEE Level 8 1 1,495 0,1%
< 30 Non-Compliant 40 758,862 51,7%
Total 156 1,469,092
PROGRESS ON PROCUREMENT PLANS - CAPEX
Summary SCM to Start
R‘000
SCM in Progress
R‘000
SCM
Complete/ Not
Required
R‘000
Budget to be
Reallocated
R‘000
Feedback in
Progress
R‘000
Less than R5m 168,551 194,994 413,063 72,146 5,347
Above R5m 312,634 1,062,767 3,392,123 172,680 0
Total 481,185 1,257,761 3,805,185 244,826 5,347
Percentage 8,30% 21,71% 65,67% 4,23% 0,09%
VALUATION APPEALS IN RESPECT OF 2012 VALUATION PROCESS: DECEMBER 2015
Residential Commercial Total
Appeals GV ROLL 2012 130 37 167
Supplementary 2 1 1
Supplementary 4 1 1 2
Supplementary 8 1 1
Supplementary 10 1 2 3
Total 132 42 174
Appeals Completed 128 28 156
Balance Outstanding 4 14 18
10% Reviews Balance Outstanding 796 1 805 2 601
Finalised 789 982 1 771
Balance Outstanding 7 823 830
29
To date a total of 174 valuation appeals were made of which 156 have been completed. A total of 2,601
objection (10%) reviews have been received and 1,771 have been finalised by the Valuation Appeals Board.
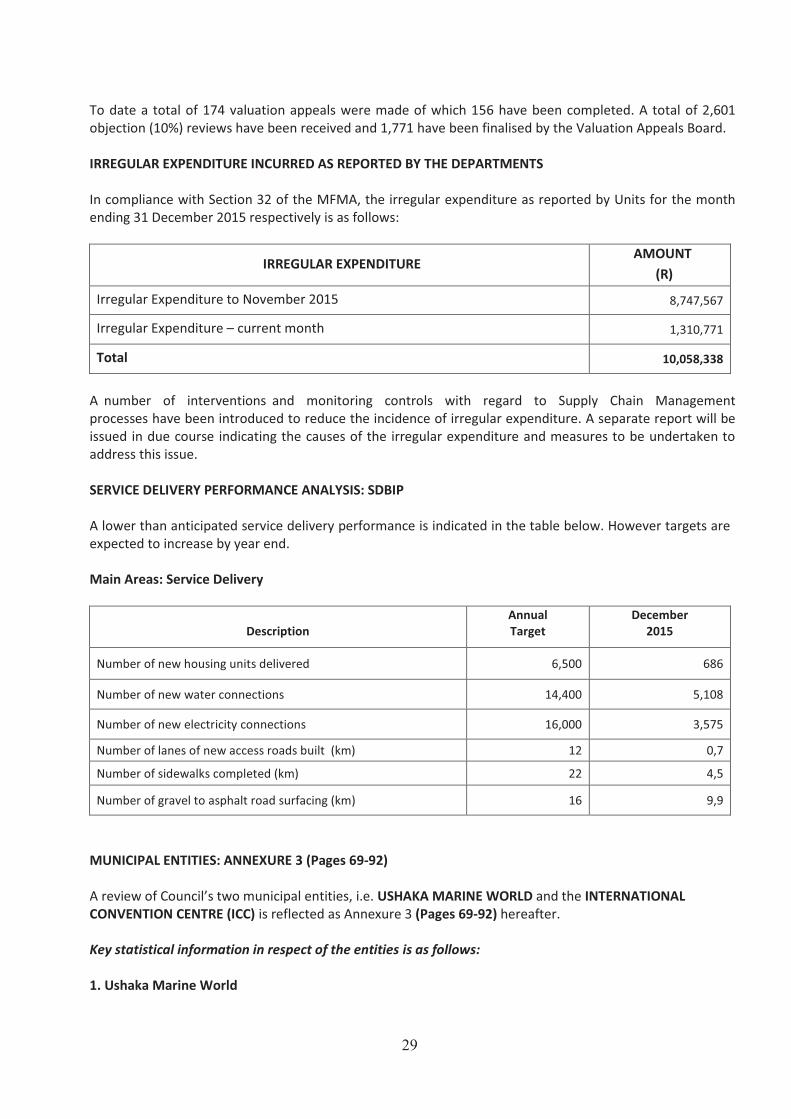
IRREGULAR EXPENDITURE INCURRED AS REPORTED BY THE DEPARTMENTS
In compliance with Section 32 of the MFMA, the irregular expenditure as reported by Units for the month
ending 31 December 2015 respectively is as follows:
IRREGULAR EXPENDITURE AMOUNT
(R)
Irregular Expenditure to November 2015 8,747,567
Irregular Expenditure – current month 1,310,771
Total 10,058,338
A number of interventions and monitoring controls with regard to Supply Chain Management
processes have been introduced to reduce the incidence of irregular expenditure. A separate report will be
issued in due course indicating the causes of the irregular expenditure and measures to be undertaken to
address this issue.
SERVICE DELIVERY PERFORMANCE ANALYSIS: SDBIP
A lower than anticipated service delivery performance is indicated in the table below. However targets are
expected to increase by year end.
Main Areas: Service Delivery
Description
Annual
Target
December
2015
Number of new housing units delivered 6,500 686
Number of new water connections 14,400 5,108
Number of new electricity connections 16,000 3,575
Number of lanes of new access roads built (km) 12 0,7
Number of sidewalks completed (km) 22 4,5
Number of gravel to asphalt road surfacing (km) 16 9,9
MUNICIPAL ENTITIES: ANNEXURE 3 (Pages 69-92)
A review of Council’s two municipal entities, i.e. USHAKA MARINE WORLD and the INTERNATIONAL
CONVENTION CENTRE (ICC) is reflected as Annexure 3 (Pages 69-92) hereafter.
Key statistical information in respect of the entities is as follows:
1. Ushaka Marine World
30
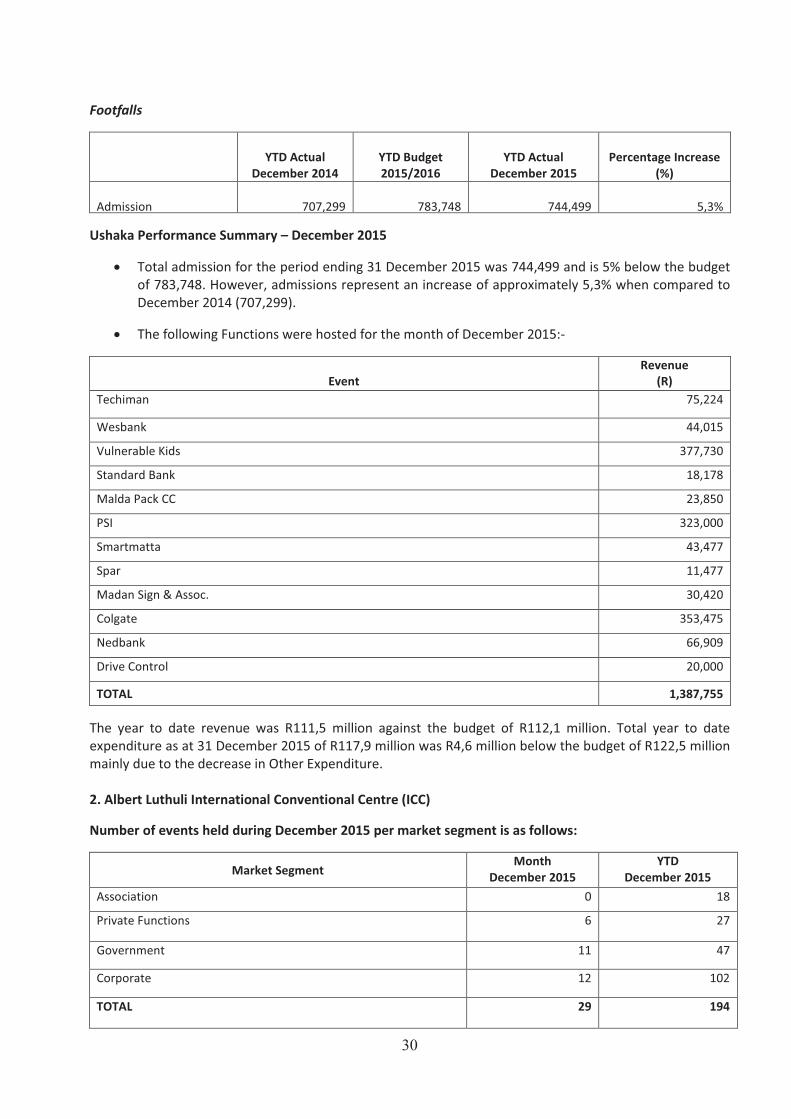
Footfalls
YTD Actual
December 2014
YTD Budget
2015/2016
YTD Actual
December 2015
Percentage Increase
(%)
Admission
707,299
783,748
744,499
5,3%
Ushaka Performance Summary – December 2015
· Total admission for the period ending 31 December 2015 was 744,499 and is 5% below the budget
of 783,748. However, admissions represent an increase of approximately 5,3% when compared to
December 2014 (707,299).
· The following Functions were hosted for the month of December 2015:-
Event
Revenue
(R)
Techiman 75,224
Wesbank 44,015
Vulnerable Kids 377,730
Standard Bank 18,178
Malda Pack CC 23,850
PSI 323,000
Smartmatta 43,477
Spar 11,477
Madan Sign & Assoc. 30,420
Colgate 353,475
Nedbank 66,909
Drive Control 20,000
TOTAL 1,387,755
The year to date revenue was R111,5 million against the budget of R112,1 million. Total year to date
expenditure as at 31 December 2015 of R117,9 million was R4,6 million below the budget of R122,5 million
mainly due to the decrease in Other Expenditure.
2. Albert Luthuli International Conventional Centre (ICC)
Number of events held during December 2015 per market segment is as follows:
Market Segment Month
December 2015
YTD
December 2015
Association 0 18
Private Functions 6 27
Government 11 47
Corporate 12 102
TOTAL 29 194
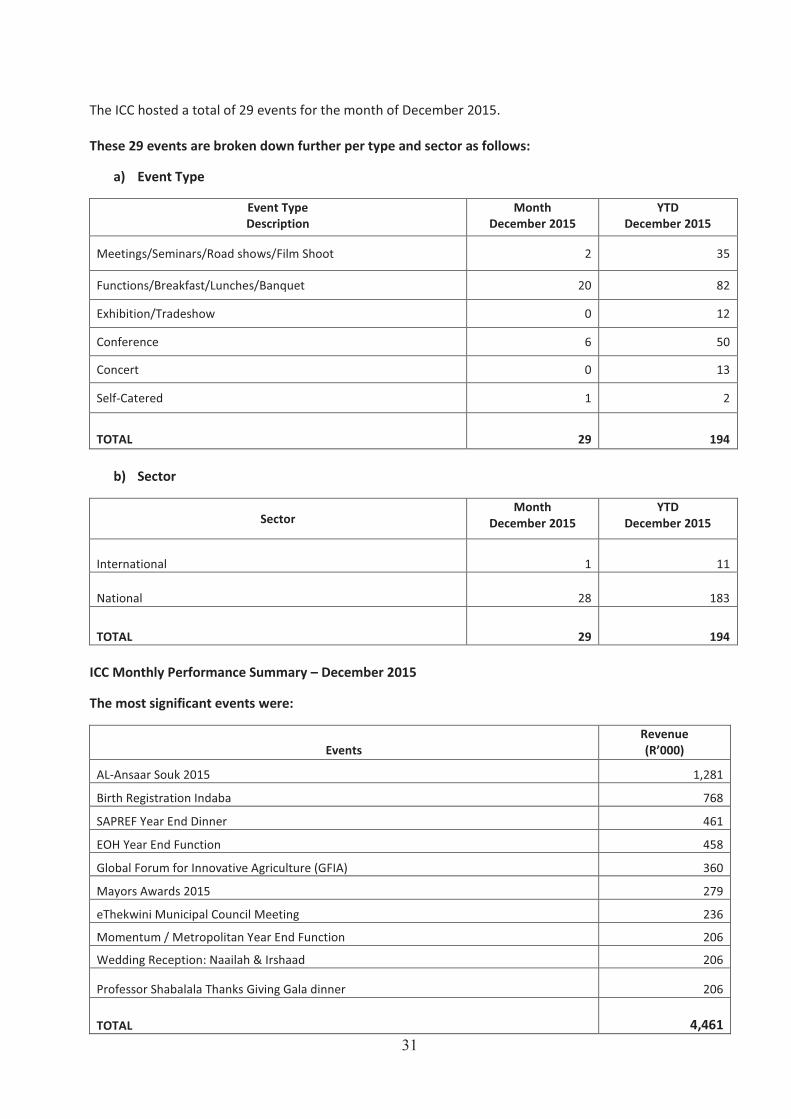
31
The ICC hosted a total of 29 events for the month of December 2015.
These 29 events are broken down further per type and sector as follows:
a) Event Type
Event Type
Description
Month
December 2015
YTD
December 2015
Meetings/Seminars/Road shows/Film Shoot 2 35
Functions/Breakfast/Lunches/Banquet 20 82
Exhibition/Tradeshow 0 12
Conference 6 50
Concert 0 13
Self-Catered 1 2
TOTAL
29
194
b) Sector
Sector Month
December 2015
YTD
December 2015
International
1
11
National
28
183
TOTAL
29 194
ICC Monthly Performance Summary – December 2015
The most significant events were:
Events
Revenue
(R’000)
AL-Ansaar Souk 2015 1,281
Birth Registration Indaba 768
SAPREF Year End Dinner 461
EOH Year End Function 458
Global Forum for Innovative Agriculture (GFIA) 360
Mayors Awards 2015 279
eThekwini Municipal Council Meeting 236
Momentum / Metropolitan Year End Function 206
Wedding Reception: Naailah & Irshaad 206
Professor Shabalala Thanks Giving Gala dinner 206
TOTAL
4,461
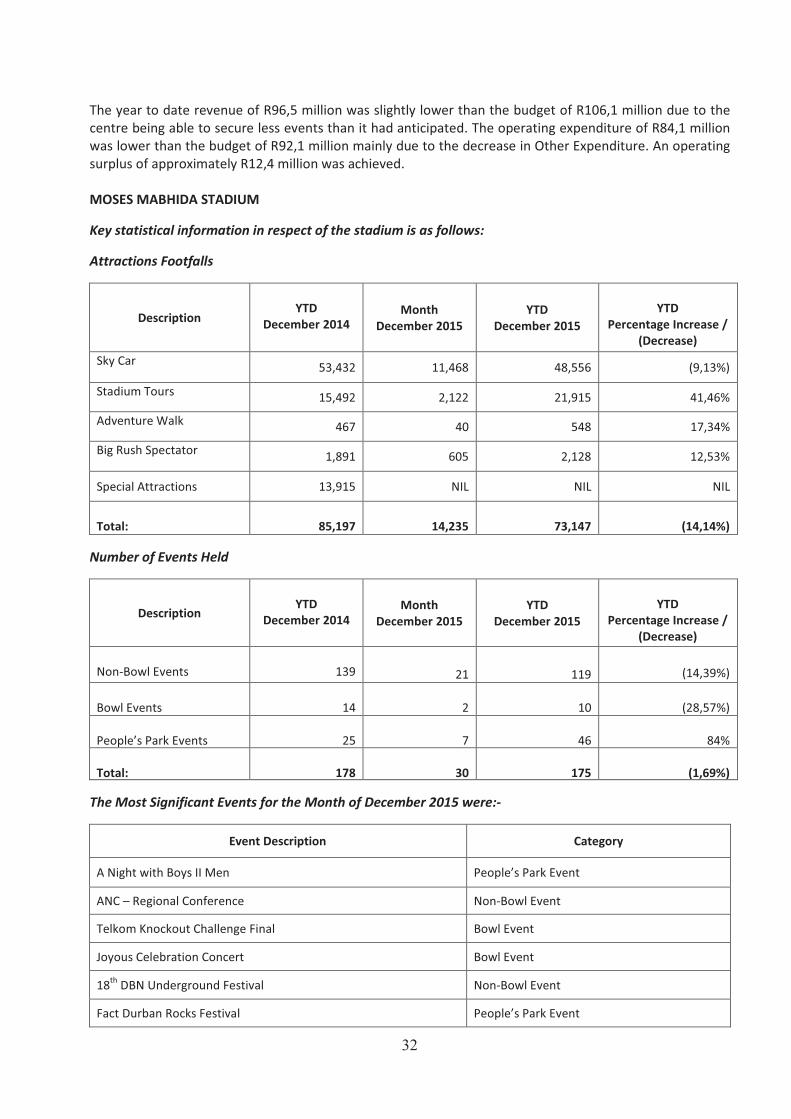
32
The year to date revenue of R96,5 million was slightly lower than the budget of R106,1 million due to the
centre being able to secure less events than it had anticipated. The operating expenditure of R84,1 million
was lower than the budget of R92,1 million mainly due to the decrease in Other Expenditure. An operating
surplus of approximately R12,4 million was achieved.
MOSES MABHIDA STADIUM
Key statistical information in respect of the stadium is as follows:
Attractions Footfalls
Description
YTD
December 2014
Month
December 2015
YTD
December 2015
YTD
Percentage Increase /
(Decrease)
Sky Car
53,432 11,468 48,556 (9,13%)
Stadium Tours
15,492 2,122 21,915 41,46%
Adventure Walk
467 40 548 17,34%
Big Rush Spectator
1,891 605 2,128 12,53%
Special Attractions 13,915 NIL NIL NIL
Total:
85,197
14,235
73,147
(14,14%)
Number of Events Held
Description
YTD
December 2014
Month
December 2015
YTD
December 2015
YTD
Percentage Increase /
(Decrease)
Non-Bowl Events
139
21
119
(14,39%)
Bowl Events
14
2
10
(28,57%)
People’s Park Events
25
7
46
84%
Total:
178
30
175
(1,69%)
The Most Significant Events for the Month of December 2015 were:-
Event Description Category
A Night with Boys II Men People’s Park Event
ANC – Regional Conference Non-Bowl Event
Telkom Knockout Challenge Final Bowl Event
Joyous Celebration Concert Bowl Event
18th
DBN Underground Festival Non-Bowl Event
Fact Durban Rocks Festival People’s Park Event
33
The year to date revenue was R17,3 million against the budget of R34,2 million due to fewer events being
held than anticipated. Total expenditure as at 31 December 2015 of R79,7 million was R10,6 million below
the budget of R90,3 million. A temporary attraction called Wild Adventures ran from September 2014 to
February 2015 and no other special attraction has since taken place.
ORGANISATIONAL PEFORMANCE SCORECARD:
The Organisational Performance Scorecard for the period ended 31 December 2015, which measures the
municipality’s performance in terms of the IDP’s eight point plan of action, is covered in a separate report
by the Performance Management Department.
SERVICE DELIVERY PERFORMANCE ANALYSIS –SDBIP:
The Service Delivery and Budget Implementation Plan (SDBIP) performance is covered in a separate report
by the Performance Management Department. However, departments have indicated that plans are in
place to ensure that spend on capital projects is maximised. The actual performance against the key
performance indicators and targets are monitored on a quarterly basis and corrective actions are put in
place to address variances.
ADJUSTMENTS BUDGET
Regulation 23 (1) of the Municipal Budget and Reporting Regulations provides, inter alia for the following:
“An adjustment budget may be tabled in the Municipal Council at any time after the Mid-year Budget and
Performance Assessment has been tabled in the Council, but not later than 28 February of each year.”
An Adjustment Budget is the revision of an approved annual budget, usually by the utilisation of savings in
one vote towards spending under another vote. Furthermore, except under certain circumstances only one
adjustment budget may be tabled in the Municipal Council during a financial year. Accordingly a report on
adjustments to the budget will be submitted for consideration by Council at its meeting to be held on 25
February 2016.
NATIONAL ADJUSTMENTS BUDGET
Due to the 2015 Adjusted Estimates of National Expenditure and its proposed adjustments to the
allocations made to the Provinces, the municipality anticipates a similar effect on its budget.
ANNUAL REPORT
The annual report of the 2014/15 financial year is covered in a separate report to Council.
ANNEXURE 1
KEY DATA
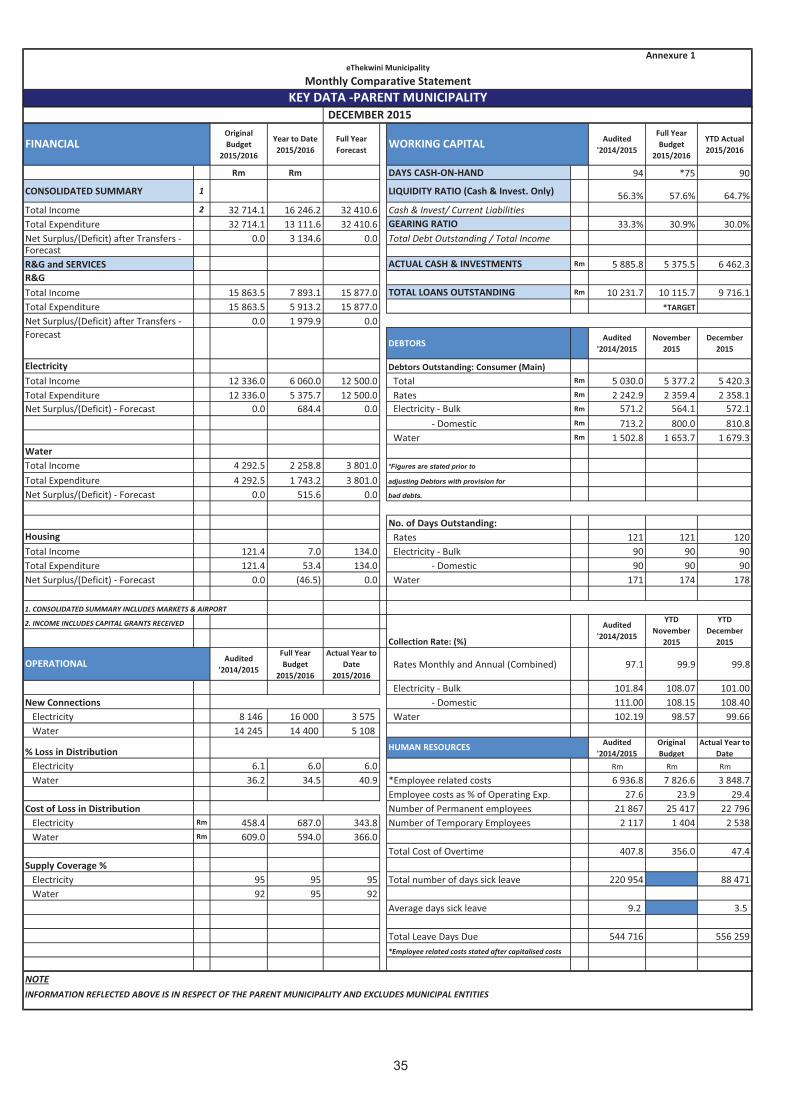
Original
Budget
2015/2016
Year to Date
2015/2016
Full Year
Forecast
Audited
'2014/2015
Full Year
Budget
2015/2016
YTD Actual
2015/2016
Rm Rm DAYS CASH-ON-HAND 94 *75 90
CONSOLIDATED SUMMARY 1 LIQUIDITY RATIO (Cash & Invest. Only)56.3% 57.6% 64.7%
Total Income 2 32 714.1 16 246.2 32 410.6 Cash & Invest/ Current Liabilities
Total Expenditure 32 714.1 13 111.6 32 410.6 GEARING RATIO 33.3% 30.9% 30.0%
Net Surplus/(Deficit) after Transfers - 0.0 3 134.6 0.0 Total Debt Outstanding / Total Income
Forecast
R&G and SERVICES ACTUAL CASH & INVESTMENTS Rm 5 885.8 5 375.5 6 462.3
R&G
Total Income 15 863.5 7 893.1 15 877.0 TOTAL LOANS OUTSTANDING Rm 10 231.7 10 115.7 9 716.1
Total Expenditure 15 863.5 5 913.2 15 877.0 *TARGET
Net Surplus/(Deficit) after Transfers - 0.0 1 979.9 0.0
ForecastDEBTORS
Audited
'2014/2015
November
2015
December
2015
Electricity Debtors Outstanding: Consumer (Main)
Total Income 12 336.0 6 060.0 12 500.0 Total Rm 5 030.0 5 377.2 5 420.3
Total Expenditure 12 336.0 5 375.7 12 500.0 Rates Rm 2 242.9 2 359.4 2 358.1
Net Surplus/(Deficit) - Forecast 0.0 684.4 0.0 Electricity - Bulk Rm 571.2 564.1 572.1
- Domestic Rm 713.2 800.0 810.8
Water Rm 1 502.8 1 653.7 1 679.3
Water
Total Income 4 292.5 2 258.8 3 801.0 *Figures are stated prior to
Total Expenditure 4 292.5 1 743.2 3 801.0 adjusting Debtors with provision for
Net Surplus/(Deficit) - Forecast 0.0 515.6 0.0 bad debts.
No. of Days Outstanding:
Housing Rates 121 121 120
Total Income 121.4 7.0 134.0 Electricity - Bulk 90 90 90
Total Expenditure 121.4 53.4 134.0 - Domestic 90 90 90
Net Surplus/(Deficit) - Forecast 0.0 (46.5) 0.0 Water 171 174 178
1. CONSOLIDATED SUMMARY INCLUDES MARKETS & AIRPORT
2. INCOME INCLUDES CAPITAL GRANTS RECEIVED
Audited
'2014/2015
Full Year
Budget
2015/2016
Actual Year to
Date
2015/2016
Rates Monthly and Annual (Combined) 97.1 99.9 99.8
Electricity - Bulk 101.84 108.07 101.00
New Connections - Domestic 111.00 108.15 108.40
Electricity 8 146 16 000 3 575 Water 102.19 98.57 99.66
Water 14 245 14 400 5 108
% Loss in DistributionAudited
'2014/2015
Original
Budget
Actual Year to
Date
Electricity 6.1 6.0 6.0 Rm Rm Rm
Water 36.2 34.5 40.9 *Employee related costs 6 936.8 7 826.6 3 848.7
Employee costs as % of Operating Exp. 27.6 23.9 29.4
Cost of Loss in Distribution Number of Permanent employees 21 867 25 417 22 796
Electricity Rm 458.4 687.0 343.8 Number of Temporary Employees 2 117 1 404 2 538
Water Rm 609.0 594.0 366.0
Total Cost of Overtime 407.8 356.0 47.4
Supply Coverage %
Electricity 95 95 95 Total number of days sick leave 220 954 88 471
Water 92 95 92
Average days sick leave 9.2 3.5
Total Leave Days Due 544 716 556 259
*Employee related costs stated after capitalised costs
NOTE
INFORMATION REFLECTED ABOVE IS IN RESPECT OF THE PARENT MUNICIPALITY AND EXCLUDES MUNICIPAL ENTITIES
HUMAN RESOURCES
OPERATIONAL
Annexure 1
eThekwini Municipality
Monthly Comparative Statement
KEY DATA -PARENT MUNICIPALITY
DECEMBER 2015
FINANCIAL WORKING CAPITAL
Collection Rate: (%)
Audited
'2014/2015
YTD
November
2015
YTD
December
2015
35
ANNEXURE 2
IN-YEAR BUDGET
STATEMENT TABLES
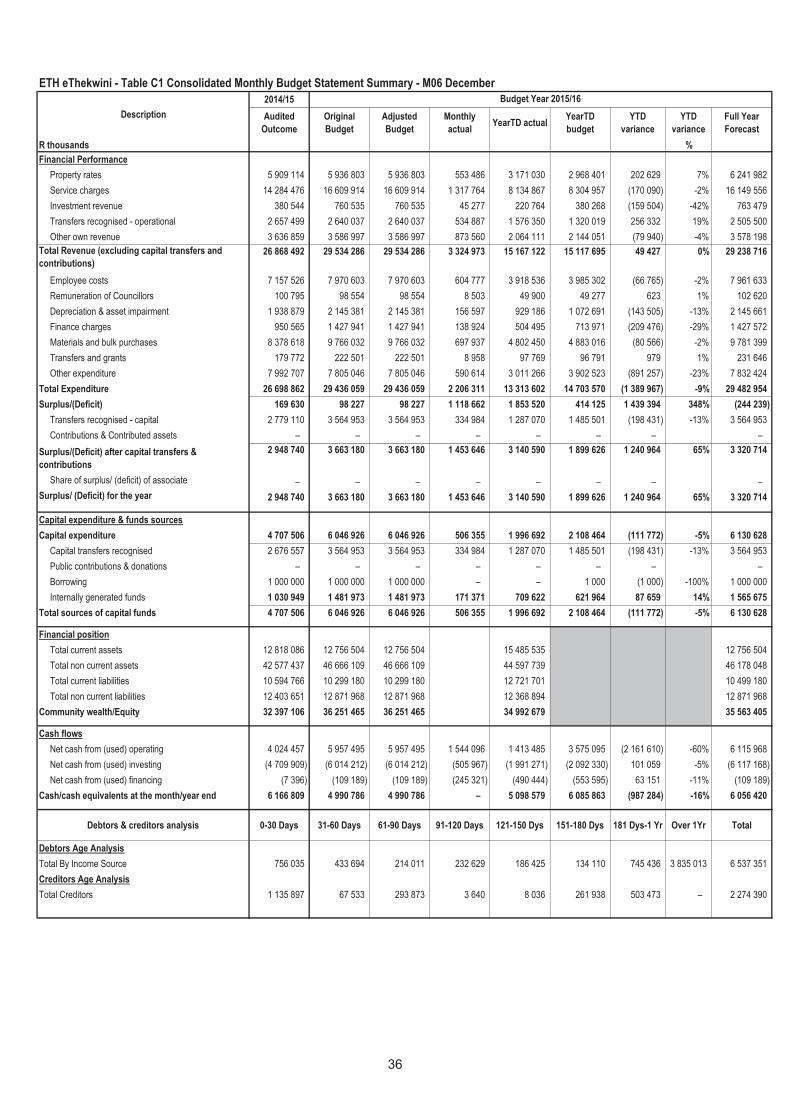
ETH eThekwini - Table C1 Consolidated Monthly Budget Statement Summary - M06 December
2014/15
Audited
Outcome
Original
Budget
Adjusted
Budget
Monthly
actualYearTD actual
YearTD
budget
YTD
variance
YTD
variance
Full Year
Forecast
R thousands %
Financial Performance
Property rates 5 909 114 5 936 803 5 936 803 553 486 3 171 030 2 968 401 202 629 7% 6 241 982
Service charges 14 284 476 16 609 914 16 609 914 1 317 764 8 134 867 8 304 957 (170 090) -2% 16 149 556
Investment revenue 380 544 760 535 760 535 45 277 220 764 380 268 (159 504) -42% 763 479
Transfers recognised - operational 2 657 499 2 640 037 2 640 037 534 887 1 576 350 1 320 019 256 332 19% 2 505 500
Other own revenue 3 636 859 3 586 997 3 586 997 873 560 2 064 111 2 144 051 (79 940) -4% 3 578 198
Total Revenue (excluding capital transfers and
contributions)
26 868 492 29 534 286 29 534 286 3 324 973 15 167 122 15 117 695 49 427 0% 29 238 716
Employee costs 7 157 526 7 970 603 7 970 603 604 777 3 918 536 3 985 302 (66 765) -2% 7 961 633
Remuneration of Councillors 100 795 98 554 98 554 8 503 49 900 49 277 623 1% 102 620
Depreciation & asset impairment 1 938 879 2 145 381 2 145 381 156 597 929 186 1 072 691 (143 505) -13% 2 145 661
Finance charges 950 565 1 427 941 1 427 941 138 924 504 495 713 971 (209 476) -29% 1 427 572
Materials and bulk purchases 8 378 618 9 766 032 9 766 032 697 937 4 802 450 4 883 016 (80 566) -2% 9 781 399
Transfers and grants 179 772 222 501 222 501 8 958 97 769 96 791 979 1% 231 646
Other expenditure 7 992 707 7 805 046 7 805 046 590 614 3 011 266 3 902 523 (891 257) -23% 7 832 424
Total Expenditure 26 698 862 29 436 059 29 436 059 2 206 311 13 313 602 14 703 570 (1 389 967) -9% 29 482 954
Surplus/(Deficit) 169 630 98 227 98 227 1 118 662 1 853 520 414 125 1 439 394 348% (244 239)
Transfers recognised - capital 2 779 110 3 564 953 3 564 953 334 984 1 287 070 1 485 501 (198 431) -13% 3 564 953
Contributions & Contributed assets – – – – – – – –
Surplus/(Deficit) after capital transfers &
contributions
2 948 740 3 663 180 3 663 180 1 453 646 3 140 590 1 899 626 1 240 964 65% 3 320 714
Share of surplus/ (deficit) of associate – – – – – – – –
Surplus/ (Deficit) for the year 2 948 740 3 663 180 3 663 180 1 453 646 3 140 590 1 899 626 1 240 964 65% 3 320 714
Capital expenditure & funds sources
Capital expenditure 4 707 506 6 046 926 6 046 926 506 355 1 996 692 2 108 464 (111 772) -5% 6 130 628
Capital transfers recognised 2 676 557 3 564 953 3 564 953 334 984 1 287 070 1 485 501 (198 431) -13% 3 564 953
Public contributions & donations – – – – – – – –
Borrowing 1 000 000 1 000 000 1 000 000 – – 1 000 (1 000) -100% 1 000 000
Internally generated funds 1 030 949 1 481 973 1 481 973 171 371 709 622 621 964 87 659 14% 1 565 675
Total sources of capital funds 4 707 506 6 046 926 6 046 926 506 355 1 996 692 2 108 464 (111 772) -5% 6 130 628
Financial position
Total current assets 12 818 086 12 756 504 12 756 504 15 485 535 12 756 504
Total non current assets 42 577 437 46 666 109 46 666 109 44 597 739 46 178 048
Total current liabilities 10 594 766 10 299 180 10 299 180 12 721 701 10 499 180
Total non current liabilities 12 403 651 12 871 968 12 871 968 12 368 894 12 871 968
Community wealth/Equity 32 397 106 36 251 465 36 251 465 34 992 679 35 563 405
Cash flows
Net cash from (used) operating 4 024 457 5 957 495 5 957 495 1 544 096 1 413 485 3 575 095 (2 161 610) -60% 6 115 968
Net cash from (used) investing (4 709 909) (6 014 212) (6 014 212) (505 967) (1 991 271) (2 092 330) 101 059 -5% (6 117 168)
Net cash from (used) financing (7 396) (109 189) (109 189) (245 321) (490 444) (553 595) 63 151 -11% (109 189)
Cash/cash equivalents at the month/year end 6 166 809 4 990 786 4 990 786 – 5 098 579 6 085 863 (987 284) -16% 6 056 420
Debtors & creditors analysis 0-30 Days 31-60 Days 61-90 Days 91-120 Days 121-150 Dys 151-180 Dys 181 Dys-1 Yr Over 1Yr Total
Debtors Age Analysis
Total By Income Source 756 035 433 694 214 011 232 629 186 425 134 110 745 436 3 835 013 6 537 351
Creditors Age Analysis
Total Creditors 1 135 897 67 533 293 873 3 640 8 036 261 938 503 473 – 2 274 390
Description
Budget Year 2015/16
36
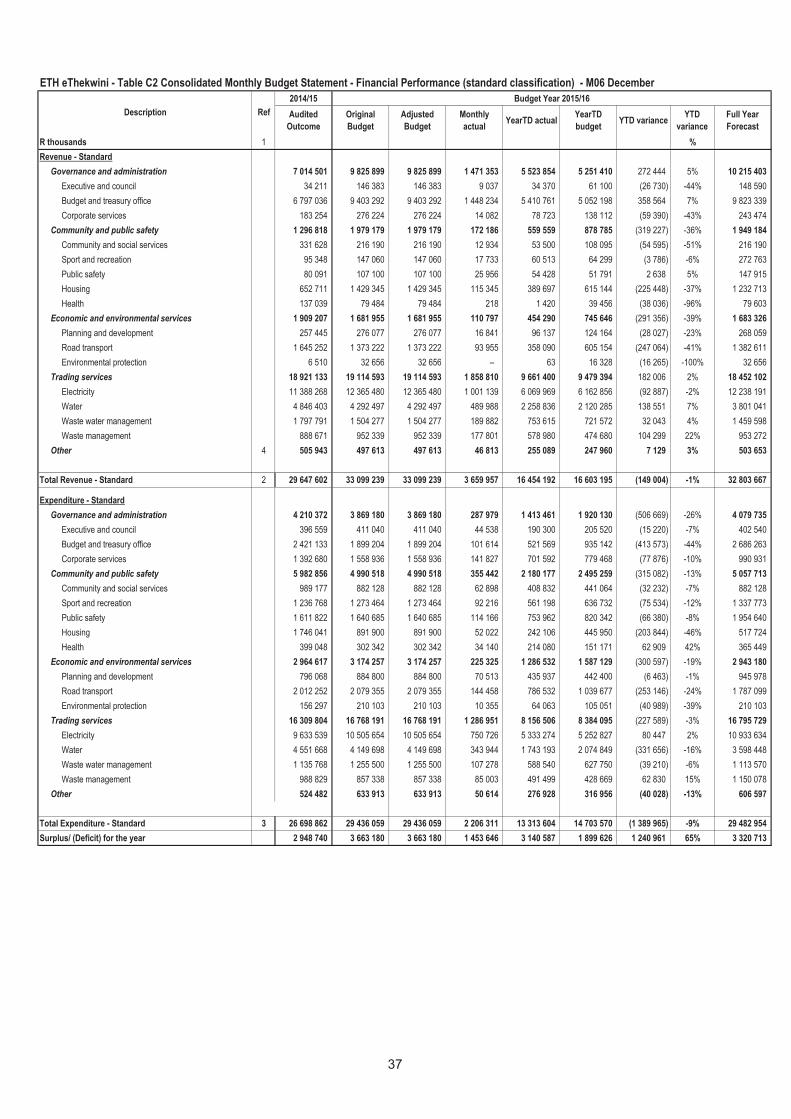
2014/15 Budget Year 2015/16
Audited
Outcome
Original
Budget
Adjusted
Budget
Monthly
actualYearTD actual
YearTD
budgetYTD variance
YTD
variance
Full Year
Forecast
R thousands 1 %
Revenue - Standard
Governance and administration 7 014 501 9 825 899 9 825 899 1 471 353 5 523 854 5 251 410 272 444 5% 10 215 403
Executive and council 34 211 146 383 146 383 9 037 34 370 61 100 (26 730) -44% 148 590
Budget and treasury office 6 797 036 9 403 292 9 403 292 1 448 234 5 410 761 5 052 198 358 564 7% 9 823 339
Corporate services 183 254 276 224 276 224 14 082 78 723 138 112 (59 390) -43% 243 474
Community and public safety 1 296 818 1 979 179 1 979 179 172 186 559 559 878 785 (319 227) -36% 1 949 184
Community and social services 331 628 216 190 216 190 12 934 53 500 108 095 (54 595) -51% 216 190
Sport and recreation 95 348 147 060 147 060 17 733 60 513 64 299 (3 786) -6% 272 763
Public safety 80 091 107 100 107 100 25 956 54 428 51 791 2 638 5% 147 915
Housing 652 711 1 429 345 1 429 345 115 345 389 697 615 144 (225 448) -37% 1 232 713
Health 137 039 79 484 79 484 218 1 420 39 456 (38 036) -96% 79 603
Economic and environmental services 1 909 207 1 681 955 1 681 955 110 797 454 290 745 646 (291 356) -39% 1 683 326
Planning and development 257 445 276 077 276 077 16 841 96 137 124 164 (28 027) -23% 268 059
Road transport 1 645 252 1 373 222 1 373 222 93 955 358 090 605 154 (247 064) -41% 1 382 611
Environmental protection 6 510 32 656 32 656 – 63 16 328 (16 265) -100% 32 656
Trading services 18 921 133 19 114 593 19 114 593 1 858 810 9 661 400 9 479 394 182 006 2% 18 452 102
Electricity 11 388 268 12 365 480 12 365 480 1 001 139 6 069 969 6 162 856 (92 887) -2% 12 238 191
Water 4 846 403 4 292 497 4 292 497 489 988 2 258 836 2 120 285 138 551 7% 3 801 041
Waste water management 1 797 791 1 504 277 1 504 277 189 882 753 615 721 572 32 043 4% 1 459 598
Waste management 888 671 952 339 952 339 177 801 578 980 474 680 104 299 22% 953 272
Other 4 505 943 497 613 497 613 46 813 255 089 247 960 7 129 3% 503 653
Total Revenue - Standard 2 29 647 602 33 099 239 33 099 239 3 659 957 16 454 192 16 603 195 (149 004) -1% 32 803 667
Expenditure - Standard
Governance and administration 4 210 372 3 869 180 3 869 180 287 979 1 413 461 1 920 130 (506 669) -26% 4 079 735
Executive and council 396 559 411 040 411 040 44 538 190 300 205 520 (15 220) -7% 402 540
Budget and treasury office 2 421 133 1 899 204 1 899 204 101 614 521 569 935 142 (413 573) -44% 2 686 263
Corporate services 1 392 680 1 558 936 1 558 936 141 827 701 592 779 468 (77 876) -10% 990 931
Community and public safety 5 982 856 4 990 518 4 990 518 355 442 2 180 177 2 495 259 (315 082) -13% 5 057 713
Community and social services 989 177 882 128 882 128 62 898 408 832 441 064 (32 232) -7% 882 128
Sport and recreation 1 236 768 1 273 464 1 273 464 92 216 561 198 636 732 (75 534) -12% 1 337 773
Public safety 1 611 822 1 640 685 1 640 685 114 166 753 962 820 342 (66 380) -8% 1 954 640
Housing 1 746 041 891 900 891 900 52 022 242 106 445 950 (203 844) -46% 517 724
Health 399 048 302 342 302 342 34 140 214 080 151 171 62 909 42% 365 449
Economic and environmental services 2 964 617 3 174 257 3 174 257 225 325 1 286 532 1 587 129 (300 597) -19% 2 943 180
Planning and development 796 068 884 800 884 800 70 513 435 937 442 400 (6 463) -1% 945 978
Road transport 2 012 252 2 079 355 2 079 355 144 458 786 532 1 039 677 (253 146) -24% 1 787 099
Environmental protection 156 297 210 103 210 103 10 355 64 063 105 051 (40 989) -39% 210 103
Trading services 16 309 804 16 768 191 16 768 191 1 286 951 8 156 506 8 384 095 (227 589) -3% 16 795 729
Electricity 9 633 539 10 505 654 10 505 654 750 726 5 333 274 5 252 827 80 447 2% 10 933 634
Water 4 551 668 4 149 698 4 149 698 343 944 1 743 193 2 074 849 (331 656) -16% 3 598 448
Waste water management 1 135 768 1 255 500 1 255 500 107 278 588 540 627 750 (39 210) -6% 1 113 570
Waste management 988 829 857 338 857 338 85 003 491 499 428 669 62 830 15% 1 150 078
Other 524 482 633 913 633 913 50 614 276 928 316 956 (40 028) -13% 606 597
Total Expenditure - Standard 3 26 698 862 29 436 059 29 436 059 2 206 311 13 313 604 14 703 570 (1 389 965) -9% 29 482 954
Surplus/ (Deficit) for the year 2 948 740 3 663 180 3 663 180 1 453 646 3 140 587 1 899 626 1 240 961 65% 3 320 713
RefDescription
ETH eThekwini - Table C2 Consolidated Monthly Budget Statement - Financial Performance (standard classification) - M06 December
37
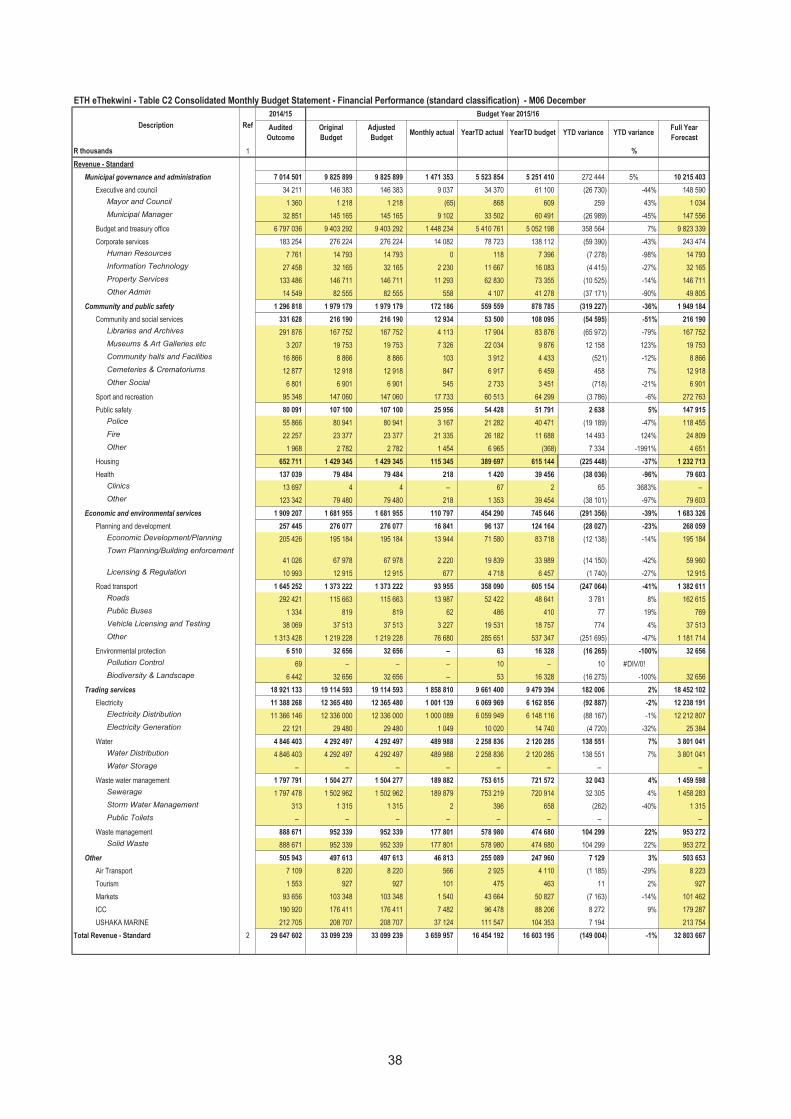
2014/15 Budget Year 2015/16
Audited
Outcome
Original
Budget
Adjusted
BudgetMonthly actual YearTD actual YearTD budget YTD variance YTD variance
Full Year
Forecast
R thousands 1 %
Revenue - Standard
Municipal governance and administration 7 014 501 9 825 899 9 825 899 1 471 353 5 523 854 5 251 410 272 444 5% 10 215 403
Executive and council 34 211 146 383 146 383 9 037 34 370 61 100 (26 730) -44% 148 590
Mayor and Council 1 360 1 218 1 218 (65) 868 609 259 43% 1 034
Municipal Manager 32 851 145 165 145 165 9 102 33 502 60 491 (26 989) -45% 147 556
Budget and treasury office 6 797 036 9 403 292 9 403 292 1 448 234 5 410 761 5 052 198 358 564 7% 9 823 339
Corporate services 183 254 276 224 276 224 14 082 78 723 138 112 (59 390) -43% 243 474
Human Resources 7 761 14 793 14 793 0 118 7 396 (7 278) -98% 14 793
Information Technology 27 458 32 165 32 165 2 230 11 667 16 083 (4 415) -27% 32 165
Property Services 133 486 146 711 146 711 11 293 62 830 73 355 (10 525) -14% 146 711
Other Admin 14 549 82 555 82 555 558 4 107 41 278 (37 171) -90% 49 805
Community and public safety 1 296 818 1 979 179 1 979 179 172 186 559 559 878 785 (319 227) -36% 1 949 184
Community and social services 331 628 216 190 216 190 12 934 53 500 108 095 (54 595) -51% 216 190
Libraries and Archives 291 876 167 752 167 752 4 113 17 904 83 876 (65 972) -79% 167 752
Museums & Art Galleries etc 3 207 19 753 19 753 7 326 22 034 9 876 12 158 123% 19 753
Community halls and Facilities 16 866 8 866 8 866 103 3 912 4 433 (521) -12% 8 866
Cemeteries & Crematoriums 12 877 12 918 12 918 847 6 917 6 459 458 7% 12 918
Other Social 6 801 6 901 6 901 545 2 733 3 451 (718) -21% 6 901
Sport and recreation 95 348 147 060 147 060 17 733 60 513 64 299 (3 786) -6% 272 763
Public safety 80 091 107 100 107 100 25 956 54 428 51 791 2 638 5% 147 915
Police 55 866 80 941 80 941 3 167 21 282 40 471 (19 189) -47% 118 455
Fire 22 257 23 377 23 377 21 335 26 182 11 688 14 493 124% 24 809
Other 1 968 2 782 2 782 1 454 6 965 (368) 7 334 -1991% 4 651
Housing 652 711 1 429 345 1 429 345 115 345 389 697 615 144 (225 448) -37% 1 232 713
Health 137 039 79 484 79 484 218 1 420 39 456 (38 036) -96% 79 603
Clinics 13 697 4 4 – 67 2 65 3683% –
Other 123 342 79 480 79 480 218 1 353 39 454 (38 101) -97% 79 603
Economic and environmental services 1 909 207 1 681 955 1 681 955 110 797 454 290 745 646 (291 356) -39% 1 683 326
Planning and development 257 445 276 077 276 077 16 841 96 137 124 164 (28 027) -23% 268 059
Economic Development/Planning 205 426 195 184 195 184 13 944 71 580 83 718 (12 138) -14% 195 184
Town Planning/Building enforcement
41 026 67 978 67 978 2 220 19 839 33 989 (14 150) -42% 59 960
Licensing & Regulation 10 993 12 915 12 915 677 4 718 6 457 (1 740) -27% 12 915
Road transport 1 645 252 1 373 222 1 373 222 93 955 358 090 605 154 (247 064) -41% 1 382 611
Roads 292 421 115 663 115 663 13 987 52 422 48 641 3 781 8% 162 615
Public Buses 1 334 819 819 62 486 410 77 19% 769
Vehicle Licensing and Testing 38 069 37 513 37 513 3 227 19 531 18 757 774 4% 37 513
Other 1 313 428 1 219 228 1 219 228 76 680 285 651 537 347 (251 695) -47% 1 181 714
Environmental protection 6 510 32 656 32 656 – 63 16 328 (16 265) -100% 32 656
Pollution Control 69 – – – 10 – 10 #DIV/0!
Biodiversity & Landscape 6 442 32 656 32 656 – 53 16 328 (16 275) -100% 32 656
Trading services 18 921 133 19 114 593 19 114 593 1 858 810 9 661 400 9 479 394 182 006 2% 18 452 102
Electricity 11 388 268 12 365 480 12 365 480 1 001 139 6 069 969 6 162 856 (92 887) -2% 12 238 191
Electricity Distribution 11 366 146 12 336 000 12 336 000 1 000 089 6 059 949 6 148 116 (88 167) -1% 12 212 807
Electricity Generation 22 121 29 480 29 480 1 049 10 020 14 740 (4 720) -32% 25 384
Water 4 846 403 4 292 497 4 292 497 489 988 2 258 836 2 120 285 138 551 7% 3 801 041
Water Distribution 4 846 403 4 292 497 4 292 497 489 988 2 258 836 2 120 285 138 551 7% 3 801 041
Water Storage – – – – – – – –
Waste water management 1 797 791 1 504 277 1 504 277 189 882 753 615 721 572 32 043 4% 1 459 598
Sewerage 1 797 478 1 502 962 1 502 962 189 879 753 219 720 914 32 305 4% 1 458 283
Storm Water Management 313 1 315 1 315 2 396 658 (262) -40% 1 315
Public Toilets – – – – – – – –
Waste management 888 671 952 339 952 339 177 801 578 980 474 680 104 299 22% 953 272
Solid Waste 888 671 952 339 952 339 177 801 578 980 474 680 104 299 22% 953 272
Other 505 943 497 613 497 613 46 813 255 089 247 960 7 129 3% 503 653
Air Transport 7 109 8 220 8 220 566 2 925 4 110 (1 185) -29% 8 223
Tourism 1 553 927 927 101 475 463 11 2% 927
Markets 93 656 103 348 103 348 1 540 43 664 50 827 (7 163) -14% 101 462
ICC 190 920 176 411 176 411 7 482 96 478 88 206 8 272 9% 179 287
USHAKA MARINE 212 705 208 707 208 707 37 124 111 547 104 353 7 194 213 754
Total Revenue - Standard 2 29 647 602 33 099 239 33 099 239 3 659 957 16 454 192 16 603 195 (149 004) -1% 32 803 667
ETH eThekwini - Table C2 Consolidated Monthly Budget Statement - Financial Performance (standard classification) - M06 December
Description Ref
38
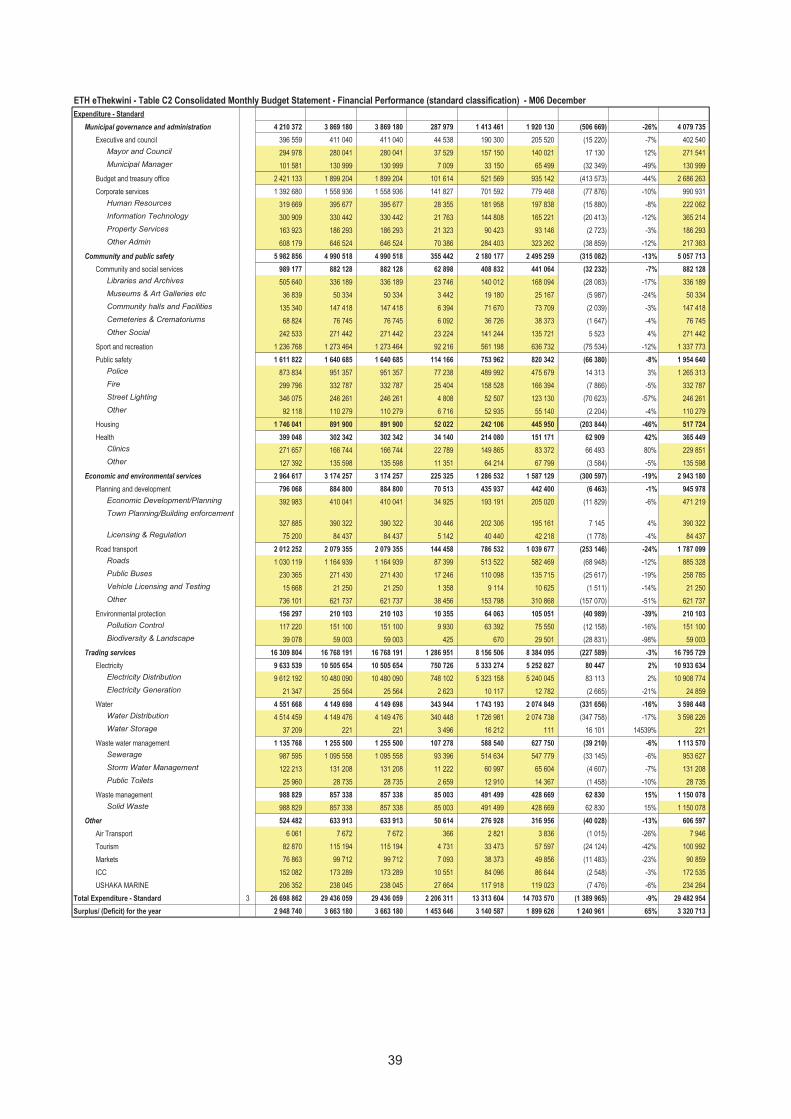
ETH eThekwini - Table C2 Consolidated Monthly Budget Statement - Financial Performance (standard classification) - M06 December
Expenditure - Standard
Municipal governance and administration 4 210 372 3 869 180 3 869 180 287 979 1 413 461 1 920 130 (506 669) -26% 4 079 735
Executive and council 396 559 411 040 411 040 44 538 190 300 205 520 (15 220) -7% 402 540
Mayor and Council 294 978 280 041 280 041 37 529 157 150 140 021 17 130 12% 271 541
Municipal Manager 101 581 130 999 130 999 7 009 33 150 65 499 (32 349) -49% 130 999
Budget and treasury office 2 421 133 1 899 204 1 899 204 101 614 521 569 935 142 (413 573) -44% 2 686 263
Corporate services 1 392 680 1 558 936 1 558 936 141 827 701 592 779 468 (77 876) -10% 990 931
Human Resources 319 669 395 677 395 677 28 355 181 958 197 838 (15 880) -8% 222 062
Information Technology 300 909 330 442 330 442 21 763 144 808 165 221 (20 413) -12% 365 214
Property Services 163 923 186 293 186 293 21 323 90 423 93 146 (2 723) -3% 186 293
Other Admin 608 179 646 524 646 524 70 386 284 403 323 262 (38 859) -12% 217 363
Community and public safety 5 982 856 4 990 518 4 990 518 355 442 2 180 177 2 495 259 (315 082) -13% 5 057 713
Community and social services 989 177 882 128 882 128 62 898 408 832 441 064 (32 232) -7% 882 128
Libraries and Archives 505 640 336 189 336 189 23 746 140 012 168 094 (28 083) -17% 336 189
Museums & Art Galleries etc 36 839 50 334 50 334 3 442 19 180 25 167 (5 987) -24% 50 334
Community halls and Facilities 135 340 147 418 147 418 6 394 71 670 73 709 (2 039) -3% 147 418
Cemeteries & Crematoriums 68 824 76 745 76 745 6 092 36 726 38 373 (1 647) -4% 76 745
Other Social 242 533 271 442 271 442 23 224 141 244 135 721 5 523 4% 271 442
Sport and recreation 1 236 768 1 273 464 1 273 464 92 216 561 198 636 732 (75 534) -12% 1 337 773
Public safety 1 611 822 1 640 685 1 640 685 114 166 753 962 820 342 (66 380) -8% 1 954 640
Police 873 834 951 357 951 357 77 238 489 992 475 679 14 313 3% 1 265 313
Fire 299 796 332 787 332 787 25 404 158 528 166 394 (7 866) -5% 332 787
Street Lighting 346 075 246 261 246 261 4 808 52 507 123 130 (70 623) -57% 246 261
Other 92 118 110 279 110 279 6 716 52 935 55 140 (2 204) -4% 110 279
Housing 1 746 041 891 900 891 900 52 022 242 106 445 950 (203 844) -46% 517 724
Health 399 048 302 342 302 342 34 140 214 080 151 171 62 909 42% 365 449
Clinics 271 657 166 744 166 744 22 789 149 865 83 372 66 493 80% 229 851
Other 127 392 135 598 135 598 11 351 64 214 67 799 (3 584) -5% 135 598
Economic and environmental services 2 964 617 3 174 257 3 174 257 225 325 1 286 532 1 587 129 (300 597) -19% 2 943 180
Planning and development 796 068 884 800 884 800 70 513 435 937 442 400 (6 463) -1% 945 978
Economic Development/Planning 392 983 410 041 410 041 34 925 193 191 205 020 (11 829) -6% 471 219
Town Planning/Building enforcement
327 885 390 322 390 322 30 446 202 306 195 161 7 145 4% 390 322
Licensing & Regulation 75 200 84 437 84 437 5 142 40 440 42 218 (1 778) -4% 84 437
Road transport 2 012 252 2 079 355 2 079 355 144 458 786 532 1 039 677 (253 146) -24% 1 787 099
Roads 1 030 119 1 164 939 1 164 939 87 399 513 522 582 469 (68 948) -12% 885 328
Public Buses 230 365 271 430 271 430 17 246 110 098 135 715 (25 617) -19% 258 785
Vehicle Licensing and Testing 15 668 21 250 21 250 1 358 9 114 10 625 (1 511) -14% 21 250
Other 736 101 621 737 621 737 38 456 153 798 310 868 (157 070) -51% 621 737
Environmental protection 156 297 210 103 210 103 10 355 64 063 105 051 (40 989) -39% 210 103
Pollution Control 117 220 151 100 151 100 9 930 63 392 75 550 (12 158) -16% 151 100
Biodiversity & Landscape 39 078 59 003 59 003 425 670 29 501 (28 831) -98% 59 003
Trading services 16 309 804 16 768 191 16 768 191 1 286 951 8 156 506 8 384 095 (227 589) -3% 16 795 729
Electricity 9 633 539 10 505 654 10 505 654 750 726 5 333 274 5 252 827 80 447 2% 10 933 634
Electricity Distribution 9 612 192 10 480 090 10 480 090 748 102 5 323 158 5 240 045 83 113 2% 10 908 774
Electricity Generation 21 347 25 564 25 564 2 623 10 117 12 782 (2 665) -21% 24 859
Water 4 551 668 4 149 698 4 149 698 343 944 1 743 193 2 074 849 (331 656) -16% 3 598 448
Water Distribution 4 514 459 4 149 476 4 149 476 340 448 1 726 981 2 074 738 (347 758) -17% 3 598 226
Water Storage 37 209 221 221 3 496 16 212 111 16 101 14539% 221
Waste water management 1 135 768 1 255 500 1 255 500 107 278 588 540 627 750 (39 210) -6% 1 113 570
Sewerage 987 595 1 095 558 1 095 558 93 396 514 634 547 779 (33 145) -6% 953 627
Storm Water Management 122 213 131 208 131 208 11 222 60 997 65 604 (4 607) -7% 131 208
Public Toilets 25 960 28 735 28 735 2 659 12 910 14 367 (1 458) -10% 28 735
Waste management 988 829 857 338 857 338 85 003 491 499 428 669 62 830 15% 1 150 078
Solid Waste 988 829 857 338 857 338 85 003 491 499 428 669 62 830 15% 1 150 078
Other 524 482 633 913 633 913 50 614 276 928 316 956 (40 028) -13% 606 597
Air Transport 6 061 7 672 7 672 366 2 821 3 836 (1 015) -26% 7 946
Tourism 82 870 115 194 115 194 4 731 33 473 57 597 (24 124) -42% 100 992
Markets 76 863 99 712 99 712 7 093 38 373 49 856 (11 483) -23% 90 859
ICC 152 082 173 289 173 289 10 551 84 096 86 644 (2 548) -3% 172 535
USHAKA MARINE 206 352 238 045 238 045 27 664 117 918 119 023 (7 476) -6% 234 264
Total Expenditure - Standard 3 26 698 862 29 436 059 29 436 059 2 206 311 13 313 604 14 703 570 (1 389 965) -9% 29 482 954
Surplus/ (Deficit) for the year 2 948 740 3 663 180 3 663 180 1 453 646 3 140 587 1 899 626 1 240 961 65% 3 320 713
39
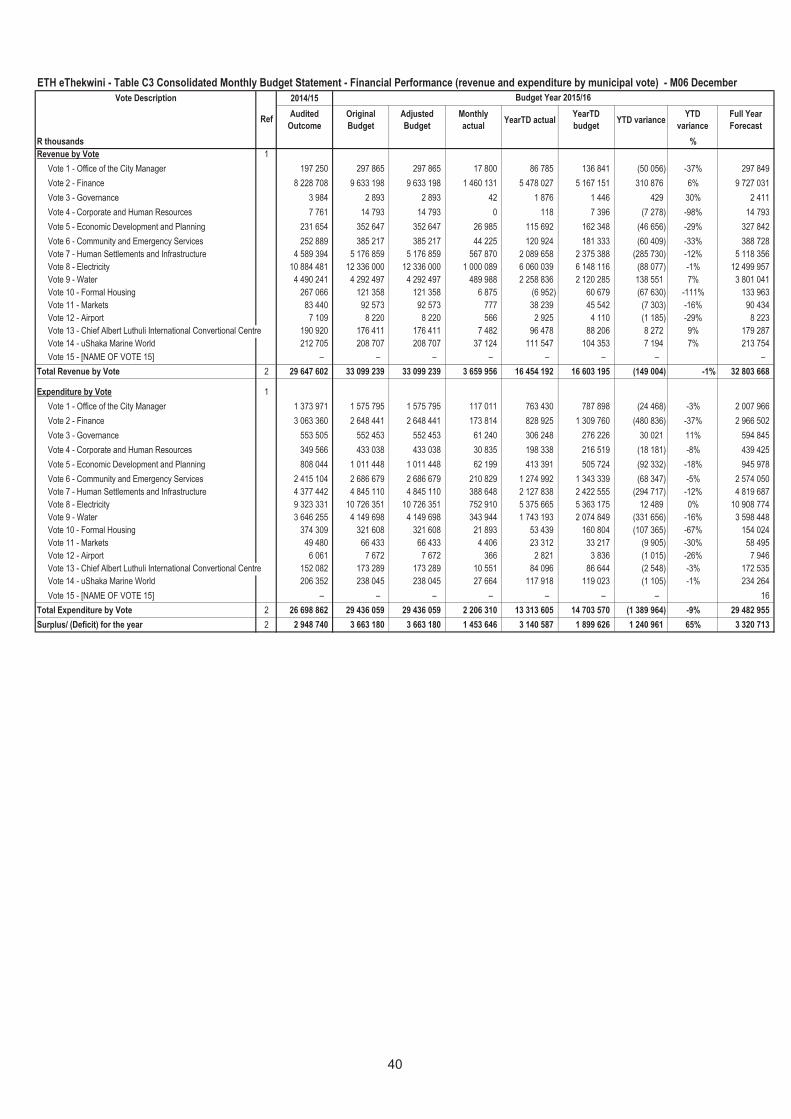
Vote Description 2014/15
Audited
Outcome
Original
Budget
Adjusted
Budget
Monthly
actualYearTD actual
YearTD
budgetYTD variance
YTD
variance
Full Year
Forecast
R thousands %
Revenue by Vote 1
Vote 1 - Office of the City Manager 197 250 297 865 297 865 17 800 86 785 136 841 (50 056) -37% 297 849
Vote 2 - Finance 8 228 708 9 633 198 9 633 198 1 460 131 5 478 027 5 167 151 310 876 6% 9 727 031
Vote 3 - Governance 3 984 2 893 2 893 42 1 876 1 446 429 30% 2 411
Vote 4 - Corporate and Human Resources 7 761 14 793 14 793 0 118 7 396 (7 278) -98% 14 793
Vote 5 - Economic Development and Planning 231 654 352 647 352 647 26 985 115 692 162 348 (46 656) -29% 327 842
Vote 6 - Community and Emergency Services 252 889 385 217 385 217 44 225 120 924 181 333 (60 409) -33% 388 728
Vote 7 - Human Settlements and Infrastructure 4 589 394 5 176 859 5 176 859 567 870 2 089 658 2 375 388 (285 730) -12% 5 118 356
Vote 8 - Electricity 10 884 481 12 336 000 12 336 000 1 000 089 6 060 039 6 148 116 (88 077) -1% 12 499 957
Vote 9 - Water 4 490 241 4 292 497 4 292 497 489 988 2 258 836 2 120 285 138 551 7% 3 801 041
Vote 10 - Formal Housing 267 066 121 358 121 358 6 875 (6 952) 60 679 (67 630) -111% 133 963
Vote 11 - Markets 83 440 92 573 92 573 777 38 239 45 542 (7 303) -16% 90 434
Vote 12 - Airport 7 109 8 220 8 220 566 2 925 4 110 (1 185) -29% 8 223
Vote 13 - Chief Albert Luthuli International Convertional Centre 190 920 176 411 176 411 7 482 96 478 88 206 8 272 9% 179 287
Vote 14 - uShaka Marine World 212 705 208 707 208 707 37 124 111 547 104 353 7 194 7% 213 754
Vote 15 - [NAME OF VOTE 15] – – – – – – – –
Total Revenue by Vote 2 29 647 602 33 099 239 33 099 239 3 659 956 16 454 192 16 603 195 (149 004) -1% 32 803 668
Expenditure by Vote 1
Vote 1 - Office of the City Manager 1 373 971 1 575 795 1 575 795 117 011 763 430 787 898 (24 468) -3% 2 007 966
Vote 2 - Finance 3 063 360 2 648 441 2 648 441 173 814 828 925 1 309 760 (480 836) -37% 2 966 502
Vote 3 - Governance 553 505 552 453 552 453 61 240 306 248 276 226 30 021 11% 594 845
Vote 4 - Corporate and Human Resources 349 566 433 038 433 038 30 835 198 338 216 519 (18 181) -8% 439 425
Vote 5 - Economic Development and Planning 808 044 1 011 448 1 011 448 62 199 413 391 505 724 (92 332) -18% 945 978
Vote 6 - Community and Emergency Services 2 415 104 2 686 679 2 686 679 210 829 1 274 992 1 343 339 (68 347) -5% 2 574 050
Vote 7 - Human Settlements and Infrastructure 4 377 442 4 845 110 4 845 110 388 648 2 127 838 2 422 555 (294 717) -12% 4 819 687
Vote 8 - Electricity 9 323 331 10 726 351 10 726 351 752 910 5 375 665 5 363 175 12 489 0% 10 908 774
Vote 9 - Water 3 646 255 4 149 698 4 149 698 343 944 1 743 193 2 074 849 (331 656) -16% 3 598 448
Vote 10 - Formal Housing 374 309 321 608 321 608 21 893 53 439 160 804 (107 365) -67% 154 024
Vote 11 - Markets 49 480 66 433 66 433 4 406 23 312 33 217 (9 905) -30% 58 495
Vote 12 - Airport 6 061 7 672 7 672 366 2 821 3 836 (1 015) -26% 7 946
Vote 13 - Chief Albert Luthuli International Convertional Centre 152 082 173 289 173 289 10 551 84 096 86 644 (2 548) -3% 172 535
Vote 14 - uShaka Marine World 206 352 238 045 238 045 27 664 117 918 119 023 (1 105) -1% 234 264
Vote 15 - [NAME OF VOTE 15] – – – – – – – 16
Total Expenditure by Vote 2 26 698 862 29 436 059 29 436 059 2 206 310 13 313 605 14 703 570 (1 389 964) -9% 29 482 955
Surplus/ (Deficit) for the year 2 2 948 740 3 663 180 3 663 180 1 453 646 3 140 587 1 899 626 1 240 961 65% 3 320 713
ETH eThekwini - Table C3 Consolidated Monthly Budget Statement - Financial Performance (revenue and expenditure by municipal vote) - M06 December
Ref
Budget Year 2015/16
40
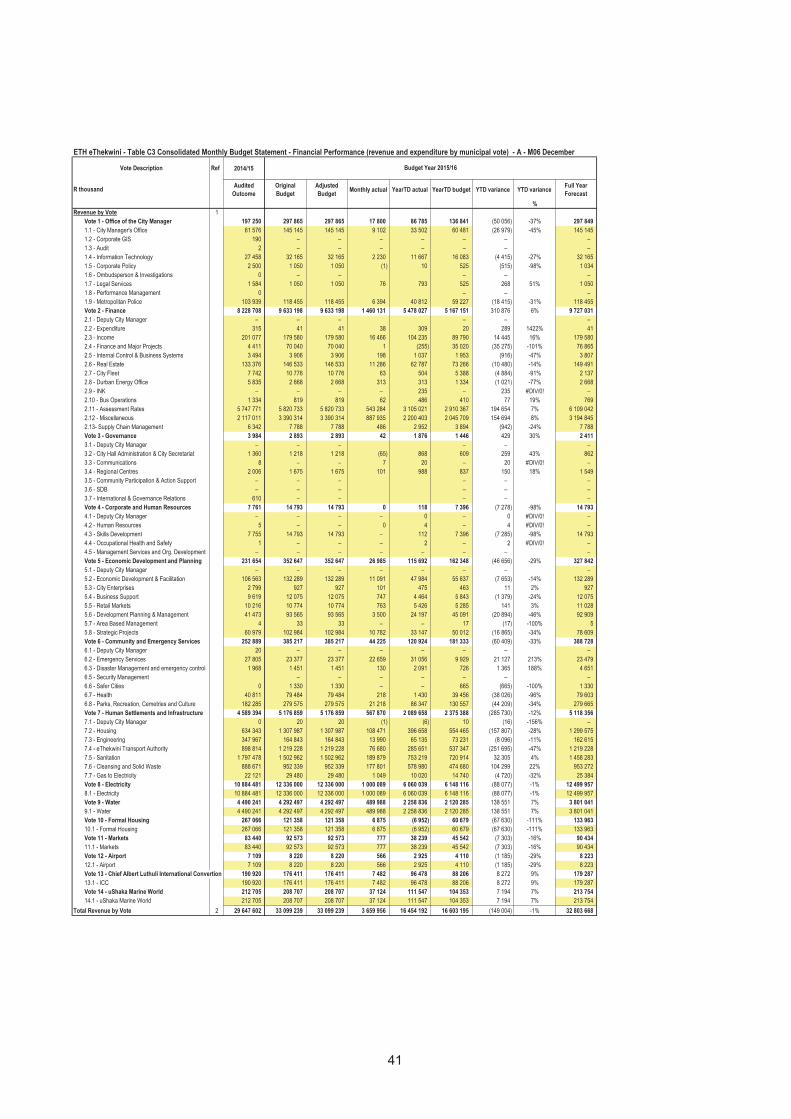
ETH eThekwini - Table C3 Consolidated Monthly Budget Statement - Financial Performance (revenue and expenditure by municipal vote) - A - M06 December
Vote Description Ref 2014/15
R thousandAudited
Outcome
Original
Budget
Adjusted
BudgetMonthly actual YearTD actual YearTD budget YTD variance YTD variance
Full Year
Forecast
%
Revenue by Vote 1
Vote 1 - Office of the City Manager 197 250 297 865 297 865 17 800 86 785 136 841 (50 056) -37% 297 849
1.1 - City Manager's Office 61 576 145 145 145 145 9 102 33 502 60 481 (26 979) -45% 145 145
1.2 - Corporate GIS 190 – – – – – – –
1.3 - Audit 2 – – – – – – –
1.4 - Information Technology 27 458 32 165 32 165 2 230 11 667 16 083 (4 415) -27% 32 165
1.5 - Corporate Policy 2 500 1 050 1 050 (1) 10 525 (515) -98% 1 034
1.6 - Ombudsperson & Investigations 0 – – – – –
1.7 - Legal Services 1 584 1 050 1 050 76 793 525 268 51% 1 050
1.8 - Performance Management 0 – – –
1.9 - Metropolitan Police 103 939 118 455 118 455 6 394 40 812 59 227 (18 415) -31% 118 455
Vote 2 - Finance 8 228 708 9 633 198 9 633 198 1 460 131 5 478 027 5 167 151 310 876 6% 9 727 031
2.1 - Deputy City Manager – – – – – –
2.2 - Expenditure 315 41 41 38 309 20 289 1422% 41
2.3 - Income 201 077 179 580 179 580 16 466 104 235 89 790 14 445 16% 179 580
2.4 - Finance and Major Projects 4 411 70 040 70 040 1 (255) 35 020 (35 275) -101% 76 865
2.5 - Internal Control & Business Systems 3 494 3 906 3 906 198 1 037 1 953 (916) -47% 3 807
2.6 - Real Estate 133 376 146 533 146 533 11 286 62 787 73 266 (10 480) -14% 149 491
2.7 - City Fleet 7 742 10 776 10 776 63 504 5 388 (4 884) -91% 2 137
2.8 - Durban Energy Office 5 835 2 668 2 668 313 313 1 334 (1 021) -77% 2 668
2.9 - INK – – – – 235 – 235 #DIV/0! –
2.10 - Bus Operations 1 334 819 819 62 486 410 77 19% 769
2.11 - Assessment Rates 5 747 771 5 820 733 5 820 733 543 284 3 105 021 2 910 367 194 654 7% 6 109 042
2.12 - Miscellaneous 2 117 011 3 390 314 3 390 314 887 935 2 200 403 2 045 709 154 694 8% 3 194 845
2.13- Supply Chain Management 6 342 7 788 7 788 486 2 952 3 894 (942) -24% 7 788
Vote 3 - Governance 3 984 2 893 2 893 42 1 876 1 446 429 30% 2 411
3.1 - Deputy City Manager – – – – – –
3.2 - City Hall Administration & City Secretariat 1 360 1 218 1 218 (65) 868 609 259 43% 862
3.3 - Communications 8 – – 7 20 – 20 #DIV/0! –
3.4 - Regional Centres 2 006 1 675 1 675 101 988 837 150 18% 1 549
3.5 - Community Participation & Action Support – – – – – –
3.6 - SDB – – – – – –
3.7 - International & Governance Relations 610 – – – – –
Vote 4 - Corporate and Human Resources 7 761 14 793 14 793 0 118 7 396 (7 278) -98% 14 793
4.1 - Deputy City Manager – – – – 0 – 0 #DIV/0! –
4.2 - Human Resources 5 – – 0 4 – 4 #DIV/0! –
4.3 - Skills Development 7 755 14 793 14 793 – 112 7 396 (7 285) -98% 14 793
4.4 - Occupational Health and Safety 1 – – – 2 – 2 #DIV/0! –
4.5 - Management Services and Org. Development – – – – – – – –
Vote 5 - Economic Development and Planning 231 654 352 647 352 647 26 985 115 692 162 348 (46 656) -29% 327 842
5.1 - Deputy City Manager – – – – – – – –
5.2 - Economic Development & Facilitation 106 563 132 289 132 289 11 091 47 984 55 637 (7 653) -14% 132 289
5.3 - City Enterprises 2 799 927 927 101 475 463 11 2% 927
5.4 - Business Support 9 619 12 075 12 075 747 4 464 5 843 (1 379) -24% 12 075
5.5 - Retail Markets 10 216 10 774 10 774 763 5 426 5 285 141 3% 11 028
5.6 - Development Planning & Management 41 473 93 565 93 565 3 500 24 197 45 091 (20 894) -46% 92 909
5.7 - Area Based Management 4 33 33 – – 17 (17) -100% 5
5.8 - Strategic Projects 60 979 102 984 102 984 10 782 33 147 50 012 (16 865) -34% 78 609
Vote 6 - Community and Emergency Services 252 889 385 217 385 217 44 225 120 924 181 333 (60 409) -33% 388 728
6.1 - Deputy City Manager 20 – – – – – – –
6.2 - Emergency Services 27 805 23 377 23 377 22 659 31 056 9 929 21 127 213% 23 479
6.3 - Disaster Management and emergency control 1 968 1 451 1 451 130 2 091 726 1 365 188% 4 651
6.5 - Security Management – – – – – – –
6.6 - Safer Cities 0 1 330 1 330 – – 665 (665) -100% 1 330
6.7 - Health 40 811 79 484 79 484 218 1 430 39 456 (38 026) -96% 79 603
6.8 - Parks, Recreation, Cemetries and Culture 182 285 279 575 279 575 21 218 86 347 130 557 (44 209) -34% 279 665
Vote 7 - Human Settlements and Infrastructure 4 589 394 5 176 859 5 176 859 567 870 2 089 658 2 375 388 (285 730) -12% 5 118 356
7.1 - Deputy City Manager 0 20 20 (1) (6) 10 (16) -156% –
7.2 - Housing 634 343 1 307 987 1 307 987 108 471 396 658 554 465 (157 807) -28% 1 299 575
7.3 - Engineering 347 967 164 843 164 843 13 990 65 135 73 231 (8 096) -11% 162 615
7.4 - eThekwini Transport Authority 898 814 1 219 228 1 219 228 76 680 285 651 537 347 (251 695) -47% 1 219 228
7.5 - Sanitation 1 797 478 1 502 962 1 502 962 189 879 753 219 720 914 32 305 4% 1 458 283
7.6 - Cleansing and Solid Waste 888 671 952 339 952 339 177 801 578 980 474 680 104 299 22% 953 272
7.7 - Gas to Electricity 22 121 29 480 29 480 1 049 10 020 14 740 (4 720) -32% 25 384
Vote 8 - Electricity 10 884 481 12 336 000 12 336 000 1 000 089 6 060 039 6 148 116 (88 077) -1% 12 499 957
8.1 - Electricity 10 884 481 12 336 000 12 336 000 1 000 089 6 060 039 6 148 116 (88 077) -1% 12 499 957
Vote 9 - Water 4 490 241 4 292 497 4 292 497 489 988 2 258 836 2 120 285 138 551 7% 3 801 041
9.1 - Water 4 490 241 4 292 497 4 292 497 489 988 2 258 836 2 120 285 138 551 7% 3 801 041
Vote 10 - Formal Housing 267 066 121 358 121 358 6 875 (6 952) 60 679 (67 630) -111% 133 963
10.1 - Formal Housing 267 066 121 358 121 358 6 875 (6 952) 60 679 (67 630) -111% 133 963
Vote 11 - Markets 83 440 92 573 92 573 777 38 239 45 542 (7 303) -16% 90 434
11.1 - Markets 83 440 92 573 92 573 777 38 239 45 542 (7 303) -16% 90 434
Vote 12 - Airport 7 109 8 220 8 220 566 2 925 4 110 (1 185) -29% 8 223
12.1 - Airport 7 109 8 220 8 220 566 2 925 4 110 (1 185) -29% 8 223
Vote 13 - Chief Albert Luthuli International Convertional Centre190 920 176 411 176 411 7 482 96 478 88 206 8 272 9% 179 287
13.1 - ICC 190 920 176 411 176 411 7 482 96 478 88 206 8 272 9% 179 287
Vote 14 - uShaka Marine World 212 705 208 707 208 707 37 124 111 547 104 353 7 194 7% 213 754
14.1 - uShaka Marine World 212 705 208 707 208 707 37 124 111 547 104 353 7 194 7% 213 754
Total Revenue by Vote 2 29 647 602 33 099 239 33 099 239 3 659 956 16 454 192 16 603 195 (149 004) -1% 32 803 668
Budget Year 2015/16
41
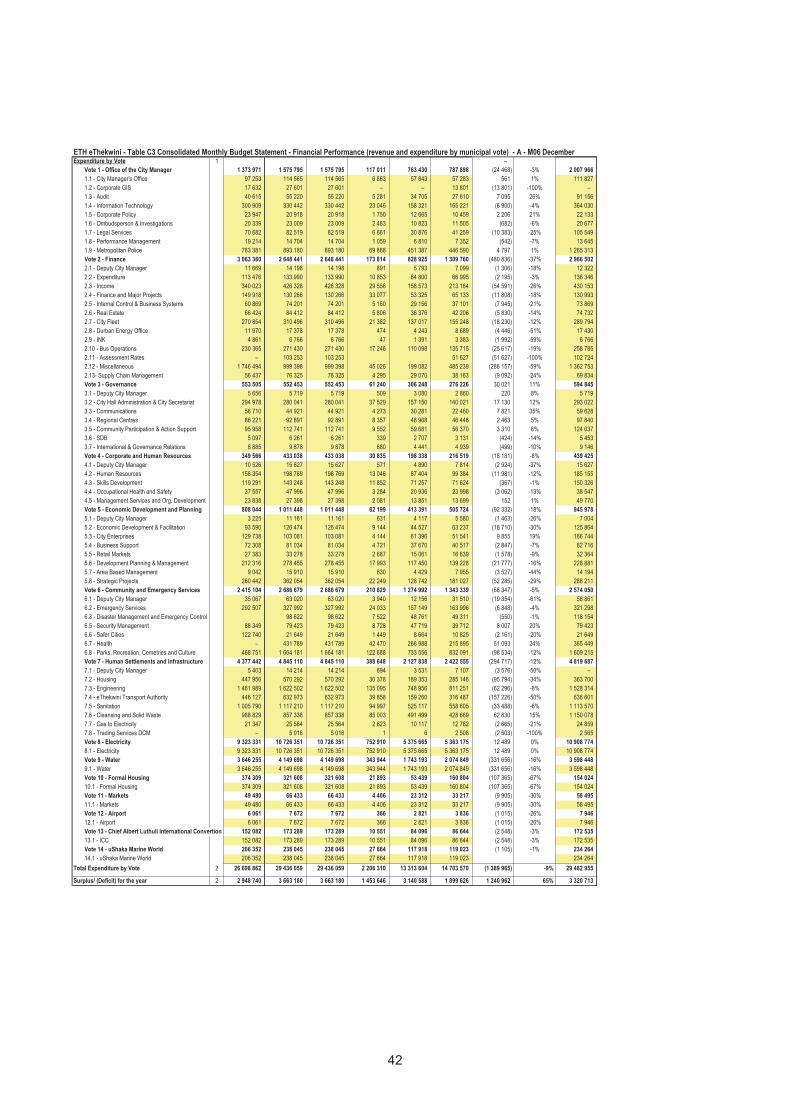
ETH eThekwini - Table C3 Consolidated Monthly Budget Statement - Financial Performance (revenue and expenditure by municipal vote) - A - M06 DecemberExpenditure by Vote 1 –
Vote 1 - Office of the City Manager 1 373 971 1 575 795 1 575 795 117 011 763 430 787 898 (24 468) -3% 2 007 966
1.1 - City Manager's Office 97 253 114 565 114 565 6 863 57 843 57 283 561 1% 111 827
1.2 - Corporate GIS 17 632 27 601 27 601 – – 13 801 (13 801) -100% –
1.3 - Audit 40 615 55 220 55 220 5 281 34 705 27 610 7 095 26% 91 156
1.4 - Information Technology 300 909 330 442 330 442 23 046 158 321 165 221 (6 900) -4% 364 030
1.5 - Corporate Policy 23 947 20 918 20 918 1 750 12 665 10 459 2 206 21% 22 133
1.6 - Ombudsperson & Investigations 20 339 23 009 23 009 2 483 10 823 11 505 (682) -6% 20 677
1.7 - Legal Services 70 682 82 519 82 519 6 661 30 876 41 259 (10 383) -25% 105 549
1.8 - Performance Management 19 214 14 704 14 704 1 059 6 810 7 352 (542) -7% 13 645
1.9 - Metropolitan Police 783 381 893 180 893 180 69 868 451 387 446 590 4 797 1% 1 265 313
Vote 2 - Finance 3 063 360 2 648 441 2 648 441 173 814 828 925 1 309 760 (480 836) -37% 2 966 502
2.1 - Deputy City Manager 11 669 14 198 14 198 891 5 793 7 099 (1 306) -18% 12 322
2.2 - Expenditure 113 476 133 990 133 990 10 853 64 800 66 995 (2 195) -3% 136 346
2.3 - Income 340 023 426 328 426 328 29 556 158 573 213 164 (54 591) -26% 430 153
2.4 - Finance and Major Projects 149 918 130 266 130 266 33 077 53 325 65 133 (11 808) -18% 130 993
2.5 - Internal Control & Business Systems 60 869 74 201 74 201 5 160 29 156 37 101 (7 945) -21% 73 869
2.6 - Real Estate 66 424 84 412 84 412 5 806 36 376 42 206 (5 830) -14% 74 732
2.7 - City Fleet 270 854 310 496 310 496 21 382 137 017 155 248 (18 230) -12% 289 794
2.8 - Durban Energy Office 11 970 17 378 17 378 474 4 243 8 689 (4 446) -51% 17 430
2.9 - INK 4 861 6 766 6 766 47 1 391 3 383 (1 992) -59% 6 766
2.10 - Bus Operations 230 365 271 430 271 430 17 246 110 098 135 715 (25 617) -19% 258 785
2.11 - Assessment Rates – 103 253 103 253 51 627 (51 627) -100% 102 724
2.12 - Miscellaneous 1 746 494 999 398 999 398 45 026 199 082 485 239 (286 157) -59% 1 362 753
2.13- Supply Chain Management 56 437 76 325 76 325 4 295 29 070 38 163 (9 092) -24% 69 834
Vote 3 - Governance 553 505 552 453 552 453 61 240 306 248 276 226 30 021 11% 594 845
3.1 - Deputy City Manager 5 656 5 719 5 719 509 3 080 2 860 220 8% 5 719
3.2 - City Hall Administration & City Secretariat 294 978 280 041 280 041 37 529 157 150 140 021 17 130 12% 293 022
3.3 - Communications 56 710 44 921 44 921 4 273 30 281 22 460 7 821 35% 59 628
3.4 - Regional Centres 86 221 92 891 92 891 8 357 48 908 46 446 2 463 5% 97 840
3.5 - Community Participation & Action Support 95 958 112 741 112 741 9 552 59 681 56 370 3 310 6% 124 037
3.6 - SDB 5 097 6 261 6 261 339 2 707 3 131 (424) -14% 5 453
3.7 - International & Governance Relations 8 885 9 878 9 878 680 4 441 4 939 (499) -10% 9 146
Vote 4 - Corporate and Human Resources 349 566 433 038 433 038 30 835 198 338 216 519 (18 181) -8% 439 425
4.1 - Deputy City Manager 10 526 15 627 15 627 571 4 890 7 814 (2 924) -37% 15 627
4.2 - Human Resources 158 354 198 769 198 769 13 046 87 404 99 384 (11 981) -12% 185 155
4.3 - Skills Development 119 291 143 248 143 248 11 852 71 257 71 624 (367) -1% 150 326
4.4 - Occupational Health and Safety 37 557 47 996 47 996 3 284 20 936 23 998 (3 062) -13% 38 547
4.5 - Management Services and Org. Development 23 838 27 398 27 398 2 081 13 851 13 699 152 1% 49 770
Vote 5 - Economic Development and Planning 808 044 1 011 448 1 011 448 62 199 413 391 505 724 (92 332) -18% 945 978
5.1 - Deputy City Manager 3 225 11 161 11 161 631 4 117 5 580 (1 463) -26% 7 004
5.2 - Economic Development & Facilitation 93 590 126 474 126 474 9 144 44 527 63 237 (18 710) -30% 125 864
5.3 - City Enterprises 129 738 103 081 103 081 4 144 61 396 51 541 9 855 19% 166 744
5.4 - Business Support 72 308 81 034 81 034 4 721 37 670 40 517 (2 847) -7% 82 716
5.5 - Retail Markets 27 383 33 278 33 278 2 687 15 061 16 639 (1 578) -9% 32 364
5.6 - Development Planning & Management 212 316 278 455 278 455 17 993 117 450 139 228 (21 777) -16% 228 881
5.7 - Area Based Management 9 042 15 910 15 910 630 4 429 7 955 (3 527) -44% 14 194
5.8 - Strategic Projects 260 442 362 054 362 054 22 249 128 742 181 027 (52 285) -29% 288 211
Vote 6 - Community and Emergency Services 2 415 104 2 686 679 2 686 679 210 829 1 274 992 1 343 339 (68 347) -5% 2 574 050
6.1 - Deputy City Manager 35 067 63 020 63 020 3 940 12 156 31 510 (19 354) -61% 58 861
6.2 - Emergency Services 292 507 327 992 327 992 24 033 157 149 163 996 (6 848) -4% 321 298
6.3 - Disaster Management and Emergency Control 98 622 98 622 7 522 48 761 49 311 (550) -1% 118 154
6.5 - Security Management 88 349 79 423 79 423 8 728 47 719 39 712 8 007 20% 79 423
6.6 - Safer Cities 122 740 21 649 21 649 1 449 8 664 10 825 (2 161) -20% 21 649
6.7 - Health – 431 789 431 789 42 470 266 988 215 895 51 093 24% 365 449
6.8 - Parks, Recreation, Cemetries and Culture 468 751 1 664 181 1 664 181 122 688 733 556 832 091 (98 534) -12% 1 609 215
Vote 7 - Human Settlements and Infrastructure 4 377 442 4 845 110 4 845 110 388 648 2 127 838 2 422 555 (294 717) -12% 4 819 687
7.1 - Deputy City Manager 5 403 14 214 14 214 694 3 531 7 107 (3 576) -50% –
7.2 - Housing 447 956 570 292 570 292 30 378 189 353 285 146 (95 794) -34% 363 700
7.3 - Engineering 1 461 989 1 622 502 1 622 502 135 095 748 956 811 251 (62 296) -8% 1 528 314
7.4 - eThekwini Transport Authority 446 127 632 973 632 973 39 858 159 260 316 487 (157 226) -50% 636 601
7.5 - Sanitation 1 005 790 1 117 210 1 117 210 94 997 525 117 558 605 (33 488) -6% 1 113 570
7.6 - Cleansing and Solid Waste 988 829 857 338 857 338 85 003 491 499 428 669 62 830 15% 1 150 078
7.7 - Gas to Electricity 21 347 25 564 25 564 2 623 10 117 12 782 (2 665) -21% 24 859
7.8 - Trading Services DCM – 5 016 5 016 1 6 2 508 (2 503) -100% 2 565
Vote 8 - Electricity 9 323 331 10 726 351 10 726 351 752 910 5 375 665 5 363 175 12 489 0% 10 908 774
8.1 - Electricity 9 323 331 10 726 351 10 726 351 752 910 5 375 665 5 363 175 12 489 0% 10 908 774
Vote 9 - Water 3 646 255 4 149 698 4 149 698 343 944 1 743 193 2 074 849 (331 656) -16% 3 598 448
9.1 - Water 3 646 255 4 149 698 4 149 698 343 944 1 743 193 2 074 849 (331 656) -16% 3 598 448
Vote 10 - Formal Housing 374 309 321 608 321 608 21 893 53 439 160 804 (107 365) -67% 154 024
10.1 - Formal Housing 374 309 321 608 321 608 21 893 53 439 160 804 (107 365) -67% 154 024
Vote 11 - Markets 49 480 66 433 66 433 4 406 23 312 33 217 (9 905) -30% 58 495
11.1 - Markets 49 480 66 433 66 433 4 406 23 312 33 217 (9 905) -30% 58 495
Vote 12 - Airport 6 061 7 672 7 672 366 2 821 3 836 (1 015) -26% 7 946
12.1 - Airport 6 061 7 672 7 672 366 2 821 3 836 (1 015) -26% 7 946
Vote 13 - Chief Albert Luthuli International Convertional Centre152 082 173 289 173 289 10 551 84 096 86 644 (2 548) -3% 172 535
13.1 - ICC 152 082 173 289 173 289 10 551 84 096 86 644 (2 548) -3% 172 535
Vote 14 - uShaka Marine World 206 352 238 045 238 045 27 664 117 918 119 023 (1 105) -1% 234 264
14.1 - uShaka Marine World 206 352 238 045 238 045 27 664 117 918 119 023 234 264
Total Expenditure by Vote 2 26 698 862 29 436 059 29 436 059 2 206 310 13 313 604 14 703 570 (1 389 965) -9% 29 482 955 –
Surplus/ (Deficit) for the year 2 2 948 740 3 663 180 3 663 180 1 453 646 3 140 588 1 899 626 1 240 962 65% 3 320 713
42
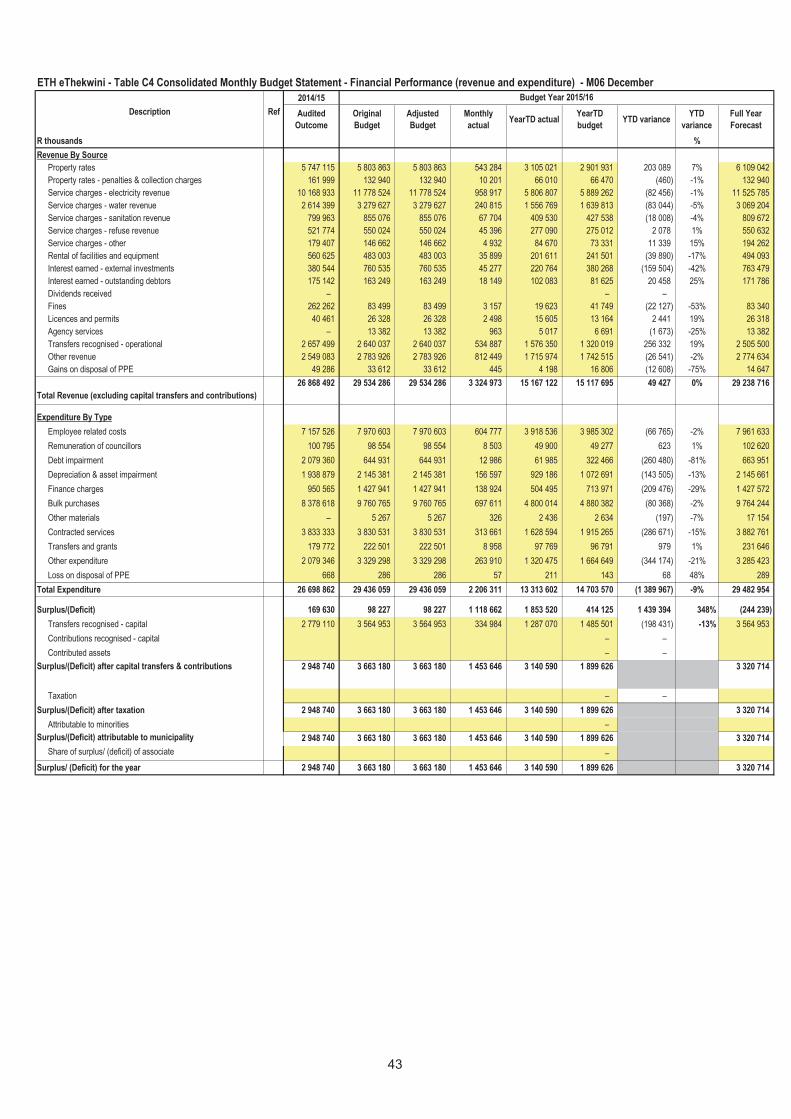
2014/15
Audited
Outcome
Original
Budget
Adjusted
Budget
Monthly
actualYearTD actual
YearTD
budgetYTD variance
YTD
variance
Full Year
Forecast
R thousands %
Revenue By Source
Property rates 5 747 115 5 803 863 5 803 863 543 284 3 105 021 2 901 931 203 089 7% 6 109 042
Property rates - penalties & collection charges 161 999 132 940 132 940 10 201 66 010 66 470 (460) -1% 132 940
Service charges - electricity revenue 10 168 933 11 778 524 11 778 524 958 917 5 806 807 5 889 262 (82 456) -1% 11 525 785
Service charges - water revenue 2 614 399 3 279 627 3 279 627 240 815 1 556 769 1 639 813 (83 044) -5% 3 069 204
Service charges - sanitation revenue 799 963 855 076 855 076 67 704 409 530 427 538 (18 008) -4% 809 672
Service charges - refuse revenue 521 774 550 024 550 024 45 396 277 090 275 012 2 078 1% 550 632
Service charges - other 179 407 146 662 146 662 4 932 84 670 73 331 11 339 15% 194 262
Rental of facilities and equipment 560 625 483 003 483 003 35 899 201 611 241 501 (39 890) -17% 494 093
Interest earned - external investments 380 544 760 535 760 535 45 277 220 764 380 268 (159 504) -42% 763 479
Interest earned - outstanding debtors 175 142 163 249 163 249 18 149 102 083 81 625 20 458 25% 171 786
Dividends received – – –
Fines 262 262 83 499 83 499 3 157 19 623 41 749 (22 127) -53% 83 340
Licences and permits 40 461 26 328 26 328 2 498 15 605 13 164 2 441 19% 26 318
Agency services – 13 382 13 382 963 5 017 6 691 (1 673) -25% 13 382
Transfers recognised - operational 2 657 499 2 640 037 2 640 037 534 887 1 576 350 1 320 019 256 332 19% 2 505 500
Other revenue 2 549 083 2 783 926 2 783 926 812 449 1 715 974 1 742 515 (26 541) -2% 2 774 634
Gains on disposal of PPE 49 286 33 612 33 612 445 4 198 16 806 (12 608) -75% 14 647
Total Revenue (excluding capital transfers and contributions)
26 868 492 29 534 286 29 534 286 3 324 973 15 167 122 15 117 695 49 427 0% 29 238 716
Expenditure By Type
Employee related costs 7 157 526 7 970 603 7 970 603 604 777 3 918 536 3 985 302 (66 765) -2% 7 961 633
Remuneration of councillors 100 795 98 554 98 554 8 503 49 900 49 277 623 1% 102 620
Debt impairment 2 079 360 644 931 644 931 12 986 61 985 322 466 (260 480) -81% 663 951
Depreciation & asset impairment 1 938 879 2 145 381 2 145 381 156 597 929 186 1 072 691 (143 505) -13% 2 145 661
Finance charges 950 565 1 427 941 1 427 941 138 924 504 495 713 971 (209 476) -29% 1 427 572
Bulk purchases 8 378 618 9 760 765 9 760 765 697 611 4 800 014 4 880 382 (80 368) -2% 9 764 244
Other materials – 5 267 5 267 326 2 436 2 634 (197) -7% 17 154
Contracted services 3 833 333 3 830 531 3 830 531 313 661 1 628 594 1 915 265 (286 671) -15% 3 882 761
Transfers and grants 179 772 222 501 222 501 8 958 97 769 96 791 979 1% 231 646
Other expenditure 2 079 346 3 329 298 3 329 298 263 910 1 320 475 1 664 649 (344 174) -21% 3 285 423
Loss on disposal of PPE 668 286 286 57 211 143 68 48% 289
Total Expenditure 26 698 862 29 436 059 29 436 059 2 206 311 13 313 602 14 703 570 (1 389 967) -9% 29 482 954
Surplus/(Deficit) 169 630 98 227 98 227 1 118 662 1 853 520 414 125 1 439 394 348% (244 239)
Transfers recognised - capital 2 779 110 3 564 953 3 564 953 334 984 1 287 070 1 485 501 (198 431) -13% 3 564 953
Contributions recognised - capital – –
Contributed assets – –
Surplus/(Deficit) after capital transfers & contributions 2 948 740 3 663 180 3 663 180 1 453 646 3 140 590 1 899 626 3 320 714
Taxation – –
Surplus/(Deficit) after taxation 2 948 740 3 663 180 3 663 180 1 453 646 3 140 590 1 899 626 3 320 714
Attributable to minorities –
Surplus/(Deficit) attributable to municipality 2 948 740 3 663 180 3 663 180 1 453 646 3 140 590 1 899 626 3 320 714
Share of surplus/ (deficit) of associate –
Surplus/ (Deficit) for the year 2 948 740 3 663 180 3 663 180 1 453 646 3 140 590 1 899 626 3 320 714
Description Ref
Budget Year 2015/16
ETH eThekwini - Table C4 Consolidated Monthly Budget Statement - Financial Performance (revenue and expenditure) - M06 December
43
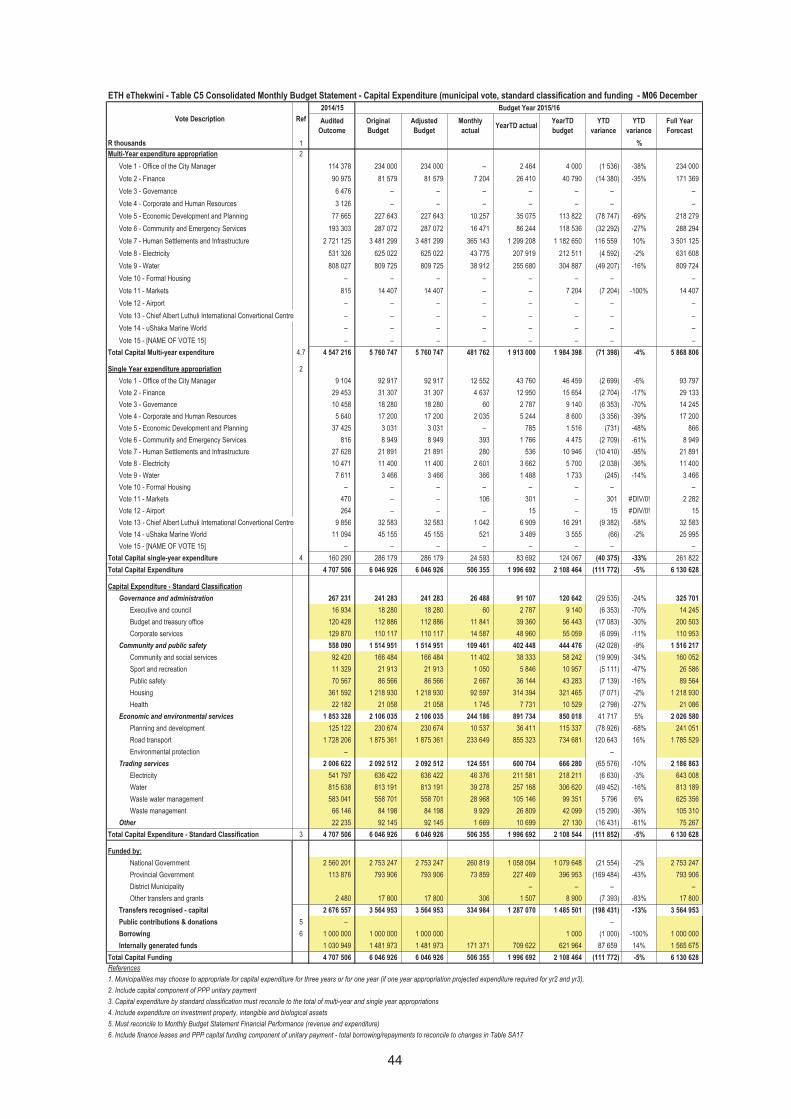
2014/15 Budget Year 2015/16
Audited
Outcome
Original
Budget
Adjusted
Budget
Monthly
actualYearTD actual
YearTD
budget
YTD
variance
YTD
variance
Full Year
Forecast
R thousands 1 %
Multi-Year expenditure appropriation 2
Vote 1 - Office of the City Manager 114 378 234 000 234 000 – 2 464 4 000 (1 536) -38% 234 000
Vote 2 - Finance 90 975 81 579 81 579 7 204 26 410 40 790 (14 380) -35% 171 369
Vote 3 - Governance 6 476 – – – – – – –
Vote 4 - Corporate and Human Resources 3 126 – – – – – – –
Vote 5 - Economic Development and Planning 77 665 227 643 227 643 10 257 35 075 113 822 (78 747) -69% 218 279
Vote 6 - Community and Emergency Services 193 303 287 072 287 072 16 471 86 244 118 536 (32 292) -27% 288 294
Vote 7 - Human Settlements and Infrastructure 2 721 125 3 481 299 3 481 299 365 143 1 299 208 1 182 650 116 559 10% 3 501 125
Vote 8 - Electricity 531 326 625 022 625 022 43 775 207 919 212 511 (4 592) -2% 631 608
Vote 9 - Water 808 027 809 725 809 725 38 912 255 680 304 887 (49 207) -16% 809 724
Vote 10 - Formal Housing – – – – – – – –
Vote 11 - Markets 815 14 407 14 407 – – 7 204 (7 204) -100% 14 407
Vote 12 - Airport – – – – – – – –
Vote 13 - Chief Albert Luthuli International Convertional Centre – – – – – – – –
Vote 14 - uShaka Marine World – – – – – – – –
Vote 15 - [NAME OF VOTE 15] – – – – – – – –
Total Capital Multi-year expenditure 4,7 4 547 216 5 760 747 5 760 747 481 762 1 913 000 1 984 398 (71 398) -4% 5 868 806
Single Year expenditure appropriation 2
Vote 1 - Office of the City Manager 9 104 92 917 92 917 12 552 43 760 46 459 (2 699) -6% 93 797
Vote 2 - Finance 29 453 31 307 31 307 4 637 12 950 15 654 (2 704) -17% 29 133
Vote 3 - Governance 10 458 18 280 18 280 60 2 787 9 140 (6 353) -70% 14 245
Vote 4 - Corporate and Human Resources 5 640 17 200 17 200 2 035 5 244 8 600 (3 356) -39% 17 200
Vote 5 - Economic Development and Planning 37 425 3 031 3 031 – 785 1 516 (731) -48% 866
Vote 6 - Community and Emergency Services 816 8 949 8 949 393 1 766 4 475 (2 709) -61% 8 949
Vote 7 - Human Settlements and Infrastructure 27 628 21 891 21 891 280 536 10 946 (10 410) -95% 21 891
Vote 8 - Electricity 10 471 11 400 11 400 2 601 3 662 5 700 (2 038) -36% 11 400
Vote 9 - Water 7 611 3 466 3 466 366 1 488 1 733 (245) -14% 3 466
Vote 10 - Formal Housing – – – – – – – –
Vote 11 - Markets 470 – – 106 301 – 301 #DIV/0! 2 282
Vote 12 - Airport 264 – – – 15 – 15 #DIV/0! 15
Vote 13 - Chief Albert Luthuli International Convertional Centre 9 856 32 583 32 583 1 042 6 909 16 291 (9 382) -58% 32 583
Vote 14 - uShaka Marine World 11 094 45 155 45 155 521 3 489 3 555 (66) -2% 25 995
Vote 15 - [NAME OF VOTE 15] – – – – – – – –
Total Capital single-year expenditure 4 160 290 286 179 286 179 24 593 83 692 124 067 (40 375) -33% 261 822
Total Capital Expenditure 4 707 506 6 046 926 6 046 926 506 355 1 996 692 2 108 464 (111 772) -5% 6 130 628
Capital Expenditure - Standard Classification
Governance and administration 267 231 241 283 241 283 26 488 91 107 120 642 (29 535) -24% 325 701
Executive and council 16 934 18 280 18 280 60 2 787 9 140 (6 353) -70% 14 245
Budget and treasury office 120 428 112 886 112 886 11 841 39 360 56 443 (17 083) -30% 200 503
Corporate services 129 870 110 117 110 117 14 587 48 960 55 059 (6 099) -11% 110 953
Community and public safety 558 090 1 514 951 1 514 951 109 461 402 448 444 476 (42 028) -9% 1 516 217
Community and social services 92 420 166 484 166 484 11 402 38 333 58 242 (19 909) -34% 160 052
Sport and recreation 11 329 21 913 21 913 1 050 5 846 10 957 (5 111) -47% 26 586
Public safety 70 567 86 566 86 566 2 667 36 144 43 283 (7 139) -16% 89 564
Housing 361 592 1 218 930 1 218 930 92 597 314 394 321 465 (7 071) -2% 1 218 930
Health 22 182 21 058 21 058 1 745 7 731 10 529 (2 798) -27% 21 086
Economic and environmental services 1 853 328 2 106 035 2 106 035 244 186 891 734 850 018 41 717 5% 2 026 580
Planning and development 125 122 230 674 230 674 10 537 36 411 115 337 (78 926) -68% 241 051
Road transport 1 728 206 1 875 361 1 875 361 233 649 855 323 734 681 120 643 16% 1 785 529
Environmental protection – –
Trading services 2 006 622 2 092 512 2 092 512 124 551 600 704 666 280 (65 576) -10% 2 186 863
Electricity 541 797 636 422 636 422 46 376 211 581 218 211 (6 630) -3% 643 008
Water 815 638 813 191 813 191 39 278 257 168 306 620 (49 452) -16% 813 189
Waste water management 583 041 558 701 558 701 28 968 105 146 99 351 5 796 6% 625 356
Waste management 66 146 84 198 84 198 9 929 26 809 42 099 (15 290) -36% 105 310
Other 22 235 92 145 92 145 1 669 10 699 27 130 (16 431) -61% 75 267
Total Capital Expenditure - Standard Classification 3 4 707 506 6 046 926 6 046 926 506 355 1 996 692 2 108 544 (111 852) -5% 6 130 628
Funded by:
National Government 2 560 201 2 753 247 2 753 247 260 819 1 058 094 1 079 648 (21 554) -2% 2 753 247
Provincial Government 113 876 793 906 793 906 73 859 227 469 396 953 (169 484) -43% 793 906
District Municipality – – – –
Other transfers and grants 2 480 17 800 17 800 306 1 507 8 900 (7 393) -83% 17 800
Transfers recognised - capital 2 676 557 3 564 953 3 564 953 334 984 1 287 070 1 485 501 (198 431) -13% 3 564 953
Public contributions & donations 5 – –
Borrowing 6 1 000 000 1 000 000 1 000 000 1 000 (1 000) -100% 1 000 000
Internally generated funds 1 030 949 1 481 973 1 481 973 171 371 709 622 621 964 87 659 14% 1 565 675
Total Capital Funding 4 707 506 6 046 926 6 046 926 506 355 1 996 692 2 108 464 (111 772) -5% 6 130 628
References
1. Municipalities may choose to appropriate for capital expenditure for three years or for one year (if one year appropriation projected expenditure required for yr2 and yr3).
5. Must reconcile to Monthly Budget Statement Financial Performance (revenue and expenditure)
6. Include finance leases and PPP capital funding component of unitary payment - total borrowing/repayments to reconcile to changes in Table SA17
ETH eThekwini - Table C5 Consolidated Monthly Budget Statement - Capital Expenditure (municipal vote, standard classification and funding - M06 December
2. Include capital component of PPP unitary payment
4. Include expenditure on investment property, intangible and biological assets
3. Capital expenditure by standard classification must reconcile to the total of multi-year and single year appropriations
Vote Description Ref
44
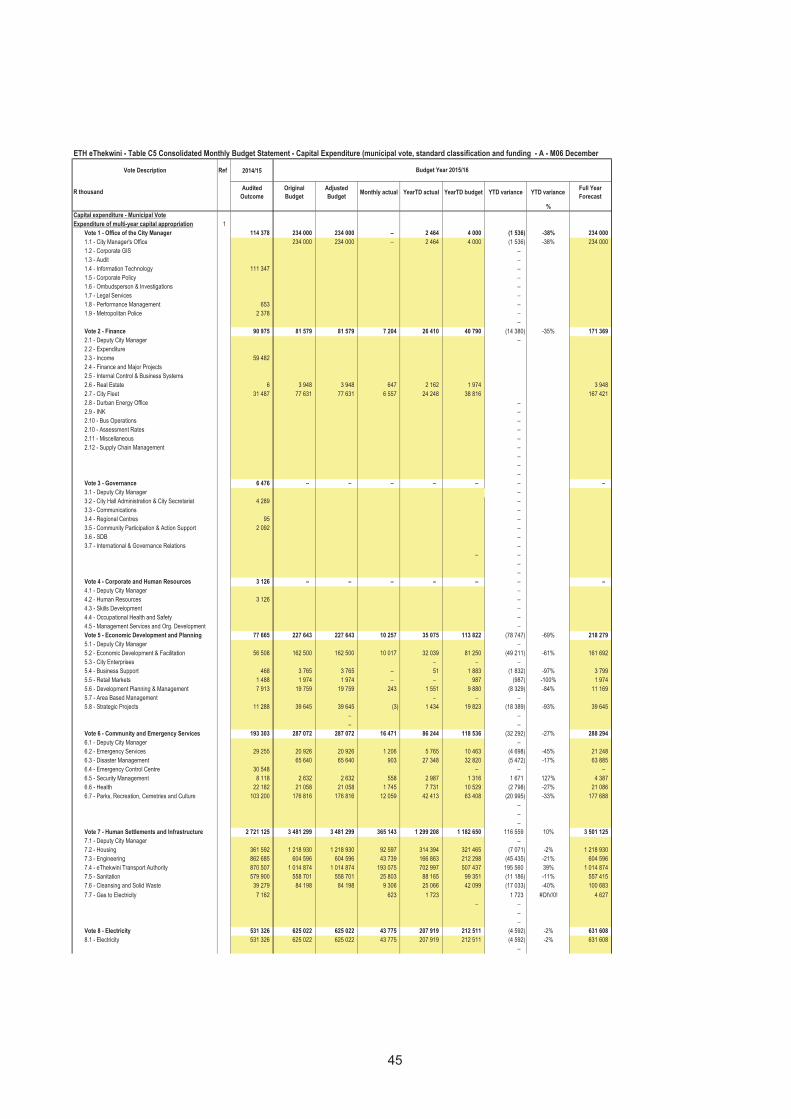
Vote Description Ref 2014/15
R thousandAudited
Outcome
Original
Budget
Adjusted
BudgetMonthly actual YearTD actual YearTD budget YTD variance YTD variance
Full Year
Forecast
%
Capital expenditure - Municipal Vote
Expenditure of multi-year capital appropriation 1
Vote 1 - Office of the City Manager 114 378 234 000 234 000 – 2 464 4 000 (1 536) -38% 234 000
1.1 - City Manager's Office 234 000 234 000 – 2 464 4 000 (1 536) -38% 234 000
1.2 - Corporate GIS –
1.3 - Audit –
1.4 - Information Technology 111 347 –
1.5 - Corporate Policy –
1.6 - Ombudsperson & Investigations –
1.7 - Legal Services –
1.8 - Performance Management 653 –
1.9 - Metropolitan Police 2 378 –
–
Vote 2 - Finance 90 975 81 579 81 579 7 204 26 410 40 790 (14 380) -35% 171 369
2.1 - Deputy City Manager –
2.2 - Expenditure
2.3 - Income 59 482
2.4 - Finance and Major Projects
2.5 - Internal Control & Business Systems
2.6 - Real Estate 6 3 948 3 948 647 2 162 1 974 3 948
2.7 - City Fleet 31 487 77 631 77 631 6 557 24 248 38 816 167 421
2.8 - Durban Energy Office –
2.9 - INK –
2.10 - Bus Operations –
2.10 - Assessment Rates –
2.11 - Miscellaneous –
2.12 - Supply Chain Management –
–
–
–
Vote 3 - Governance 6 476 – – – – – – –
3.1 - Deputy City Manager –
3.2 - City Hall Administration & City Secretariat 4 289 –
3.3 - Communications –
3.4 - Regional Centres 95 –
3.5 - Community Participation & Action Support 2 092 –
3.6 - SDB –
3.7 - International & Governance Relations –
– –
–
–
Vote 4 - Corporate and Human Resources 3 126 – – – – – – –
4.1 - Deputy City Manager –
4.2 - Human Resources 3 126 –
4.3 - Skills Development –
4.4 - Occupational Health and Safety –
4.5 - Management Services and Org. Development –
Vote 5 - Economic Development and Planning 77 665 227 643 227 643 10 257 35 075 113 822 (78 747) -69% 218 279
5.1 - Deputy City Manager –
5.2 - Economic Development & Facilitation 56 508 162 500 162 500 10 017 32 039 81 250 (49 211) -61% 161 692
5.3 - City Enterprises – – –
5.4 - Business Support 468 3 765 3 765 – 51 1 883 (1 832) -97% 3 799
5.5 - Retail Markets 1 488 1 974 1 974 – – 987 (987) -100% 1 974
5.6 - Development Planning & Management 7 913 19 759 19 759 243 1 551 9 880 (8 329) -84% 11 169
5.7 - Area Based Management – – –
5.8 - Strategic Projects 11 288 39 645 39 645 (3) 1 434 19 823 (18 389) -93% 39 645
– –
– –
Vote 6 - Community and Emergency Services 193 303 287 072 287 072 16 471 86 244 118 536 (32 292) -27% 288 294
6.1 - Deputy City Manager –
6.2 - Emergency Services 29 255 20 926 20 926 1 206 5 765 10 463 (4 698) -45% 21 248
6.3 - Disaster Management 65 640 65 640 903 27 348 32 820 (5 472) -17% 63 885
6.4 - Emergency Control Centre 30 548 – – –
6.5 - Security Management 8 118 2 632 2 632 558 2 987 1 316 1 671 127% 4 387
6.6 - Health 22 182 21 058 21 058 1 745 7 731 10 529 (2 798) -27% 21 086
6.7 - Parks, Recreation, Cemetries and Culture 103 200 176 816 176 816 12 059 42 413 63 408 (20 995) -33% 177 688
–
–
–
Vote 7 - Human Settlements and Infrastructure 2 721 125 3 481 299 3 481 299 365 143 1 299 208 1 182 650 116 559 10% 3 501 125
7.1 - Deputy City Manager –
7.2 - Housing 361 592 1 218 930 1 218 930 92 597 314 394 321 465 (7 071) -2% 1 218 930
7.3 - Engineering 862 685 604 596 604 596 43 739 166 863 212 298 (45 435) -21% 604 596
7.4 - eThekwini Transport Authority 870 507 1 014 874 1 014 874 193 075 702 997 507 437 195 560 39% 1 014 874
7.5 - Sanitation 579 900 558 701 558 701 25 803 88 165 99 351 (11 186) -11% 557 415
7.6 - Cleansing and Solid Waste 39 279 84 198 84 198 9 306 25 066 42 099 (17 033) -40% 100 683
7.7 - Gas to Electricity 7 162 623 1 723 1 723 #DIV/0! 4 627
– –
–
–
Vote 8 - Electricity 531 326 625 022 625 022 43 775 207 919 212 511 (4 592) -2% 631 608
8.1 - Electricity 531 326 625 022 625 022 43 775 207 919 212 511 (4 592) -2% 631 608
–
Budget Year 2015/16
ETH eThekwini - Table C5 Consolidated Monthly Budget Statement - Capital Expenditure (municipal vote, standard classification and funding - A - M06 December
45
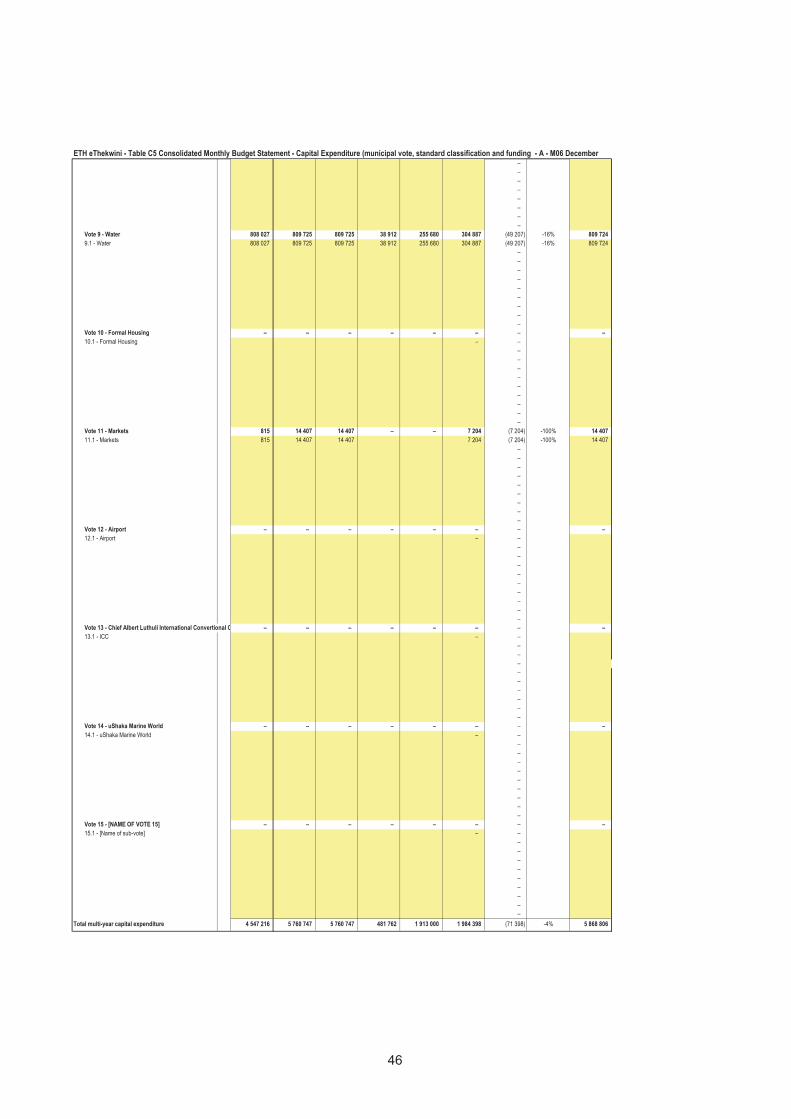
ETH eThekwini - Table C5 Consolidated Monthly Budget Statement - Capital Expenditure (municipal vote, standard classification and funding - A - M06 December–
–
–
–
–
–
–
–
Vote 9 - Water 808 027 809 725 809 725 38 912 255 680 304 887 (49 207) -16% 809 724
9.1 - Water 808 027 809 725 809 725 38 912 255 680 304 887 (49 207) -16% 809 724
–
–
–
–
–
–
–
–
–
Vote 10 - Formal Housing – – – – – – – –
10.1 - Formal Housing – –
–
–
–
–
–
–
–
–
–
Vote 11 - Markets 815 14 407 14 407 – – 7 204 (7 204) -100% 14 407
11.1 - Markets 815 14 407 14 407 7 204 (7 204) -100% 14 407
–
–
–
–
–
–
–
–
–
Vote 12 - Airport – – – – – – – –
12.1 - Airport – –
–
–
–
–
–
–
–
–
–
Vote 13 - Chief Albert Luthuli International Convertional Centre – – – – – – – –
13.1 - ICC – –
–
–
–
–
–
–
–
–
–
Vote 14 - uShaka Marine World – – – – – – – –
14.1 - uShaka Marine World – –
–
–
–
–
–
–
–
–
–
Vote 15 - [NAME OF VOTE 15] – – – – – – – –
15.1 - [Name of sub-vote] – –
–
–
–
–
–
–
–
–
–
Total multi-year capital expenditure 4 547 216 5 760 747 5 760 747 481 762 1 913 000 1 984 398 (71 398) -4% 5 868 806 –
46
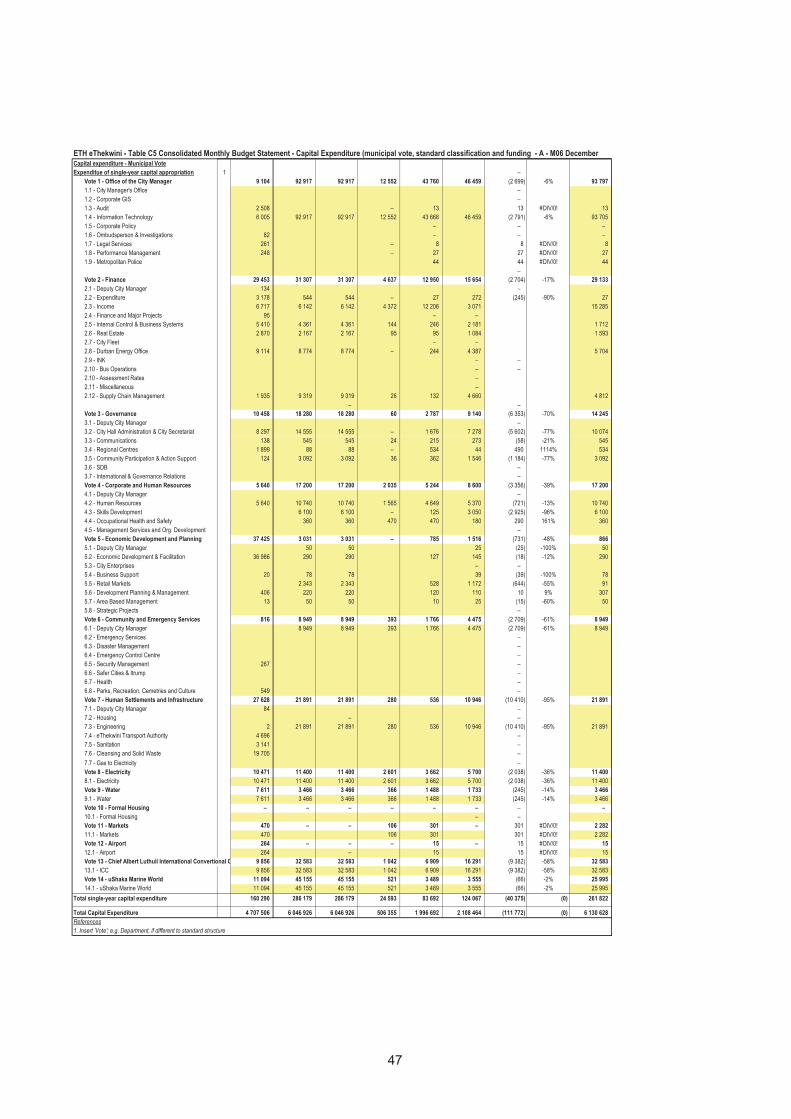
ETH eThekwini - Table C5 Consolidated Monthly Budget Statement - Capital Expenditure (municipal vote, standard classification and funding - A - M06 DecemberCapital expenditure - Municipal Vote
Expenditue of single-year capital appropriation 1 –
Vote 1 - Office of the City Manager 9 104 92 917 92 917 12 552 43 760 46 459 (2 699) -6% 93 797
1.1 - City Manager's Office –
1.2 - Corporate GIS –
1.3 - Audit 2 508 – 13 13 #DIV/0! 13
1.4 - Information Technology 6 005 92 917 92 917 12 552 43 668 46 459 (2 791) -6% 93 705
1.5 - Corporate Policy – – –
1.6 - Ombudsperson & Investigations 82 – – –
1.7 - Legal Services 261 – 8 8 #DIV/0! 8
1.8 - Performance Management 248 – 27 27 #DIV/0! 27
1.9 - Metropolitan Police 44 44 #DIV/0! 44
–
Vote 2 - Finance 29 453 31 307 31 307 4 637 12 950 15 654 (2 704) -17% 29 133
2.1 - Deputy City Manager 134 –
2.2 - Expenditure 3 178 544 544 – 27 272 (245) -90% 27
2.3 - Income 6 717 6 142 6 142 4 372 12 206 3 071 15 285
2.4 - Finance and Major Projects 95 – –
2.5 - Internal Control & Business Systems 5 410 4 361 4 361 144 246 2 181 1 712
2.6 - Real Estate 2 870 2 167 2 167 95 95 1 084 1 593
2.7 - City Fleet – –
2.8 - Durban Energy Office 9 114 8 774 8 774 – 244 4 387 5 704
2.9 - INK – –
2.10 - Bus Operations – –
2.10 - Assessment Rates –
2.11 - Miscellaneous –
2.12 - Supply Chain Management 1 935 9 319 9 319 26 132 4 660 4 812
– –
Vote 3 - Governance 10 458 18 280 18 280 60 2 787 9 140 (6 353) -70% 14 245
3.1 - Deputy City Manager –
3.2 - City Hall Administration & City Secretariat 8 297 14 555 14 555 – 1 676 7 278 (5 602) -77% 10 074
3.3 - Communications 138 545 545 24 215 273 (58) -21% 545
3.4 - Regional Centres 1 899 88 88 – 534 44 490 1114% 534
3.5 - Community Participation & Action Support 124 3 092 3 092 36 362 1 546 (1 184) -77% 3 092
3.6 - SDB –
3.7 - International & Governance Relations –
Vote 4 - Corporate and Human Resources 5 640 17 200 17 200 2 035 5 244 8 600 (3 356) -39% 17 200
4.1 - Deputy City Manager –
4.2 - Human Resources 5 640 10 740 10 740 1 565 4 649 5 370 (721) -13% 10 740
4.3 - Skills Development 6 100 6 100 – 125 3 050 (2 925) -96% 6 100
4.4 - Occupational Health and Safety 360 360 470 470 180 290 161% 360
4.5 - Management Services and Org. Development –
Vote 5 - Economic Development and Planning 37 425 3 031 3 031 – 785 1 516 (731) -48% 866
5.1 - Deputy City Manager 50 50 25 (25) -100% 50
5.2 - Economic Development & Facilitation 36 986 290 290 127 145 (18) -12% 290
5.3 - City Enterprises – –
5.4 - Business Support 20 78 78 39 (39) -100% 78
5.5 - Retail Markets 2 343 2 343 528 1 172 (644) -55% 91
5.6 - Development Planning & Management 406 220 220 120 110 10 9% 307
5.7 - Area Based Management 13 50 50 10 25 (15) -60% 50
5.8 - Strategic Projects –
Vote 6 - Community and Emergency Services 816 8 949 8 949 393 1 766 4 475 (2 709) -61% 8 949
6.1 - Deputy City Manager 8 949 8 949 393 1 766 4 475 (2 709) -61% 8 949
6.2 - Emergency Services –
6.3 - Disaster Management –
6.4 - Emergency Control Centre –
6.5 - Security Management 267 –
6.6 - Safer Cities & Itrump –
6.7 - Health –
6.8 - Parks, Recreation, Cemetries and Culture 549 –
Vote 7 - Human Settlements and Infrastructure 27 628 21 891 21 891 280 536 10 946 (10 410) -95% 21 891
7.1 - Deputy City Manager 84 –
7.2 - Housing – –
7.3 - Engineering 2 21 891 21 891 280 536 10 946 (10 410) -95% 21 891
7.4 - eThekwini Transport Authority 4 696 –
7.5 - Sanitation 3 141 –
7.6 - Cleansing and Solid Waste 19 705 –
7.7 - Gas to Electricity –
Vote 8 - Electricity 10 471 11 400 11 400 2 601 3 662 5 700 (2 038) -36% 11 400
8.1 - Electricity 10 471 11 400 11 400 2 601 3 662 5 700 (2 038) -36% 11 400
Vote 9 - Water 7 611 3 466 3 466 366 1 488 1 733 (245) -14% 3 466
9.1 - Water 7 611 3 466 3 466 366 1 488 1 733 (245) -14% 3 466
Vote 10 - Formal Housing – – – – – – – –
10.1 - Formal Housing – –
Vote 11 - Markets 470 – – 106 301 – 301 #DIV/0! 2 282
11.1 - Markets 470 106 301 301 #DIV/0! 2 282
Vote 12 - Airport 264 – – – 15 – 15 #DIV/0! 15
12.1 - Airport 264 – 15 15 #DIV/0! 15
Vote 13 - Chief Albert Luthuli International Convertional Centre 9 856 32 583 32 583 1 042 6 909 16 291 (9 382) -58% 32 583
13.1 - ICC 9 856 32 583 32 583 1 042 6 909 16 291 (9 382) -58% 32 583
Vote 14 - uShaka Marine World 11 094 45 155 45 155 521 3 489 3 555 (66) -2% 25 995
14.1 - uShaka Marine World 11 094 45 155 45 155 521 3 489 3 555 (66) -2% 25 995
Total single-year capital expenditure 160 290 286 179 286 179 24 593 83 692 124 067 (40 375) (0) 261 822 –
Total Capital Expenditure 4 707 506 6 046 926 6 046 926 506 355 1 996 692 2 108 464 (111 772) (0) 6 130 628
References
1. Insert 'Vote'; e.g. Department, if different to standard structure
47
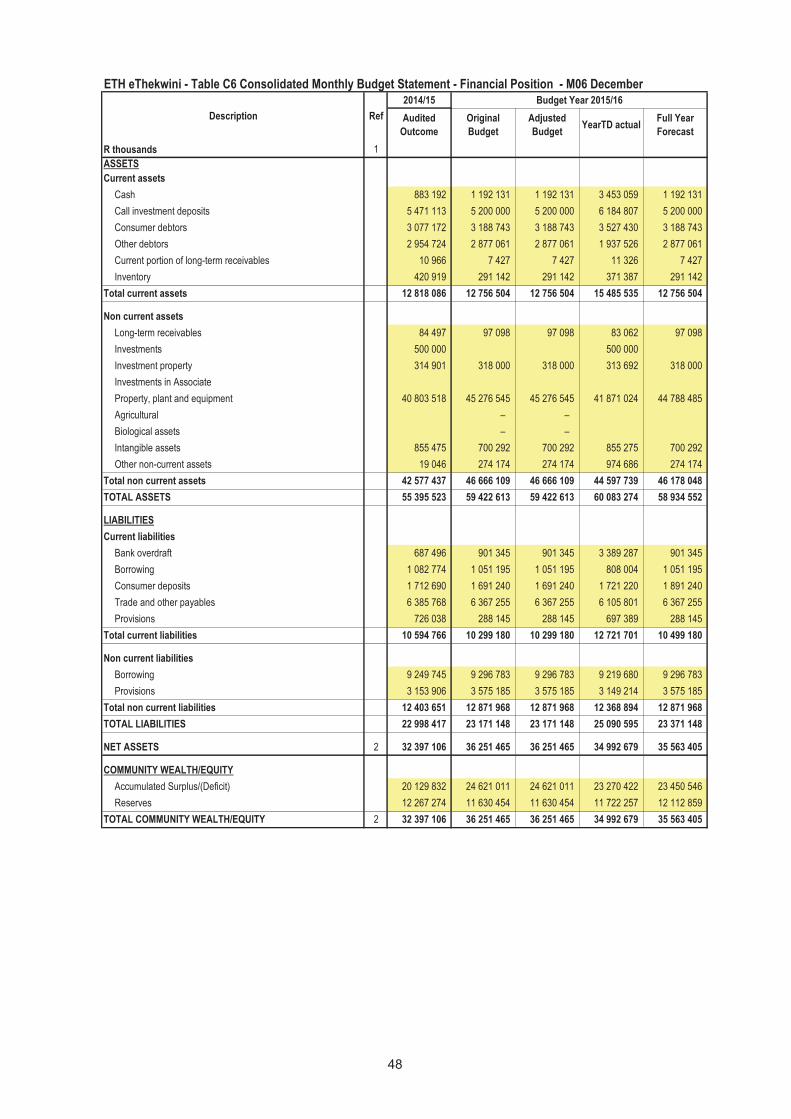
2014/15 Budget Year 2015/16
Audited
Outcome
Original
Budget
Adjusted
BudgetYearTD actual
Full Year
Forecast
R thousands 1
ASSETS
Current assets
Cash 883 192 1 192 131 1 192 131 3 453 059 1 192 131
Call investment deposits 5 471 113 5 200 000 5 200 000 6 184 807 5 200 000
Consumer debtors 3 077 172 3 188 743 3 188 743 3 527 430 3 188 743
Other debtors 2 954 724 2 877 061 2 877 061 1 937 526 2 877 061
Current portion of long-term receivables 10 966 7 427 7 427 11 326 7 427
Inventory 420 919 291 142 291 142 371 387 291 142
Total current assets 12 818 086 12 756 504 12 756 504 15 485 535 12 756 504
Non current assets
Long-term receivables 84 497 97 098 97 098 83 062 97 098
Investments 500 000 500 000
Investment property 314 901 318 000 318 000 313 692 318 000
Investments in Associate
Property, plant and equipment 40 803 518 45 276 545 45 276 545 41 871 024 44 788 485
Agricultural – –
Biological assets – –
Intangible assets 855 475 700 292 700 292 855 275 700 292
Other non-current assets 19 046 274 174 274 174 974 686 274 174
Total non current assets 42 577 437 46 666 109 46 666 109 44 597 739 46 178 048
TOTAL ASSETS 55 395 523 59 422 613 59 422 613 60 083 274 58 934 552
LIABILITIES
Current liabilities
Bank overdraft 687 496 901 345 901 345 3 389 287 901 345
Borrowing 1 082 774 1 051 195 1 051 195 808 004 1 051 195
Consumer deposits 1 712 690 1 691 240 1 691 240 1 721 220 1 891 240
Trade and other payables 6 385 768 6 367 255 6 367 255 6 105 801 6 367 255
Provisions 726 038 288 145 288 145 697 389 288 145
Total current liabilities 10 594 766 10 299 180 10 299 180 12 721 701 10 499 180
Non current liabilities
Borrowing 9 249 745 9 296 783 9 296 783 9 219 680 9 296 783
Provisions 3 153 906 3 575 185 3 575 185 3 149 214 3 575 185
Total non current liabilities 12 403 651 12 871 968 12 871 968 12 368 894 12 871 968
TOTAL LIABILITIES 22 998 417 23 171 148 23 171 148 25 090 595 23 371 148
NET ASSETS 2 32 397 106 36 251 465 36 251 465 34 992 679 35 563 405
COMMUNITY WEALTH/EQUITY
Accumulated Surplus/(Deficit) 20 129 832 24 621 011 24 621 011 23 270 422 23 450 546
Reserves 12 267 274 11 630 454 11 630 454 11 722 257 12 112 859
TOTAL COMMUNITY WEALTH/EQUITY 2 32 397 106 36 251 465 36 251 465 34 992 679 35 563 405
Description Ref
ETH eThekwini - Table C6 Consolidated Monthly Budget Statement - Financial Position - M06 December
48
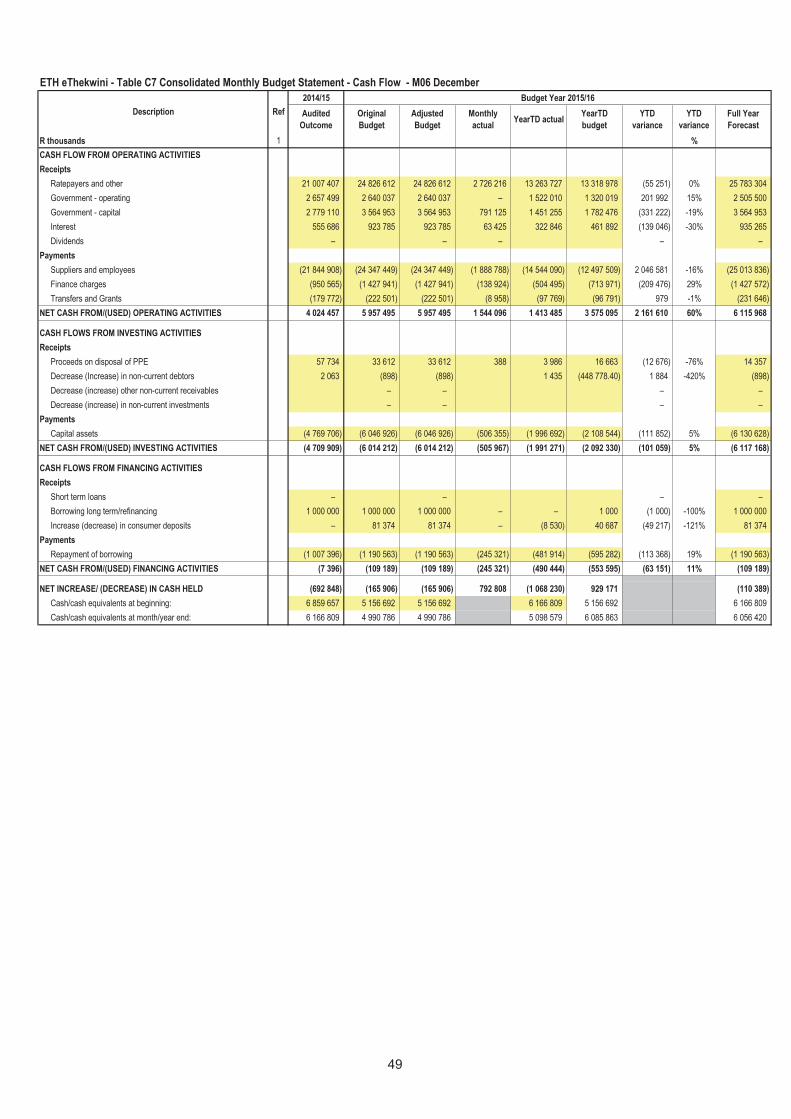
2014/15 Budget Year 2015/16
Audited
Outcome
Original
Budget
Adjusted
Budget
Monthly
actualYearTD actual
YearTD
budget
YTD
variance
YTD
variance
Full Year
Forecast
R thousands 1 %
CASH FLOW FROM OPERATING ACTIVITIES
Receipts
Ratepayers and other 21 007 407 24 826 612 24 826 612 2 726 216 13 263 727 13 318 978 (55 251) 0% 25 783 304
Government - operating 2 657 499 2 640 037 2 640 037 – 1 522 010 1 320 019 201 992 15% 2 505 500
Government - capital 2 779 110 3 564 953 3 564 953 791 125 1 451 255 1 782 476 (331 222) -19% 3 564 953
Interest 555 686 923 785 923 785 63 425 322 846 461 892 (139 046) -30% 935 265
Dividends – – – – –
Payments
Suppliers and employees (21 844 908) (24 347 449) (24 347 449) (1 888 788) (14 544 090) (12 497 509) 2 046 581 -16% (25 013 836)
Finance charges (950 565) (1 427 941) (1 427 941) (138 924) (504 495) (713 971) (209 476) 29% (1 427 572)
Transfers and Grants (179 772) (222 501) (222 501) (8 958) (97 769) (96 791) 979 -1% (231 646)
NET CASH FROM/(USED) OPERATING ACTIVITIES 4 024 457 5 957 495 5 957 495 1 544 096 1 413 485 3 575 095 2 161 610 60% 6 115 968
CASH FLOWS FROM INVESTING ACTIVITIES
Receipts
Proceeds on disposal of PPE 57 734 33 612 33 612 388 3 986 16 663 (12 676) -76% 14 357
Decrease (Increase) in non-current debtors 2 063 (898) (898) 1 435 (448 778.40) 1 884 -420% (898)
Decrease (increase) other non-current receivables – – – –
Decrease (increase) in non-current investments – – – –
Payments
Capital assets (4 769 706) (6 046 926) (6 046 926) (506 355) (1 996 692) (2 108 544) (111 852) 5% (6 130 628)
NET CASH FROM/(USED) INVESTING ACTIVITIES (4 709 909) (6 014 212) (6 014 212) (505 967) (1 991 271) (2 092 330) (101 059) 5% (6 117 168)
CASH FLOWS FROM FINANCING ACTIVITIES
Receipts
Short term loans – – – –
Borrowing long term/refinancing 1 000 000 1 000 000 1 000 000 – – 1 000 (1 000) -100% 1 000 000
Increase (decrease) in consumer deposits – 81 374 81 374 – (8 530) 40 687 (49 217) -121% 81 374
Payments
Repayment of borrowing (1 007 396) (1 190 563) (1 190 563) (245 321) (481 914) (595 282) (113 368) 19% (1 190 563)
NET CASH FROM/(USED) FINANCING ACTIVITIES (7 396) (109 189) (109 189) (245 321) (490 444) (553 595) (63 151) 11% (109 189)
NET INCREASE/ (DECREASE) IN CASH HELD (692 848) (165 906) (165 906) 792 808 (1 068 230) 929 171 (110 389)
Cash/cash equivalents at beginning: 6 859 657 5 156 692 5 156 692 6 166 809 5 156 692 6 166 809
Cash/cash equivalents at month/year end: 6 166 809 4 990 786 4 990 786 5 098 579 6 085 863 6 056 420
Description Ref
ETH eThekwini - Table C7 Consolidated Monthly Budget Statement - Cash Flow - M06 December
49
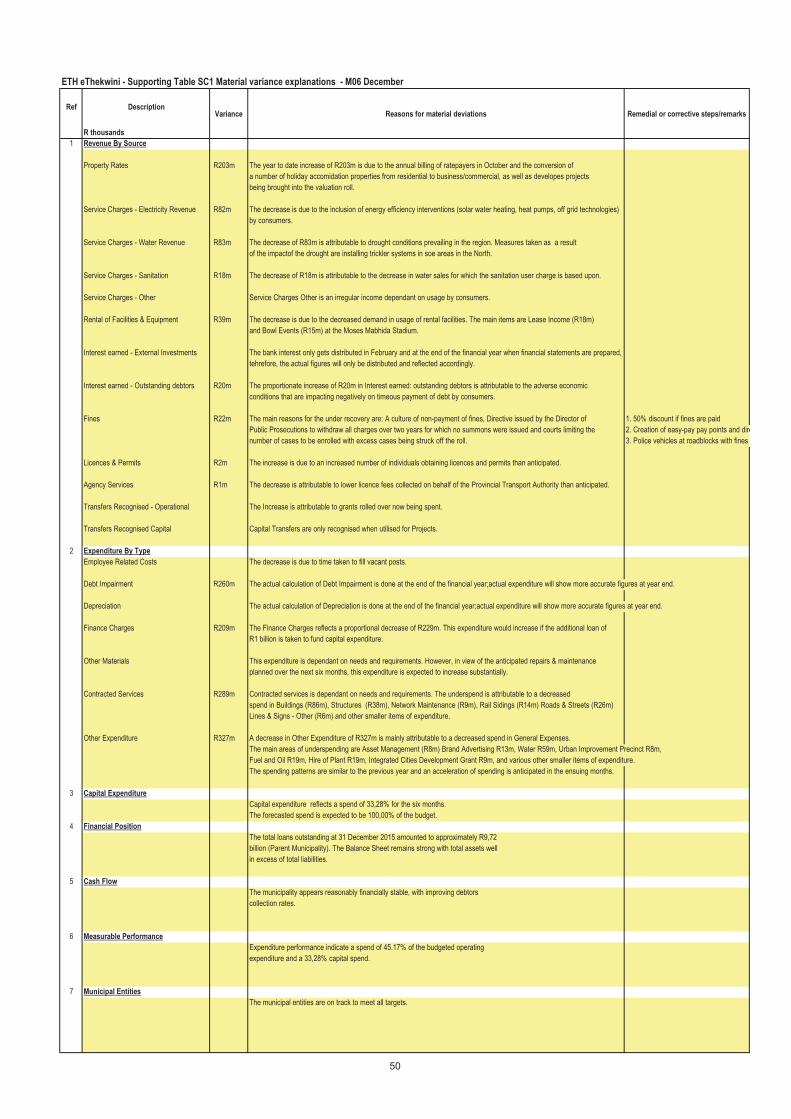
Variance Reasons for material deviations Remedial or corrective steps/remarks
R thousands
1 Revenue By Source
Property Rates R203m The year to date increase of R203m is due to the annual billing of ratepayers in October and the conversion of
a number of holiday accomidation properties from residential to business/commercial, as well as developes projects
being brought into the valuation roll.
Service Charges - Electricity Revenue R82m The decrease is due to the inclusion of energy efficiency interventions (solar water heating, heat pumps, off grid technologies)
by consumers.
Service Charges - Water Revenue R83m The decrease of R83m is attributable to drought conditions prevailing in the region. Measures taken as a result
of the impactof the drought are installing trickler systems in soe areas in the North.
Service Charges - Sanitation R18m The decrease of R18m is attributable to the decrease in water sales for which the sanitation user charge is based upon.
Service Charges - Other Service Charges Other is an irregular income dependant on usage by consumers.
Rental of Facilities & Equipment R39m The decrease is due to the decreased demand in usage of rental facilities. The main items are Lease Income (R18m)
and Bowl Events (R15m) at the Moses Mabhida Stadium.
Interest earned - External Investments The bank interest only gets distributed in February and at the end of the financial year when financial statements are prepared,
tehrefore, the actual figures will only be distributed and reflected accordingly.
Interest earned - Outstanding debtors R20m The proportionate increase of R20m in Interest earned: outstanding debtors is attributable to the adverse economic
conditions that are impacting negatively on timeous payment of debt by consumers.
Fines R22m The main reasons for the under recovery are: A culture of non-payment of fines, Directive issued by the Director of 1. 50% discount if fines are paid
Public Prosecutions to withdraw all charges over two years for which no summons were issued and courts limiting the 2. Creation of easy-pay pay points and direct deposit (EFT)
number of cases to be enrolled with excess cases being struck off the roll. 3. Police vehicles at roadblocks with fines processing systems and credit card facilities.
Licences & Permits R2m The increase is due to an increased number of individuals obtaining licences and permits than anticipated.
Agency Services R1m The decrease is attributable to lower licence fees collected on behalf of the Provincial Transport Authority than anticipated.
Transfers Recognised - Operational The Increase is attributable to grants rolled over now being spent.
Transfers Recognised Capital Capital Transfers are only recognised when utilised for Projects.
2 Expenditure By Type
Employee Related Costs The decrease is due to time taken to fill vacant posts.
Debt Impairment R260m The actual calculation of Debt Impairment is done at the end of the financial year;actual expenditure will show more accurate figures at year end.
Depreciation The actual calculation of Depreciation is done at the end of the financial year;actual expenditure will show more accurate figures at year end.
Finance Charges R209m The Finance Charges reflects a proportional decrease of R229m. This expenditure would increase if the additional loan of
R1 billion is taken to fund capital expenditure.
Other Materials This expenditure is dependant on needs and requirements. However, in view of the anticipated repairs & maintenance
planned over the next six months, this expenditure is expected to increase substantially.
Contracted Services R289m Contracted services is dependant on needs and requirements. The underspend is attributable to a decreased
spend in Buildings (R86m), Structures (R38m), Network Maintenance (R9m), Rail Sidings (R14m) Roads & Streets (R26m)
Lines & Signs - Other (R6m) and other smaller items of expenditure.
Other Expenditure R327m A decrease in Other Expenditure of R327m is mainly attributable to a decreased spend in General Expenses.
The main areas of underspending are Asset Management (R8m) Brand Advertising R13m, Water R59m, Urban Improvement Precinct R8m,
Fuel and Oil R19m, Hire of Plant R19m, Integrated Cities Development Grant R9m, and various other smaller items of expenditure.
The spending patterns are similar to the previous year and an acceleration of spending is anticipated in the ensuing months.
3 Capital Expenditure
Capital expenditure reflects a spend of 33,28% for the six months.
The forecasted spend is expected to be 100,00% of the budget.
4 Financial Position
The total loans outstanding at 31 December 2015 amounted to approximately R9,72
billion (Parent Municipality). The Balance Sheet remains strong with total assets well
in excess of total liabilities.
5 Cash Flow
The municipality appears reasonably financially stable, with improving debtors
collection rates.
6 Measurable Performance
Expenditure performance indicate a spend of 45.17% of the budgeted operating
expenditure and a 33,28% capital spend.
7 Municipal Entities
The municipal entities are on track to meet all targets.
Ref Description
ETH eThekwini - Supporting Table SC1 Material variance explanations - M06 December
50
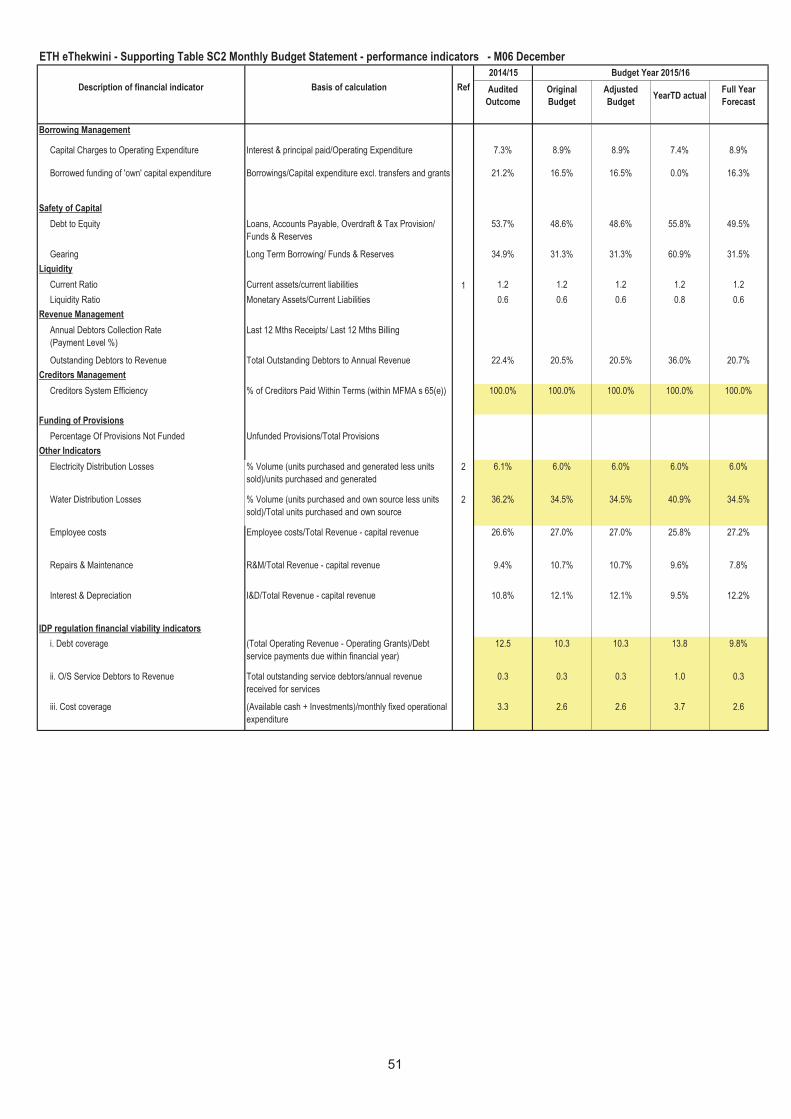
2014/15 Budget Year 2015/16
Audited
Outcome
Original
Budget
Adjusted
BudgetYearTD actual
Full Year
Forecast
Borrowing Management
Capital Charges to Operating Expenditure Interest & principal paid/Operating Expenditure 7.3% 8.9% 8.9% 7.4% 8.9%
Borrowed funding of 'own' capital expenditure Borrowings/Capital expenditure excl. transfers and grants 21.2% 16.5% 16.5% 0.0% 16.3%
Safety of Capital
Debt to Equity Loans, Accounts Payable, Overdraft & Tax Provision/
Funds & Reserves
53.7% 48.6% 48.6% 55.8% 49.5%
Gearing Long Term Borrowing/ Funds & Reserves 34.9% 31.3% 31.3% 60.9% 31.5%
Liquidity
Current Ratio Current assets/current liabilities 1 1.2 1.2 1.2 1.2 1.2
Liquidity Ratio Monetary Assets/Current Liabilities 0.6 0.6 0.6 0.8 0.6
Revenue Management
Annual Debtors Collection Rate
(Payment Level %)
Last 12 Mths Receipts/ Last 12 Mths Billing
Outstanding Debtors to Revenue Total Outstanding Debtors to Annual Revenue 22.4% 20.5% 20.5% 36.0% 20.7%
Creditors Management
Creditors System Efficiency % of Creditors Paid Within Terms (within MFMA s 65(e)) 100.0% 100.0% 100.0% 100.0% 100.0%
Funding of Provisions
Percentage Of Provisions Not Funded Unfunded Provisions/Total Provisions
Other Indicators
Electricity Distribution Losses % Volume (units purchased and generated less units
sold)/units purchased and generated
2 6.1% 6.0% 6.0% 6.0% 6.0%
Water Distribution Losses % Volume (units purchased and own source less units
sold)/Total units purchased and own source
2 36.2% 34.5% 34.5% 40.9% 34.5%
Employee costs Employee costs/Total Revenue - capital revenue 26.6% 27.0% 27.0% 25.8% 27.2%
Repairs & Maintenance R&M/Total Revenue - capital revenue 9.4% 10.7% 10.7% 9.6% 7.8%
Interest & Depreciation I&D/Total Revenue - capital revenue 10.8% 12.1% 12.1% 9.5% 12.2%
IDP regulation financial viability indicators
i. Debt coverage (Total Operating Revenue - Operating Grants)/Debt
service payments due within financial year)
12.5 10.3 10.3 13.8 9.8%
ii. O/S Service Debtors to Revenue Total outstanding service debtors/annual revenue
received for services
0.3 0.3 0.3 1.0 0.3
iii. Cost coverage (Available cash + Investments)/monthly fixed operational
expenditure
3.3 2.6 2.6 3.7 2.6
Description of financial indicator Basis of calculation Ref
ETH eThekwini - Supporting Table SC2 Monthly Budget Statement - performance indicators - M06 December
51
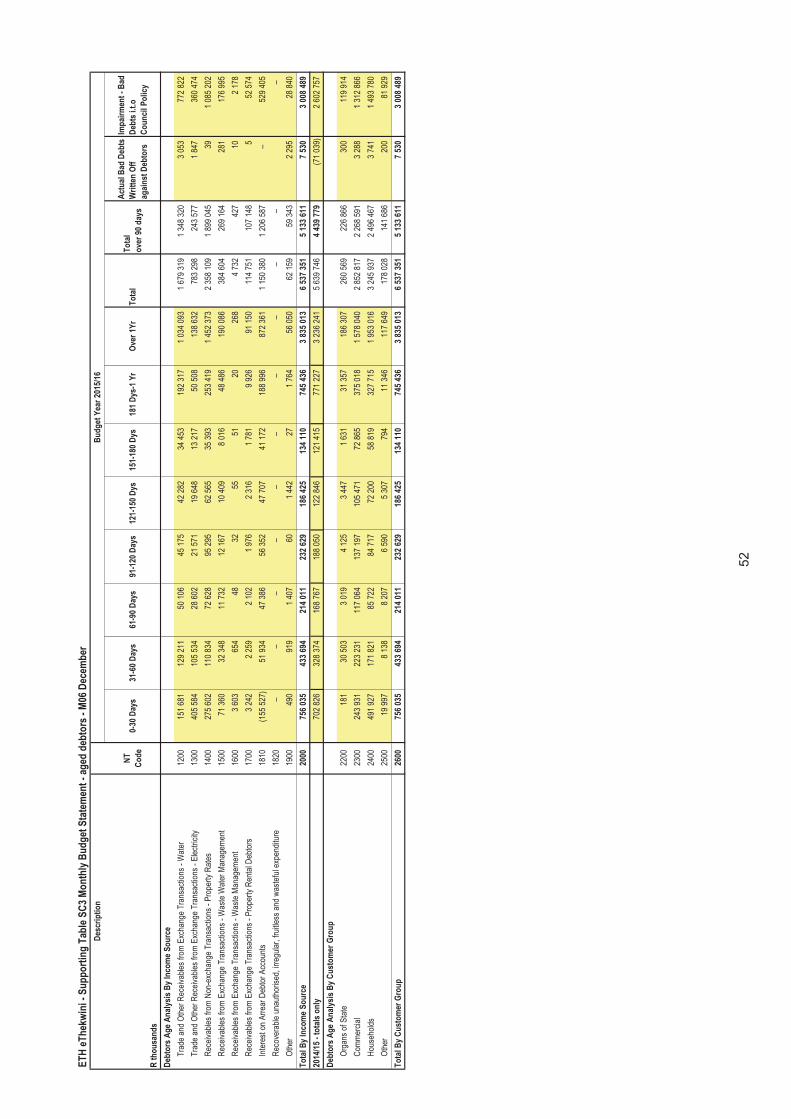
Des
crip
tio
n
R t
ho
usa
nd
s
NT
Co
de
0-30
Day
s31
-60
Day
s61
-90
Day
s91
-120
Day
s12
1-15
0 D
ys15
1-18
0 D
ys18
1 D
ys-1
Yr
Ove
r 1Y
rT
ota
lT
ota
l
ove
r 90
day
s
Act
ual
Bad
Deb
ts
Wri
tten
Off
agai
nst
Deb
tors
Imp
airm
ent
- B
ad
Deb
ts i.
t.o
Co
un
cil
Po
licy
Deb
tors
Ag
e A
nal
ysis
By
Inco
me
So
urc
e
Tra
de a
nd O
ther
Rec
eiva
bles
fro
m E
xcha
nge
Tra
nsac
tions
- W
ater
1200
151
681
12
9 21
1
50 1
06
45
175
42 2
82
34
453
192
317
1 03
4 09
3
1 67
9 31
9
1
348
320
3 05
3
77
2 82
2
Tra
de a
nd O
ther
Rec
eiva
bles
fro
m E
xcha
nge
Tra
nsac
tions
- E
lect
ricity
1300
405
584
10
5 53
4
28 6
02
21
571
19 6
48
13
217
50 5
08
138
632
783
298
24
3 57
7
1 84
7
36
0 47
4
Rec
eiva
bles
fro
m N
on-e
xcha
nge
Tra
nsac
tions
- P
rope
rty
Rat
es14
0027
5 60
2
110
834
72
628
95 2
95
62
565
35 3
93
25
3 41
9
1
452
373
2
358
109
1 89
9 04
5
39
1 08
5 20
2
Rec
eiva
bles
fro
m E
xcha
nge
Tra
nsac
tions
- W
aste
Wat
er M
anag
emen
t15
0071
360
32 3
48
11
732
12 1
67
10
409
8 01
6
48 4
86
190
086
384
604
26
9 16
4
281
17
6 99
5
Rec
eiva
bles
fro
m E
xcha
nge
Tra
nsac
tions
- W
aste
Man
agem
ent
1600
3 60
3
654
48
32
55
51
20
26
8
4
732
42
7
10
2
178
Rec
eiva
bles
fro
m E
xcha
nge
Tra
nsac
tions
- P
rope
rty
Ren
tal D
ebto
rs17
003
242
2
259
2
102
1
976
2
316
1
781
9
926
91 1
50
114
751
10
7 14
8
5
52 5
74
Inte
rest
on
Arr
ear
Deb
tor
Acc
ount
s18
10(1
55 5
27)
51
934
47 3
86
56
352
47 7
07
41
172
188
996
872
361
1 15
0 38
0
1
206
587
–
52
9 40
5
Rec
over
able
una
utho
rised
, irr
egul
ar,
frui
tless
and
was
tefu
l exp
endi
ture
1820
–
–
–
–
–
–
–
–
–
–
–
Oth
er19
0049
0
919
1
407
60
1
442
27
1
764
56 0
50
62 1
59
59
343
2 29
5
28
840
To
tal B
y In
com
e S
ou
rce
2000
756
035
43
3 69
4
214
011
23
2 62
9
186
425
13
4 11
0
745
436
3 83
5 01
3
6 53
7 35
1
5
133
611
7 53
0
3
008
489
2014
/15
- to
tals
on
ly70
2 82
6
328
374
16
8 76
7
188
050
12
2 84
6
121
415
77
1 22
7
3
236
241
5
639
746
4 43
9 77
9
(7
1 03
9)
2
602
757
Deb
tors
Ag
e A
nal
ysis
By
Cu
sto
mer
Gro
up
Org
ans
of S
tate
2200
181
30
503
3 01
9
4 12
5
3 44
7
1 63
1
31 3
57
186
307
260
569
22
6 86
6
300
11
9 91
4
Com
mer
cial
2300
243
931
22
3 23
1
117
064
13
7 19
7
105
471
72
865
375
018
1 57
8 04
0
2 85
2 81
7
2
268
591
3 28
8
1
312
866
Hou
seho
lds
2400
491
927
17
1 82
1
85 7
22
84
717
72 2
00
58
819
327
715
1 95
3 01
6
3 24
5 93
7
2
496
467
3 74
1
1
493
780
Oth
er25
0019
997
8 13
8
8 20
7
6 59
0
5 30
7
794
11
346
11
7 64
9
17
8 02
8
141
686
20
0
81 9
29
To
tal B
y C
ust
om
er G
rou
p26
0075
6 03
5
433
694
21
4 01
1
232
629
18
6 42
5
134
110
74
5 43
6
3
835
013
6
537
351
5 13
3 61
1
7
530
3 00
8 48
9
ET
H e
Th
ekw
ini -
Su
pp
ort
ing
Tab
le S
C3
Mo
nth
ly B
ud
get
Sta
tem
ent
- ag
ed d
ebto
rs -
M06
Dec
emb
er
Bu
dg
et Y
ear
2015
/16
52
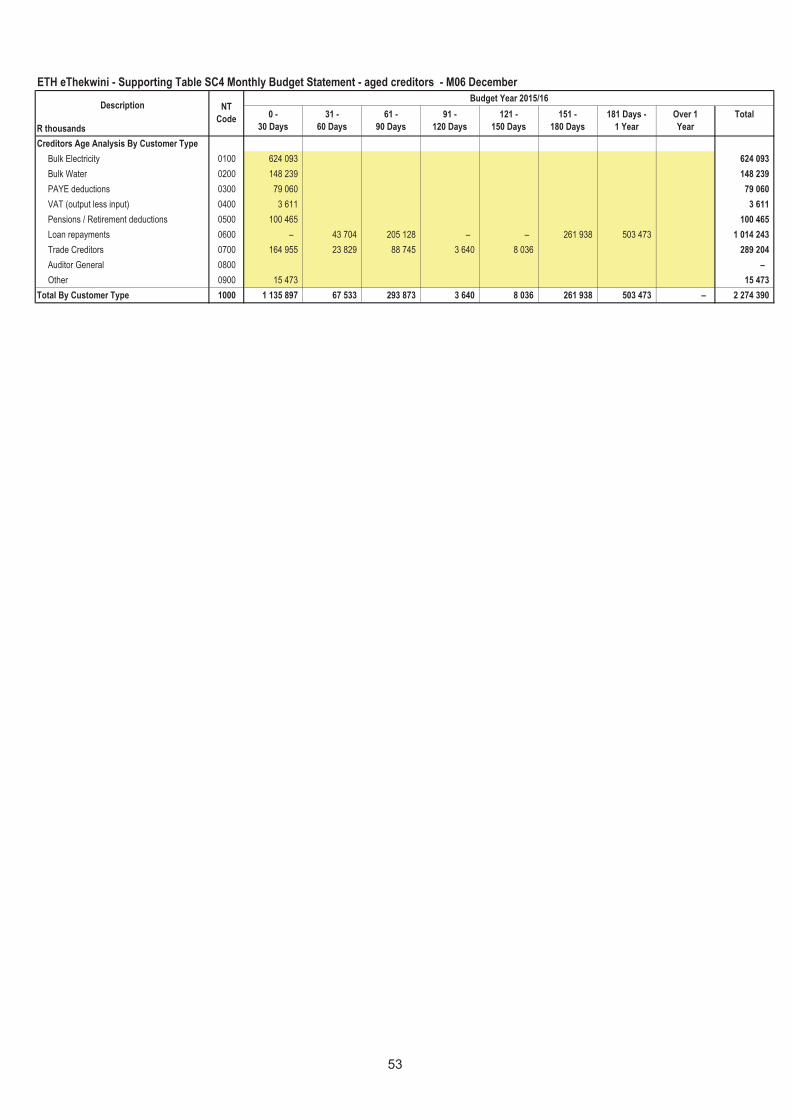
Budget Year 2015/16
R thousands
Creditors Age Analysis By Customer Type
Bulk Electricity 0100 624 093 624 093
Bulk Water 0200 148 239 148 239
PAYE deductions 0300 79 060 79 060
VAT (output less input) 0400 3 611 3 611
Pensions / Retirement deductions 0500 100 465 100 465
Loan repayments 0600 – 43 704 205 128 – – 261 938 503 473 1 014 243
Trade Creditors 0700 164 955 23 829 88 745 3 640 8 036 289 204
Auditor General 0800 –
Other 0900 15 473 15 473
Total By Customer Type 1000 1 135 897 67 533 293 873 3 640 8 036 261 938 503 473 – 2 274 390
NT
Code0 -
30 Days
31 -
60 Days
ETH eThekwini - Supporting Table SC4 Monthly Budget Statement - aged creditors - M06 December
181 Days -
1 Year
Over 1
Year
Total61 -
90 Days
91 -
120 Days
121 -
150 Days
151 -
180 Days
Description
53
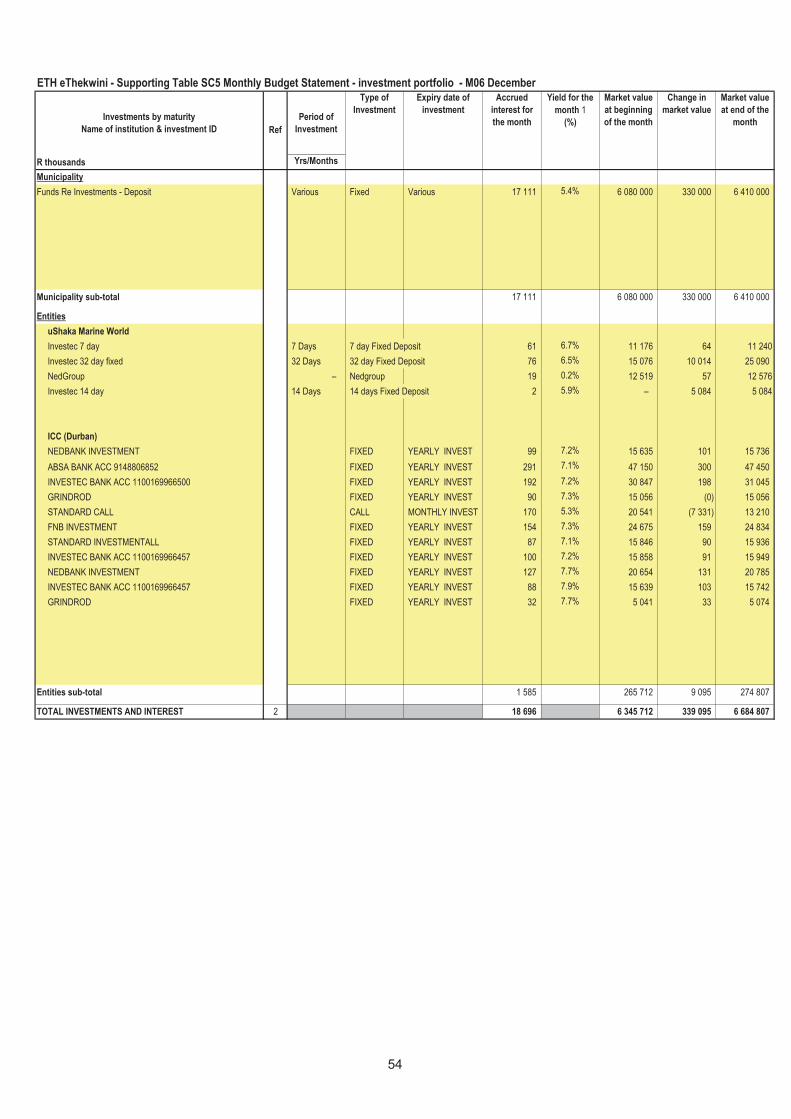
Investments by maturity
Name of institution & investment ID
Period of
Investment
R thousands Yrs/Months
Municipality
Funds Re Investments - Deposit Various Fixed Various 17 111 5.4% 6 080 000 330 000 6 410 000
Municipality sub-total 17 111 6 080 000 330 000 6 410 000
Entities
uShaka Marine World
Investec 7 day 7 Days 7 day Fixed Deposit 61 6.7% 11 176 64 11 240
Investec 32 day fixed 32 Days 32 day Fixed Deposit 76 6.5% 15 076 10 014 25 090
NedGroup – Nedgroup 19 0.2% 12 519 57 12 576
Investec 14 day 14 Days 14 days Fixed Deposit 2 5.9% – 5 084 5 084
ICC (Durban)
NEDBANK INVESTMENT FIXED YEARLY INVEST 99 7.2% 15 635 101 15 736
ABSA BANK ACC 9148806852 FIXED YEARLY INVEST 291 7.1% 47 150 300 47 450
INVESTEC BANK ACC 1100169966500 FIXED YEARLY INVEST 192 7.2% 30 847 198 31 045
GRINDROD FIXED YEARLY INVEST 90 7.3% 15 056 (0) 15 056
STANDARD CALL CALL MONTHLY INVEST 170 5.3% 20 541 (7 331) 13 210
FNB INVESTMENT FIXED YEARLY INVEST 154 7.3% 24 675 159 24 834
STANDARD INVESTMENTALL FIXED YEARLY INVEST 87 7.1% 15 846 90 15 936
INVESTEC BANK ACC 1100169966457 FIXED YEARLY INVEST 100 7.2% 15 858 91 15 949
NEDBANK INVESTMENT FIXED YEARLY INVEST 127 7.7% 20 654 131 20 785
INVESTEC BANK ACC 1100169966457 FIXED YEARLY INVEST 88 7.9% 15 639 103 15 742
GRINDROD FIXED YEARLY INVEST 32 7.7% 5 041 33 5 074
Entities sub-total 1 585 265 712 9 095 274 807
TOTAL INVESTMENTS AND INTEREST 2 18 696 6 345 712 339 095 6 684 807
ETH eThekwini - Supporting Table SC5 Monthly Budget Statement - investment portfolio - M06 December
Ref
Type of
Investment
Expiry date of
investment
Market value
at end of the
month
Accrued
interest for
the month
Yield for the
month 1
(%)
Market value
at beginning
of the month
Change in
market value
54
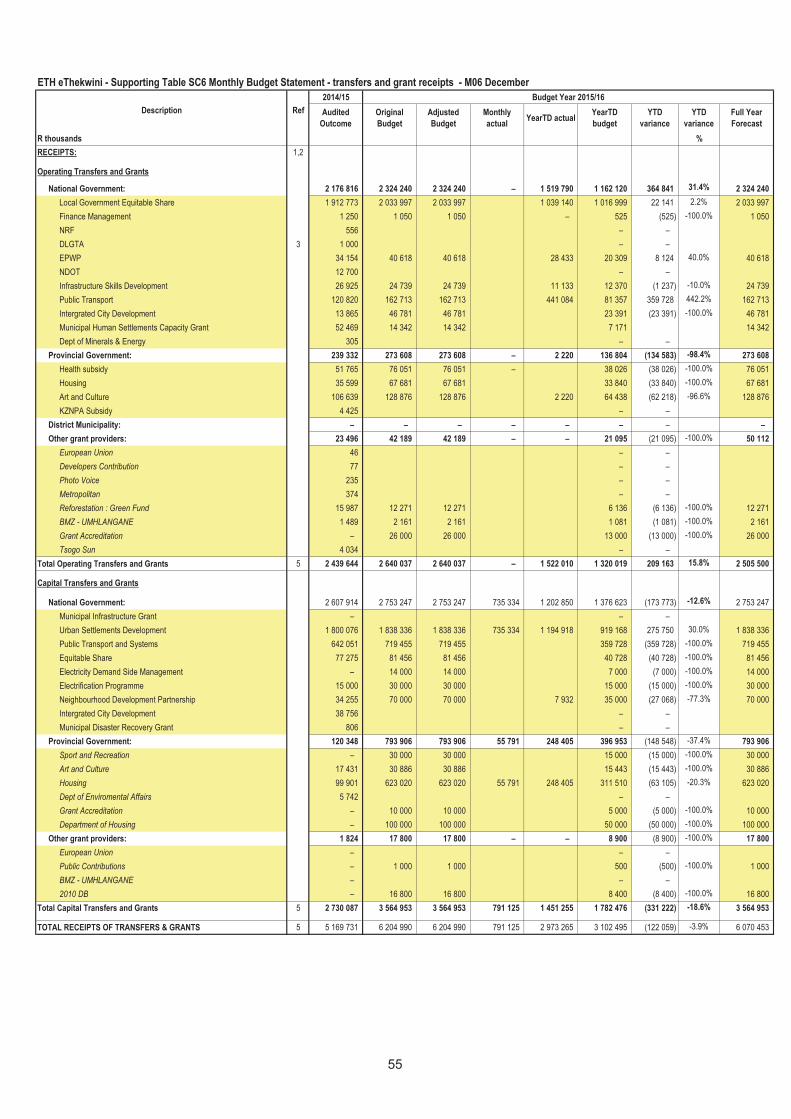
2014/15 Budget Year 2015/16
Audited
Outcome
Original
Budget
Adjusted
Budget
Monthly
actualYearTD actual
YearTD
budget
YTD
variance
YTD
variance
Full Year
Forecast
R thousands %
RECEIPTS: 1,2
Operating Transfers and Grants
National Government: 2 176 816 2 324 240 2 324 240 – 1 519 790 1 162 120 364 841 31.4% 2 324 240
Local Government Equitable Share 1 912 773 2 033 997 2 033 997 1 039 140 1 016 999 22 141 2.2% 2 033 997
Finance Management 1 250 1 050 1 050 – 525 (525) -100.0% 1 050
NRF 556 – –
DLGTA 3 1 000 – –
EPWP 34 154 40 618 40 618 28 433 20 309 8 124 40.0% 40 618
NDOT 12 700 – –
Infrastructure Skills Development 26 925 24 739 24 739 11 133 12 370 (1 237) -10.0% 24 739
Public Transport 120 820 162 713 162 713 441 084 81 357 359 728 442.2% 162 713
Intergrated City Development 13 865 46 781 46 781 23 391 (23 391) -100.0% 46 781
Municipal Human Settlements Capacity Grant 52 469 14 342 14 342 7 171 14 342
Dept of Minerals & Energy 305 – –
Provincial Government: 239 332 273 608 273 608 – 2 220 136 804 (134 583) -98.4% 273 608
Health subsidy 51 765 76 051 76 051 – 38 026 (38 026) -100.0% 76 051
Housing 35 599 67 681 67 681 33 840 (33 840) -100.0% 67 681
Art and Culture 106 639 128 876 128 876 2 220 64 438 (62 218) -96.6% 128 876
KZNPA Subsidy 4 425 – –
District Municipality: – – – – – – – –
Other grant providers: 23 496 42 189 42 189 – – 21 095 (21 095) -100.0% 50 112
European Union 46 – –
Developers Contribution 77 – –
Photo Voice 235 – –
Metropolitan 374 – –
Reforestation : Green Fund 15 987 12 271 12 271 6 136 (6 136) -100.0% 12 271
BMZ - UMHLANGANE 1 489 2 161 2 161 1 081 (1 081) -100.0% 2 161
Grant Accreditation – 26 000 26 000 13 000 (13 000) -100.0% 26 000
Tsogo Sun 4 034 – –
Total Operating Transfers and Grants 5 2 439 644 2 640 037 2 640 037 – 1 522 010 1 320 019 209 163 15.8% 2 505 500
Capital Transfers and Grants
National Government: 2 607 914 2 753 247 2 753 247 735 334 1 202 850 1 376 623 (173 773) -12.6% 2 753 247
Municipal Infrastructure Grant – – –
Urban Settlements Development 1 800 076 1 838 336 1 838 336 735 334 1 194 918 919 168 275 750 30.0% 1 838 336
Public Transport and Systems 642 051 719 455 719 455 359 728 (359 728) -100.0% 719 455
Equitable Share 77 275 81 456 81 456 40 728 (40 728) -100.0% 81 456
Electricity Demand Side Management – 14 000 14 000 7 000 (7 000) -100.0% 14 000
Electrification Programme 15 000 30 000 30 000 15 000 (15 000) -100.0% 30 000
Neighbourhood Development Partnership 34 255 70 000 70 000 7 932 35 000 (27 068) -77.3% 70 000
Intergrated City Development 38 756 – –
Municipal Disaster Recovery Grant 806 – –
Provincial Government: 120 348 793 906 793 906 55 791 248 405 396 953 (148 548) -37.4% 793 906
Sport and Recreation – 30 000 30 000 15 000 (15 000) -100.0% 30 000
Art and Culture 17 431 30 886 30 886 15 443 (15 443) -100.0% 30 886
Housing 99 901 623 020 623 020 55 791 248 405 311 510 (63 105) -20.3% 623 020
Dept of Enviromental Affairs 5 742 – –
Grant Accreditation – 10 000 10 000 5 000 (5 000) -100.0% 10 000
Department of Housing – 100 000 100 000 50 000 (50 000) -100.0% 100 000
Other grant providers: 1 824 17 800 17 800 – – 8 900 (8 900) -100.0% 17 800
European Union – – –
Public Contributions – 1 000 1 000 500 (500) -100.0% 1 000
BMZ - UMHLANGANE – – –
2010 DB – 16 800 16 800 8 400 (8 400) -100.0% 16 800
Total Capital Transfers and Grants 5 2 730 087 3 564 953 3 564 953 791 125 1 451 255 1 782 476 (331 222) -18.6% 3 564 953
TOTAL RECEIPTS OF TRANSFERS & GRANTS 5 5 169 731 6 204 990 6 204 990 791 125 2 973 265 3 102 495 (122 059) -3.9% 6 070 453
Description Ref
ETH eThekwini - Supporting Table SC6 Monthly Budget Statement - transfers and grant receipts - M06 December
55
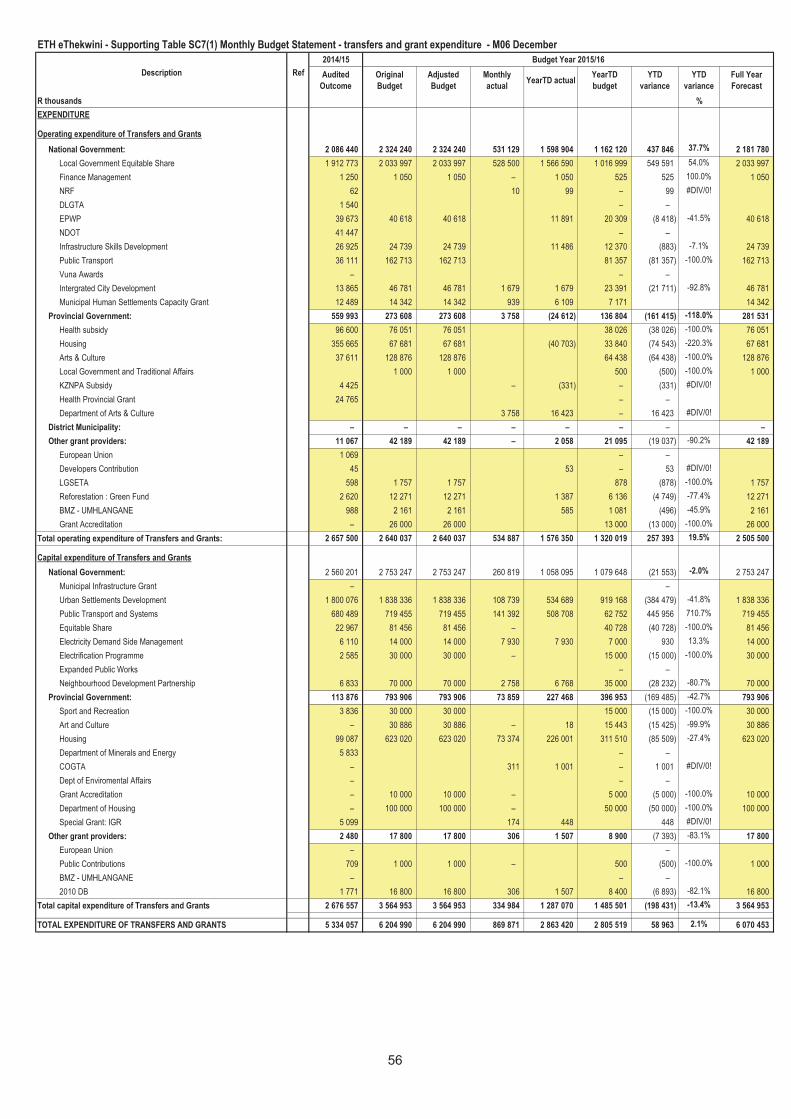
2014/15 Budget Year 2015/16
Audited
Outcome
Original
Budget
Adjusted
Budget
Monthly
actualYearTD actual
YearTD
budget
YTD
variance
YTD
variance
Full Year
Forecast
R thousands %
EXPENDITURE
Operating expenditure of Transfers and Grants
National Government: 2 086 440 2 324 240 2 324 240 531 129 1 598 904 1 162 120 437 846 37.7% 2 181 780
Local Government Equitable Share 1 912 773 2 033 997 2 033 997 528 500 1 566 590 1 016 999 549 591 54.0% 2 033 997
Finance Management 1 250 1 050 1 050 – 1 050 525 525 100.0% 1 050
NRF 62 10 99 – 99 #DIV/0!
DLGTA 1 540 – –
EPWP 39 673 40 618 40 618 11 891 20 309 (8 418) -41.5% 40 618
NDOT 41 447 – –
Infrastructure Skills Development 26 925 24 739 24 739 11 486 12 370 (883) -7.1% 24 739
Public Transport 36 111 162 713 162 713 81 357 (81 357) -100.0% 162 713
Vuna Awards – – –
Intergrated City Development 13 865 46 781 46 781 1 679 1 679 23 391 (21 711) -92.8% 46 781
Municipal Human Settlements Capacity Grant 12 489 14 342 14 342 939 6 109 7 171 14 342
Provincial Government: 559 993 273 608 273 608 3 758 (24 612) 136 804 (161 415) -118.0% 281 531
Health subsidy 96 600 76 051 76 051 38 026 (38 026) -100.0% 76 051
Housing 355 665 67 681 67 681 (40 703) 33 840 (74 543) -220.3% 67 681
Arts & Culture 37 611 128 876 128 876 64 438 (64 438) -100.0% 128 876
Local Government and Traditional Affairs 1 000 1 000 500 (500) -100.0% 1 000
KZNPA Subsidy 4 425 – (331) – (331) #DIV/0!
Health Provincial Grant 24 765 – –
Department of Arts & Culture 3 758 16 423 – 16 423 #DIV/0!
District Municipality: – – – – – – – –
Other grant providers: 11 067 42 189 42 189 – 2 058 21 095 (19 037) -90.2% 42 189
European Union 1 069 – –
Developers Contribution 45 53 – 53 #DIV/0!
LGSETA 598 1 757 1 757 878 (878) -100.0% 1 757
Reforestation : Green Fund 2 620 12 271 12 271 1 387 6 136 (4 749) -77.4% 12 271
BMZ - UMHLANGANE 988 2 161 2 161 585 1 081 (496) -45.9% 2 161
Grant Accreditation – 26 000 26 000 13 000 (13 000) -100.0% 26 000
Total operating expenditure of Transfers and Grants: 2 657 500 2 640 037 2 640 037 534 887 1 576 350 1 320 019 257 393 19.5% 2 505 500
Capital expenditure of Transfers and Grants
National Government: 2 560 201 2 753 247 2 753 247 260 819 1 058 095 1 079 648 (21 553) -2.0% 2 753 247
Municipal Infrastructure Grant – –
Urban Settlements Development 1 800 076 1 838 336 1 838 336 108 739 534 689 919 168 (384 479) -41.8% 1 838 336
Public Transport and Systems 680 489 719 455 719 455 141 392 508 708 62 752 445 956 710.7% 719 455
Equitable Share 22 967 81 456 81 456 – 40 728 (40 728) -100.0% 81 456
Electricity Demand Side Management 6 110 14 000 14 000 7 930 7 930 7 000 930 13.3% 14 000
Electrification Programme 2 585 30 000 30 000 – 15 000 (15 000) -100.0% 30 000
Expanded Public Works – –
Neighbourhood Development Partnership 6 833 70 000 70 000 2 758 6 768 35 000 (28 232) -80.7% 70 000
Provincial Government: 113 876 793 906 793 906 73 859 227 468 396 953 (169 485) -42.7% 793 906
Sport and Recreation 3 836 30 000 30 000 15 000 (15 000) -100.0% 30 000
Art and Culture – 30 886 30 886 – 18 15 443 (15 425) -99.9% 30 886
Housing 99 087 623 020 623 020 73 374 226 001 311 510 (85 509) -27.4% 623 020
Department of Minerals and Energy 5 833 – –
COGTA – 311 1 001 – 1 001 #DIV/0!
Dept of Enviromental Affairs – – –
Grant Accreditation – 10 000 10 000 – 5 000 (5 000) -100.0% 10 000
Department of Housing – 100 000 100 000 – 50 000 (50 000) -100.0% 100 000
Special Grant: IGR 5 099 174 448 448 #DIV/0!
Other grant providers: 2 480 17 800 17 800 306 1 507 8 900 (7 393) -83.1% 17 800
European Union – –
Public Contributions 709 1 000 1 000 – 500 (500) -100.0% 1 000
BMZ - UMHLANGANE – – –
2010 DB 1 771 16 800 16 800 306 1 507 8 400 (6 893) -82.1% 16 800
Total capital expenditure of Transfers and Grants 2 676 557 3 564 953 3 564 953 334 984 1 287 070 1 485 501 (198 431) -13.4% 3 564 953
TOTAL EXPENDITURE OF TRANSFERS AND GRANTS 5 334 057 6 204 990 6 204 990 869 871 2 863 420 2 805 519 58 963 2.1% 6 070 453
Description Ref
ETH eThekwini - Supporting Table SC7(1) Monthly Budget Statement - transfers and grant expenditure - M06 December
56
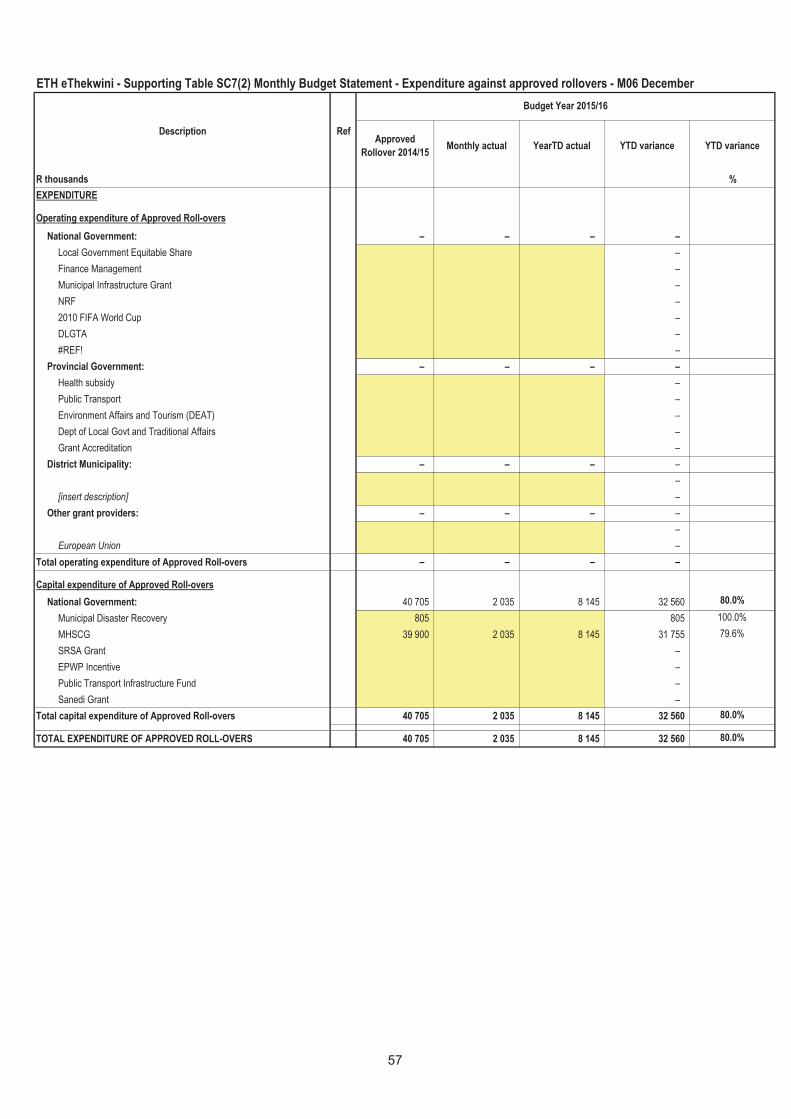
Approved
Rollover 2014/15Monthly actual YearTD actual YTD variance YTD variance
R thousands %
EXPENDITURE
Operating expenditure of Approved Roll-overs
National Government: – – – –
Local Government Equitable Share –
Finance Management –
Municipal Infrastructure Grant –
NRF –
2010 FIFA World Cup –
DLGTA –
#REF! –
Provincial Government: – – – –
Health subsidy –
Public Transport –
Environment Affairs and Tourism (DEAT) –
Dept of Local Govt and Traditional Affairs –
Grant Accreditation –
District Municipality: – – – –
–
[insert description] –
Other grant providers: – – – –
–
European Union –
Total operating expenditure of Approved Roll-overs – – – –
Capital expenditure of Approved Roll-overs
National Government: 40 705 2 035 8 145 32 560 80.0%
Municipal Disaster Recovery 805 805 100.0%
MHSCG 39 900 2 035 8 145 31 755 79.6%
SRSA Grant –
EPWP Incentive –
Public Transport Infrastructure Fund –
Sanedi Grant –
Total capital expenditure of Approved Roll-overs 40 705 2 035 8 145 32 560 80.0%
TOTAL EXPENDITURE OF APPROVED ROLL-OVERS 40 705 2 035 8 145 32 560 80.0%
ETH eThekwini - Supporting Table SC7(2) Monthly Budget Statement - Expenditure against approved rollovers - M06 December
Description Ref
Budget Year 2015/16
57
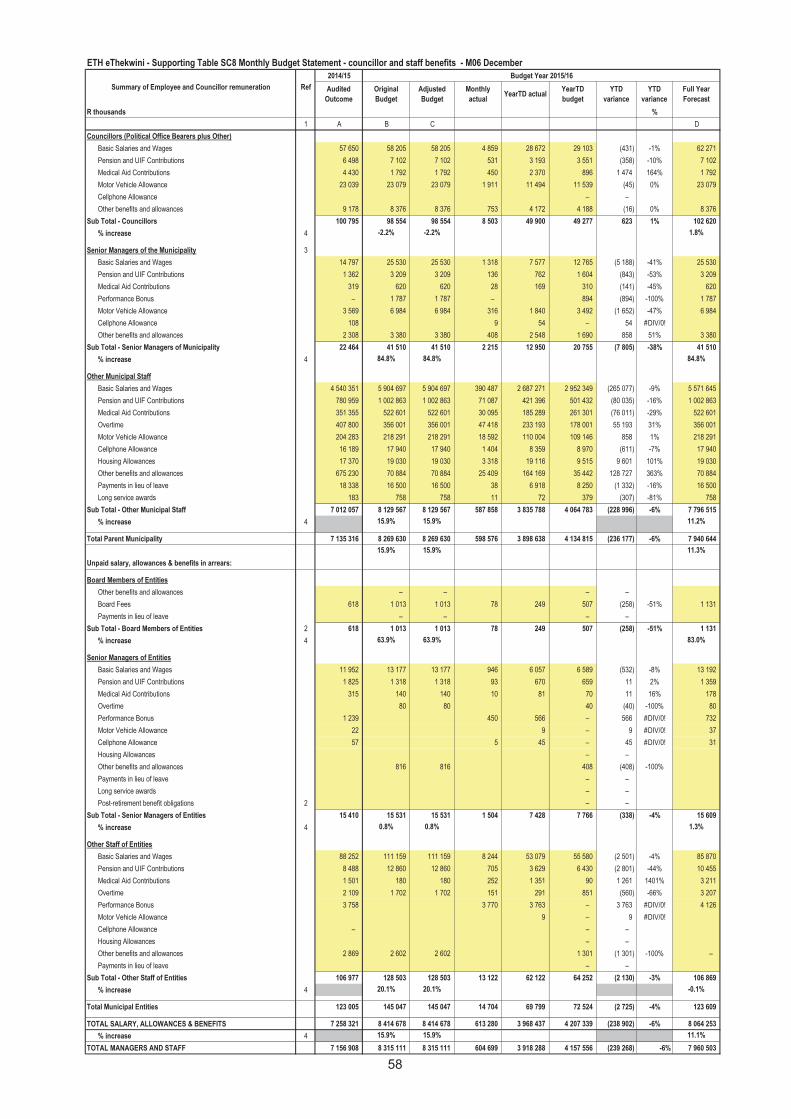
2014/15 Budget Year 2015/16
Audited
Outcome
Original
Budget
Adjusted
Budget
Monthly
actualYearTD actual
YearTD
budget
YTD
variance
YTD
variance
Full Year
Forecast
R thousands %
1 A B C D
Councillors (Political Office Bearers plus Other)
Basic Salaries and Wages 57 650 58 205 58 205 4 859 28 672 29 103 (431) -1% 62 271
Pension and UIF Contributions 6 498 7 102 7 102 531 3 193 3 551 (358) -10% 7 102
Medical Aid Contributions 4 430 1 792 1 792 450 2 370 896 1 474 164% 1 792
Motor Vehicle Allowance 23 039 23 079 23 079 1 911 11 494 11 539 (45) 0% 23 079
Cellphone Allowance – –
Other benefits and allowances 9 178 8 376 8 376 753 4 172 4 188 (16) 0% 8 376
Sub Total - Councillors 100 795 98 554 98 554 8 503 49 900 49 277 623 1% 102 620
% increase 4 -2.2% -2.2% 1.8%
Senior Managers of the Municipality 3
Basic Salaries and Wages 14 797 25 530 25 530 1 318 7 577 12 765 (5 188) -41% 25 530
Pension and UIF Contributions 1 362 3 209 3 209 136 762 1 604 (843) -53% 3 209
Medical Aid Contributions 319 620 620 28 169 310 (141) -45% 620
Performance Bonus – 1 787 1 787 – 894 (894) -100% 1 787
Motor Vehicle Allowance 3 569 6 984 6 984 316 1 840 3 492 (1 652) -47% 6 984
Cellphone Allowance 108 9 54 – 54 #DIV/0!
Other benefits and allowances 2 308 3 380 3 380 408 2 548 1 690 858 51% 3 380
Sub Total - Senior Managers of Municipality 22 464 41 510 41 510 2 215 12 950 20 755 (7 805) -38% 41 510
% increase 4 84.8% 84.8% 84.8%
Other Municipal Staff
Basic Salaries and Wages 4 540 351 5 904 697 5 904 697 390 487 2 687 271 2 952 349 (265 077) -9% 5 571 645
Pension and UIF Contributions 780 959 1 002 863 1 002 863 71 087 421 396 501 432 (80 035) -16% 1 002 863
Medical Aid Contributions 351 355 522 601 522 601 30 095 185 289 261 301 (76 011) -29% 522 601
Overtime 407 800 356 001 356 001 47 418 233 193 178 001 55 193 31% 356 001
Motor Vehicle Allowance 204 283 218 291 218 291 18 592 110 004 109 146 858 1% 218 291
Cellphone Allowance 16 189 17 940 17 940 1 404 8 359 8 970 (611) -7% 17 940
Housing Allowances 17 370 19 030 19 030 3 318 19 116 9 515 9 601 101% 19 030
Other benefits and allowances 675 230 70 884 70 884 25 409 164 169 35 442 128 727 363% 70 884
Payments in lieu of leave 18 338 16 500 16 500 38 6 918 8 250 (1 332) -16% 16 500
Long service awards 183 758 758 11 72 379 (307) -81% 758
Sub Total - Other Municipal Staff 7 012 057 8 129 567 8 129 567 587 858 3 835 788 4 064 783 (228 996) -6% 7 796 515
% increase 4 15.9% 15.9% 11.2%
Total Parent Municipality 7 135 316 8 269 630 8 269 630 598 576 3 898 638 4 134 815 (236 177) -6% 7 940 644
15.9% 15.9% 11.3%
Unpaid salary, allowances & benefits in arrears:
Board Members of Entities
Other benefits and allowances – – – –
Board Fees 618 1 013 1 013 78 249 507 (258) -51% 1 131
Payments in lieu of leave – – – –
Sub Total - Board Members of Entities 2 618 1 013 1 013 78 249 507 (258) -51% 1 131
% increase 4 63.9% 63.9% 83.0%
Senior Managers of Entities
Basic Salaries and Wages 11 952 13 177 13 177 946 6 057 6 589 (532) -8% 13 192
Pension and UIF Contributions 1 825 1 318 1 318 93 670 659 11 2% 1 359
Medical Aid Contributions 315 140 140 10 81 70 11 16% 178
Overtime 80 80 40 (40) -100% 80
Performance Bonus 1 239 450 566 – 566 #DIV/0! 732
Motor Vehicle Allowance 22 9 – 9 #DIV/0! 37
Cellphone Allowance 57 5 45 – 45 #DIV/0! 31
Housing Allowances – –
Other benefits and allowances 816 816 408 (408) -100%
Payments in lieu of leave – –
Long service awards – –
Post-retirement benefit obligations 2 – –
Sub Total - Senior Managers of Entities 15 410 15 531 15 531 1 504 7 428 7 766 (338) -4% 15 609
% increase 4 0.8% 0.8% 1.3%
Other Staff of Entities
Basic Salaries and Wages 88 252 111 159 111 159 8 244 53 079 55 580 (2 501) -4% 85 870
Pension and UIF Contributions 8 488 12 860 12 860 705 3 629 6 430 (2 801) -44% 10 455
Medical Aid Contributions 1 501 180 180 252 1 351 90 1 261 1401% 3 211
Overtime 2 109 1 702 1 702 151 291 851 (560) -66% 3 207
Performance Bonus 3 758 3 770 3 763 – 3 763 #DIV/0! 4 126
Motor Vehicle Allowance 9 – 9 #DIV/0!
Cellphone Allowance – – –
Housing Allowances – –
Other benefits and allowances 2 869 2 602 2 602 1 301 (1 301) -100% –
Payments in lieu of leave – –
Sub Total - Other Staff of Entities 106 977 128 503 128 503 13 122 62 122 64 252 (2 130) -3% 106 869
% increase 4 20.1% 20.1% -0.1%
Total Municipal Entities 123 005 145 047 145 047 14 704 69 799 72 524 (2 725) -4% 123 609
TOTAL SALARY, ALLOWANCES & BENEFITS 7 258 321 8 414 678 8 414 678 613 280 3 968 437 4 207 339 (238 902) -6% 8 064 253
% increase 4 15.9% 15.9% 11.1%
TOTAL MANAGERS AND STAFF 7 156 908 8 315 111 8 315 111 604 699 3 918 288 4 157 556 (239 268) -6% 7 960 503
Summary of Employee and Councillor remuneration Ref
ETH eThekwini - Supporting Table SC8 Monthly Budget Statement - councillor and staff benefits - M06 December
58
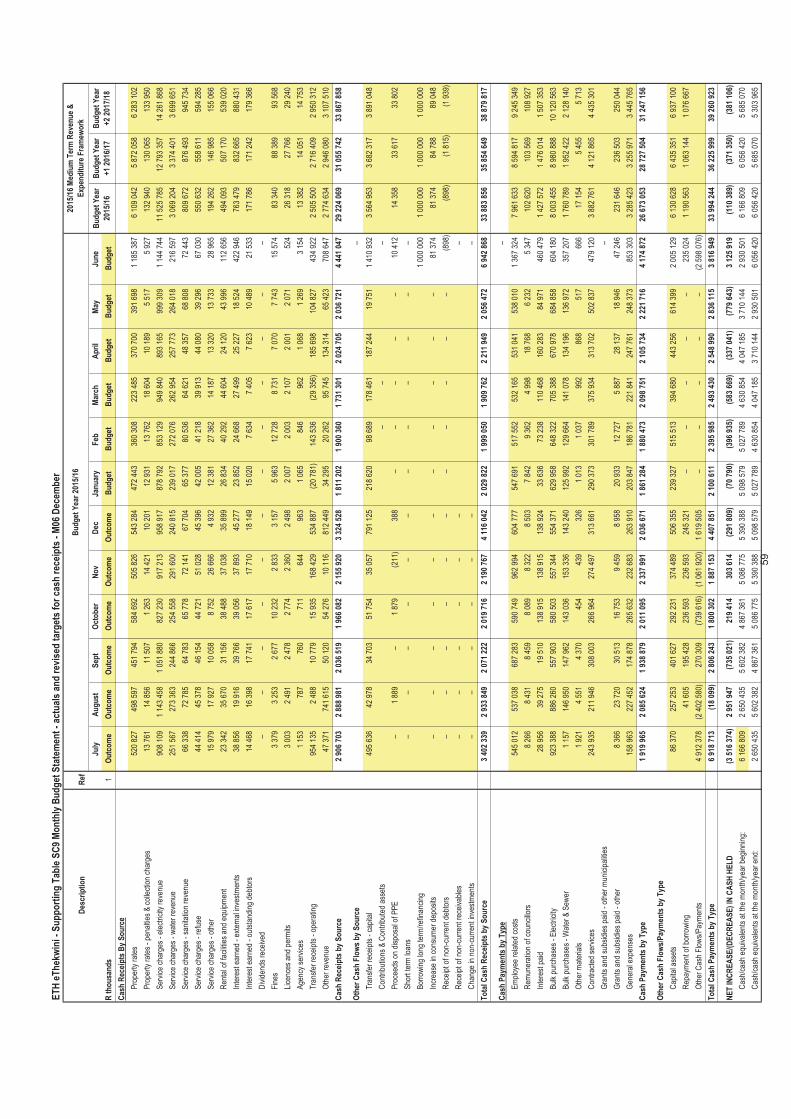
ET
H e
Th
ekw
ini -
Su
pp
ort
ing
Tab
le S
C9
Mo
nth
ly B
ud
get
Sta
tem
ent
- ac
tual
s an
d r
evis
ed t
arg
ets
for
cash
rec
eip
ts -
M06
Dec
emb
er
July
Au
gu
stS
ept
Oct
ob
erN
ov
Dec
Jan
uar
yF
ebM
arch
Ap
ril
May
Jun
e
R t
ho
usa
nd
s1
Ou
tco
me
Ou
tco
me
Ou
tco
me
Ou
tco
me
Ou
tco
me
Ou
tco
me
Bu
dg
etB
ud
get
Bu
dg
etB
ud
get
Bu
dg
etB
ud
get
Cas
h R
ecei
pts
By
So
urc
e
Pro
pert
y ra
tes
520
827
49
8 59
7
451
794
58
4 69
2
505
826
54
3 28
4
472
443
36
0 30
8
223
485
37
0 70
0
391
698
1
185
387
6
109
042
5
872
058
6
283
102
Pro
pert
y ra
tes
- pe
nalti
es &
col
lect
ion
char
ges
13 7
61
14 8
56
11 5
07
1 26
3
14
421
10
201
12
931
13
762
18
604
10
189
5
517
5 92
7
132
940
130
065
133
950
Ser
vice
cha
rges
- e
lect
ricity
rev
enue
908
109
1
143
458
1 05
1 88
0
82
7 23
0
917
213
95
8 91
7
878
792
85
3 12
9
949
840
89
3 16
5
999
309
1
144
744
11
525
785
12 7
93 3
57
14
261
868
Ser
vice
cha
rges
- w
ater
rev
enue
251
567
27
3 36
3
244
866
25
4 55
8
291
600
24
0 81
5
239
017
27
2 07
6
262
954
25
7 77
3
264
018
21
6 59
7
3
069
204
3
374
401
3
699
651
Ser
vice
cha
rges
- s
anita
tion
reve
nue
66 3
38
72 7
85
64 7
83
65 7
78
72 1
41
67 7
04
65 3
77
80 5
36
64 6
21
48 3
57
68 8
08
72 4
43
809
672
876
493
945
734
Ser
vice
cha
rges
- r
efus
e44
414
45
378
46
154
44
721
51
028
45
396
42
005
41
218
39
913
44
080
39
296
67
030
55
0 63
2
55
8 61
1
59
4 28
5
Ser
vice
cha
rges
- o
ther
15 9
79
17 9
27
10 0
58
8 75
2
26
666
4
932
12 3
81
27 3
62
14 1
87
13 3
20
13 7
33
28 9
65
194
262
146
985
155
066
Ren
tal o
f fac
ilitie
s an
d eq
uipm
ent
23 3
42
35 6
70
31 1
56
38 4
88
37 0
38
35 8
99
26 8
34
40 2
92
44 6
04
24 1
20
43 9
96
112
656
494
093
507
170
539
020
Inte
rest
ear
ned
- ex
tern
al in
vest
men
ts38
856
19
916
39
766
39
056
37
893
45
277
23
852
24
668
27
499
25
227
18
524
42
2 94
6
76
3 47
9
83
2 66
5
88
0 43
1
Inte
rest
ear
ned
- ou
tsta
ndin
g de
btor
s14
468
16
398
17
741
17
617
17
710
18
149
15
020
7
634
7 40
5
7
623
10 4
89
21 5
33
171
786
171
242
179
366
Div
iden
ds r
ecei
ved
–
–
–
–
–
–
–
–
–
–
–
–
Fin
es3
379
3 25
3
2
677
10 2
32
2 83
3
3
157
5 96
3
12
728
8
731
7 07
0
7
743
15 5
74
83 3
40
88
389
93 5
68
Lice
nces
and
per
mits
3 00
3
2
491
2 47
8
2
774
2 36
0
2
498
2 00
7
2
003
2 10
7
2
001
2 07
1
52
4
26
318
27 7
66
29
240
Age
ncy
serv
ices
1 15
3
78
7
760
71
1
644
96
3
1 06
5
84
6
962
1
068
1 26
9
3
154
13
382
14 0
51
14
753
Tra
nsfe
r re
ceip
ts -
ope
ratin
g95
4 13
5
2 48
8
10
779
15
935
16
8 42
9
534
887
(2
0 78
1)
143
536
(2
9 35
6)
185
698
10
4 82
7
434
922
2 50
5 50
0
2 71
6 40
9
2 95
0 31
2
Oth
er r
even
ue47
371
74
1 61
5
50 1
20
54 2
76
10 1
16
812
449
34
295
20
262
95
745
13
4 31
4
65 4
23
708
647
2 77
4 63
4
2 94
6 08
0
3 10
7 51
0
Cas
h R
ecei
pts
by
So
urc
e2
906
703
2 88
8 98
1
2
036
519
1 96
6 08
2
2
155
920
3 32
4 52
8
1
811
202
1 90
0 36
0
1
731
301
2 02
4 70
5
2
036
721
4 44
1 04
7
29 2
24 0
69
31
055
742
33 8
67 8
58
–
Oth
er C
ash
Flo
ws
by
So
urc
e–
Tra
nsfe
r re
ceip
ts -
cap
ital
495
636
42
978
34
703
51
754
35
057
79
1 12
5
218
620
98
689
17
8 46
1
187
244
19
751
1
410
932
3
564
953
3
682
317
3
891
048
Con
trib
utio
ns &
Con
trib
uted
ass
ets
–
–
–
Pro
ceed
s on
dis
posa
l of P
PE
–
1
889
–
1
879
(211
)
388
–
–
–
–
–
10 4
12
14 3
58
33
617
33 8
02
Sho
rt te
rm lo
ans
–
–
–
–
–
–
–
–
–
–
–
–
Bor
row
ing
long
term
/ref
inan
cing
1 00
0 00
0
1 00
0 00
0
1 00
0 00
0
1 00
0 00
0
Incr
ease
in c
onsu
mer
dep
osits
–
–
–
–
–
–
–
–
–
–
–
81
374
81
374
84 7
88
89
048
Rec
eipt
of n
on-c
urre
nt d
ebto
rs–
–
–
–
–
–
–
–
–
–
–
(898
)
(8
98)
(1 8
15)
(1
939
)
Rec
eipt
of n
on-c
urre
nt r
ecei
vabl
es–
–
–
–
–
–
–
Cha
nge
in n
on-c
urre
nt in
vest
men
ts–
–
–
–
–
–
–
To
tal C
ash
Rec
eip
ts b
y S
ou
rce
3 40
2 33
9
2
933
849
2 07
1 22
2
2
019
716
2 19
0 76
7
4
116
042
2 02
9 82
2
1
999
050
1 90
9 76
2
2
211
949
2 05
6 47
2
6
942
868
33
883
856
35 8
54 6
49
38
879
817
–
Cas
h P
aym
ents
by
Typ
e–
Em
ploy
ee r
elat
ed c
osts
545
012
53
7 03
8
687
283
59
0 74
9
962
994
60
4 77
7
547
691
51
7 55
2
532
165
53
1 04
1
538
010
1
367
324
7
961
633
8
594
817
9
245
349
Rem
uner
atio
n of
cou
ncill
ors
8 26
6
8
431
8 45
9
8
089
8 32
2
8
503
7 84
2
9
362
4 99
8
18
768
6
232
5 34
7
102
620
103
569
108
927
Inte
rest
pai
d28
956
39
275
19
510
13
8 91
5
138
915
13
8 92
4
33 6
36
73 2
38
110
468
16
0 28
3
84 9
71
460
479
1 42
7 57
2
1 47
6 01
4
1 50
7 35
3
Bul
k pu
rcha
ses
- E
lect
ricity
923
388
88
6 26
0
557
903
58
0 50
3
557
344
55
4 37
1
629
958
64
8 32
2
705
388
67
0 97
8
684
858
60
4 18
0
8
003
455
8
980
888
10
120
563
Bul
k pu
rcha
ses
- W
ater
& S
ewer
1 15
7
14
6 95
0
147
962
14
3 03
6
153
336
14
3 24
0
125
992
12
9 66
4
141
078
13
4 19
6
136
972
35
7 20
7
1
760
789
1
952
422
2
128
140
Oth
er m
ater
ials
1 92
1
4
551
4 37
0
45
4
439
32
6
1 01
3
1
037
992
86
8
517
66
6
17
154
5 45
5
5 71
3
Con
trac
ted
serv
ices
243
935
21
1 94
6
308
003
26
6 96
4
274
497
31
3 66
1
290
373
30
1 78
9
375
934
31
3 70
2
502
837
47
9 12
0
3
882
761
4
121
865
4
435
301
Gra
nts
and
subs
idie
s pa
id -
oth
er m
unic
ipal
ities
–
Gra
nts
and
subs
idie
s pa
id -
oth
er8
366
23 7
20
30 5
13
16 7
53
9 45
9
8
958
20 9
33
12 7
27
5 88
7
28
137
18
946
47
246
23
1 64
6
23
6 50
3
25
0 04
4
Gen
eral
exp
ense
s15
8 96
3
227
452
17
4 87
8
265
632
23
2 68
3
263
910
20
3 84
7
186
781
22
1 84
1
247
761
24
8 37
3
853
303
3 28
5 42
3
3 25
5 97
1
3 44
5 76
5
Cas
h P
aym
ents
by
Typ
e1
919
965
2 08
5 62
4
1
938
879
2 01
1 09
5
2
337
991
2 03
6 67
1
1
861
284
1 88
0 47
3
2
098
751
2 10
5 73
4
2
221
716
4 17
4 87
2
26 6
73 0
53
28
727
504
31 2
47 1
56
–
Oth
er C
ash
Flo
ws/
Pay
men
ts b
y T
ype
Cap
ital a
sset
s86
370
25
7 25
3
401
627
29
2 23
1
374
489
50
6 35
5
239
327
51
5 51
3
394
680
44
3 25
6
614
399
2
005
129
6
130
628
6
435
351
6
937
100
Rep
aym
ent o
f bor
row
ing
41 6
05
195
428
23
6 59
3
236
593
24
5 32
1
–
–
–
–
–
23
5 02
4
1
190
563
1
063
144
1
076
667
Oth
er C
ash
Flo
ws/
Pay
men
ts4
912
378
(2 4
02 5
80)
27
0 30
9
(739
616
)
(1
061
920
)
1 61
9 50
5
–
–
–
–
–
(2 5
98 0
76)
To
tal C
ash
Pay
men
ts b
y T
ype
6 91
8 71
3
(1
8 09
9)
2 80
6 24
3
1
800
302
1 88
7 15
3
4
407
851
2 10
0 61
1
2
395
985
2 49
3 43
0
2
548
990
2 83
6 11
5
3
816
949
33
994
244
36 2
25 9
99
39
260
923
–
NE
T IN
CR
EA
SE
/(D
EC
RE
AS
E)
IN C
AS
H H
EL
D(3
516
374
)
2 95
1 94
7
(7
35 0
21)
219
414
30
3 61
4
(291
809
)
(7
0 79
0)
(396
935
)
(5
83 6
69)
(337
041
)
(7
79 6
43)
3 12
5 91
9
(110
389
)
(371
350
)
(381
106
)
Cas
h/ca
sh e
quiv
alen
ts a
t the
mon
th/y
ear
begi
nnin
g:6
166
809
2 65
0 43
5
5
602
382
4 86
7 36
1
5
086
775
5 39
0 38
8
5
098
579
5 02
7 78
9
4
630
854
4 04
7 18
5
3
710
144
2 93
0 50
1
6 16
6 80
9
6 05
6 42
0
5 68
5 07
0
Cas
h/ca
sh e
quiv
alen
ts a
t the
mon
th/y
ear
end:
2 65
0 43
5
5
602
382
4 86
7 36
1
5
086
775
5 39
0 38
8
5
098
579
5 02
7 78
9
4
630
854
4 04
7 18
5
3
710
144
2 93
0 50
1
6
056
420
6
056
420
5
685
070
5
303
965
Bu
dg
et Y
ear
+1
2016
/17
Bu
dg
et Y
ear
+2
2017
/18
Des
crip
tio
n
Bu
dg
et Y
ear
2015
/16
Ref
Bu
dg
et Y
ear
2015
/16
2015
/16
Med
ium
Ter
m R
even
ue
&
Exp
end
itu
re F
ram
ewo
rk
59
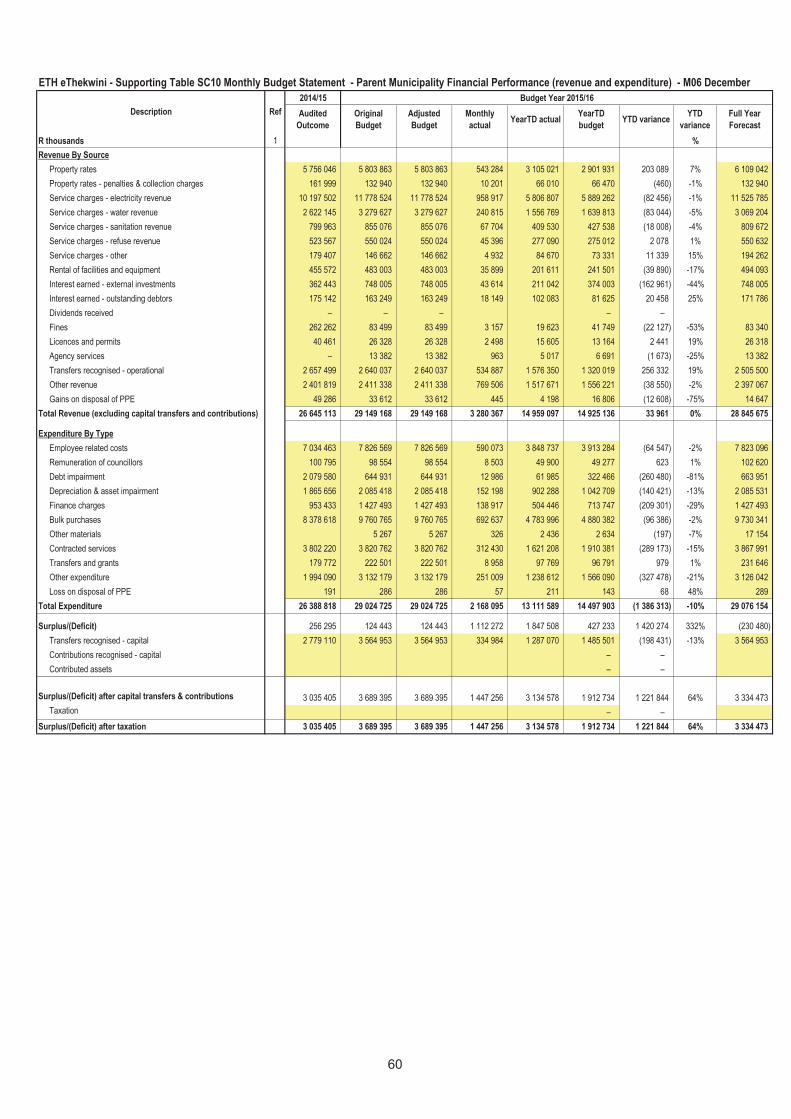
2014/15 Budget Year 2015/16
Audited
Outcome
Original
Budget
Adjusted
Budget
Monthly
actualYearTD actual
YearTD
budgetYTD variance
YTD
variance
Full Year
Forecast
R thousands 1 %
Revenue By Source
Property rates 5 756 046 5 803 863 5 803 863 543 284 3 105 021 2 901 931 203 089 7% 6 109 042
Property rates - penalties & collection charges 161 999 132 940 132 940 10 201 66 010 66 470 (460) -1% 132 940
Service charges - electricity revenue 10 197 502 11 778 524 11 778 524 958 917 5 806 807 5 889 262 (82 456) -1% 11 525 785
Service charges - water revenue 2 622 145 3 279 627 3 279 627 240 815 1 556 769 1 639 813 (83 044) -5% 3 069 204
Service charges - sanitation revenue 799 963 855 076 855 076 67 704 409 530 427 538 (18 008) -4% 809 672
Service charges - refuse revenue 523 567 550 024 550 024 45 396 277 090 275 012 2 078 1% 550 632
Service charges - other 179 407 146 662 146 662 4 932 84 670 73 331 11 339 15% 194 262
Rental of facilities and equipment 455 572 483 003 483 003 35 899 201 611 241 501 (39 890) -17% 494 093
Interest earned - external investments 362 443 748 005 748 005 43 614 211 042 374 003 (162 961) -44% 748 005
Interest earned - outstanding debtors 175 142 163 249 163 249 18 149 102 083 81 625 20 458 25% 171 786
Dividends received – – – – –
Fines 262 262 83 499 83 499 3 157 19 623 41 749 (22 127) -53% 83 340
Licences and permits 40 461 26 328 26 328 2 498 15 605 13 164 2 441 19% 26 318
Agency services – 13 382 13 382 963 5 017 6 691 (1 673) -25% 13 382
Transfers recognised - operational 2 657 499 2 640 037 2 640 037 534 887 1 576 350 1 320 019 256 332 19% 2 505 500
Other revenue 2 401 819 2 411 338 2 411 338 769 506 1 517 671 1 556 221 (38 550) -2% 2 397 067
Gains on disposal of PPE 49 286 33 612 33 612 445 4 198 16 806 (12 608) -75% 14 647
Total Revenue (excluding capital transfers and contributions) 26 645 113 29 149 168 29 149 168 3 280 367 14 959 097 14 925 136 33 961 0% 28 845 675
Expenditure By Type
Employee related costs 7 034 463 7 826 569 7 826 569 590 073 3 848 737 3 913 284 (64 547) -2% 7 823 096
Remuneration of councillors 100 795 98 554 98 554 8 503 49 900 49 277 623 1% 102 620
Debt impairment 2 079 580 644 931 644 931 12 986 61 985 322 466 (260 480) -81% 663 951
Depreciation & asset impairment 1 865 656 2 085 418 2 085 418 152 198 902 288 1 042 709 (140 421) -13% 2 085 531
Finance charges 953 433 1 427 493 1 427 493 138 917 504 446 713 747 (209 301) -29% 1 427 493
Bulk purchases 8 378 618 9 760 765 9 760 765 692 637 4 783 996 4 880 382 (96 386) -2% 9 730 341
Other materials 5 267 5 267 326 2 436 2 634 (197) -7% 17 154
Contracted services 3 802 220 3 820 762 3 820 762 312 430 1 621 208 1 910 381 (289 173) -15% 3 867 991
Transfers and grants 179 772 222 501 222 501 8 958 97 769 96 791 979 1% 231 646
Other expenditure 1 994 090 3 132 179 3 132 179 251 009 1 238 612 1 566 090 (327 478) -21% 3 126 042
Loss on disposal of PPE 191 286 286 57 211 143 68 48% 289
Total Expenditure 26 388 818 29 024 725 29 024 725 2 168 095 13 111 589 14 497 903 (1 386 313) -10% 29 076 154 –
Surplus/(Deficit) 256 295 124 443 124 443 1 112 272 1 847 508 427 233 1 420 274 332% (230 480)
Transfers recognised - capital 2 779 110 3 564 953 3 564 953 334 984 1 287 070 1 485 501 (198 431) -13% 3 564 953
Contributions recognised - capital – –
Contributed assets – –
Surplus/(Deficit) after capital transfers & contributions 3 035 405 3 689 395 3 689 395 1 447 256 3 134 578 1 912 734 1 221 844 64% 3 334 473
Taxation – –
Surplus/(Deficit) after taxation 3 035 405 3 689 395 3 689 395 1 447 256 3 134 578 1 912 734 1 221 844 64% 3 334 473
Description Ref
ETH eThekwini - Supporting Table SC10 Monthly Budget Statement - Parent Municipality Financial Performance (revenue and expenditure) - M06 December
60
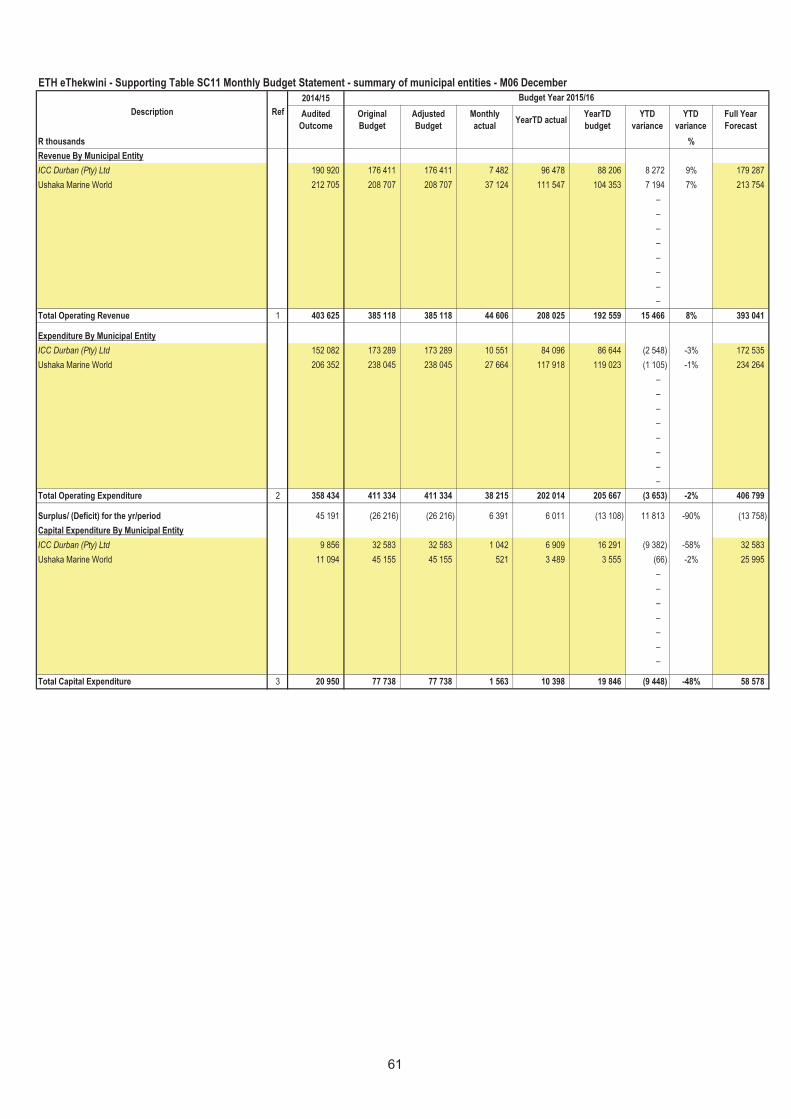
2014/15
Audited
Outcome
Original
Budget
Adjusted
Budget
Monthly
actualYearTD actual
YearTD
budget
YTD
variance
YTD
variance
Full Year
Forecast
R thousands %
Revenue By Municipal Entity
ICC Durban (Pty) Ltd 190 920 176 411 176 411 7 482 96 478 88 206 8 272 9% 179 287
Ushaka Marine World 212 705 208 707 208 707 37 124 111 547 104 353 7 194 7% 213 754
–
–
–
–
–
–
–
–
Total Operating Revenue 1 403 625 385 118 385 118 44 606 208 025 192 559 15 466 8% 393 041
Expenditure By Municipal Entity
ICC Durban (Pty) Ltd 152 082 173 289 173 289 10 551 84 096 86 644 (2 548) -3% 172 535
Ushaka Marine World 206 352 238 045 238 045 27 664 117 918 119 023 (1 105) -1% 234 264
–
–
–
–
–
–
–
–
Total Operating Expenditure 2 358 434 411 334 411 334 38 215 202 014 205 667 (3 653) -2% 406 799
Surplus/ (Deficit) for the yr/period 45 191 (26 216) (26 216) 6 391 6 011 (13 108) 11 813 -90% (13 758)
Capital Expenditure By Municipal Entity
ICC Durban (Pty) Ltd 9 856 32 583 32 583 1 042 6 909 16 291 (9 382) -58% 32 583
Ushaka Marine World 11 094 45 155 45 155 521 3 489 3 555 (66) -2% 25 995
–
–
–
–
–
–
–
Total Capital Expenditure 3 20 950 77 738 77 738 1 563 10 398 19 846 (9 448) -48% 58 578
Description Ref
ETH eThekwini - Supporting Table SC11 Monthly Budget Statement - summary of municipal entities - M06 December
Budget Year 2015/16
61
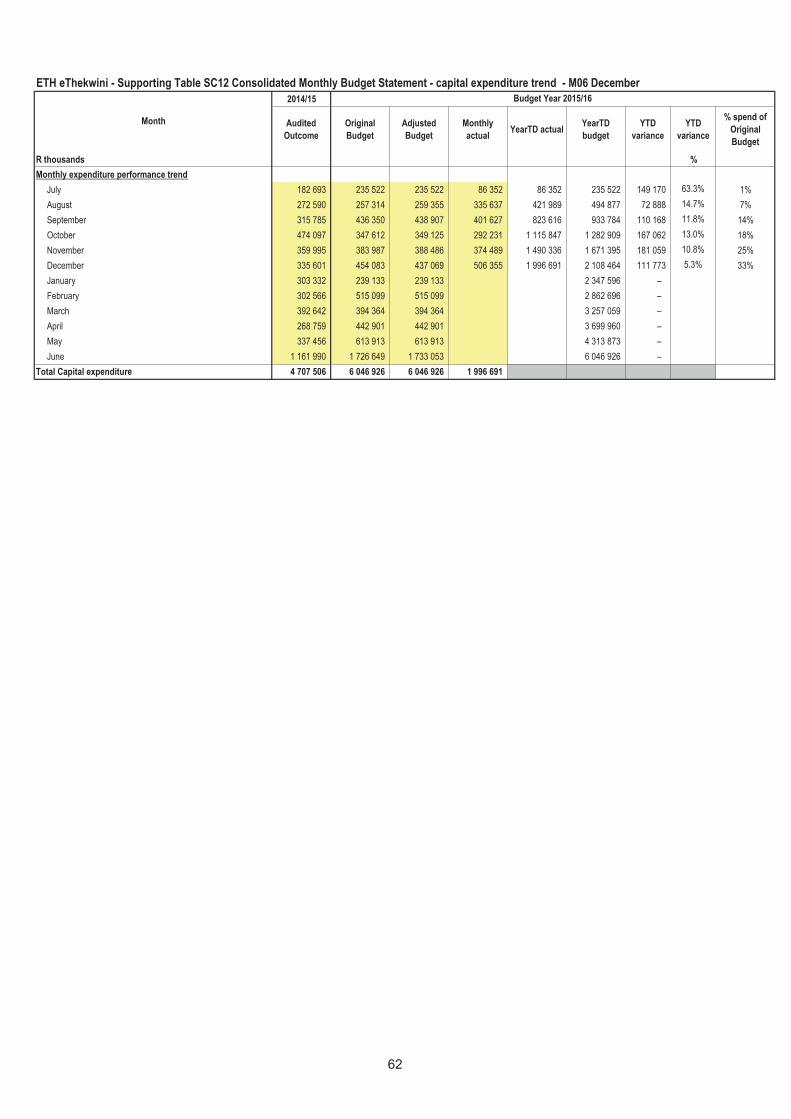
2014/15
Audited
Outcome
Original
Budget
Adjusted
Budget
Monthly
actualYearTD actual
YearTD
budget
YTD
variance
YTD
variance
% spend of
Original
Budget
R thousands %
Monthly expenditure performance trend
July 182 693 235 522 235 522 86 352 86 352 235 522 149 170 63.3% 1%
August 272 590 257 314 259 355 335 637 421 989 494 877 72 888 14.7% 7%
September 315 785 436 350 438 907 401 627 823 616 933 784 110 168 11.8% 14%
October 474 097 347 612 349 125 292 231 1 115 847 1 282 909 167 062 13.0% 18%
November 359 995 383 987 388 486 374 489 1 490 336 1 671 395 181 059 10.8% 25%
December 335 601 454 083 437 069 506 355 1 996 691 2 108 464 111 773 5.3% 33%
January 303 332 239 133 239 133 2 347 596 –
February 302 566 515 099 515 099 2 862 696 –
March 392 642 394 364 394 364 3 257 059 –
April 268 759 442 901 442 901 3 699 960 –
May 337 456 613 913 613 913 4 313 873 –
June 1 161 990 1 726 649 1 733 053 6 046 926 –
Total Capital expenditure 4 707 506 6 046 926 6 046 926 1 996 691
Month
ETH eThekwini - Supporting Table SC12 Consolidated Monthly Budget Statement - capital expenditure trend - M06 December
Budget Year 2015/16
62
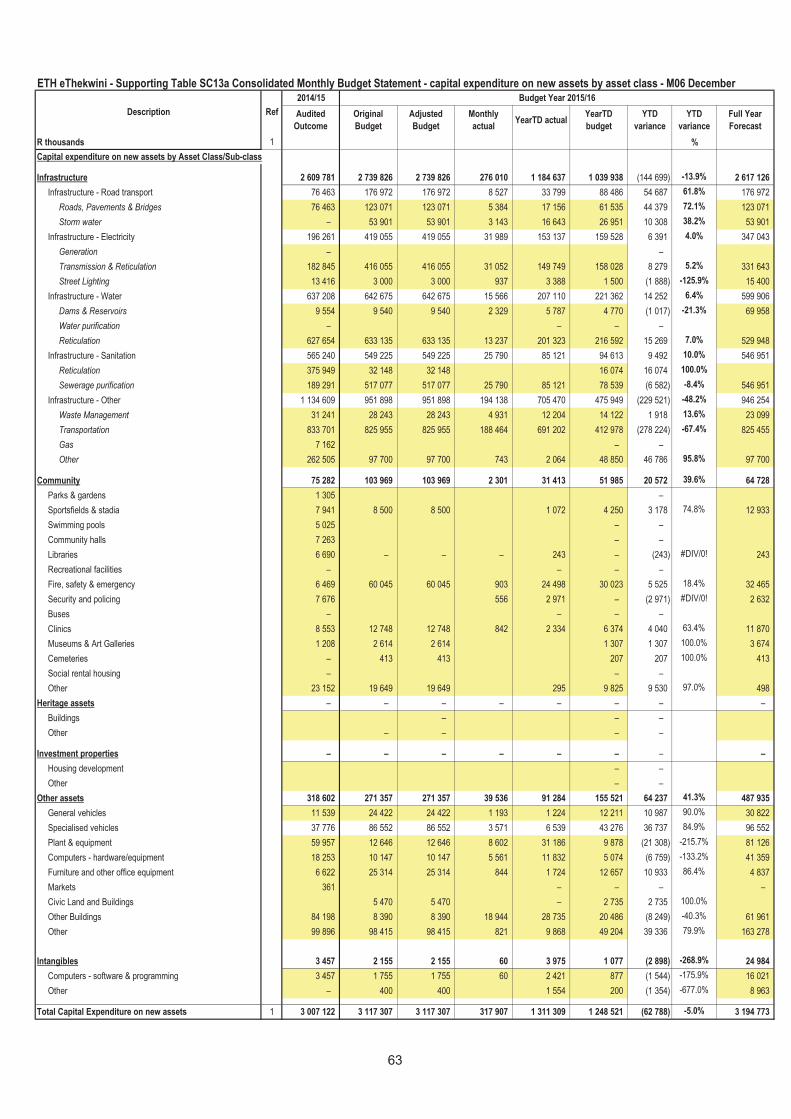
2014/15 Budget Year 2015/16
Audited
Outcome
Original
Budget
Adjusted
Budget
Monthly
actualYearTD actual
YearTD
budget
YTD
variance
YTD
variance
Full Year
Forecast
R thousands 1 %
Capital expenditure on new assets by Asset Class/Sub-class
Infrastructure 2 609 781 2 739 826 2 739 826 276 010 1 184 637 1 039 938 (144 699) -13.9% 2 617 126
Infrastructure - Road transport 76 463 176 972 176 972 8 527 33 799 88 486 54 687 61.8% 176 972
Roads, Pavements & Bridges 76 463 123 071 123 071 5 384 17 156 61 535 44 379 72.1% 123 071
Storm water – 53 901 53 901 3 143 16 643 26 951 10 308 38.2% 53 901
Infrastructure - Electricity 196 261 419 055 419 055 31 989 153 137 159 528 6 391 4.0% 347 043
Generation – –
Transmission & Reticulation 182 845 416 055 416 055 31 052 149 749 158 028 8 279 5.2% 331 643
Street Lighting 13 416 3 000 3 000 937 3 388 1 500 (1 888) -125.9% 15 400
Infrastructure - Water 637 208 642 675 642 675 15 566 207 110 221 362 14 252 6.4% 599 906
Dams & Reservoirs 9 554 9 540 9 540 2 329 5 787 4 770 (1 017) -21.3% 69 958
Water purification – – – –
Reticulation 627 654 633 135 633 135 13 237 201 323 216 592 15 269 7.0% 529 948
Infrastructure - Sanitation 565 240 549 225 549 225 25 790 85 121 94 613 9 492 10.0% 546 951
Reticulation 375 949 32 148 32 148 16 074 16 074 100.0%
Sewerage purification 189 291 517 077 517 077 25 790 85 121 78 539 (6 582) -8.4% 546 951
Infrastructure - Other 1 134 609 951 898 951 898 194 138 705 470 475 949 (229 521) -48.2% 946 254
Waste Management 31 241 28 243 28 243 4 931 12 204 14 122 1 918 13.6% 23 099
Transportation 833 701 825 955 825 955 188 464 691 202 412 978 (278 224) -67.4% 825 455
Gas 7 162 – –
Other 262 505 97 700 97 700 743 2 064 48 850 46 786 95.8% 97 700
Community 75 282 103 969 103 969 2 301 31 413 51 985 20 572 39.6% 64 728
Parks & gardens 1 305 –
Sportsfields & stadia 7 941 8 500 8 500 1 072 4 250 3 178 74.8% 12 933
Swimming pools 5 025 – –
Community halls 7 263 – –
Libraries 6 690 – – – 243 – (243) #DIV/0! 243
Recreational facilities – – – –
Fire, safety & emergency 6 469 60 045 60 045 903 24 498 30 023 5 525 18.4% 32 465
Security and policing 7 676 556 2 971 – (2 971) #DIV/0! 2 632
Buses – – – –
Clinics 8 553 12 748 12 748 842 2 334 6 374 4 040 63.4% 11 870
Museums & Art Galleries 1 208 2 614 2 614 1 307 1 307 100.0% 3 674
Cemeteries – 413 413 207 207 100.0% 413
Social rental housing – – –
Other 23 152 19 649 19 649 295 9 825 9 530 97.0% 498
Heritage assets – – – – – – – –
Buildings – – –
Other – – – – –
Investment properties – – – – – – – –
Housing development – –
Other – –
Other assets 318 602 271 357 271 357 39 536 91 284 155 521 64 237 41.3% 487 935
General vehicles 11 539 24 422 24 422 1 193 1 224 12 211 10 987 90.0% 30 822
Specialised vehicles 37 776 86 552 86 552 3 571 6 539 43 276 36 737 84.9% 96 552
Plant & equipment 59 957 12 646 12 646 8 602 31 186 9 878 (21 308) -215.7% 81 126
Computers - hardware/equipment 18 253 10 147 10 147 5 561 11 832 5 074 (6 759) -133.2% 41 359
Furniture and other office equipment 6 622 25 314 25 314 844 1 724 12 657 10 933 86.4% 4 837
Markets 361 – – – –
Civic Land and Buildings 5 470 5 470 – 2 735 2 735 100.0%
Other Buildings 84 198 8 390 8 390 18 944 28 735 20 486 (8 249) -40.3% 61 961
Other 99 896 98 415 98 415 821 9 868 49 204 39 336 79.9% 163 278
Intangibles 3 457 2 155 2 155 60 3 975 1 077 (2 898) -268.9% 24 984
Computers - software & programming 3 457 1 755 1 755 60 2 421 877 (1 544) -175.9% 16 021
Other – 400 400 1 554 200 (1 354) -677.0% 8 963
Total Capital Expenditure on new assets 1 3 007 122 3 117 307 3 117 307 317 907 1 311 309 1 248 521 (62 788) -5.0% 3 194 773
Description Ref
ETH eThekwini - Supporting Table SC13a Consolidated Monthly Budget Statement - capital expenditure on new assets by asset class - M06 December
63
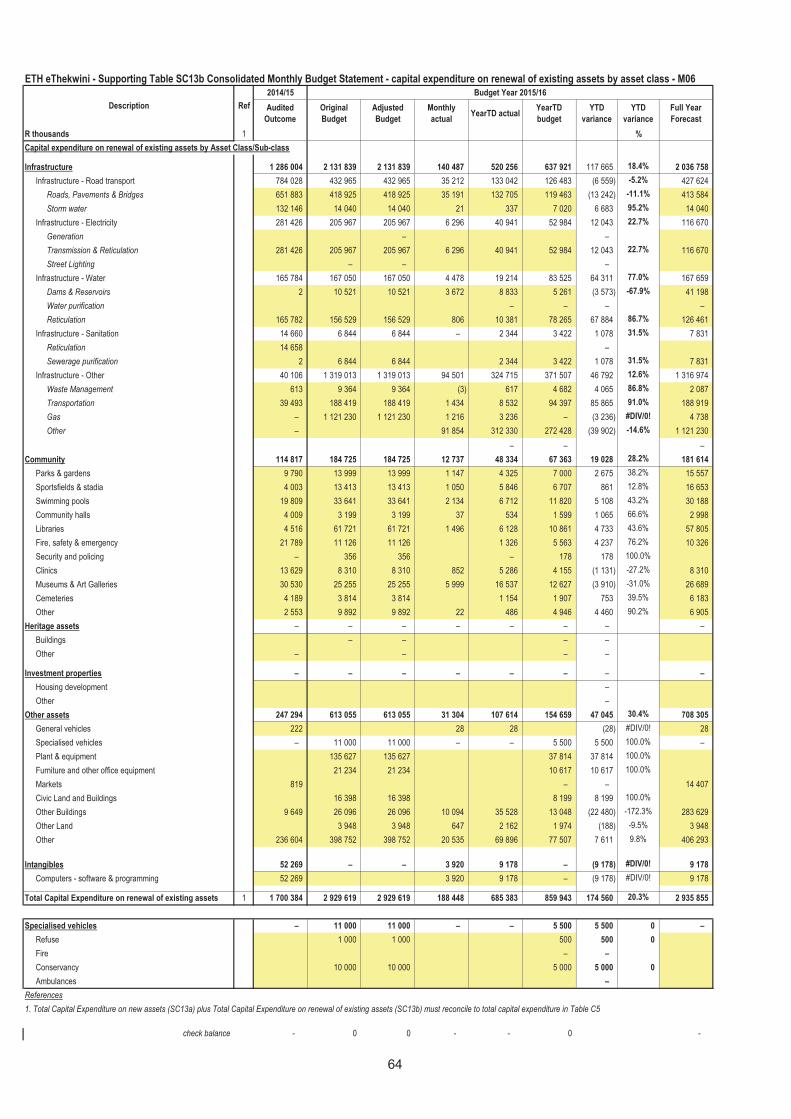
2014/15 Budget Year 2015/16
Audited
Outcome
Original
Budget
Adjusted
Budget
Monthly
actualYearTD actual
YearTD
budget
YTD
variance
YTD
variance
Full Year
Forecast
R thousands 1 %
Capital expenditure on renewal of existing assets by Asset Class/Sub-class
Infrastructure 1 286 004 2 131 839 2 131 839 140 487 520 256 637 921 117 665 18.4% 2 036 758
Infrastructure - Road transport 784 028 432 965 432 965 35 212 133 042 126 483 (6 559) -5.2% 427 624
Roads, Pavements & Bridges 651 883 418 925 418 925 35 191 132 705 119 463 (13 242) -11.1% 413 584
Storm water 132 146 14 040 14 040 21 337 7 020 6 683 95.2% 14 040
Infrastructure - Electricity 281 426 205 967 205 967 6 296 40 941 52 984 12 043 22.7% 116 670
Generation – –
Transmission & Reticulation 281 426 205 967 205 967 6 296 40 941 52 984 12 043 22.7% 116 670
Street Lighting – – –
Infrastructure - Water 165 784 167 050 167 050 4 478 19 214 83 525 64 311 77.0% 167 659
Dams & Reservoirs 2 10 521 10 521 3 672 8 833 5 261 (3 573) -67.9% 41 198
Water purification – – – –
Reticulation 165 782 156 529 156 529 806 10 381 78 265 67 884 86.7% 126 461
Infrastructure - Sanitation 14 660 6 844 6 844 – 2 344 3 422 1 078 31.5% 7 831
Reticulation 14 658 –
Sewerage purification 2 6 844 6 844 2 344 3 422 1 078 31.5% 7 831
Infrastructure - Other 40 106 1 319 013 1 319 013 94 501 324 715 371 507 46 792 12.6% 1 316 974
Waste Management 613 9 364 9 364 (3) 617 4 682 4 065 86.8% 2 087
Transportation 39 493 188 419 188 419 1 434 8 532 94 397 85 865 91.0% 188 919
Gas – 1 121 230 1 121 230 1 216 3 236 – (3 236) #DIV/0! 4 738
Other – 91 854 312 330 272 428 (39 902) -14.6% 1 121 230
– – –
Community 114 817 184 725 184 725 12 737 48 334 67 363 19 028 28.2% 181 614
Parks & gardens 9 790 13 999 13 999 1 147 4 325 7 000 2 675 38.2% 15 557
Sportsfields & stadia 4 003 13 413 13 413 1 050 5 846 6 707 861 12.8% 16 653
Swimming pools 19 809 33 641 33 641 2 134 6 712 11 820 5 108 43.2% 30 188
Community halls 4 009 3 199 3 199 37 534 1 599 1 065 66.6% 2 998
Libraries 4 516 61 721 61 721 1 496 6 128 10 861 4 733 43.6% 57 805
Fire, safety & emergency 21 789 11 126 11 126 1 326 5 563 4 237 76.2% 10 326
Security and policing – 356 356 – 178 178 100.0%
Clinics 13 629 8 310 8 310 852 5 286 4 155 (1 131) -27.2% 8 310
Museums & Art Galleries 30 530 25 255 25 255 5 999 16 537 12 627 (3 910) -31.0% 26 689
Cemeteries 4 189 3 814 3 814 1 154 1 907 753 39.5% 6 183
Other 2 553 9 892 9 892 22 486 4 946 4 460 90.2% 6 905
Heritage assets – – – – – – – –
Buildings – – – –
Other – – – – –
Investment properties – – – – – – – –
Housing development –
Other –
Other assets 247 294 613 055 613 055 31 304 107 614 154 659 47 045 30.4% 708 305
General vehicles 222 28 28 (28) #DIV/0! 28
Specialised vehicles – 11 000 11 000 – – 5 500 5 500 100.0% –
Plant & equipment 135 627 135 627 37 814 37 814 100.0%
Furniture and other office equipment 21 234 21 234 10 617 10 617 100.0%
Markets 819 – – 14 407
Civic Land and Buildings 16 398 16 398 8 199 8 199 100.0%
Other Buildings 9 649 26 096 26 096 10 094 35 528 13 048 (22 480) -172.3% 283 629
Other Land 3 948 3 948 647 2 162 1 974 (188) -9.5% 3 948
Other 236 604 398 752 398 752 20 535 69 896 77 507 7 611 9.8% 406 293
Intangibles 52 269 – – 3 920 9 178 – (9 178) #DIV/0! 9 178
Computers - software & programming 52 269 3 920 9 178 – (9 178) #DIV/0! 9 178
Total Capital Expenditure on renewal of existing assets 1 1 700 384 2 929 619 2 929 619 188 448 685 383 859 943 174 560 20.3% 2 935 855
Specialised vehicles – 11 000 11 000 – – 5 500 5 500 0 –
Refuse 1 000 1 000 500 500 0
Fire – –
Conservancy 10 000 10 000 5 000 5 000 0
Ambulances –
References
1. Total Capital Expenditure on new assets (SC13a) plus Total Capital Expenditure on renewal of existing assets (SC13b) must reconcile to total capital expenditure in Table C5
check balance - 0 0 - - 0 -
ETH eThekwini - Supporting Table SC13b Consolidated Monthly Budget Statement - capital expenditure on renewal of existing assets by asset class - M06
Description Ref
64
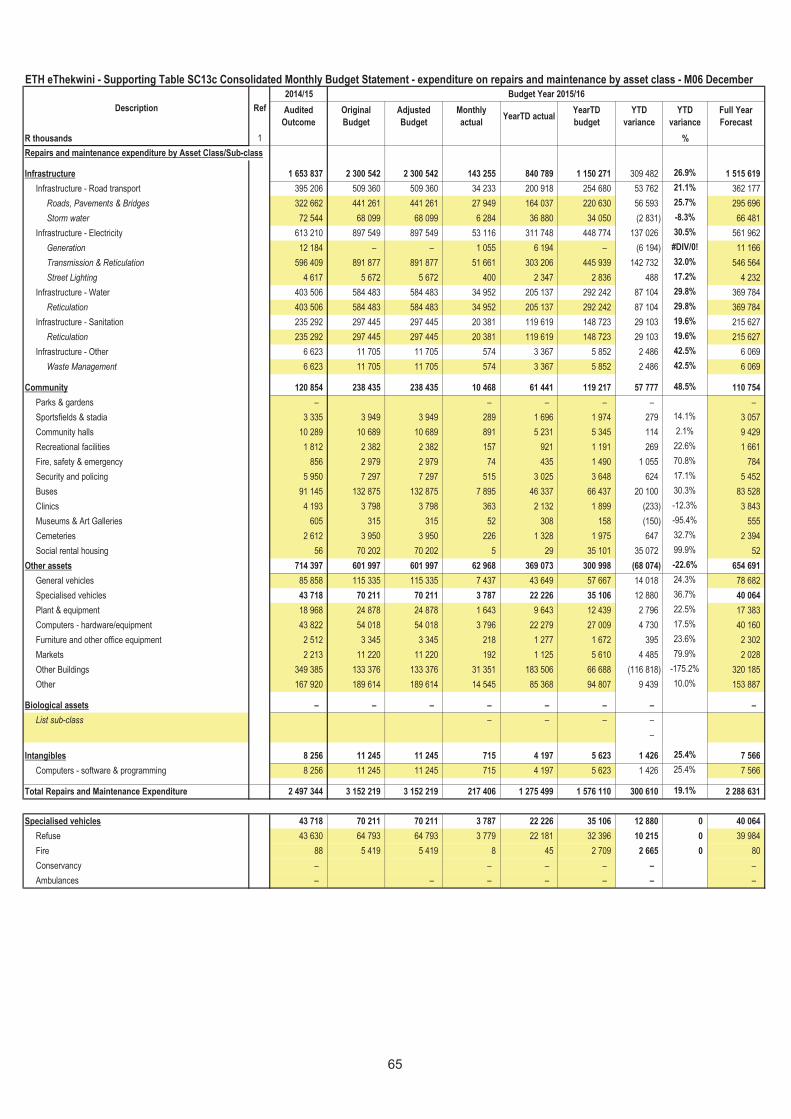
2014/15 Budget Year 2015/16
Audited
Outcome
Original
Budget
Adjusted
Budget
Monthly
actualYearTD actual
YearTD
budget
YTD
variance
YTD
variance
Full Year
Forecast
R thousands 1 %
Repairs and maintenance expenditure by Asset Class/Sub-class
Infrastructure 1 653 837 2 300 542 2 300 542 143 255 840 789 1 150 271 309 482 26.9% 1 515 619
Infrastructure - Road transport 395 206 509 360 509 360 34 233 200 918 254 680 53 762 21.1% 362 177
Roads, Pavements & Bridges 322 662 441 261 441 261 27 949 164 037 220 630 56 593 25.7% 295 696
Storm water 72 544 68 099 68 099 6 284 36 880 34 050 (2 831) -8.3% 66 481
Infrastructure - Electricity 613 210 897 549 897 549 53 116 311 748 448 774 137 026 30.5% 561 962
Generation 12 184 – – 1 055 6 194 – (6 194) #DIV/0! 11 166
Transmission & Reticulation 596 409 891 877 891 877 51 661 303 206 445 939 142 732 32.0% 546 564
Street Lighting 4 617 5 672 5 672 400 2 347 2 836 488 17.2% 4 232
Infrastructure - Water 403 506 584 483 584 483 34 952 205 137 292 242 87 104 29.8% 369 784
Reticulation 403 506 584 483 584 483 34 952 205 137 292 242 87 104 29.8% 369 784
Infrastructure - Sanitation 235 292 297 445 297 445 20 381 119 619 148 723 29 103 19.6% 215 627
Reticulation 235 292 297 445 297 445 20 381 119 619 148 723 29 103 19.6% 215 627
Infrastructure - Other 6 623 11 705 11 705 574 3 367 5 852 2 486 42.5% 6 069
Waste Management 6 623 11 705 11 705 574 3 367 5 852 2 486 42.5% 6 069
Community 120 854 238 435 238 435 10 468 61 441 119 217 57 777 48.5% 110 754
Parks & gardens – – – – – –
Sportsfields & stadia 3 335 3 949 3 949 289 1 696 1 974 279 14.1% 3 057
Community halls 10 289 10 689 10 689 891 5 231 5 345 114 2.1% 9 429
Recreational facilities 1 812 2 382 2 382 157 921 1 191 269 22.6% 1 661
Fire, safety & emergency 856 2 979 2 979 74 435 1 490 1 055 70.8% 784
Security and policing 5 950 7 297 7 297 515 3 025 3 648 624 17.1% 5 452
Buses 91 145 132 875 132 875 7 895 46 337 66 437 20 100 30.3% 83 528
Clinics 4 193 3 798 3 798 363 2 132 1 899 (233) -12.3% 3 843
Museums & Art Galleries 605 315 315 52 308 158 (150) -95.4% 555
Cemeteries 2 612 3 950 3 950 226 1 328 1 975 647 32.7% 2 394
Social rental housing 56 70 202 70 202 5 29 35 101 35 072 99.9% 52
Other assets 714 397 601 997 601 997 62 968 369 073 300 998 (68 074) -22.6% 654 691
General vehicles 85 858 115 335 115 335 7 437 43 649 57 667 14 018 24.3% 78 682
Specialised vehicles 43 718 70 211 70 211 3 787 22 226 35 106 12 880 36.7% 40 064
Plant & equipment 18 968 24 878 24 878 1 643 9 643 12 439 2 796 22.5% 17 383
Computers - hardware/equipment 43 822 54 018 54 018 3 796 22 279 27 009 4 730 17.5% 40 160
Furniture and other office equipment 2 512 3 345 3 345 218 1 277 1 672 395 23.6% 2 302
Markets 2 213 11 220 11 220 192 1 125 5 610 4 485 79.9% 2 028
Other Buildings 349 385 133 376 133 376 31 351 183 506 66 688 (116 818) -175.2% 320 185
Other 167 920 189 614 189 614 14 545 85 368 94 807 9 439 10.0% 153 887
Biological assets – – – – – – – –
List sub-class – – – –
–
Intangibles 8 256 11 245 11 245 715 4 197 5 623 1 426 25.4% 7 566
Computers - software & programming 8 256 11 245 11 245 715 4 197 5 623 1 426 25.4% 7 566
Total Repairs and Maintenance Expenditure 2 497 344 3 152 219 3 152 219 217 406 1 275 499 1 576 110 300 610 19.1% 2 288 631
Specialised vehicles 43 718 70 211 70 211 3 787 22 226 35 106 12 880 0 40 064
Refuse 43 630 64 793 64 793 3 779 22 181 32 396 10 215 0 39 984
Fire 88 5 419 5 419 8 45 2 709 2 665 0 80
Conservancy – – – – – –
Ambulances – – – – – – –
ETH eThekwini - Supporting Table SC13c Consolidated Monthly Budget Statement - expenditure on repairs and maintenance by asset class - M06 December
Description Ref
65
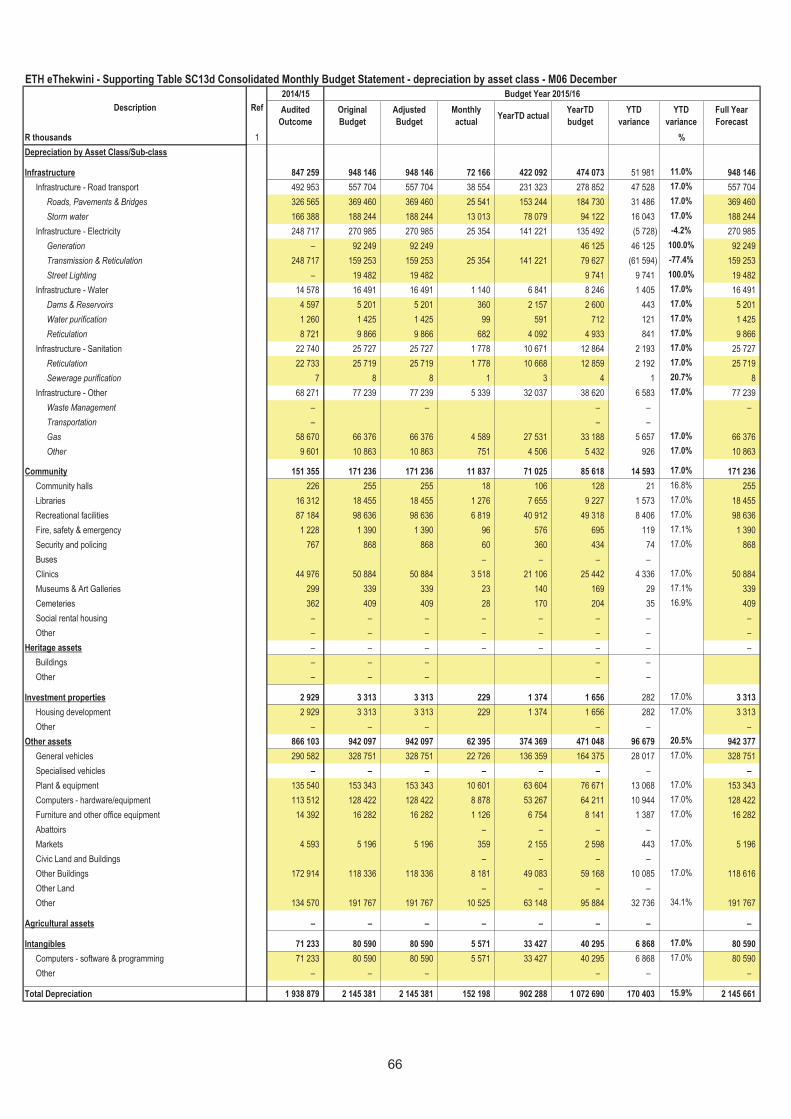
2014/15 Budget Year 2015/16
Audited
Outcome
Original
Budget
Adjusted
Budget
Monthly
actualYearTD actual
YearTD
budget
YTD
variance
YTD
variance
Full Year
Forecast
R thousands 1 %
Depreciation by Asset Class/Sub-class
Infrastructure 847 259 948 146 948 146 72 166 422 092 474 073 51 981 11.0% 948 146
Infrastructure - Road transport 492 953 557 704 557 704 38 554 231 323 278 852 47 528 17.0% 557 704
Roads, Pavements & Bridges 326 565 369 460 369 460 25 541 153 244 184 730 31 486 17.0% 369 460
Storm water 166 388 188 244 188 244 13 013 78 079 94 122 16 043 17.0% 188 244
Infrastructure - Electricity 248 717 270 985 270 985 25 354 141 221 135 492 (5 728) -4.2% 270 985
Generation – 92 249 92 249 46 125 46 125 100.0% 92 249
Transmission & Reticulation 248 717 159 253 159 253 25 354 141 221 79 627 (61 594) -77.4% 159 253
Street Lighting – 19 482 19 482 9 741 9 741 100.0% 19 482
Infrastructure - Water 14 578 16 491 16 491 1 140 6 841 8 246 1 405 17.0% 16 491
Dams & Reservoirs 4 597 5 201 5 201 360 2 157 2 600 443 17.0% 5 201
Water purification 1 260 1 425 1 425 99 591 712 121 17.0% 1 425
Reticulation 8 721 9 866 9 866 682 4 092 4 933 841 17.0% 9 866
Infrastructure - Sanitation 22 740 25 727 25 727 1 778 10 671 12 864 2 193 17.0% 25 727
Reticulation 22 733 25 719 25 719 1 778 10 668 12 859 2 192 17.0% 25 719
Sewerage purification 7 8 8 1 3 4 1 20.7% 8
Infrastructure - Other 68 271 77 239 77 239 5 339 32 037 38 620 6 583 17.0% 77 239
Waste Management – – – – –
Transportation – – –
Gas 58 670 66 376 66 376 4 589 27 531 33 188 5 657 17.0% 66 376
Other 9 601 10 863 10 863 751 4 506 5 432 926 17.0% 10 863 – –
Community 151 355 171 236 171 236 11 837 71 025 85 618 14 593 17.0% 171 236
Community halls 226 255 255 18 106 128 21 16.8% 255
Libraries 16 312 18 455 18 455 1 276 7 655 9 227 1 573 17.0% 18 455
Recreational facilities 87 184 98 636 98 636 6 819 40 912 49 318 8 406 17.0% 98 636
Fire, safety & emergency 1 228 1 390 1 390 96 576 695 119 17.1% 1 390
Security and policing 767 868 868 60 360 434 74 17.0% 868
Buses – – – –
Clinics 44 976 50 884 50 884 3 518 21 106 25 442 4 336 17.0% 50 884
Museums & Art Galleries 299 339 339 23 140 169 29 17.1% 339
Cemeteries 362 409 409 28 170 204 35 16.9% 409
Social rental housing – – – – – – – –
Other – – – – – – – –
Heritage assets – – – – – – – –
Buildings – – – – –
Other – – – – – –
Investment properties 2 929 3 313 3 313 229 1 374 1 656 282 17.0% 3 313
Housing development 2 929 3 313 3 313 229 1 374 1 656 282 17.0% 3 313
Other – – – – – –
Other assets 866 103 942 097 942 097 62 395 374 369 471 048 96 679 20.5% 942 377
General vehicles 290 582 328 751 328 751 22 726 136 359 164 375 28 017 17.0% 328 751
Specialised vehicles – – – – – – – –
Plant & equipment 135 540 153 343 153 343 10 601 63 604 76 671 13 068 17.0% 153 343
Computers - hardware/equipment 113 512 128 422 128 422 8 878 53 267 64 211 10 944 17.0% 128 422
Furniture and other office equipment 14 392 16 282 16 282 1 126 6 754 8 141 1 387 17.0% 16 282
Abattoirs – – – –
Markets 4 593 5 196 5 196 359 2 155 2 598 443 17.0% 5 196
Civic Land and Buildings – – – –
Other Buildings 172 914 118 336 118 336 8 181 49 083 59 168 10 085 17.0% 118 616
Other Land – – – –
Other 134 570 191 767 191 767 10 525 63 148 95 884 32 736 34.1% 191 767
Agricultural assets – – – – – – – –
Intangibles 71 233 80 590 80 590 5 571 33 427 40 295 6 868 17.0% 80 590
Computers - software & programming 71 233 80 590 80 590 5 571 33 427 40 295 6 868 17.0% 80 590
Other – – – – – –
Total Depreciation 1 938 879 2 145 381 2 145 381 152 198 902 288 1 072 690 170 403 15.9% 2 145 661
ETH eThekwini - Supporting Table SC13d Consolidated Monthly Budget Statement - depreciation by asset class - M06 December
Description Ref
66
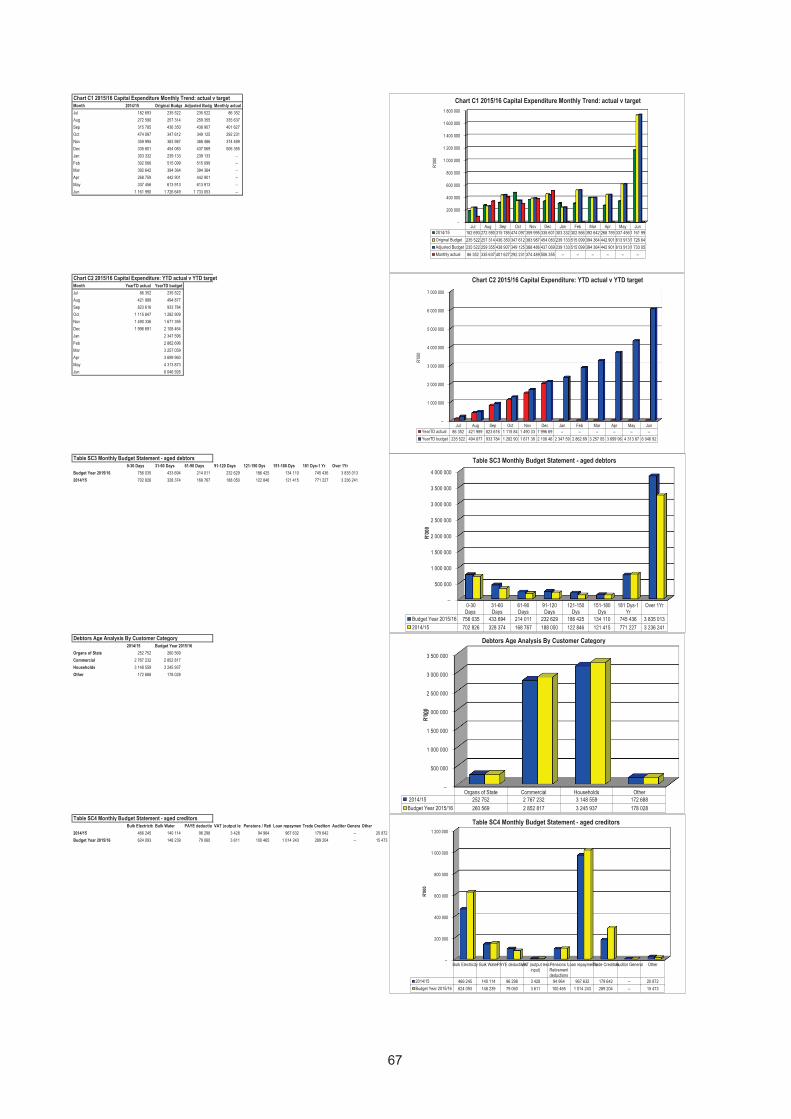
Chart C1 2015/16 Capital Expenditure Monthly Trend: actual v target
Month 2014/15 Original Budget Adjusted BudgetMonthly actual
Jul 182 693 235 522 235 522 86 352
Aug 272 590 257 314 259 355 335 637
Sep 315 785 436 350 438 907 401 627
Oct 474 097 347 612 349 125 292 231
Nov 359 995 383 987 388 486 374 489
Dec 335 601 454 083 437 069 506 355
Jan 303 332 239 133 239 133 –
Feb 302 566 515 099 515 099 –
Mar 392 642 394 364 394 364 –
Apr 268 759 442 901 442 901 –
May 337 456 613 913 613 913 –
Jun 1 161 990 1 726 649 1 733 053 –
Chart C2 2015/16 Capital Expenditure: YTD actual v YTD target
Month YearTD actual YearTD budget
Jul 86 352 235 522
Aug 421 989 494 877
Sep 823 616 933 784
Oct 1 115 847 1 282 909
Nov 1 490 336 1 671 395
Dec 1 996 691 2 108 464
Jan 2 347 596
Feb 2 862 696
Mar 3 257 059
Apr 3 699 960
May 4 313 873
Jun 6 046 926
Table SC3 Monthly Budget Statement - aged debtors
0-30 Days 31-60 Days 61-90 Days 91-120 Days 121-150 Dys 151-180 Dys 181 Dys-1 Yr Over 1Yr
Budget Year 2015/16 756 035 433 694 214 011 232 629 186 425 134 110 745 436 3 835 013
2014/15 702 826 328 374 168 767 188 050 122 846 121 415 771 227 3 236 241
Debtors Age Analysis By Customer Category
2014/15 Budget Year 2015/16
Organs of State 252 752 260 569
Commercial 2 767 232 2 852 817
Households 3 148 559 3 245 937
Other 172 688 178 028
Table SC4 Monthly Budget Statement - aged creditors
Bulk Electricity Bulk Water PAYE deductionsVAT (output less input)Pensions / Retirement deductionsLoan repaymentsTrade Creditors Auditor General Other
2014/15 466 245 140 114 96 298 3 428 94 964 967 632 179 642 – 20 872
Budget Year 2015/16 624 093 148 239 79 060 3 611 100 465 1 014 243 289 204 – 15 473
–
500 000
1 000 000
1 500 000
2 000 000
2 500 000
3 000 000
3 500 000
4 000 000
0-30Days
31-60Days
61-90Days
91-120Days
121-150Dys
151-180Dys
181 Dys-1Yr
Over 1Yr
Budget Year 2015/16 756 035 433 694 214 011 232 629 186 425 134 110 745 436 3 835 013
2014/15 702 826 328 374 168 767 188 050 122 846 121 415 771 227 3 236 241
R'0
00
Table SC3 Monthly Budget Statement - aged debtors
–
500 000
1 000 000
1 500 000
2 000 000
2 500 000
3 000 000
3 500 000
Organs of State Commercial Households Other
2014/15 252 752 2 767 232 3 148 559 172 688
Budget Year 2015/16 260 569 2 852 817 3 245 937 178 028
R'0
00
Debtors Age Analysis By Customer Category
–
200 000
400 000
600 000
800 000
1 000 000
1 200 000
Bulk Electricity Bulk WaterPAYE deductionsVAT (output lessinput)
Pensions /Retirementdeductions
Loan repaymentsTrade CreditorsAuditor General Other
2014/15 466 245 140 114 96 298 3 428 94 964 967 632 179 642 – 20 872
Budget Year 2015/16 624 093 148 239 79 060 3 611 100 465 1 014 243 289 204 – 15 473
R'0
00
Table SC4 Monthly Budget Statement - aged creditors
–
200 000
400 000
600 000
800 000
1 000 000
1 200 000
1 400 000
1 600 000
1 800 000
Jul Aug Sep Oct Nov Dec Jan Feb Mar Apr May Jun
2014/15 182 693 272 590 315 785 474 097 359 995 335 601 303 332 302 566 392 642 268 759 337 456 1 161 99
Original Budget 235 522 257 314 436 350 347 612 383 987 454 083 239 133 515 099 394 364 442 901 613 913 1 726 64
Adjusted Budget 235 522 259 355 438 907 349 125 388 486 437 069 239 133 515 099 394 364 442 901 613 913 1 733 05
Monthly actual 86 352 335 637 401 627 292 231 374 489 506 355 – – – – – –
R'0
00
Chart C1 2015/16 Capital Expenditure Monthly Trend: actual v target
–
1 000 000
2 000 000
3 000 000
4 000 000
5 000 000
6 000 000
7 000 000
Jul Aug Sep Oct Nov Dec Jan Feb Mar Apr May Jun
YearTD actual 86 352 421 989 823 616 1 115 84 1 490 33 1 996 69 – – – – – –
YearTD budget 235 522 494 877 933 784 1 282 90 1 671 39 2 108 46 2 347 59 2 862 69 3 257 05 3 699 96 4 313 87 6 046 92
R'0
00
Chart C2 2015/16 Capital Expenditure: YTD actual v YTD target
67
STAFF EXPENDITURE
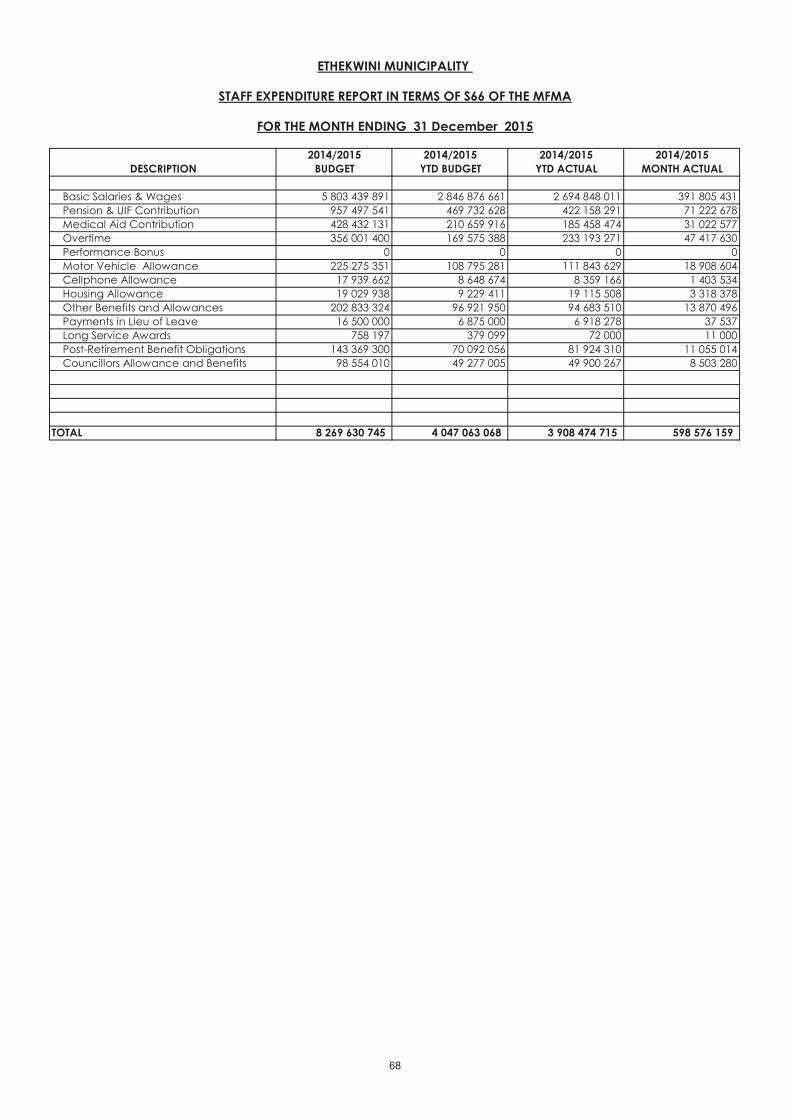
2014/2015 2014/2015 2014/2015 2014/2015
DESCRIPTION BUDGET YTD BUDGET YTD ACTUAL MONTH ACTUAL
Basic Salaries & Wages 5 803 439 891 2 846 876 661 2 694 848 011 391 805 431
Pension & UIF Contribution 957 497 541 469 732 628 422 158 291 71 222 678
Medical Aid Contribution 428 432 131 210 659 916 185 458 474 31 022 577
Overtime 356 001 400 169 575 388 233 193 271 47 417 630
Performance Bonus 0 0 0 0
Motor Vehicle Allowance 225 275 351 108 795 281 111 843 629 18 908 604
Cellphone Allowance 17 939 662 8 648 674 8 359 166 1 403 534
Housing Allowance 19 029 938 9 229 411 19 115 508 3 318 378
Other Benefits and Allowances 202 833 324 96 921 950 94 683 510 13 870 496
Payments in Lieu of Leave 16 500 000 6 875 000 6 918 278 37 537
Long Service Awards 758 197 379 099 72 000 11 000
Post-Retirement Benefit Obligations 143 369 300 70 092 056 81 924 310 11 055 014
Councillors Allowance and Benefits 98 554 010 49 277 005 49 900 267 8 503 280
TOTAL 8 269 630 745 4 047 063 068 3 908 474 715 598 576 159
ETHEKWINI MUNICIPALITY
STAFF EXPENDITURE REPORT IN TERMS OF S66 OF THE MFMA
FOR THE MONTH ENDING 31 December 2015
68
ANNEXURE 3
MUNICIPAL ENTITIES
ICC DURBAN (PTY) LTD
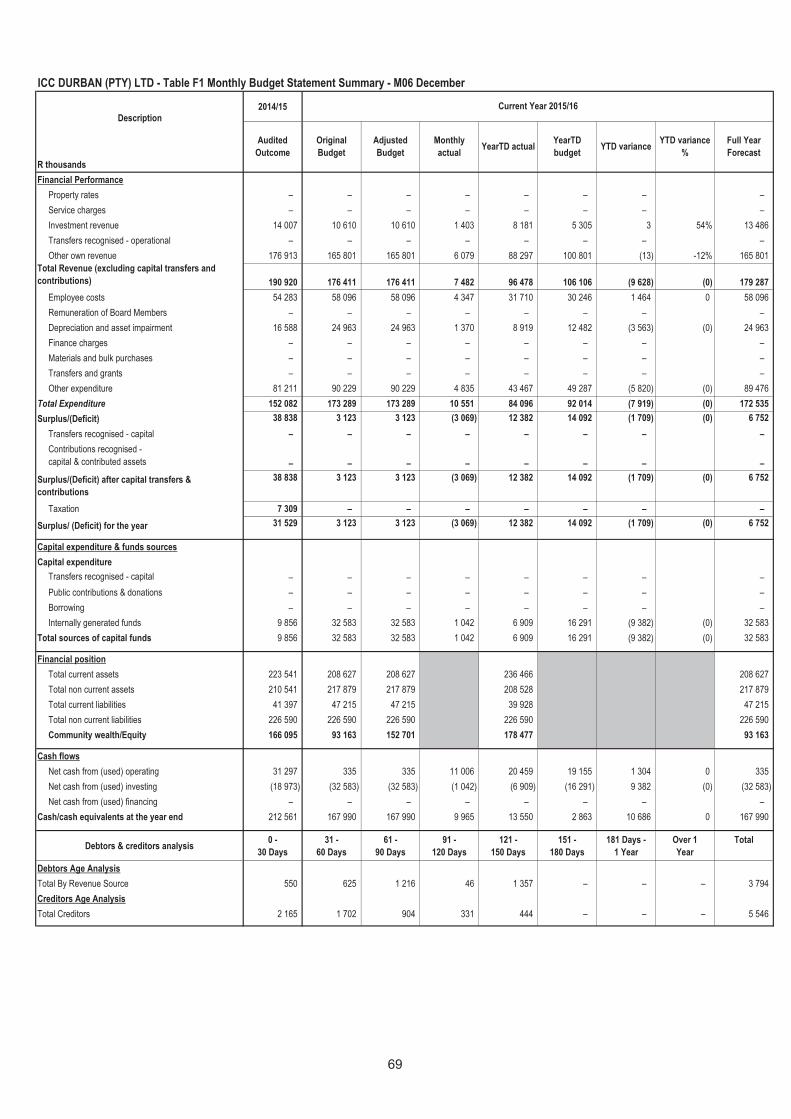
ICC DURBAN (PTY) LTD - Table F1 Monthly Budget Statement Summary - M06 December
2014/15
R thousands
Financial Performance
Property rates – – – – – – – –
Service charges – – – – – – – –
Investment revenue 14 007 10 610 10 610 1 403 8 181 5 305 3 54% 13 486
Transfers recognised - operational – – – – – – – –
Other own revenue 176 913 165 801 165 801 6 079 88 297 100 801 (13) -12% 165 801
Total Revenue (excluding capital transfers and
contributions) 190 920 176 411 176 411 7 482 96 478 106 106 (9 628) (0) 179 287
Employee costs 54 283 58 096 58 096 4 347 31 710 30 246 1 464 0 58 096
Remuneration of Board Members – – – – – – – –
Depreciation and asset impairment 16 588 24 963 24 963 1 370 8 919 12 482 (3 563) (0) 24 963
Finance charges – – – – – – – –
Materials and bulk purchases – – – – – – – –
Transfers and grants – – – – – – – –
Other expenditure 81 211 90 229 90 229 4 835 43 467 49 287 (5 820) (0) 89 476
Total Expenditure 152 082 173 289 173 289 10 551 84 096 92 014 (7 919) (0) 172 535
Surplus/(Deficit) 38 838 3 123 3 123 (3 069) 12 382 14 092 (1 709) (0) 6 752
Transfers recognised - capital – – – – – – – –
Contributions recognised -
capital & contributed assets – – – – – – – –
Surplus/(Deficit) after capital transfers &
contributions
38 838 3 123 3 123 (3 069) 12 382 14 092 (1 709) (0) 6 752
Taxation 7 309 – – – – – – –
Surplus/ (Deficit) for the year 31 529 3 123 3 123 (3 069) 12 382 14 092 (1 709) (0) 6 752
Capital expenditure & funds sources
Capital expenditure
Transfers recognised - capital – – – – – – – –
Public contributions & donations – – – – – – – –
Borrowing – – – – – – – –
Internally generated funds 9 856 32 583 32 583 1 042 6 909 16 291 (9 382) (0) 32 583
Total sources of capital funds 9 856 32 583 32 583 1 042 6 909 16 291 (9 382) (0) 32 583
Financial position
Total current assets 223 541 208 627 208 627 236 466 208 627
Total non current assets 210 541 217 879 217 879 208 528 217 879
Total current liabilities 41 397 47 215 47 215 39 928 47 215
Total non current liabilities 226 590 226 590 226 590 226 590 226 590
Community wealth/Equity 166 095 93 163 152 701 178 477 93 163
Cash flows
Net cash from (used) operating 31 297 335 335 11 006 20 459 19 155 1 304 0 335
Net cash from (used) investing (18 973) (32 583) (32 583) (1 042) (6 909) (16 291) 9 382 (0) (32 583)
Net cash from (used) financing – – – – – – – –
Cash/cash equivalents at the year end 212 561 167 990 167 990 9 965 13 550 2 863 10 686 0 167 990
Debtors & creditors analysis0 -
30 Days
31 -
60 Days
61 -
90 Days
91 -
120 Days
121 -
150 Days
151 -
180 Days
181 Days -
1 Year
Over 1
Year
Total
Debtors Age Analysis
Total By Revenue Source 550 625 1 216 46 1 357 – – – 3 794
Creditors Age Analysis
Total Creditors 2 165 1 702 904 331 444 – – – 5 546
Adjusted
Budget
Monthly
actualYearTD actual
YearTD
budget
Description
Original
Budget
Current Year 2015/16
Full Year
Forecast
Audited
OutcomeYTD variance
YTD variance
%
69
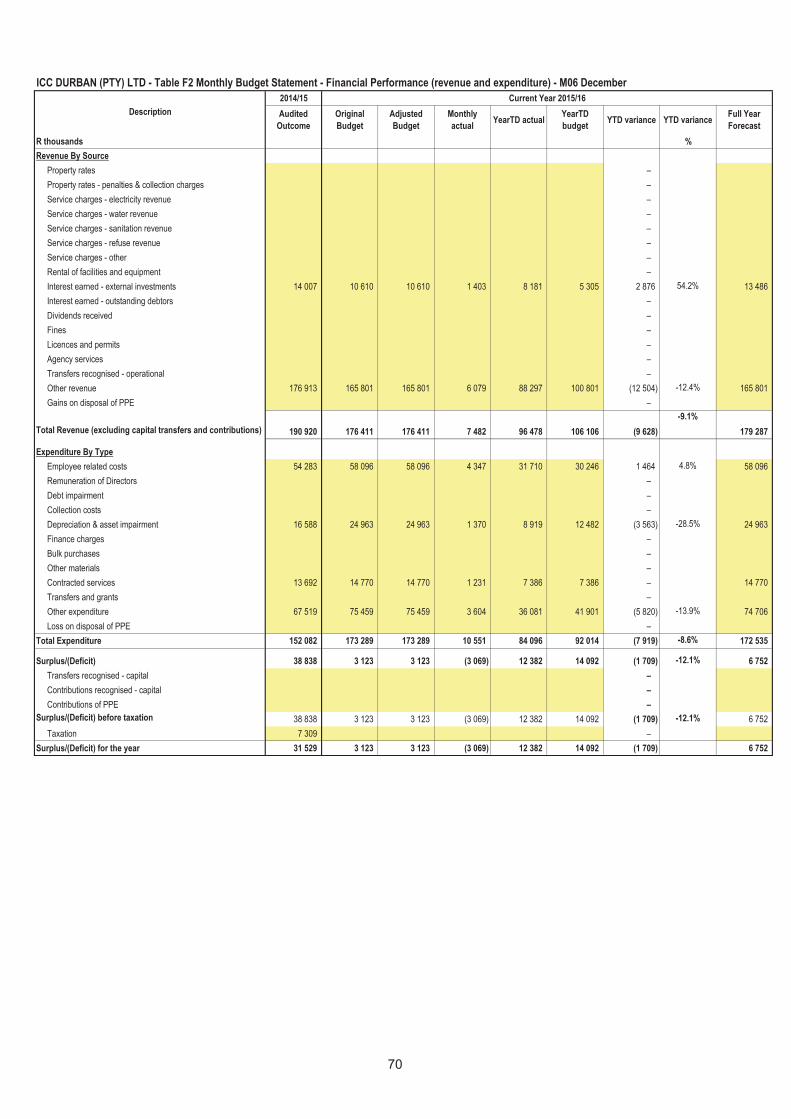
ICC DURBAN (PTY) LTD - Table F2 Monthly Budget Statement - Financial Performance (revenue and expenditure) - M06 December
2014/15 Current Year 2015/16
Audited
Outcome
Original
Budget
Adjusted
Budget
Monthly
actualYearTD actual
YearTD
budgetYTD variance YTD variance
Full Year
Forecast
R thousands %
Revenue By Source
Property rates –
Property rates - penalties & collection charges –
Service charges - electricity revenue –
Service charges - water revenue –
Service charges - sanitation revenue –
Service charges - refuse revenue –
Service charges - other –
Rental of facilities and equipment –
Interest earned - external investments 14 007 10 610 10 610 1 403 8 181 5 305 2 876 54.2% 13 486
Interest earned - outstanding debtors –
Dividends received –
Fines –
Licences and permits –
Agency services –
Transfers recognised - operational –
Other revenue 176 913 165 801 165 801 6 079 88 297 100 801 (12 504) -12.4% 165 801
Gains on disposal of PPE –
Total Revenue (excluding capital transfers and contributions) 190 920 176 411 176 411 7 482 96 478 106 106 (9 628)
-9.1%
179 287
Expenditure By Type
Employee related costs 54 283 58 096 58 096 4 347 31 710 30 246 1 464 4.8% 58 096
Remuneration of Directors –
Debt impairment –
Collection costs –
Depreciation & asset impairment 16 588 24 963 24 963 1 370 8 919 12 482 (3 563) -28.5% 24 963
Finance charges –
Bulk purchases –
Other materials –
Contracted services 13 692 14 770 14 770 1 231 7 386 7 386 – 14 770
Transfers and grants –
Other expenditure 67 519 75 459 75 459 3 604 36 081 41 901 (5 820) -13.9% 74 706
Loss on disposal of PPE –
Total Expenditure 152 082 173 289 173 289 10 551 84 096 92 014 (7 919) -8.6% 172 535
Surplus/(Deficit) 38 838 3 123 3 123 (3 069) 12 382 14 092 (1 709) -12.1% 6 752
Transfers recognised - capital –
Contributions recognised - capital –
Contributions of PPE –
Surplus/(Deficit) before taxation 38 838 3 123 3 123 (3 069) 12 382 14 092 (1 709) -12.1% 6 752
Taxation 7 309 –
Surplus/(Deficit) for the year 31 529 3 123 3 123 (3 069) 12 382 14 092 (1 709) 6 752
Description
70
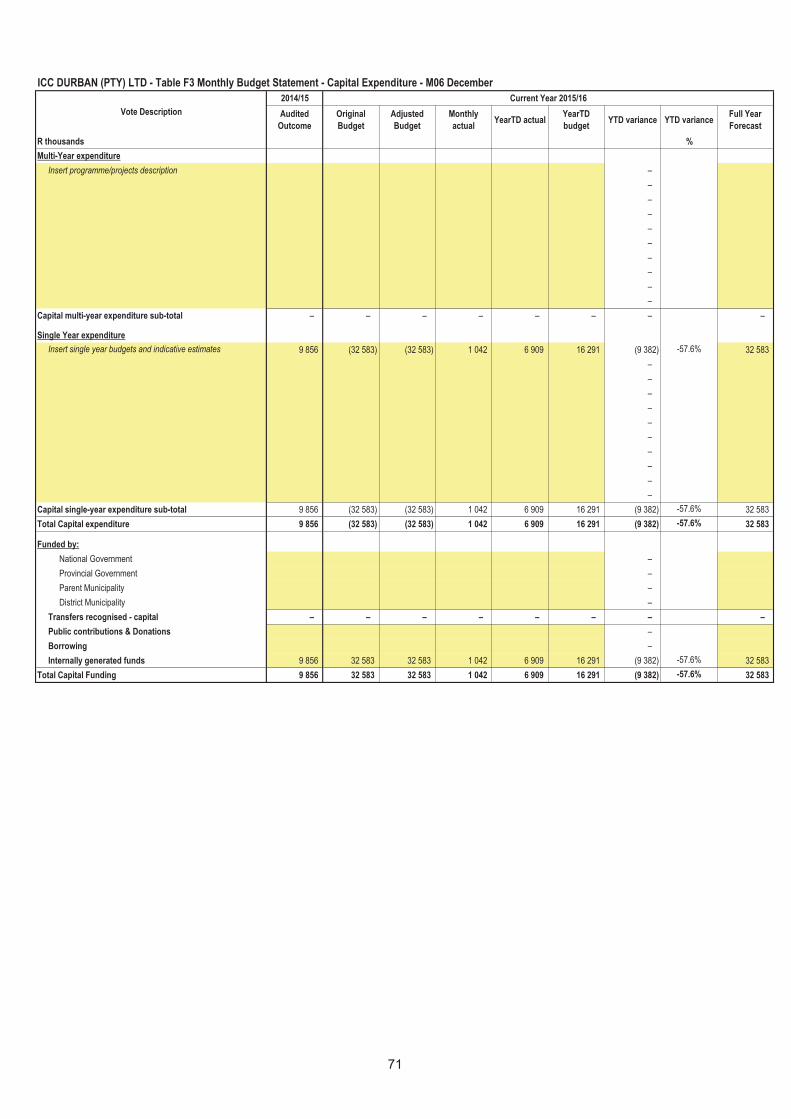
ICC DURBAN (PTY) LTD - Table F3 Monthly Budget Statement - Capital Expenditure - M06 December
2014/15 Current Year 2015/16
Audited
Outcome
Original
Budget
Adjusted
Budget
Monthly
actualYearTD actual
YearTD
budgetYTD variance YTD variance
Full Year
Forecast
R thousands %
Multi-Year expenditure
Insert programme/projects description –
–
–
–
–
–
–
–
–
–
Capital multi-year expenditure sub-total – – – – – – – –
Single Year expenditure
Insert single year budgets and indicative estimates 9 856 (32 583) (32 583) 1 042 6 909 16 291 (9 382) -57.6% 32 583
–
–
–
–
–
–
–
–
–
–
Capital single-year expenditure sub-total 9 856 (32 583) (32 583) 1 042 6 909 16 291 (9 382) -57.6% 32 583
Total Capital expenditure 9 856 (32 583) (32 583) 1 042 6 909 16 291 (9 382) -57.6% 32 583
Funded by:
National Government –
Provincial Government –
Parent Municipality –
District Municipality –
Transfers recognised - capital – – – – – – – –
Public contributions & Donations –
Borrowing –
Internally generated funds 9 856 32 583 32 583 1 042 6 909 16 291 (9 382) -57.6% 32 583
Total Capital Funding 9 856 32 583 32 583 1 042 6 909 16 291 (9 382) -57.6% 32 583
Vote Description
71
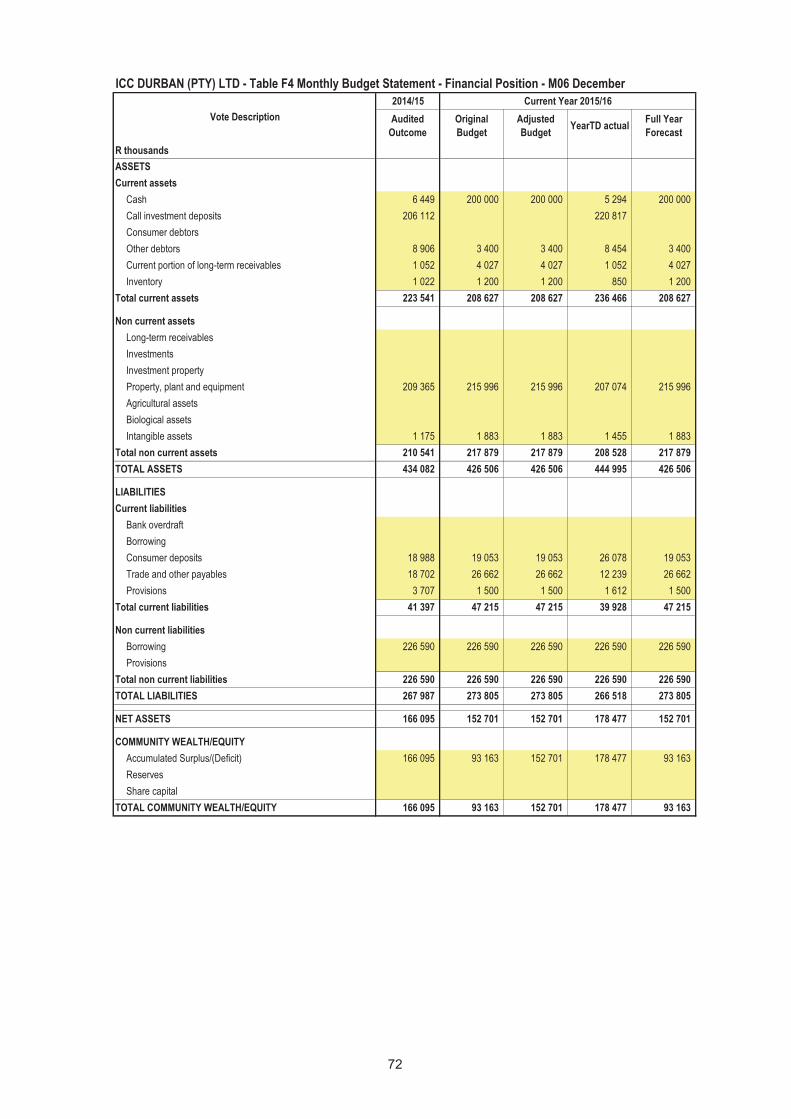
ICC DURBAN (PTY) LTD - Table F4 Monthly Budget Statement - Financial Position - M06 December
2014/15 Current Year 2015/16
Audited
Outcome
Original
Budget
Adjusted
BudgetYearTD actual
Full Year
Forecast
R thousands
ASSETS
Current assets
Cash 6 449 200 000 200 000 5 294 200 000
Call investment deposits 206 112 220 817
Consumer debtors
Other debtors 8 906 3 400 3 400 8 454 3 400
Current portion of long-term receivables 1 052 4 027 4 027 1 052 4 027
Inventory 1 022 1 200 1 200 850 1 200
Total current assets 223 541 208 627 208 627 236 466 208 627
Non current assets
Long-term receivables
Investments
Investment property
Property, plant and equipment 209 365 215 996 215 996 207 074 215 996
Agricultural assets
Biological assets
Intangible assets 1 175 1 883 1 883 1 455 1 883
Total non current assets 210 541 217 879 217 879 208 528 217 879
TOTAL ASSETS 434 082 426 506 426 506 444 995 426 506
LIABILITIES
Current liabilities
Bank overdraft
Borrowing
Consumer deposits 18 988 19 053 19 053 26 078 19 053
Trade and other payables 18 702 26 662 26 662 12 239 26 662
Provisions 3 707 1 500 1 500 1 612 1 500
Total current liabilities 41 397 47 215 47 215 39 928 47 215
Non current liabilities
Borrowing 226 590 226 590 226 590 226 590 226 590
Provisions
Total non current liabilities 226 590 226 590 226 590 226 590 226 590
TOTAL LIABILITIES 267 987 273 805 273 805 266 518 273 805
NET ASSETS 166 095 152 701 152 701 178 477 152 701
COMMUNITY WEALTH/EQUITY
Accumulated Surplus/(Deficit) 166 095 93 163 152 701 178 477 93 163
Reserves
Share capital
TOTAL COMMUNITY WEALTH/EQUITY 166 095 93 163 152 701 178 477 93 163
Vote Description
72
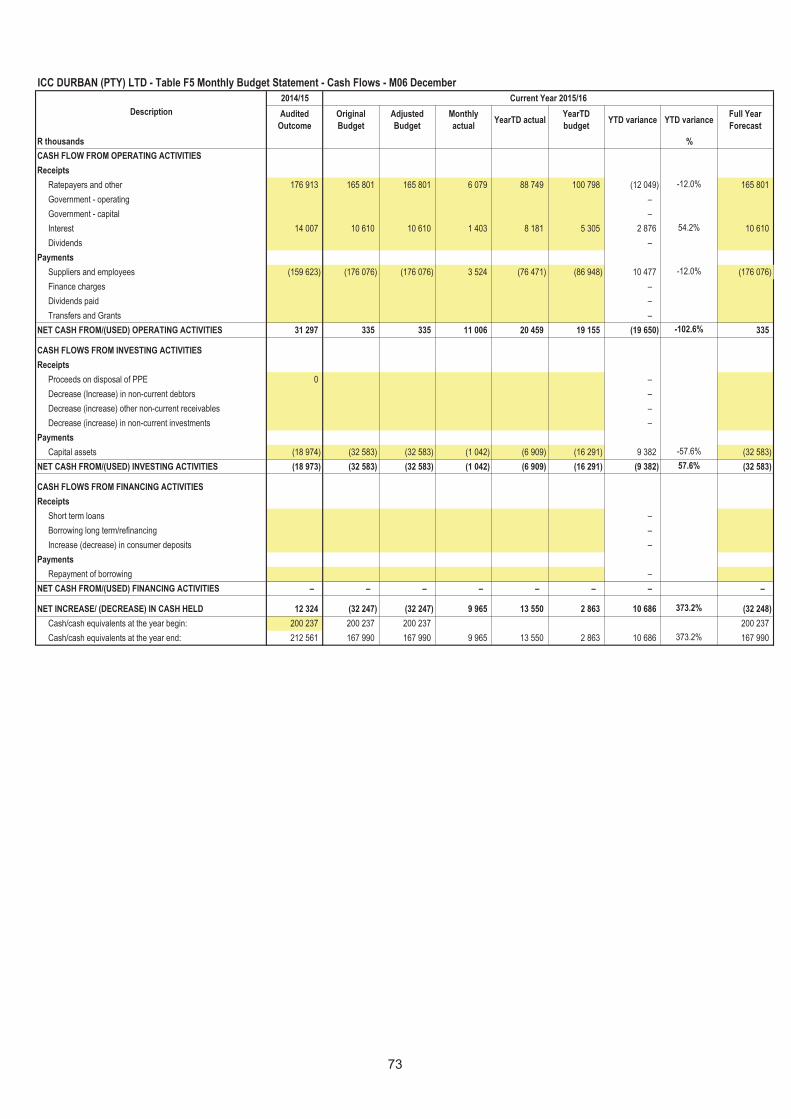
ICC DURBAN (PTY) LTD - Table F5 Monthly Budget Statement - Cash Flows - M06 December
2014/15 Current Year 2015/16
Audited
Outcome
Original
Budget
Adjusted
Budget
Monthly
actualYearTD actual
YearTD
budgetYTD variance YTD variance
Full Year
Forecast
R thousands %
CASH FLOW FROM OPERATING ACTIVITIES
Receipts
Ratepayers and other 176 913 165 801 165 801 6 079 88 749 100 798 (12 049) -12.0% 165 801
Government - operating –
Government - capital –
Interest 14 007 10 610 10 610 1 403 8 181 5 305 2 876 54.2% 10 610
Dividends –
Payments
Suppliers and employees (159 623) (176 076) (176 076) 3 524 (76 471) (86 948) 10 477 -12.0% (176 076)
Finance charges –
Dividends paid –
Transfers and Grants –
NET CASH FROM/(USED) OPERATING ACTIVITIES 31 297 335 335 11 006 20 459 19 155 (19 650) -102.6% 335
CASH FLOWS FROM INVESTING ACTIVITIES
Receipts
Proceeds on disposal of PPE 0 –
Decrease (Increase) in non-current debtors –
Decrease (increase) other non-current receivables –
Decrease (increase) in non-current investments –
Payments
Capital assets (18 974) (32 583) (32 583) (1 042) (6 909) (16 291) 9 382 -57.6% (32 583)
NET CASH FROM/(USED) INVESTING ACTIVITIES (18 973) (32 583) (32 583) (1 042) (6 909) (16 291) (9 382) 57.6% (32 583)
CASH FLOWS FROM FINANCING ACTIVITIES
Receipts
Short term loans –
Borrowing long term/refinancing –
Increase (decrease) in consumer deposits –
Payments
Repayment of borrowing –
NET CASH FROM/(USED) FINANCING ACTIVITIES – – – – – – – –
NET INCREASE/ (DECREASE) IN CASH HELD 12 324 (32 247) (32 247) 9 965 13 550 2 863 10 686 373.2% (32 248)
Cash/cash equivalents at the year begin: 200 237 200 237 200 237 200 237
Cash/cash equivalents at the year end: 212 561 167 990 167 990 9 965 13 550 2 863 10 686 373.2% 167 990
Description
73
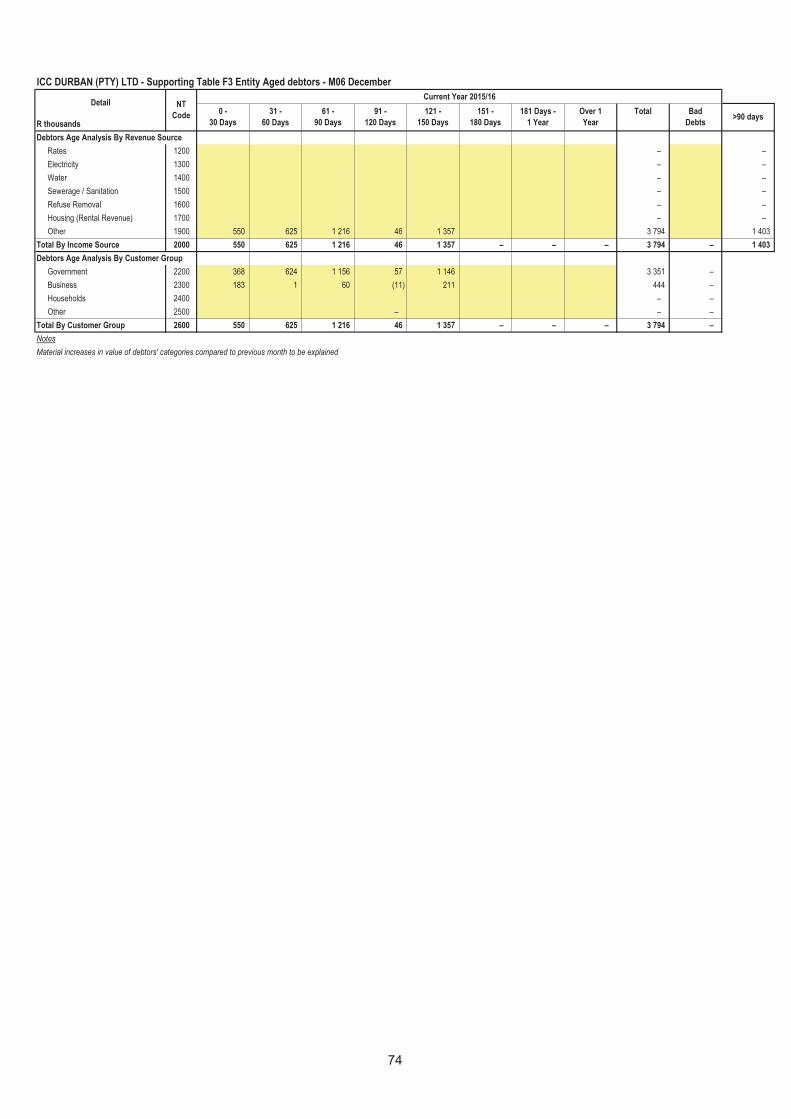
ICC DURBAN (PTY) LTD - Supporting Table F3 Entity Aged debtors - M06 December
Current Year 2015/16
R thousands
Debtors Age Analysis By Revenue Source
Rates 1200 – –
Electricity 1300 – –
Water 1400 – –
Sewerage / Sanitation 1500 – –
Refuse Removal 1600 – –
Housing (Rental Revenue) 1700 – –
Other 1900 550 625 1 216 46 1 357 3 794 1 403
Total By Income Source 2000 550 625 1 216 46 1 357 – – – 3 794 – 1 403
Debtors Age Analysis By Customer Group
Government 2200 368 624 1 156 57 1 146 3 351 –
Business 2300 183 1 60 (11) 211 444 –
Households 2400 – –
Other 2500 – – –
Total By Customer Group 2600 550 625 1 216 46 1 357 – – – 3 794 –
Notes
Material increases in value of debtors' categories compared to previous month to be explained
91 -
120 Days
121 -
150 Days
151 -
180 Days>90 days
181 Days -
1 Year
Over 1
Year
Total Bad
Debts
Detail NT
Code0 -
30 Days
31 -
60 Days
61 -
90 Days
74
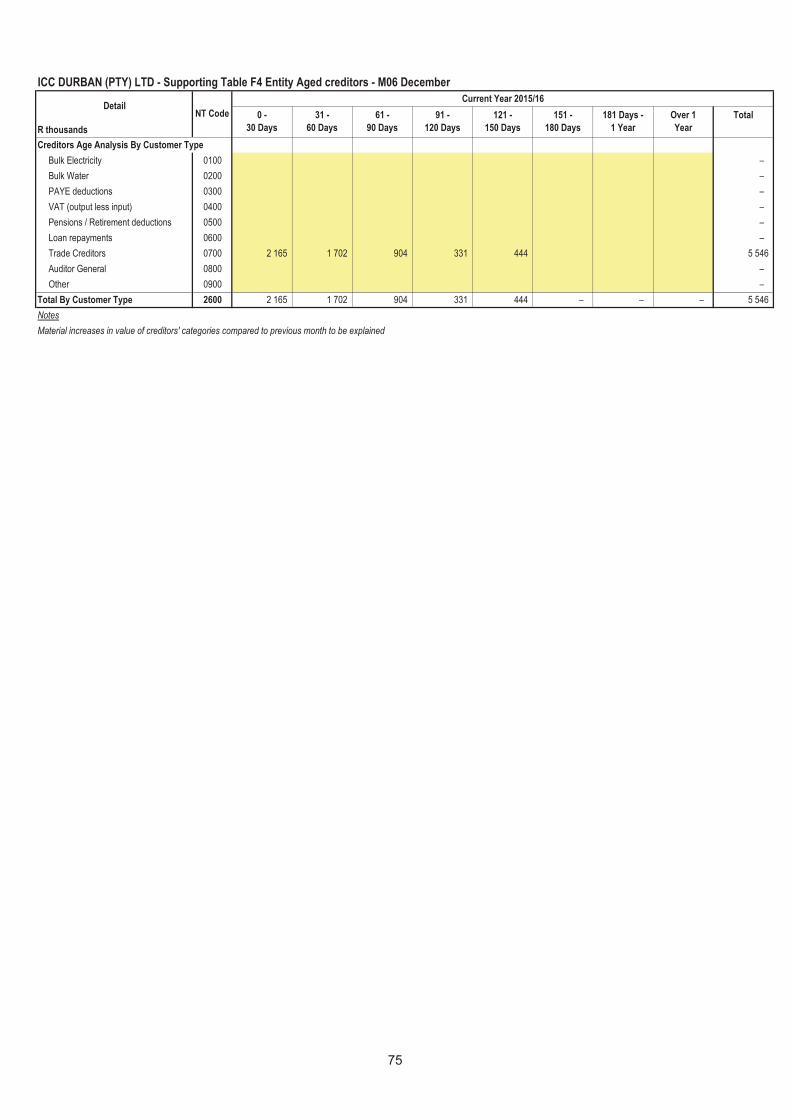
ICC DURBAN (PTY) LTD - Supporting Table F4 Entity Aged creditors - M06 December
Current Year 2015/16
R thousands
Creditors Age Analysis By Customer Type
Bulk Electricity 0100 –
Bulk Water 0200 –
PAYE deductions 0300 –
VAT (output less input) 0400 –
Pensions / Retirement deductions 0500 –
Loan repayments 0600 –
Trade Creditors 0700 2 165 1 702 904 331 444 5 546
Auditor General 0800 –
Other 0900 –
Total By Customer Type 2600 2 165 1 702 904 331 444 – – – 5 546
Notes
Material increases in value of creditors' categories compared to previous month to be explained
181 Days -
1 Year
Over 1
Year
Total61 -
90 Days
91 -
120 Days
121 -
150 Days
DetailNT Code 0 -
30 Days
31 -
60 Days
151 -
180 Days
75
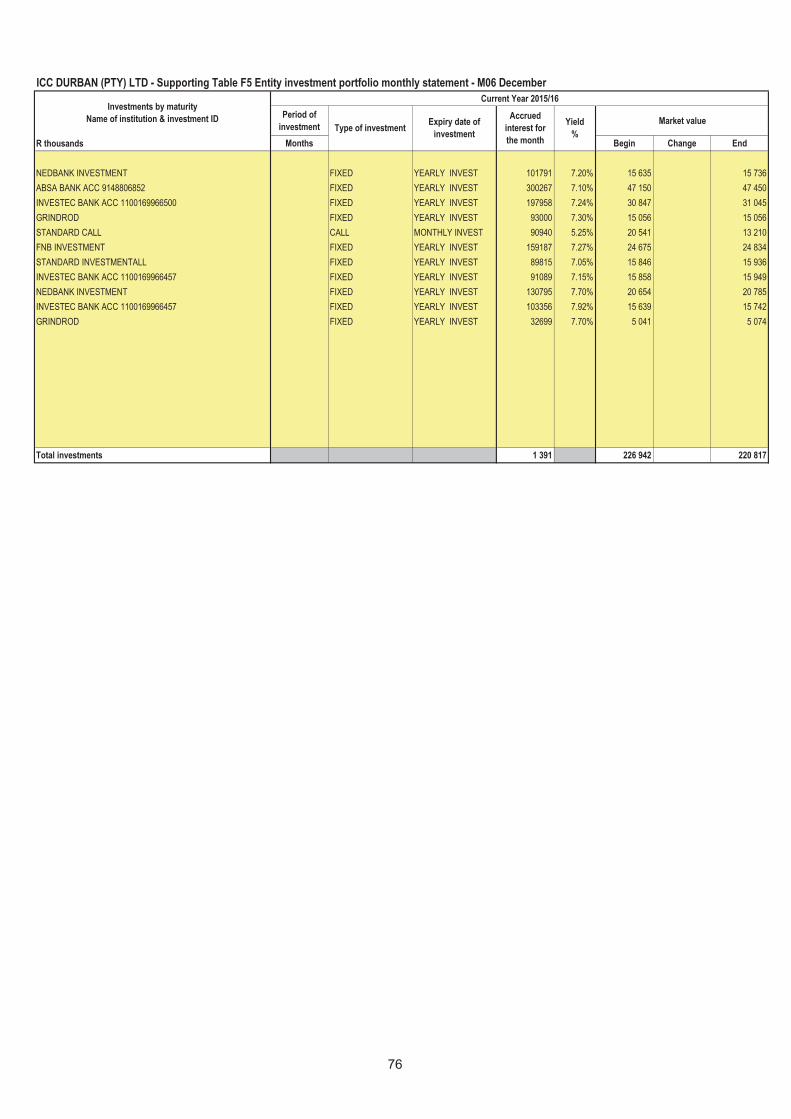
ICC DURBAN (PTY) LTD - Supporting Table F5 Entity investment portfolio monthly statement - M06 December
Current Year 2015/16
Period of
investmentMarket value
R thousands Months Begin Change End
NEDBANK INVESTMENT FIXED YEARLY INVEST 101791 7.20% 15 635 15 736
ABSA BANK ACC 9148806852 FIXED YEARLY INVEST 300267 7.10% 47 150 47 450
INVESTEC BANK ACC 1100169966500 FIXED YEARLY INVEST 197958 7.24% 30 847 31 045
GRINDROD FIXED YEARLY INVEST 93000 7.30% 15 056 15 056
STANDARD CALL CALL MONTHLY INVEST 90940 5.25% 20 541 13 210
FNB INVESTMENT FIXED YEARLY INVEST 159187 7.27% 24 675 24 834
STANDARD INVESTMENTALL FIXED YEARLY INVEST 89815 7.05% 15 846 15 936
INVESTEC BANK ACC 1100169966457 FIXED YEARLY INVEST 91089 7.15% 15 858 15 949
NEDBANK INVESTMENT FIXED YEARLY INVEST 130795 7.70% 20 654 20 785
INVESTEC BANK ACC 1100169966457 FIXED YEARLY INVEST 103356 7.92% 15 639 15 742
GRINDROD FIXED YEARLY INVEST 32699 7.70% 5 041 5 074
Total investments 1 391 226 942 220 817
Accrued
interest for
the month
Yield
%
Investments by maturity
Name of institution & investment IDType of investment
Expiry date of
investment
76
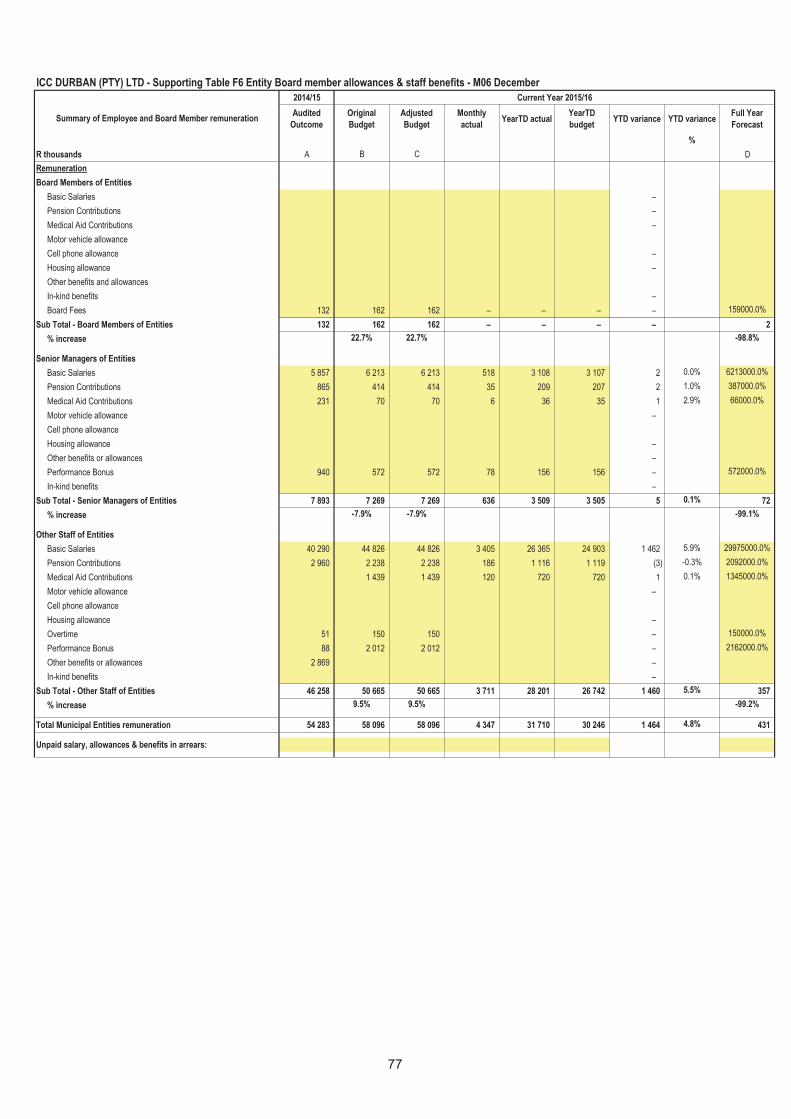
ICC DURBAN (PTY) LTD - Supporting Table F6 Entity Board member allowances & staff benefits - M06 December
2014/15 Current Year 2015/16
Audited
Outcome
Original
Budget
Adjusted
Budget
Monthly
actualYearTD actual
YearTD
budgetYTD variance YTD variance
Full Year
Forecast
%
R thousands A B C D
Remuneration
Board Members of Entities
Basic Salaries –
Pension Contributions –
Medical Aid Contributions –
Motor vehicle allowance
Cell phone allowance –
Housing allowance –
Other benefits and allowances
In-kind benefits –
Board Fees 132 162 162 – – – – 159000.0%
Sub Total - Board Members of Entities 132 162 162 – – – – 2
% increase 22.7% 22.7% -98.8%
Senior Managers of Entities
Basic Salaries 5 857 6 213 6 213 518 3 108 3 107 2 0.0% 6213000.0%
Pension Contributions 865 414 414 35 209 207 2 1.0% 387000.0%
Medical Aid Contributions 231 70 70 6 36 35 1 2.9% 66000.0%
Motor vehicle allowance –
Cell phone allowance
Housing allowance –
Other benefits or allowances –
Performance Bonus 940 572 572 78 156 156 – 572000.0%
In-kind benefits –
Sub Total - Senior Managers of Entities 7 893 7 269 7 269 636 3 509 3 505 5 0.1% 72
% increase -7.9% -7.9% -99.1%
Other Staff of Entities
Basic Salaries 40 290 44 826 44 826 3 405 26 365 24 903 1 462 5.9% 29975000.0%
Pension Contributions 2 960 2 238 2 238 186 1 116 1 119 (3) -0.3% 2092000.0%
Medical Aid Contributions 1 439 1 439 120 720 720 1 0.1% 1345000.0%
Motor vehicle allowance –
Cell phone allowance
Housing allowance –
Overtime 51 150 150 – 150000.0%
Performance Bonus 88 2 012 2 012 – 2162000.0%
Other benefits or allowances 2 869 –
In-kind benefits –
Sub Total - Other Staff of Entities 46 258 50 665 50 665 3 711 28 201 26 742 1 460 5.5% 357
% increase 9.5% 9.5% -99.2%
Total Municipal Entities remuneration 54 283 58 096 58 096 4 347 31 710 30 246 1 464 4.8% 431
Unpaid salary, allowances & benefits in arrears:
Summary of Employee and Board Member remuneration
77
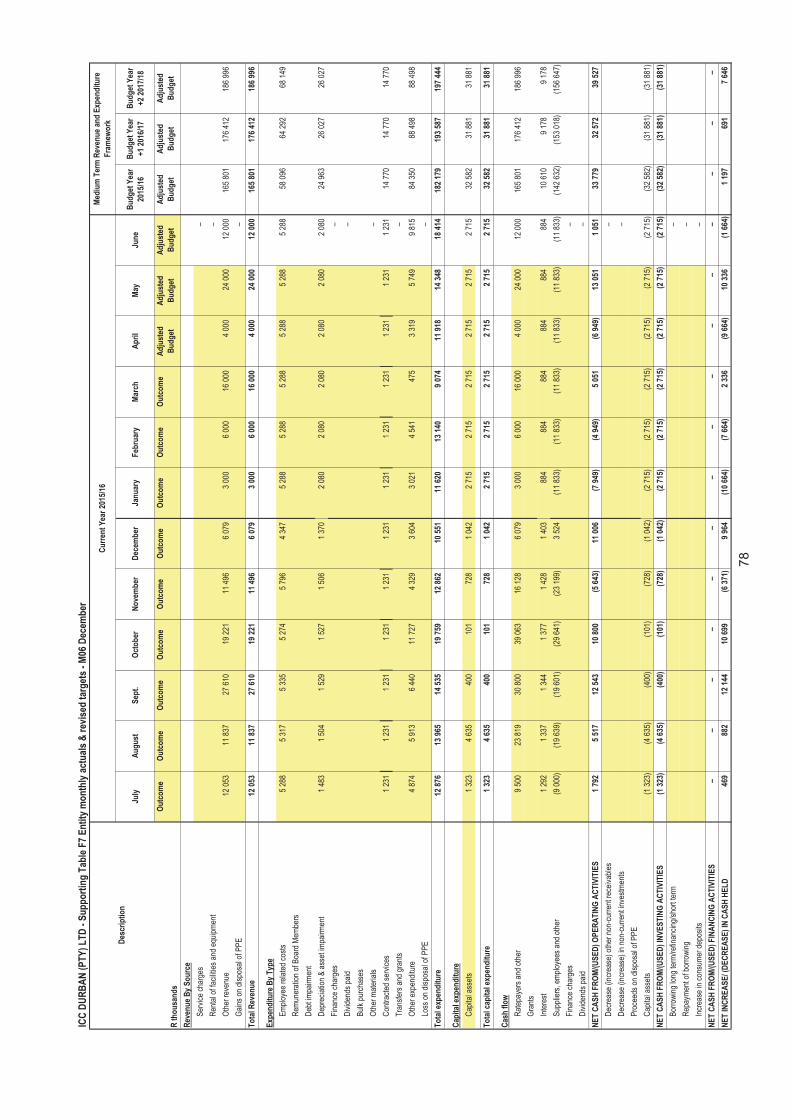
ICC
DU
RB
AN
(P
TY
) L
TD
- S
up
po
rtin
g T
able
F7
En
tity
mo
nth
ly a
ctu
als
& r
evis
ed t
arg
ets
- M
06 D
ecem
ber
July
Au
gu
stS
ept.
Oct
ob
erN
ove
mb
erD
ecem
ber
Jan
uar
yF
ebru
ary
Mar
chA
pri
lM
ayJu
ne
Bu
dg
et Y
ear
2015
/16
Bu
dg
et Y
ear
+1
2016
/17
Bu
dg
et Y
ear
+2
2017
/18
R t
ho
usa
nd
s
Ou
tco
me
Ou
tco
me
Ou
tco
me
Ou
tco
me
Ou
tco
me
Ou
tco
me
Ou
tco
me
Ou
tco
me
Ou
tco
me
Ad
just
ed
Bu
dg
et
Ad
just
ed
Bu
dg
et
Ad
just
ed
Bu
dg
et
Ad
just
ed
Bu
dg
et
Ad
just
ed
Bu
dg
et
Ad
just
ed
Bu
dg
et
Rev
enu
e B
y S
ou
rce
Ser
vice
cha
rges
–
Ren
tal o
f fac
ilitie
s an
d eq
uipm
ent
–
Oth
er r
even
ue12
053
11 8
37
27
610
19 2
21
11
496
6 07
9
3 00
0
6 00
0
16 0
00
4
000
24
000
12 0
00
16
5 80
1
17
6 41
2
18
6 99
6
Gai
ns o
n di
spos
al o
f PP
E–
To
tal R
even
ue
12 0
53
11
837
27 6
10
19
221
11 4
96
6
079
3
000
6
000
16
000
4 00
0
24 0
00
12
000
165
801
176
412
186
996
Exp
end
itu
re B
y T
ype
Em
ploy
ee r
elat
ed c
osts
5 28
8
5 31
7
5 33
5
5 27
4
5 79
6
4 34
7
5 28
8
5 28
8
5 28
8
5 28
8
5 28
8
5 28
8
58 0
96
64
292
68 1
49
Rem
uner
atio
n of
Boa
rd M
embe
rs
Deb
t im
pairm
ent
Dep
reci
atio
n &
ass
et im
pairm
ent
1 48
3
1 50
4
1 52
9
1 52
7
1 50
6
1 37
0
2 08
0
2 08
0
2 08
0
2 08
0
2 08
0
2 08
0
24 9
63
26
027
26 0
27
Fin
ance
cha
rges
–
Div
iden
ds p
aid
–
Bul
k pu
rcha
ses
Oth
er m
ater
ials
–
Con
trac
ted
serv
ices
1 23
1
1 23
1
1 23
1
1 23
1
1 23
1
1 23
1
1 23
1
1 23
1
1 23
1
1 23
1
1 23
1
1 23
1
14 7
70
14
770
14 7
70
Tra
nsfe
rs a
nd g
rant
s–
Oth
er e
xpen
ditu
re4
874
5
913
6
440
11
727
4 32
9
3 60
4
3 02
1
4 54
1
475
3 31
9
5 74
9
9 81
5
84 3
50
88
498
88 4
98
Loss
on
disp
osal
of P
PE
–
To
tal e
xpen
dit
ure
12 8
76
13
965
14 5
35
19
759
12 8
62
10
551
11 6
20
13
140
9 07
4
11 9
18
14
348
18 4
14
18
2 17
9
19
3 58
7
19
7 44
4
Cap
ital
exp
end
itu
re
Cap
ital a
sset
s1
323
4
635
40
0
10
1
72
8
1
042
2
715
2
715
2
715
2
715
2
715
2
715
32
582
31 8
81
31
881
–
–
–
–
–
–
–
–
–
–
–
–
To
tal c
apit
al e
xpen
dit
ure
1 32
3
4 63
5
400
101
728
1 04
2
2 71
5
2 71
5
2 71
5
2 71
5
2 71
5
2 71
5
32 5
82
31
881
31 8
81
Cas
h f
low
Rat
epay
ers
and
othe
r9
500
23
819
30 8
00
39
063
16 1
28
6
079
3
000
6
000
16
000
4 00
0
24 0
00
12
000
165
801
176
412
186
996
Gra
nts
Inte
rest
1 29
2
1 33
7
1 34
4
1 37
7
1 42
8
1 40
3
884
884
884
884
884
884
10 6
10
9
178
9
178
Sup
plie
rs, e
mpl
oyee
s an
d ot
her
(9 0
00)
(1
9 63
9)
(1
9 60
1)
(2
9 64
1)
(2
3 19
9)
3
524
(1
1 83
3)
(1
1 83
3)
(1
1 83
3)
(1
1 83
3)
(1
1 83
3)
(1
1 83
3)
(1
42 6
32)
(1
53 0
18)
(1
56 6
47)
Fin
ance
cha
rges
–
Div
iden
ds p
aid
–
NE
T C
AS
H F
RO
M/(
US
ED
) O
PE
RA
TIN
G A
CT
IVIT
IES
1 79
2
5 51
7
12 5
43
10
800
(5 6
43)
11
006
(7 9
49)
(4
949
)
5 05
1
(6 9
49)
13
051
1 05
1
33 7
79
32
572
39 5
27
Dec
reas
e (in
crea
se)
othe
r no
n-cu
rren
t rec
eiva
bles
–
Dec
reas
e (in
crea
se)
in n
on-c
urre
nt in
vest
men
ts–
Pro
ceed
s on
dis
posa
l of P
PE
Cap
ital a
sset
s(1
323
)
(4 6
35)
(4
00)
(101
)
(7
28)
(1 0
42)
(2
715
)
(2 7
15)
(2
715
)
(2 7
15)
(2
715
)
(2 7
15)
(3
2 58
2)
(3
1 88
1)
(3
1 88
1)
NE
T C
AS
H F
RO
M/(
US
ED
) IN
VE
ST
ING
AC
TIV
ITIE
S(1
323
)
(4 6
35)
(4
00)
(101
)
(7
28)
(1 0
42)
(2
715
)
(2 7
15)
(2
715
)
(2 7
15)
(2
715
)
(2 7
15)
(3
2 58
2)
(3
1 88
1)
(3
1 88
1)
Bor
row
ing
long
term
/ref
inan
cing
/sho
rt te
rm–
Rep
aym
ent o
f bor
row
ing
–
Incr
ease
in c
onsu
mer
dep
osits
–
NE
T C
AS
H F
RO
M/(
US
ED
) F
INA
NC
ING
AC
TIV
ITIE
S–
–
–
–
–
–
–
–
–
–
–
–
–
–
–
NE
T IN
CR
EA
SE
/ (D
EC
RE
AS
E)
IN C
AS
H H
EL
D46
9
88
2
12
144
10 6
99
(6
371
)
9 96
4
(10
664)
(7 6
64)
2
336
(9
664
)
10 3
36
(1
664
)
1 19
7
691
7 64
6
Des
crip
tio
n
Cu
rren
t Y
ear
2015
/16
Med
ium
Ter
m R
even
ue
and
Exp
end
itu
re
Fra
mew
ork
78
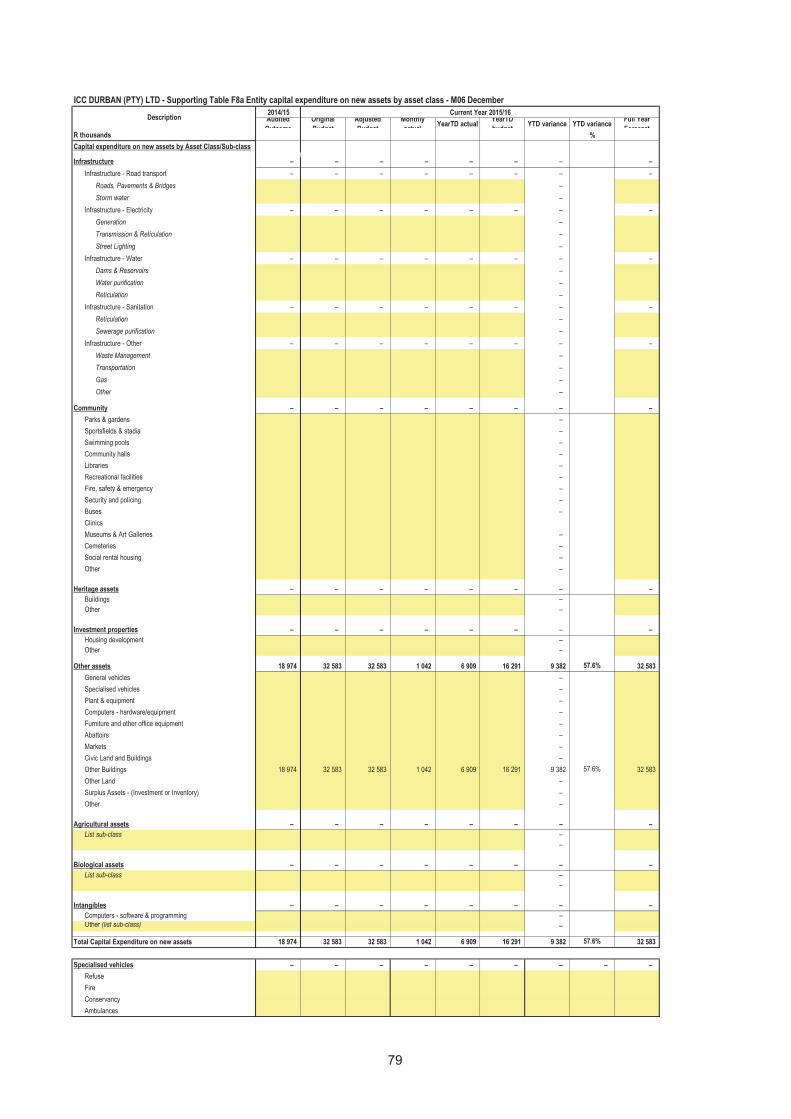
ICC DURBAN (PTY) LTD - Supporting Table F8a Entity capital expenditure on new assets by asset class - M06 December
2014/15 Current Year 2015/16Audited
Outcome
Original
Budget
Adjusted
Budget
Monthly
actualYearTD actual
YearTD
budgetYTD variance YTD variance
Full Year
ForecastR thousands %
Capital expenditure on new assets by Asset Class/Sub-class
Infrastructure – – – – – – – –
Infrastructure - Road transport – – – – – – – –
Roads, Pavements & Bridges –
Storm water –
Infrastructure - Electricity – – – – – – – –
Generation –
Transmission & Reticulation –
Street Lighting –
Infrastructure - Water – – – – – – – –
Dams & Reservoirs –
Water purification –
Reticulation –
Infrastructure - Sanitation – – – – – – – –
Reticulation –
Sewerage purification –
Infrastructure - Other – – – – – – – –
Waste Management –
Transportation –
Gas –
Other –
Community – – – – – – – –
Parks & gardens –
Sportsfields & stadia –
Swimming pools –
Community halls –
Libraries –
Recreational facilities –
Fire, safety & emergency –
Security and policing –
Buses –
Clinics
Museums & Art Galleries –
Cemeteries –
Social rental housing –
Other – –
Heritage assets – – – – – – – –
Buildings –
Other – –
Investment properties – – – – – – – –
Housing development –
Other –
Other assets 18 974 32 583 32 583 1 042 6 909 16 291 9 382 57.6% 32 583
General vehicles –
Specialised vehicles –
Plant & equipment –
Computers - hardware/equipment –
Furniture and other office equipment –
Abattoirs –
Markets –
Civic Land and Buildings –
Other Buildings 18 974 32 583 32 583 1 042 6 909 16 291 9 382 57.6% 32 583
Other Land –
Surplus Assets - (Investment or Inventory) –
Other –
Agricultural assets – – – – – – – –
List sub-class –
–
Biological assets – – – – – – – –
List sub-class –
–
Intangibles – – – – – – – –
Computers - software & programming –
Other (list sub-class) –
Total Capital Expenditure on new assets 18 974 32 583 32 583 1 042 6 909 16 291 9 382 57.6% 32 583
Specialised vehicles – – – – – – – – –
Refuse
Fire
Conservancy
Ambulances
Description
79
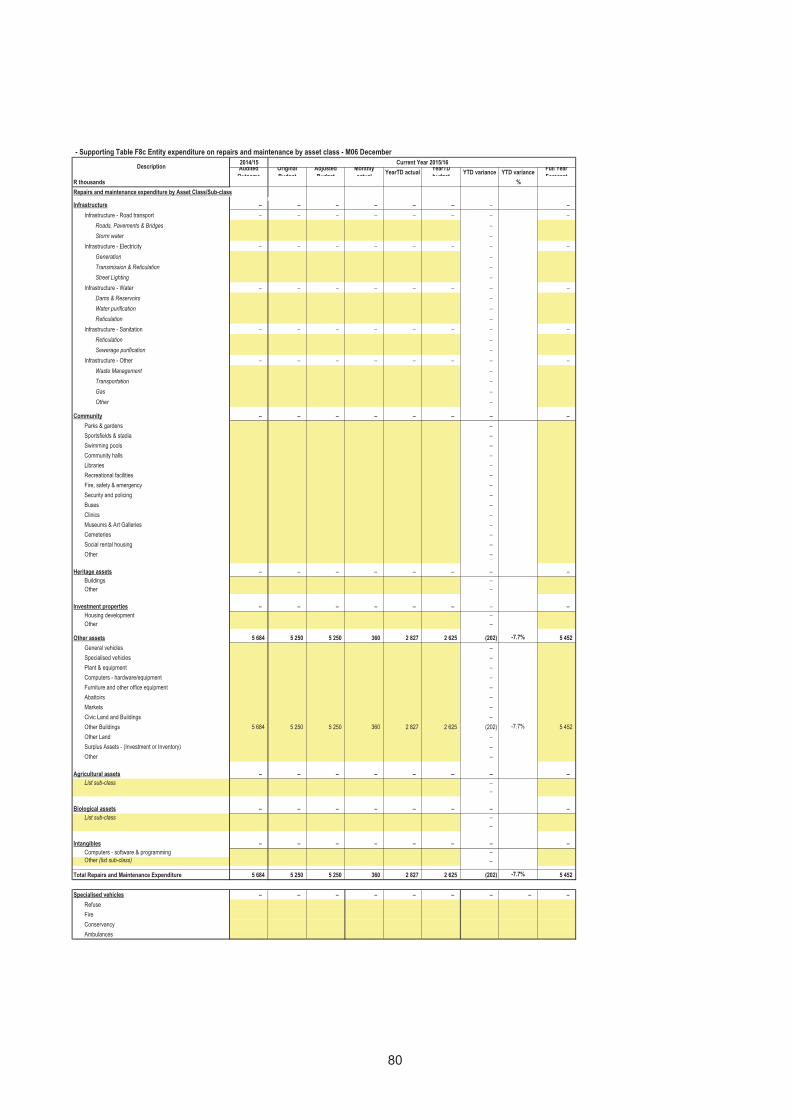
- Supporting Table F8c Entity expenditure on repairs and maintenance by asset class - M06 December
2014/15 Current Year 2015/16Audited
Outcome
Original
Budget
Adjusted
Budget
Monthly
actualYearTD actual
YearTD
budgetYTD variance YTD variance
Full Year
ForecastR thousands %
Repairs and maintenance expenditure by Asset Class/Sub-class
Infrastructure – – – – – – – –
Infrastructure - Road transport – – – – – – – –
Roads, Pavements & Bridges –
Storm water –
Infrastructure - Electricity – – – – – – – –
Generation –
Transmission & Reticulation –
Street Lighting –
Infrastructure - Water – – – – – – – –
Dams & Reservoirs –
Water purification –
Reticulation –
Infrastructure - Sanitation – – – – – – – –
Reticulation –
Sewerage purification –
Infrastructure - Other – – – – – – – –
Waste Management –
Transportation –
Gas –
Other –
Community – – – – – – – –
Parks & gardens –
Sportsfields & stadia –
Swimming pools –
Community halls –
Libraries –
Recreational facilities –
Fire, safety & emergency –
Security and policing –
Buses –
Clinics –
Museums & Art Galleries –
Cemeteries –
Social rental housing –
Other – –
Heritage assets – – – – – – – –
Buildings –
Other – –
Investment properties – – – – – – – –
Housing development –
Other –
Other assets 5 684 5 250 5 250 360 2 827 2 625 (202) -7.7% 5 452
General vehicles –
Specialised vehicles –
Plant & equipment –
Computers - hardware/equipment –
Furniture and other office equipment –
Abattoirs –
Markets –
Civic Land and Buildings –
Other Buildings 5 684 5 250 5 250 360 2 827 2 625 (202) -7.7% 5 452
Other Land –
Surplus Assets - (Investment or Inventory) –
Other –
Agricultural assets – – – – – – – –
List sub-class –
–
Biological assets – – – – – – – –
List sub-class –
–
Intangibles – – – – – – – –
Computers - software & programming –
Other (list sub-class) –
Total Repairs and Maintenance Expenditure 5 684 5 250 5 250 360 2 827 2 625 (202) -7.7% 5 452
Specialised vehicles – – – – – – – – –
Refuse
Fire
Conservancy
Ambulances
Description
80
DURBAN MARINE
THEME PARK (PTY) LTD
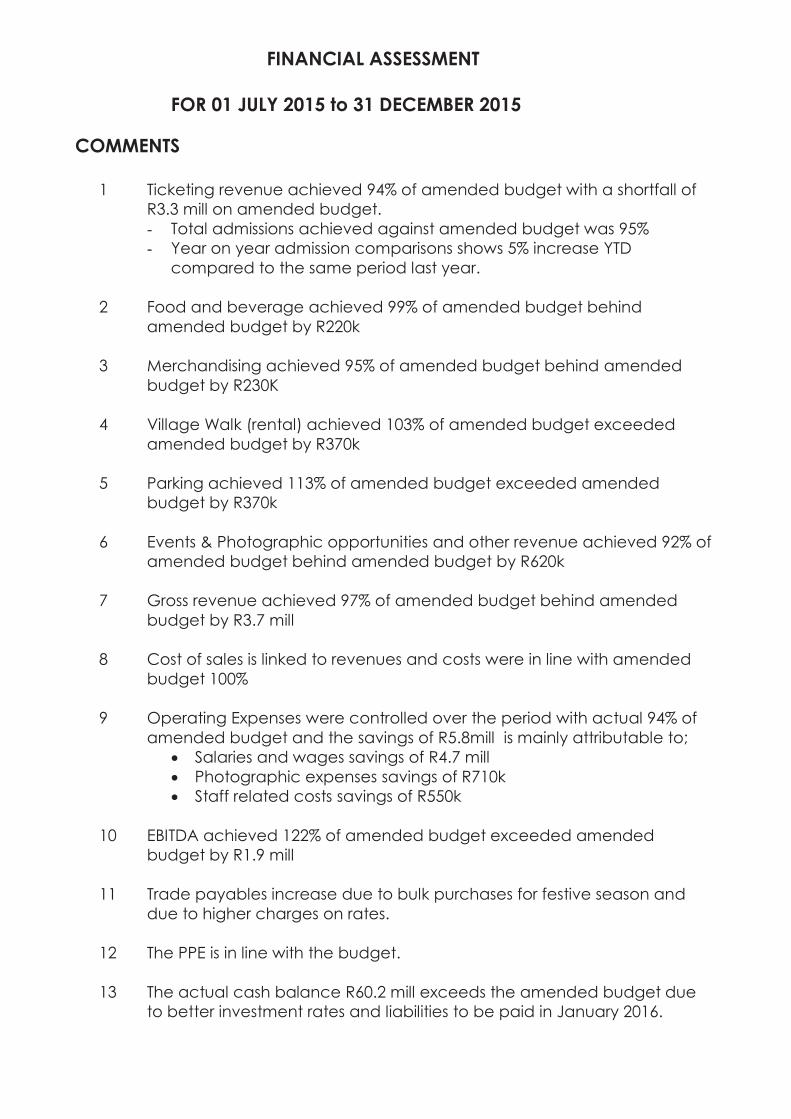
FINANCIAL ASSESSMENT
FOR 01 JULY 2015 to 31 DECEMBER 2015
COMMENTS
1 Ticketing revenue achieved 94% of amended budget with a shortfall of
R3.3 mill on amended budget.
- Total admissions achieved against amended budget was 95%
- Year on year admission comparisons shows 5% increase YTD
compared to the same period last year.
2 Food and beverage achieved 99% of amended budget behind
amended budget by R220k
3 Merchandising achieved 95% of amended budget behind amended
budget by R230K
4 Village Walk (rental) achieved 103% of amended budget exceeded
amended budget by R370k
5 Parking achieved 113% of amended budget exceeded amended
budget by R370k
6 Events & Photographic opportunities and other revenue achieved 92% of
amended budget behind amended budget by R620k
7 Gross revenue achieved 97% of amended budget behind amended
budget by R3.7 mill
8 Cost of sales is linked to revenues and costs were in line with amended
budget 100%
9 Operating Expenses were controlled over the period with actual 94% of
amended budget and the savings of R5.8mill is mainly attributable to;
· Salaries and wages savings of R4.7 mill
· Photographic expenses savings of R710k
· Staff related costs savings of R550k
10 EBITDA achieved 122% of amended budget exceeded amended
budget by R1.9 mill
11 Trade payables increase due to bulk purchases for festive season and
due to higher charges on rates.
12 The PPE is in line with the budget.
13 The actual cash balance R60.2 mill exceeds the amended budget due
to better investment rates and liabilities to be paid in January 2016.
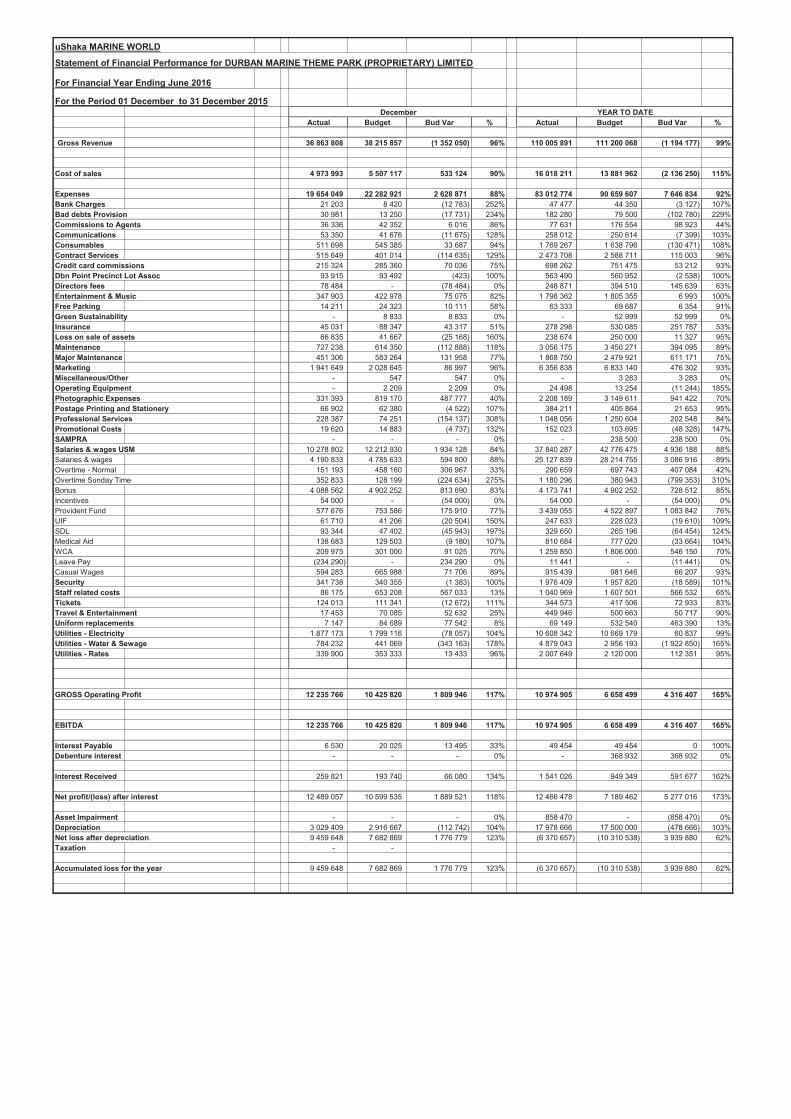
uShaka MARINE WORLD
Statement of Financial Performance for DURBAN MARINE THEME PARK (PROPRIETARY) LIMITED
For Financial Year Ending June 2016
For the Period 01 December to 31 December 2015 6
Notes
Actual Budget Bud Var % Actual Budget Bud Var %
Gross Revenue 11 36 863 808 38 215 857 (1 352 050) 96% 110 005 891 111 200 068 (1 194 177) 99%
Cost of sales 12 4 973 993 5 507 117 533 124 90% 16 018 211 13 881 962 (2 136 250) 115%
Expenses 19 654 049 22 282 921 2 628 871 88% 83 012 774 90 659 607 7 646 834 92%
Bank Charges 21 203 8 420 (12 783) 252% 47 477 44 350 (3 127) 107%
Bad debts Provision 13 30 981 13 250 (17 731) 234% 182 280 79 500 (102 780) 229%
Commissions to Agents 36 336 42 352 6 016 86% 77 631 176 554 98 923 44%
Communications 53 350 41 676 (11 675) 128% 258 012 250 614 (7 399) 103%
Consumables 14 511 698 545 385 33 687 94% 1 769 267 1 638 796 (130 471) 108%
Contract Services 515 649 401 014 (114 635) 129% 2 473 708 2 588 711 115 003 96%
Credit card commissions 15 215 324 285 360 70 036 75% 698 262 751 475 53 212 93%
Dbn Point Precinct Lot Assoc 93 915 93 492 (423) 100% 563 490 560 952 (2 538) 100%
Directors fees 78 484 - (78 484) 0% 248 871 394 510 145 639 63%
Entertainment & Music 347 903 422 978 75 075 82% 1 798 362 1 805 355 6 993 100%
Free Parking 14 211 24 323 10 111 58% 63 333 69 687 6 354 91%
Green Sustainability - 8 833 8 833 0% - 52 999 52 999 0%
Insurance 45 031 88 347 43 317 51% 278 298 530 085 251 787 53%
Loss on sale of assets 66 835 41 667 (25 168) 160% 238 674 250 000 11 327 95%
Maintenance 727 238 614 350 (112 888) 118% 3 056 175 3 450 271 394 095 89%
Major Maintenance 451 306 583 264 131 958 77% 1 868 750 2 479 921 611 171 75%
Marketing 1 941 649 2 028 645 86 997 96% 6 356 838 6 833 140 476 302 93%
Miscellaneous/Other - 547 547 0% - 3 283 3 283 0%
Operating Equipment - 2 209 2 209 0% 24 498 13 254 (11 244) 185%
Photographic Expenses 16 331 393 819 170 487 777 40% 2 208 189 3 149 611 941 422 70%
Postage Printing and Stationery 66 902 62 380 (4 522) 107% 384 211 405 864 21 653 95%
Professional Services 228 387 74 251 (154 137) 308% 1 048 056 1 250 604 202 548 84%
Promotional Costs 19 620 14 883 (4 737) 132% 152 023 103 695 (48 328) 147%
SAMPRA - - - 0% - 238 500 238 500 0%
Salaries & wages USM 17 10 278 802 12 212 930 1 934 128 84% 37 840 287 42 776 475 4 936 188 88%
Salaries & wages 4 190 833 4 785 633 594 800 88% 25 127 839 28 214 755 3 086 916 89%
Overtime - Normal 151 193 458 160 306 967 33% 290 659 697 743 407 084 42%
Overtime Sunday Time 352 833 128 199 (224 634) 275% 1 180 296 380 943 (799 353) 310%
Bonus 4 088 562 4 902 252 813 690 83% 4 173 741 4 902 252 728 512 85%
Incentives 54 000 - (54 000) 0% 54 000 - (54 000) 0%
Provident Fund 577 676 753 586 175 910 77% 3 439 055 4 522 897 1 083 842 76%
UIF 61 710 41 206 (20 504) 150% 247 633 228 023 (19 610) 109%
SDL 93 344 47 402 (45 943) 197% 329 650 265 196 (64 454) 124%
Medical Aid 138 683 129 503 (9 180) 107% 810 684 777 020 (33 664) 104%
WCA 209 975 301 000 91 025 70% 1 259 850 1 806 000 546 150 70%
Leave Pay (234 290) - 234 290 0% 11 441 - (11 441) 0%
Casual Wages 594 283 665 988 71 706 89% 915 439 981 646 66 207 93%
Security 341 738 340 355 (1 383) 100% 1 976 409 1 957 820 (18 589) 101%
Staff related costs 86 175 653 208 567 033 13% 1 040 969 1 607 501 566 532 65%
Tickets 124 013 111 341 (12 672) 111% 344 573 417 506 72 933 83%
Travel & Entertainment 17 453 70 085 52 632 25% 449 946 500 663 50 717 90%
Uniform replacements 7 147 84 689 77 542 8% 69 149 532 540 463 390 13%
Utilities - Electricity 1 877 173 1 799 116 (78 057) 104% 10 608 342 10 669 179 60 837 99%
Utilities - Water & Sewage 784 232 441 069 (343 163) 178% 4 879 043 2 956 193 (1 922 850) 165%
Utilities - Rates 339 900 353 333 13 433 96% 2 007 649 2 120 000 112 351 95%
GROSS Operating Profit 12 235 766 10 425 820 1 809 946 117% 10 974 905 6 658 499 4 316 407 165%
EBITDA 12 235 766 10 425 820 1 809 946 117% 10 974 905 6 658 499 4 316 407 165%
Interest Payable 6 530 20 025 13 495 33% 49 454 49 454 0 100%
Debenture interest - - - 0% - 368 932 368 932 0%
Interest Received 259 821 193 740 66 080 134% 1 541 026 949 349 591 677 162%
Net profit/(loss) after interest 12 489 057 10 599 535 1 889 521 118% 12 466 478 7 189 462 5 277 016 173%
Asset Impairment - - - 0% 858 470 - (858 470) 0%
Depreciation 18 3 029 409 2 916 667 (112 742) 104% 17 978 666 17 500 000 (478 666) 103%
Net loss after depreciation 9 459 648 7 682 869 1 776 779 123% (6 370 657) (10 310 538) 3 939 880 62%
Taxation - -
Accumulated loss for the year 9 459 648 7 682 869 1 776 779 123% (6 370 657) (10 310 538) 3 939 880 62%
YEAR TO DATEDecember
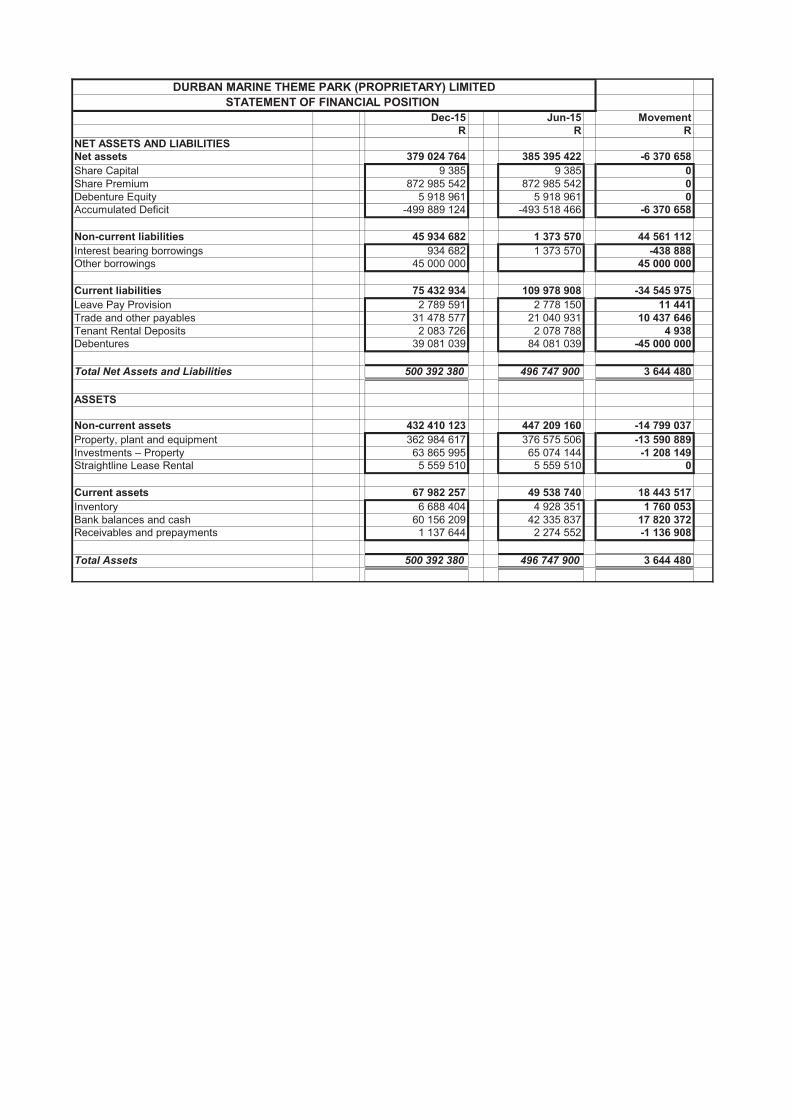
Dec-15 Jun-15 Movement
R R R
NET ASSETS AND LIABILITIES
Net assets 379 024 764 385 395 422 -6 370 658
Share Capital 9 385 9 385 0
Share Premium 872 985 542 872 985 542 0
Debenture Equity 5 918 961 5 918 961 0
Accumulated Deficit -499 889 124 -493 518 466 -6 370 658
Non-current liabilities 45 934 682 1 373 570 44 561 112
Interest bearing borrowings 934 682 1 373 570 -438 888
Other borrowings 45 000 000 45 000 000
Current liabilities 75 432 934 109 978 908 -34 545 975
Leave Pay Provision 2 789 591 2 778 150 11 441
Trade and other payables 31 478 577 21 040 931 10 437 646
Tenant Rental Deposits 2 083 726 2 078 788 4 938
Debentures 39 081 039 84 081 039 -45 000 000
Total Net Assets and Liabilities 500 392 380 496 747 900 3 644 480
ASSETS
Non-current assets 432 410 123 447 209 160 -14 799 037
Property, plant and equipment 362 984 617 376 575 506 -13 590 889
Investments – Property 63 865 995 65 074 144 -1 208 149
Straightline Lease Rental 19 5 559 510 5 559 510 0
Current assets 67 982 257 49 538 740 18 443 517
Inventory 6 688 404 4 928 351 1 760 053
Bank balances and cash 20 60 156 209 42 335 837 17 820 372
Receivables and prepayments 1 137 644 2 274 552 -1 136 908
Total Assets 500 392 380 496 747 900 3 644 480
DURBAN MARINE THEME PARK (PROPRIETARY) LIMITED
STATEMENT OF FINANCIAL POSITION
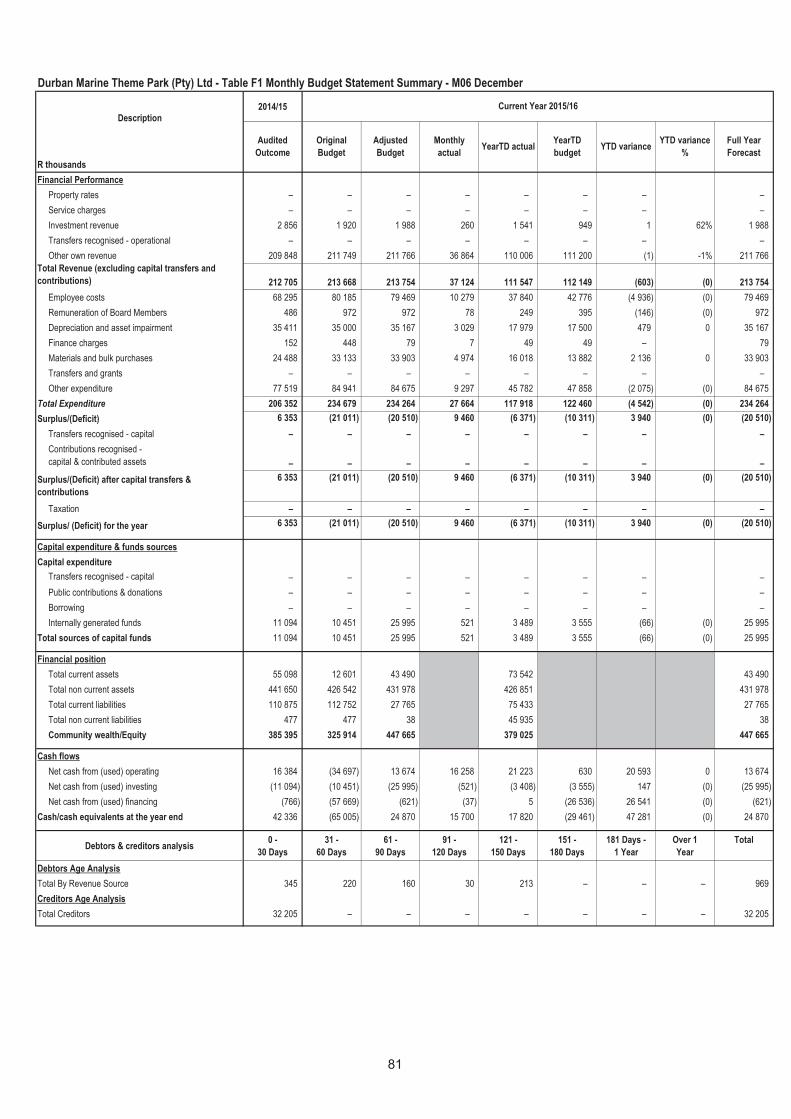
Durban Marine Theme Park (Pty) Ltd - Table F1 Monthly Budget Statement Summary - M06 December
2014/15
R thousands
Financial Performance
Property rates – – – – – – – –
Service charges – – – – – – – –
Investment revenue 2 856 1 920 1 988 260 1 541 949 1 62% 1 988
Transfers recognised - operational – – – – – – – –
Other own revenue 209 848 211 749 211 766 36 864 110 006 111 200 (1) -1% 211 766
Total Revenue (excluding capital transfers and
contributions) 212 705 213 668 213 754 37 124 111 547 112 149 (603) (0) 213 754
Employee costs 68 295 80 185 79 469 10 279 37 840 42 776 (4 936) (0) 79 469
Remuneration of Board Members 486 972 972 78 249 395 (146) (0) 972
Depreciation and asset impairment 35 411 35 000 35 167 3 029 17 979 17 500 479 0 35 167
Finance charges 152 448 79 7 49 49 – 79
Materials and bulk purchases 24 488 33 133 33 903 4 974 16 018 13 882 2 136 0 33 903
Transfers and grants – – – – – – – –
Other expenditure 77 519 84 941 84 675 9 297 45 782 47 858 (2 075) (0) 84 675
Total Expenditure 206 352 234 679 234 264 27 664 117 918 122 460 (4 542) (0) 234 264
Surplus/(Deficit) 6 353 (21 011) (20 510) 9 460 (6 371) (10 311) 3 940 (0) (20 510)
Transfers recognised - capital – – – – – – – –
Contributions recognised -
capital & contributed assets – – – – – – – –
Surplus/(Deficit) after capital transfers &
contributions
6 353 (21 011) (20 510) 9 460 (6 371) (10 311) 3 940 (0) (20 510)
Taxation – – – – – – – –
Surplus/ (Deficit) for the year 6 353 (21 011) (20 510) 9 460 (6 371) (10 311) 3 940 (0) (20 510)
Capital expenditure & funds sources
Capital expenditure
Transfers recognised - capital – – – – – – – –
Public contributions & donations – – – – – – – –
Borrowing – – – – – – – –
Internally generated funds 11 094 10 451 25 995 521 3 489 3 555 (66) (0) 25 995
Total sources of capital funds 11 094 10 451 25 995 521 3 489 3 555 (66) (0) 25 995
Financial position
Total current assets 55 098 12 601 43 490 73 542 43 490
Total non current assets 441 650 426 542 431 978 426 851 431 978
Total current liabilities 110 875 112 752 27 765 75 433 27 765
Total non current liabilities 477 477 38 45 935 38
Community wealth/Equity 385 395 325 914 447 665 379 025 447 665
Cash flows
Net cash from (used) operating 16 384 (34 697) 13 674 16 258 21 223 630 20 593 0 13 674
Net cash from (used) investing (11 094) (10 451) (25 995) (521) (3 408) (3 555) 147 (0) (25 995)
Net cash from (used) financing (766) (57 669) (621) (37) 5 (26 536) 26 541 (0) (621)
Cash/cash equivalents at the year end 42 336 (65 005) 24 870 15 700 17 820 (29 461) 47 281 (0) 24 870
Debtors & creditors analysis0 -
30 Days
31 -
60 Days
61 -
90 Days
91 -
120 Days
121 -
150 Days
151 -
180 Days
181 Days -
1 Year
Over 1
Year
Total
Debtors Age Analysis
Total By Revenue Source 345 220 160 30 213 – – – 969
Creditors Age Analysis
Total Creditors 32 205 – – – – – – – 32 205
YearTD
budget
Description
Original
Budget
Current Year 2015/16
Full Year
Forecast
Audited
OutcomeYTD variance
YTD variance
%
Adjusted
Budget
Monthly
actualYearTD actual
81
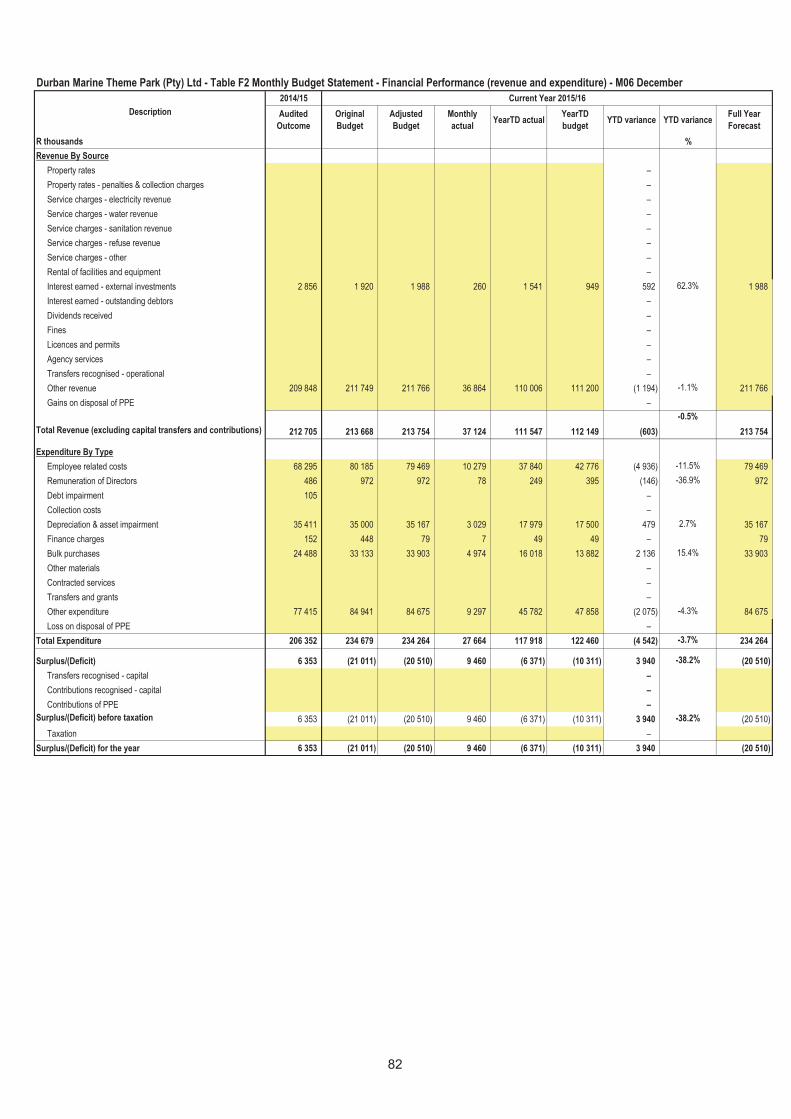
Durban Marine Theme Park (Pty) Ltd - Table F2 Monthly Budget Statement - Financial Performance (revenue and expenditure) - M06 December
2014/15 Current Year 2015/16
Audited
Outcome
Original
Budget
Adjusted
Budget
Monthly
actualYearTD actual
YearTD
budgetYTD variance YTD variance
Full Year
Forecast
R thousands %
Revenue By Source
Property rates –
Property rates - penalties & collection charges –
Service charges - electricity revenue –
Service charges - water revenue –
Service charges - sanitation revenue –
Service charges - refuse revenue –
Service charges - other –
Rental of facilities and equipment –
Interest earned - external investments 2 856 1 920 1 988 260 1 541 949 592 62.3% 1 988
Interest earned - outstanding debtors –
Dividends received –
Fines –
Licences and permits –
Agency services –
Transfers recognised - operational –
Other revenue 209 848 211 749 211 766 36 864 110 006 111 200 (1 194) -1.1% 211 766
Gains on disposal of PPE –
Total Revenue (excluding capital transfers and contributions) 212 705 213 668 213 754 37 124 111 547 112 149 (603)
-0.5%
213 754
Expenditure By Type
Employee related costs 68 295 80 185 79 469 10 279 37 840 42 776 (4 936) -11.5% 79 469
Remuneration of Directors 486 972 972 78 249 395 (146) -36.9% 972
Debt impairment 105 –
Collection costs –
Depreciation & asset impairment 35 411 35 000 35 167 3 029 17 979 17 500 479 2.7% 35 167
Finance charges 152 448 79 7 49 49 – 79
Bulk purchases 24 488 33 133 33 903 4 974 16 018 13 882 2 136 15.4% 33 903
Other materials –
Contracted services –
Transfers and grants –
Other expenditure 77 415 84 941 84 675 9 297 45 782 47 858 (2 075) -4.3% 84 675
Loss on disposal of PPE –
Total Expenditure 206 352 234 679 234 264 27 664 117 918 122 460 (4 542) -3.7% 234 264
Surplus/(Deficit) 6 353 (21 011) (20 510) 9 460 (6 371) (10 311) 3 940 -38.2% (20 510)
Transfers recognised - capital –
Contributions recognised - capital –
Contributions of PPE –
Surplus/(Deficit) before taxation 6 353 (21 011) (20 510) 9 460 (6 371) (10 311) 3 940 -38.2% (20 510)
Taxation –
Surplus/(Deficit) for the year 6 353 (21 011) (20 510) 9 460 (6 371) (10 311) 3 940 (20 510)
Description
82
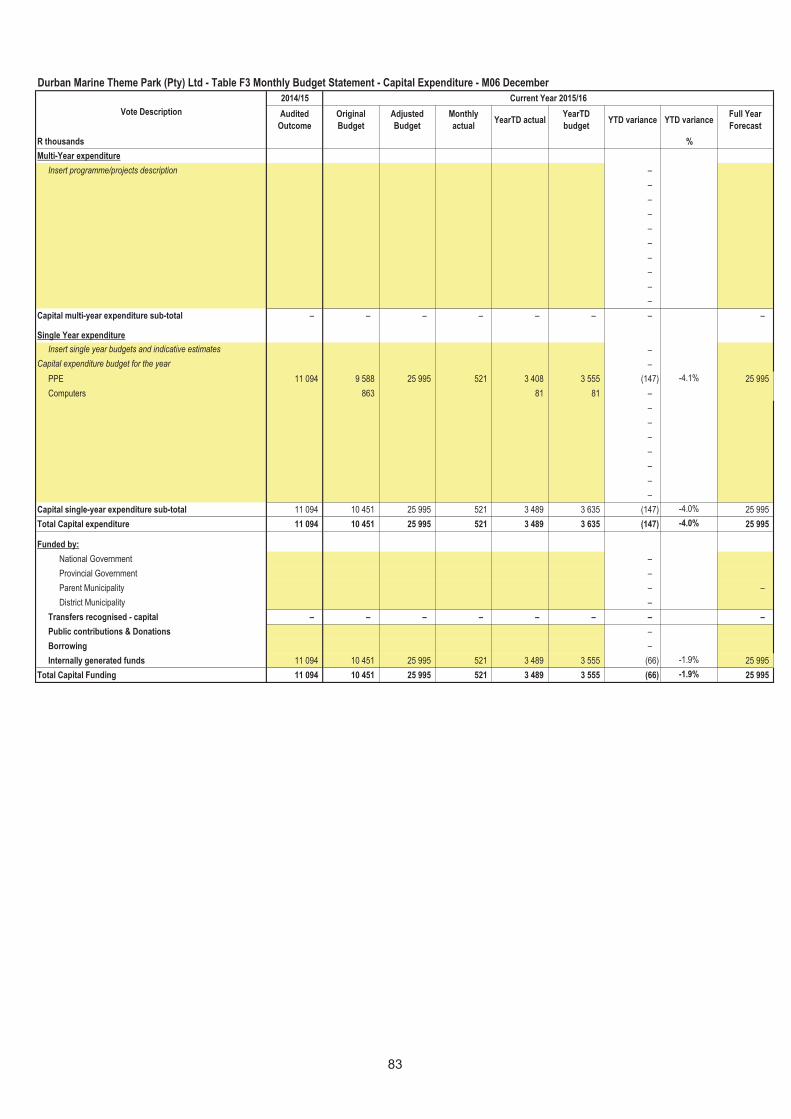
Durban Marine Theme Park (Pty) Ltd - Table F3 Monthly Budget Statement - Capital Expenditure - M06 December
2014/15 Current Year 2015/16
Audited
Outcome
Original
Budget
Adjusted
Budget
Monthly
actualYearTD actual
YearTD
budgetYTD variance YTD variance
Full Year
Forecast
R thousands %
Multi-Year expenditure
Insert programme/projects description –
–
–
–
–
–
–
–
–
–
Capital multi-year expenditure sub-total – – – – – – – –
Single Year expenditure
Insert single year budgets and indicative estimates –
Capital expenditure budget for the year –
PPE 11 094 9 588 25 995 521 3 408 3 555 (147) -4.1% 25 995
Computers 863 81 81 –
–
–
–
–
–
–
–
Capital single-year expenditure sub-total 11 094 10 451 25 995 521 3 489 3 635 (147) -4.0% 25 995
Total Capital expenditure 11 094 10 451 25 995 521 3 489 3 635 (147) -4.0% 25 995
Funded by:
National Government –
Provincial Government –
Parent Municipality – –
District Municipality –
Transfers recognised - capital – – – – – – – –
Public contributions & Donations –
Borrowing –
Internally generated funds 11 094 10 451 25 995 521 3 489 3 555 (66) -1.9% 25 995
Total Capital Funding 11 094 10 451 25 995 521 3 489 3 555 (66) -1.9% 25 995
Vote Description
83
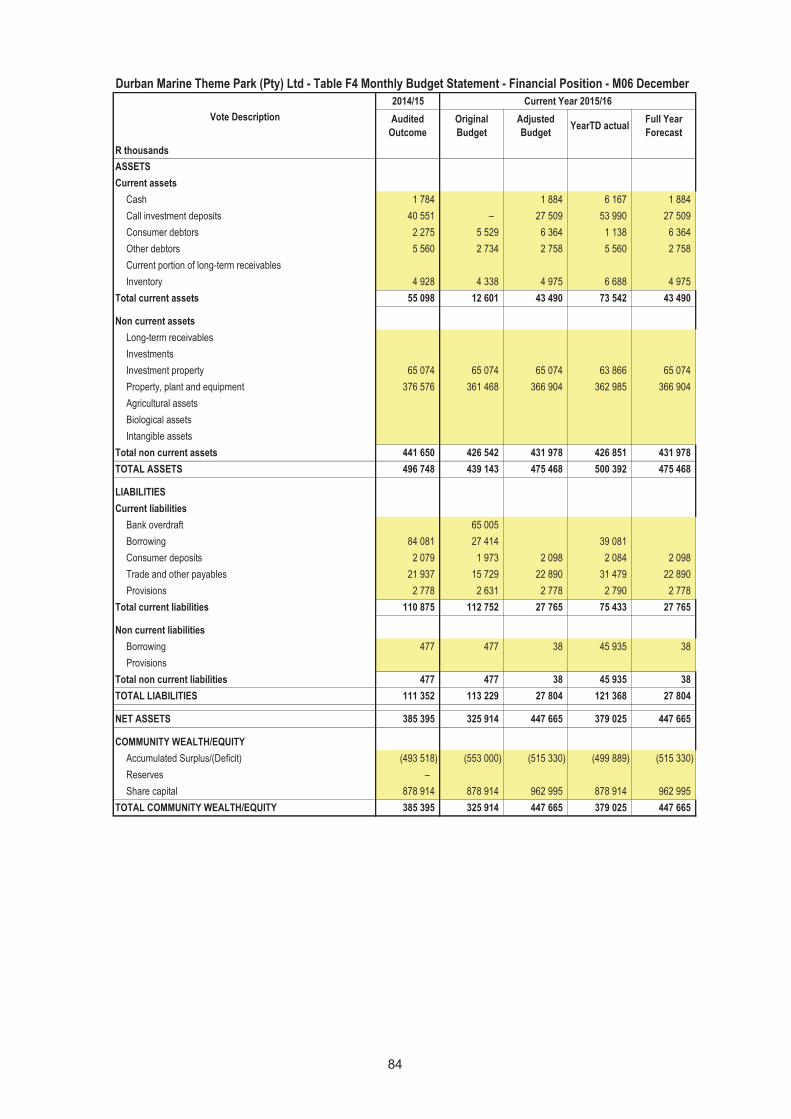
Durban Marine Theme Park (Pty) Ltd - Table F4 Monthly Budget Statement - Financial Position - M06 December
2014/15 Current Year 2015/16
Audited
Outcome
Original
Budget
Adjusted
BudgetYearTD actual
Full Year
Forecast
R thousands
ASSETS
Current assets
Cash 1 784 1 884 6 167 1 884
Call investment deposits 40 551 – 27 509 53 990 27 509
Consumer debtors 2 275 5 529 6 364 1 138 6 364
Other debtors 5 560 2 734 2 758 5 560 2 758
Current portion of long-term receivables
Inventory 4 928 4 338 4 975 6 688 4 975
Total current assets 55 098 12 601 43 490 73 542 43 490
Non current assets
Long-term receivables
Investments
Investment property 65 074 65 074 65 074 63 866 65 074
Property, plant and equipment 376 576 361 468 366 904 362 985 366 904
Agricultural assets
Biological assets
Intangible assets
Total non current assets 441 650 426 542 431 978 426 851 431 978
TOTAL ASSETS 496 748 439 143 475 468 500 392 475 468
LIABILITIES
Current liabilities
Bank overdraft 65 005
Borrowing 84 081 27 414 39 081
Consumer deposits 2 079 1 973 2 098 2 084 2 098
Trade and other payables 21 937 15 729 22 890 31 479 22 890
Provisions 2 778 2 631 2 778 2 790 2 778
Total current liabilities 110 875 112 752 27 765 75 433 27 765
Non current liabilities
Borrowing 477 477 38 45 935 38
Provisions
Total non current liabilities 477 477 38 45 935 38
TOTAL LIABILITIES 111 352 113 229 27 804 121 368 27 804
NET ASSETS 385 395 325 914 447 665 379 025 447 665
COMMUNITY WEALTH/EQUITY
Accumulated Surplus/(Deficit) (493 518) (553 000) (515 330) (499 889) (515 330)
Reserves –
Share capital 878 914 878 914 962 995 878 914 962 995
TOTAL COMMUNITY WEALTH/EQUITY 385 395 325 914 447 665 379 025 447 665
Vote Description
84
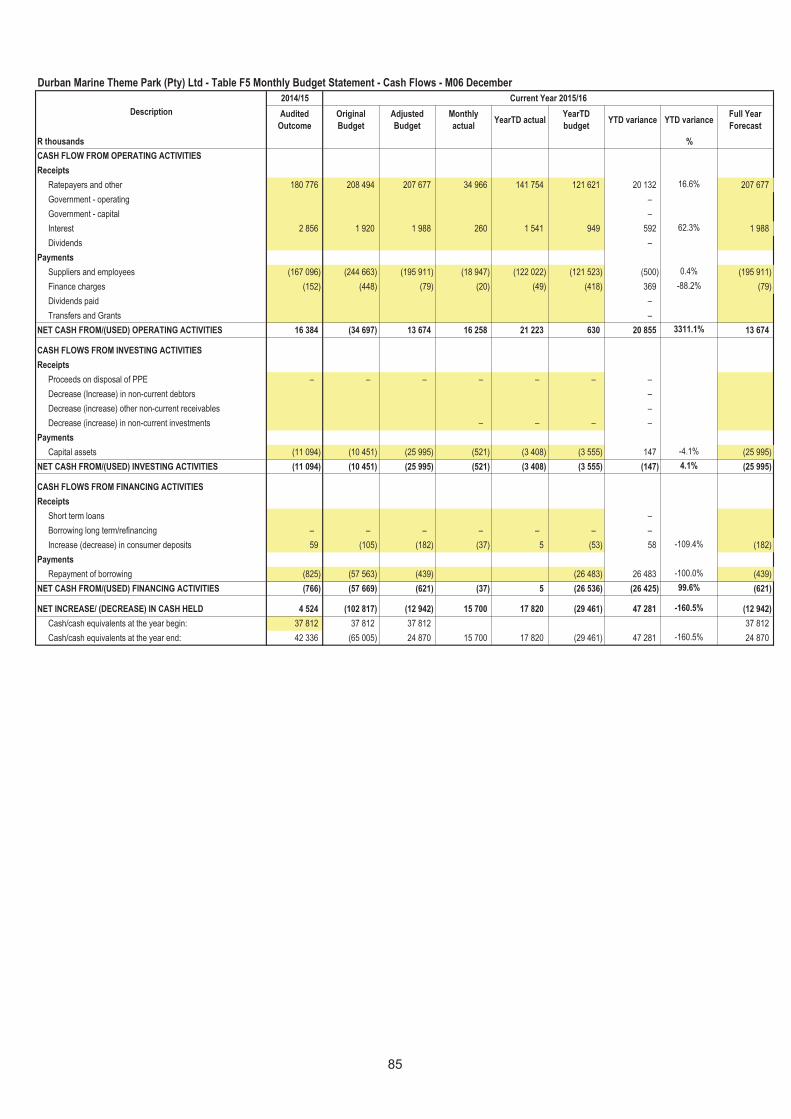
Durban Marine Theme Park (Pty) Ltd - Table F5 Monthly Budget Statement - Cash Flows - M06 December
2014/15 Current Year 2015/16
Audited
Outcome
Original
Budget
Adjusted
Budget
Monthly
actualYearTD actual
YearTD
budgetYTD variance YTD variance
Full Year
Forecast
R thousands %
CASH FLOW FROM OPERATING ACTIVITIES
Receipts
Ratepayers and other 180 776 208 494 207 677 34 966 141 754 121 621 20 132 16.6% 207 677
Government - operating –
Government - capital –
Interest 2 856 1 920 1 988 260 1 541 949 592 62.3% 1 988
Dividends –
Payments
Suppliers and employees (167 096) (244 663) (195 911) (18 947) (122 022) (121 523) (500) 0.4% (195 911)
Finance charges (152) (448) (79) (20) (49) (418) 369 -88.2% (79)
Dividends paid –
Transfers and Grants –
NET CASH FROM/(USED) OPERATING ACTIVITIES 16 384 (34 697) 13 674 16 258 21 223 630 20 855 3311.1% 13 674
CASH FLOWS FROM INVESTING ACTIVITIES
Receipts
Proceeds on disposal of PPE – – – – – – –
Decrease (Increase) in non-current debtors –
Decrease (increase) other non-current receivables –
Decrease (increase) in non-current investments – – – –
Payments
Capital assets (11 094) (10 451) (25 995) (521) (3 408) (3 555) 147 -4.1% (25 995)
NET CASH FROM/(USED) INVESTING ACTIVITIES (11 094) (10 451) (25 995) (521) (3 408) (3 555) (147) 4.1% (25 995)
CASH FLOWS FROM FINANCING ACTIVITIES
Receipts
Short term loans –
Borrowing long term/refinancing – – – – – – –
Increase (decrease) in consumer deposits 59 (105) (182) (37) 5 (53) 58 -109.4% (182)
Payments
Repayment of borrowing (825) (57 563) (439) (26 483) 26 483 -100.0% (439)
NET CASH FROM/(USED) FINANCING ACTIVITIES (766) (57 669) (621) (37) 5 (26 536) (26 425) 99.6% (621)
NET INCREASE/ (DECREASE) IN CASH HELD 4 524 (102 817) (12 942) 15 700 17 820 (29 461) 47 281 -160.5% (12 942)
Cash/cash equivalents at the year begin: 37 812 37 812 37 812 37 812
Cash/cash equivalents at the year end: 42 336 (65 005) 24 870 15 700 17 820 (29 461) 47 281 -160.5% 24 870
Description
85
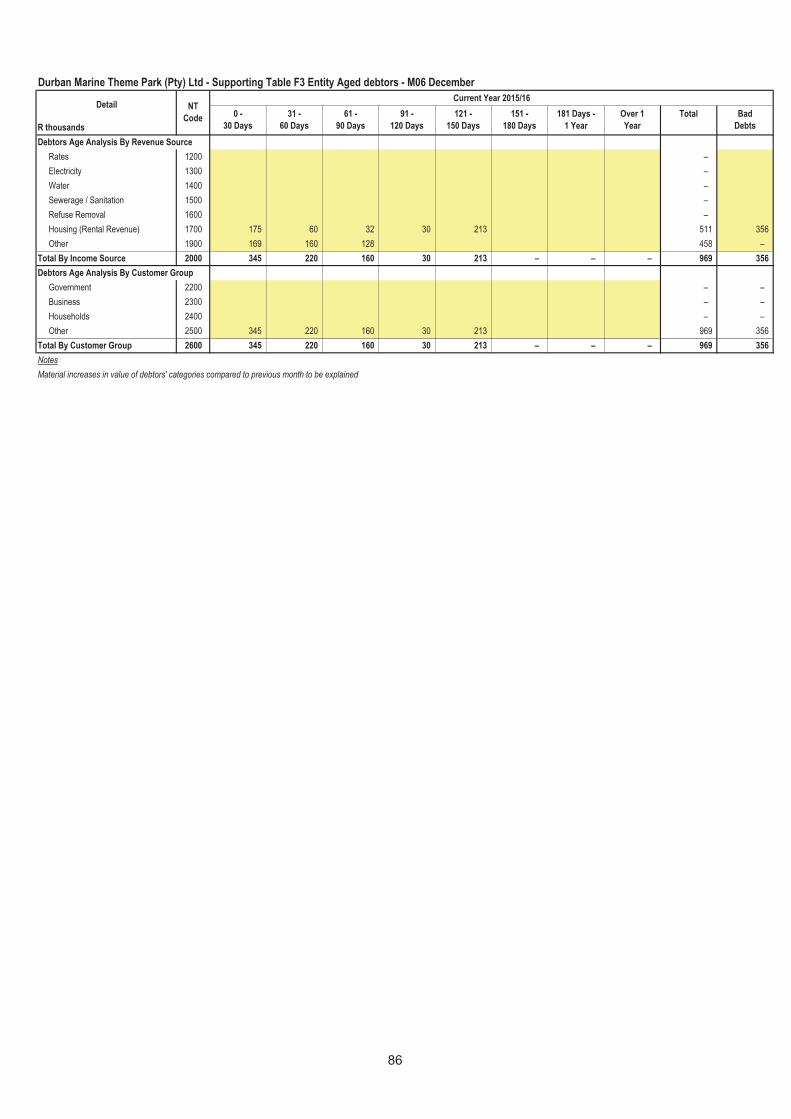
Durban Marine Theme Park (Pty) Ltd - Supporting Table F3 Entity Aged debtors - M06 December
Current Year 2015/16
R thousands
Debtors Age Analysis By Revenue Source
Rates 1200 –
Electricity 1300 –
Water 1400 –
Sewerage / Sanitation 1500 –
Refuse Removal 1600 –
Housing (Rental Revenue) 1700 175 60 32 30 213 511 356
Other 1900 169 160 128 458 –
Total By Income Source 2000 345 220 160 30 213 – – – 969 356
Debtors Age Analysis By Customer Group
Government 2200 – –
Business 2300 – –
Households 2400 – –
Other 2500 345 220 160 30 213 969 356
Total By Customer Group 2600 345 220 160 30 213 – – – 969 356
Notes
Material increases in value of debtors' categories compared to previous month to be explained
Detail NT
Code0 -
30 Days
31 -
60 Days
61 -
90 Days
91 -
120 Days
121 -
150 Days
151 -
180 Days
181 Days -
1 Year
Over 1
Year
Total Bad
Debts
86
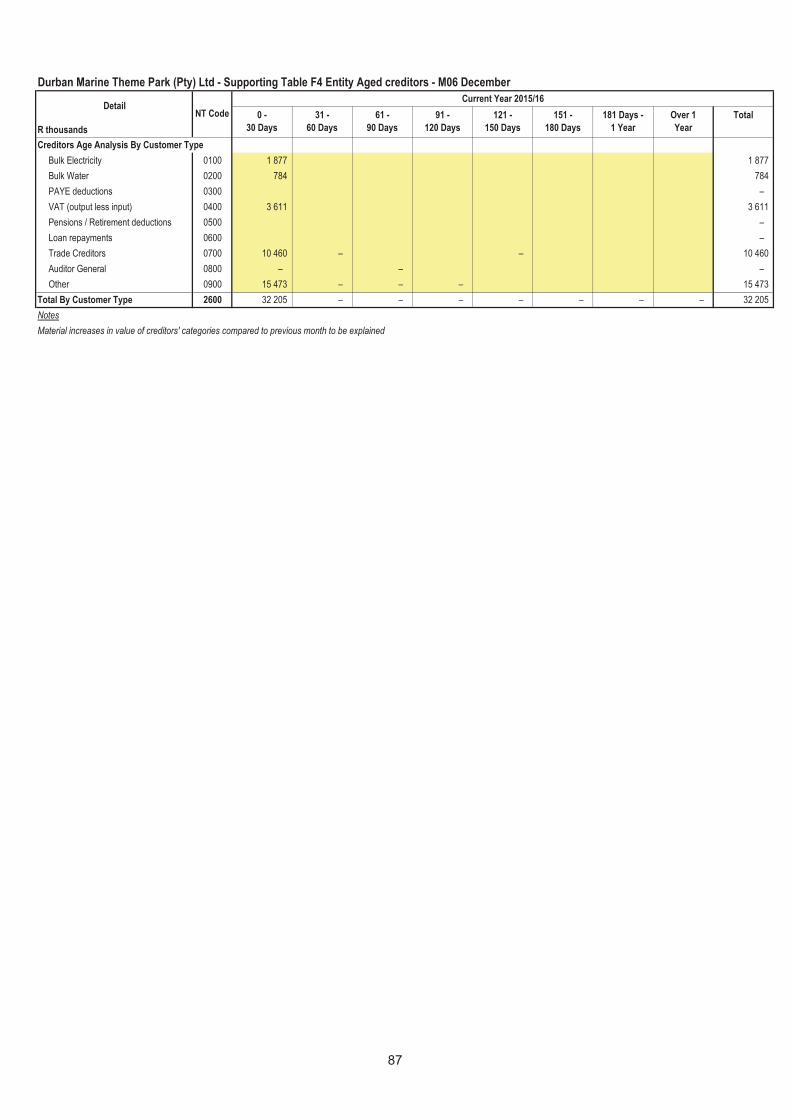
Durban Marine Theme Park (Pty) Ltd - Supporting Table F4 Entity Aged creditors - M06 December
Current Year 2015/16
R thousands
Creditors Age Analysis By Customer Type
Bulk Electricity 0100 1 877 1 877
Bulk Water 0200 784 784
PAYE deductions 0300 –
VAT (output less input) 0400 3 611 3 611
Pensions / Retirement deductions 0500 –
Loan repayments 0600 –
Trade Creditors 0700 10 460 – – 10 460
Auditor General 0800 – – –
Other 0900 15 473 – – – 15 473
Total By Customer Type 2600 32 205 – – – – – – – 32 205
Notes
Material increases in value of creditors' categories compared to previous month to be explained
DetailNT Code 0 -
30 Days
31 -
60 Days
151 -
180 Days
181 Days -
1 Year
Over 1
Year
Total61 -
90 Days
91 -
120 Days
121 -
150 Days
87
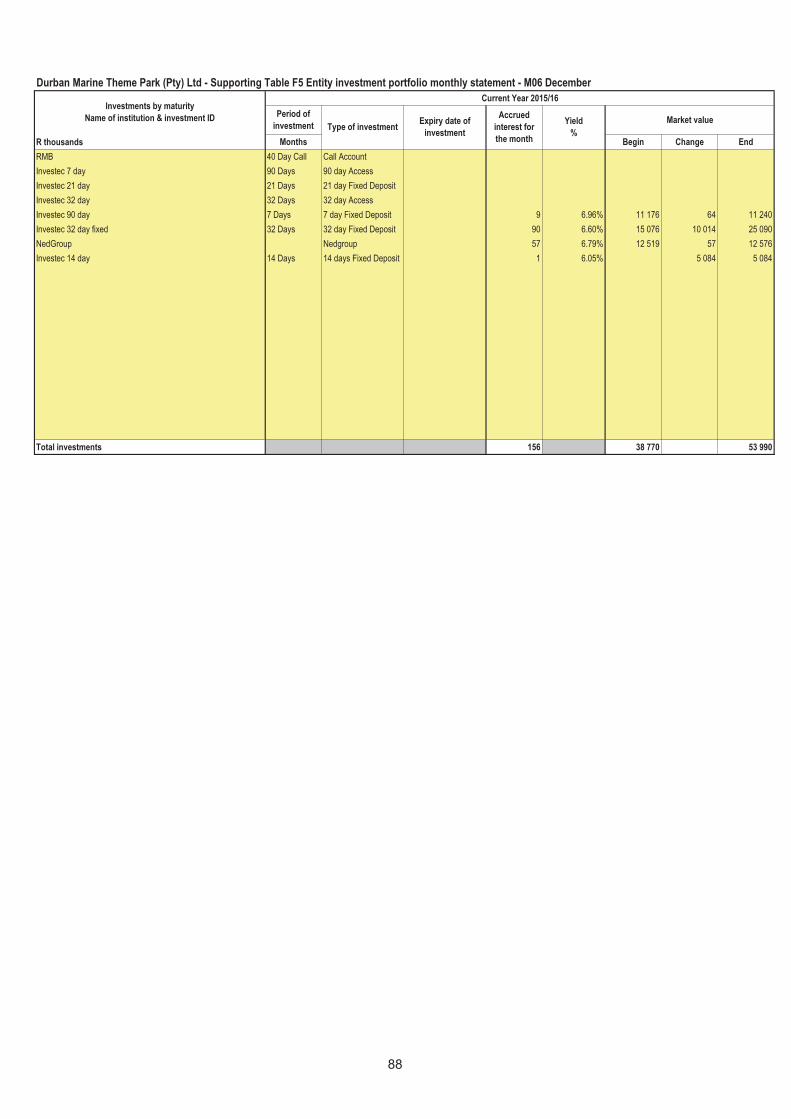
Durban Marine Theme Park (Pty) Ltd - Supporting Table F5 Entity investment portfolio monthly statement - M06 December
Current Year 2015/16
Period of
investmentMarket value
R thousands Months Begin Change End
RMB 40 Day Call Call Account
Investec 7 day 90 Days 90 day Access
Investec 21 day 21 Days 21 day Fixed Deposit
Investec 32 day 32 Days 32 day Access
Investec 90 day 7 Days 7 day Fixed Deposit 9 6.96% 11 176 64 11 240
Investec 32 day fixed 32 Days 32 day Fixed Deposit 90 6.60% 15 076 10 014 25 090
NedGroup Nedgroup 57 6.79% 12 519 57 12 576
Investec 14 day 14 Days 14 days Fixed Deposit 1 6.05% 5 084 5 084
Total investments 156 38 770 53 990
Accrued
interest for
the month
Yield
%
Investments by maturity
Name of institution & investment IDType of investment
Expiry date of
investment
88
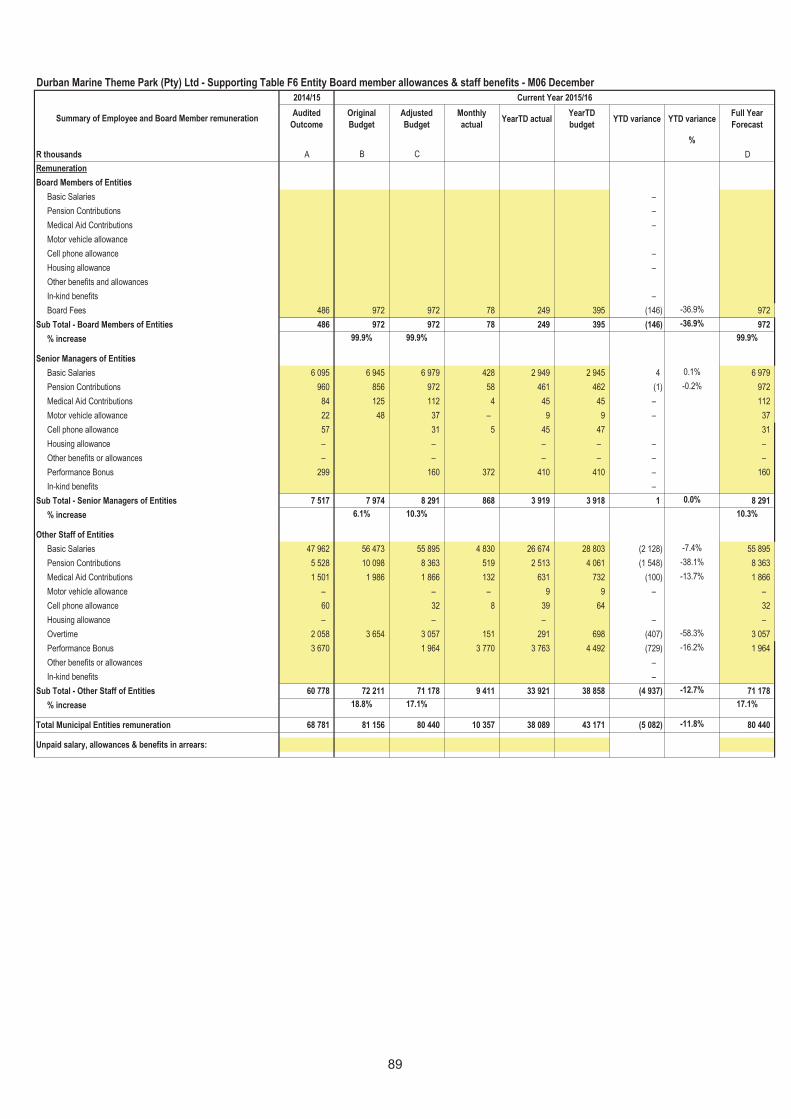
Durban Marine Theme Park (Pty) Ltd - Supporting Table F6 Entity Board member allowances & staff benefits - M06 December
2014/15 Current Year 2015/16
Audited
Outcome
Original
Budget
Adjusted
Budget
Monthly
actualYearTD actual
YearTD
budgetYTD variance YTD variance
Full Year
Forecast
%
R thousands A B C D
Remuneration
Board Members of Entities
Basic Salaries –
Pension Contributions –
Medical Aid Contributions –
Motor vehicle allowance
Cell phone allowance –
Housing allowance –
Other benefits and allowances
In-kind benefits –
Board Fees 486 972 972 78 249 395 (146) -36.9% 972
Sub Total - Board Members of Entities 486 972 972 78 249 395 (146) -36.9% 972
% increase 99.9% 99.9% 99.9%
Senior Managers of Entities
Basic Salaries 6 095 6 945 6 979 428 2 949 2 945 4 0.1% 6 979
Pension Contributions 960 856 972 58 461 462 (1) -0.2% 972
Medical Aid Contributions 84 125 112 4 45 45 – 112
Motor vehicle allowance 22 48 37 – 9 9 – 37
Cell phone allowance 57 31 5 45 47 31
Housing allowance – – – – – –
Other benefits or allowances – – – – – –
Performance Bonus 299 160 372 410 410 – 160
In-kind benefits –
Sub Total - Senior Managers of Entities 7 517 7 974 8 291 868 3 919 3 918 1 0.0% 8 291
% increase 6.1% 10.3% 10.3%
Other Staff of Entities
Basic Salaries 47 962 56 473 55 895 4 830 26 674 28 803 (2 128) -7.4% 55 895
Pension Contributions 5 528 10 098 8 363 519 2 513 4 061 (1 548) -38.1% 8 363
Medical Aid Contributions 1 501 1 986 1 866 132 631 732 (100) -13.7% 1 866
Motor vehicle allowance – – – 9 9 – –
Cell phone allowance 60 32 8 39 64 32
Housing allowance – – – – –
Overtime 2 058 3 654 3 057 151 291 698 (407) -58.3% 3 057
Performance Bonus 3 670 1 964 3 770 3 763 4 492 (729) -16.2% 1 964
Other benefits or allowances –
In-kind benefits –
Sub Total - Other Staff of Entities 60 778 72 211 71 178 9 411 33 921 38 858 (4 937) -12.7% 71 178
% increase 18.8% 17.1% 17.1%
Total Municipal Entities remuneration 68 781 81 156 80 440 10 357 38 089 43 171 (5 082) -11.8% 80 440
Unpaid salary, allowances & benefits in arrears:
Summary of Employee and Board Member remuneration
89
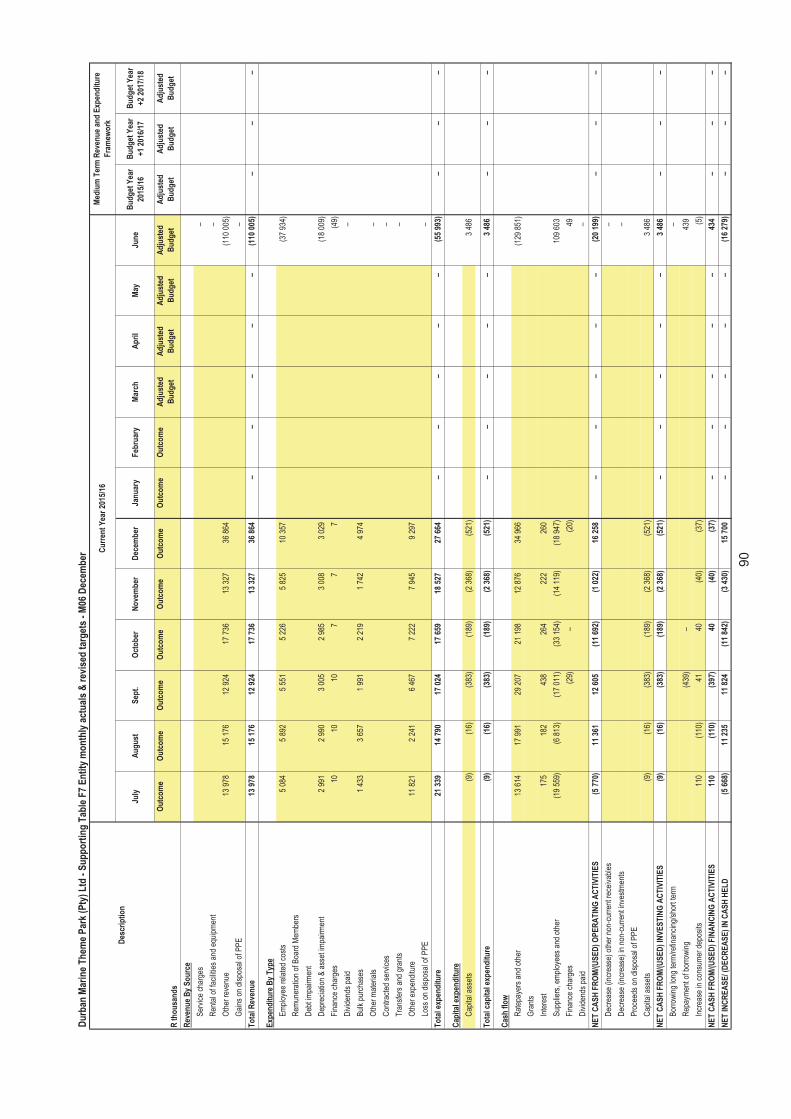
Du
rban
Mar
ine
Th
eme
Par
k (P
ty)
Ltd
- S
up
po
rtin
g T
able
F7
En
tity
mo
nth
ly a
ctu
als
& r
evis
ed t
arg
ets
- M
06 D
ecem
ber
July
Au
gu
stS
ept.
Oct
ob
erN
ove
mb
erD
ecem
ber
Jan
uar
yF
ebru
ary
Mar
chA
pri
lM
ayJu
ne
Bu
dg
et Y
ear
2015
/16
Bu
dg
et Y
ear
+1
2016
/17
Bu
dg
et Y
ear
+2
2017
/18
R t
ho
usa
nd
s
Ou
tco
me
Ou
tco
me
Ou
tco
me
Ou
tco
me
Ou
tco
me
Ou
tco
me
Ou
tco
me
Ou
tco
me
Ad
just
ed
Bu
dg
et
Ad
just
ed
Bu
dg
et
Ad
just
ed
Bu
dg
et
Ad
just
ed
Bu
dg
et
Ad
just
ed
Bu
dg
et
Ad
just
ed
Bu
dg
et
Ad
just
ed
Bu
dg
et
Rev
enu
e B
y S
ou
rce
Ser
vice
cha
rges
–
Ren
tal o
f fac
ilitie
s an
d eq
uipm
ent
–
Oth
er r
even
ue13
978
15 1
76
12
924
17 7
36
13
327
36 8
64
(1
10 0
05)
Gai
ns o
n di
spos
al o
f PP
E–
To
tal R
even
ue
13 9
78
15
176
12 9
24
17
736
13 3
27
36
864
–
–
–
–
–
(110
005
)
–
–
–
Exp
end
itu
re B
y T
ype
Em
ploy
ee r
elat
ed c
osts
5 08
4
5 89
2
5 55
1
5 22
6
5 82
5
10 3
57
(3
7 93
4)
Rem
uner
atio
n of
Boa
rd M
embe
rs
Deb
t im
pairm
ent
Dep
reci
atio
n &
ass
et im
pairm
ent
2 99
1
2 99
0
3 00
5
2 98
5
3 00
8
3 02
9
(18
009)
Fin
ance
cha
rges
10
10
10
7
7
7
(49)
Div
iden
ds p
aid
–
Bul
k pu
rcha
ses
1 43
3
3 65
7
1 99
1
2 21
9
1 74
2
4 97
4
Oth
er m
ater
ials
–
Con
trac
ted
serv
ices
–
Tra
nsfe
rs a
nd g
rant
s–
Oth
er e
xpen
ditu
re11
821
2 24
1
6 46
7
7 22
2
7 94
5
9 29
7
Loss
on
disp
osal
of P
PE
–
To
tal e
xpen
dit
ure
21 3
39
14
790
17 0
24
17
659
18 5
27
27
664
–
–
–
–
–
(55
993)
–
–
–
Cap
ital
exp
end
itu
re
Cap
ital a
sset
s(9
)
(16)
(383
)
(1
89)
(2 3
68)
(5
21)
3 48
6
–
–
–
–
–
–
–
–
–
–
–
–
To
tal c
apit
al e
xpen
dit
ure
(9)
(1
6)
(3
83)
(189
)
(2
368
)
(521
)
–
–
–
–
–
3
486
–
–
–
Cas
h f
low
Rat
epay
ers
and
othe
r13
614
17 9
91
29
207
21 1
98
12
876
34 9
66
(1
29 8
51)
Gra
nts
Inte
rest
175
182
438
264
222
260
Sup
plie
rs, e
mpl
oyee
s an
d ot
her
(19
559)
(6 8
13)
(1
7 01
1)
(3
3 15
4)
(1
4 11
9)
(1
8 94
7)
10
9 60
3
Fin
ance
cha
rges
(29)
–
(20)
49
Div
iden
ds p
aid
–
NE
T C
AS
H F
RO
M/(
US
ED
) O
PE
RA
TIN
G A
CT
IVIT
IES
(5 7
70)
11
361
12 6
05
(1
1 69
2)
(1
022
)
16 2
58
–
–
–
–
–
(2
0 19
9)
–
–
–
Dec
reas
e (in
crea
se)
othe
r no
n-cu
rren
t rec
eiva
bles
–
Dec
reas
e (in
crea
se)
in n
on-c
urre
nt in
vest
men
ts–
Pro
ceed
s on
dis
posa
l of P
PE
Cap
ital a
sset
s(9
)
(16)
(383
)
(1
89)
(2 3
68)
(5
21)
3 48
6
NE
T C
AS
H F
RO
M/(
US
ED
) IN
VE
ST
ING
AC
TIV
ITIE
S(9
)
(16)
(383
)
(1
89)
(2 3
68)
(5
21)
–
–
–
–
–
3 48
6
–
–
–
Bor
row
ing
long
term
/ref
inan
cing
/sho
rt te
rm–
Rep
aym
ent o
f bor
row
ing
(439
)
–
43
9
Incr
ease
in c
onsu
mer
dep
osits
110
(110
)
41
40
(4
0)
(3
7)
(5
)
NE
T C
AS
H F
RO
M/(
US
ED
) F
INA
NC
ING
AC
TIV
ITIE
S11
0
(1
10)
(397
)
40
(4
0)
(3
7)
–
–
–
–
–
43
4
–
–
–
NE
T IN
CR
EA
SE
/ (D
EC
RE
AS
E)
IN C
AS
H H
EL
D(5
668
)
11 2
35
11
824
(11
842)
(3 4
30)
15
700
–
–
–
–
–
(16
279)
–
–
–
Des
crip
tio
n
Cu
rren
t Y
ear
2015
/16
Med
ium
Ter
m R
even
ue
and
Exp
end
itu
re
Fra
mew
ork
90
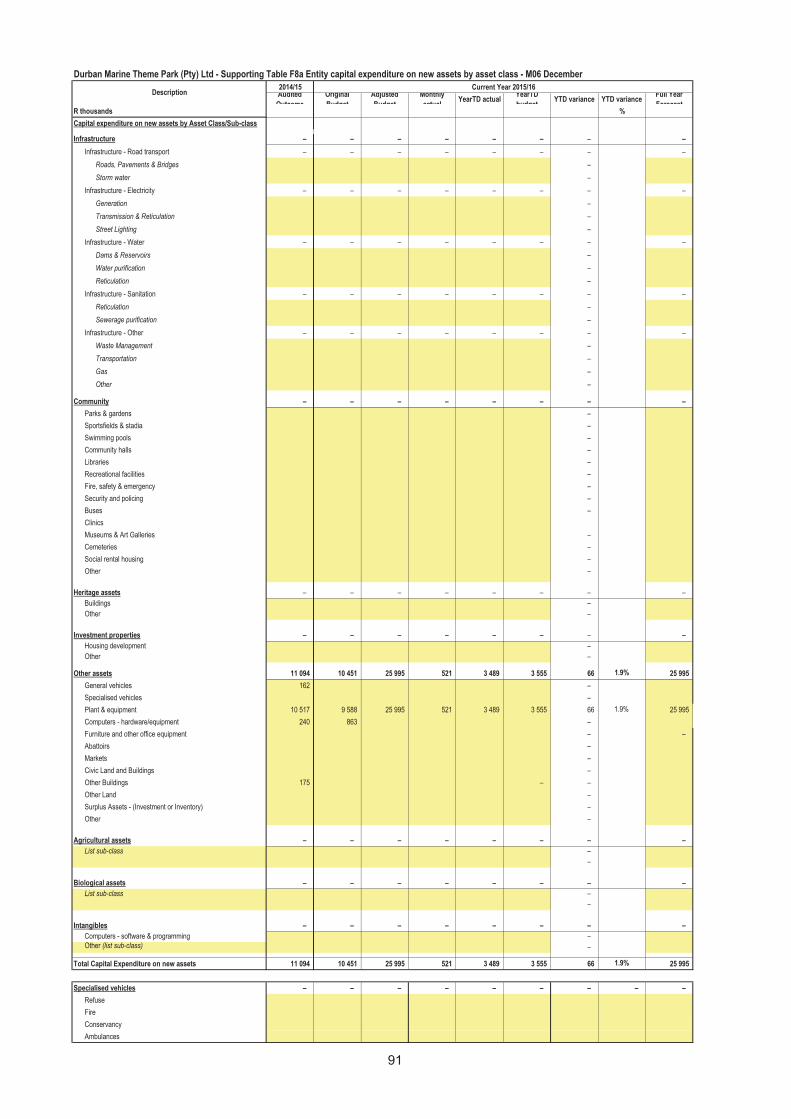
Durban Marine Theme Park (Pty) Ltd - Supporting Table F8a Entity capital expenditure on new assets by asset class - M06 December
2014/15 Current Year 2015/16Audited
Outcome
Original
Budget
Adjusted
Budget
Monthly
actualYearTD actual
YearTD
budgetYTD variance YTD variance
Full Year
ForecastR thousands %
Capital expenditure on new assets by Asset Class/Sub-class
Infrastructure – – – – – – – –
Infrastructure - Road transport – – – – – – – –
Roads, Pavements & Bridges –
Storm water –
Infrastructure - Electricity – – – – – – – –
Generation –
Transmission & Reticulation –
Street Lighting –
Infrastructure - Water – – – – – – – –
Dams & Reservoirs –
Water purification –
Reticulation –
Infrastructure - Sanitation – – – – – – – –
Reticulation –
Sewerage purification –
Infrastructure - Other – – – – – – – –
Waste Management –
Transportation –
Gas –
Other –
Community – – – – – – – –
Parks & gardens –
Sportsfields & stadia –
Swimming pools –
Community halls –
Libraries –
Recreational facilities –
Fire, safety & emergency –
Security and policing –
Buses –
Clinics
Museums & Art Galleries –
Cemeteries –
Social rental housing –
Other – –
Heritage assets – – – – – – – –
Buildings –
Other – –
Investment properties – – – – – – – –
Housing development –
Other –
Other assets 11 094 10 451 25 995 521 3 489 3 555 66 1.9% 25 995
General vehicles 162 –
Specialised vehicles –
Plant & equipment 10 517 9 588 25 995 521 3 489 3 555 66 1.9% 25 995
Computers - hardware/equipment 240 863 –
Furniture and other office equipment – –
Abattoirs –
Markets –
Civic Land and Buildings –
Other Buildings 175 – –
Other Land –
Surplus Assets - (Investment or Inventory) –
Other –
Agricultural assets – – – – – – – –
List sub-class –
–
Biological assets – – – – – – – –
List sub-class –
–
Intangibles – – – – – – – –
Computers - software & programming –
Other (list sub-class) –
Total Capital Expenditure on new assets 11 094 10 451 25 995 521 3 489 3 555 66 1.9% 25 995
Specialised vehicles – – – – – – – – –
Refuse
Fire
Conservancy
Ambulances
Description
91
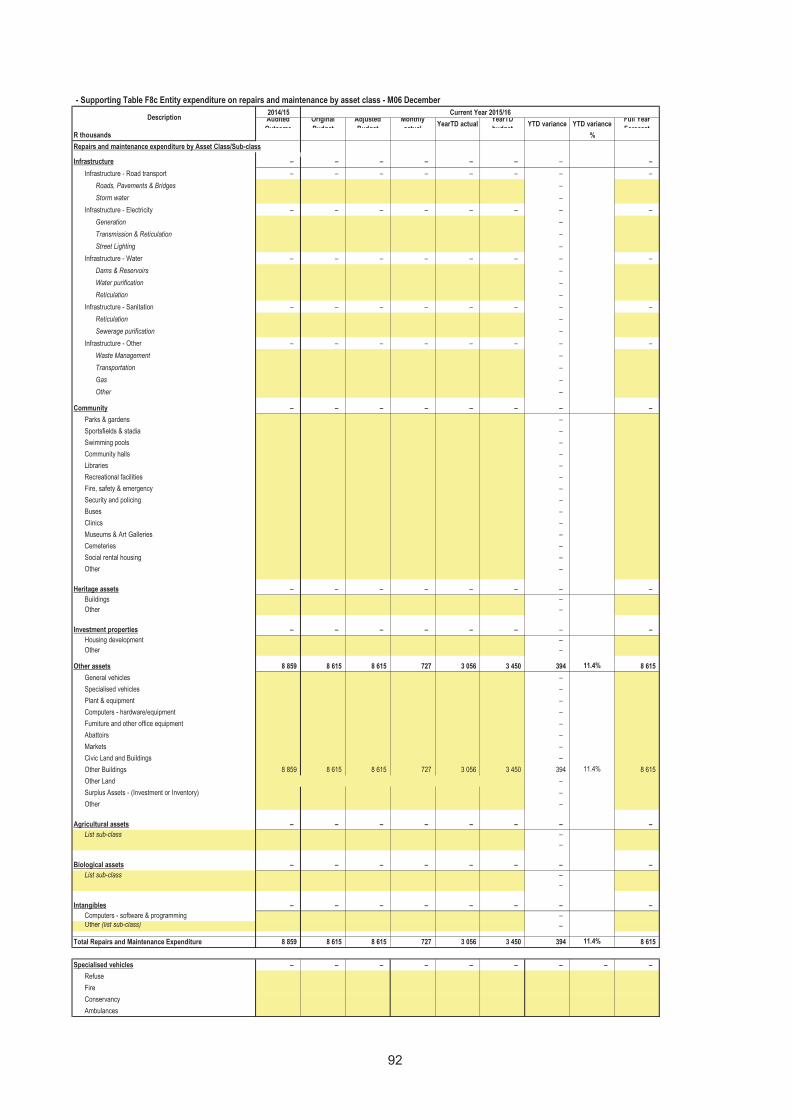
- Supporting Table F8c Entity expenditure on repairs and maintenance by asset class - M06 December
2014/15 Current Year 2015/16Audited
Outcome
Original
Budget
Adjusted
Budget
Monthly
actualYearTD actual
YearTD
budgetYTD variance YTD variance
Full Year
ForecastR thousands %
Repairs and maintenance expenditure by Asset Class/Sub-class
Infrastructure – – – – – – – –
Infrastructure - Road transport – – – – – – – –
Roads, Pavements & Bridges –
Storm water –
Infrastructure - Electricity – – – – – – – –
Generation –
Transmission & Reticulation –
Street Lighting –
Infrastructure - Water – – – – – – – –
Dams & Reservoirs –
Water purification –
Reticulation –
Infrastructure - Sanitation – – – – – – – –
Reticulation –
Sewerage purification –
Infrastructure - Other – – – – – – – –
Waste Management –
Transportation –
Gas –
Other –
Community – – – – – – – –
Parks & gardens –
Sportsfields & stadia –
Swimming pools –
Community halls –
Libraries –
Recreational facilities –
Fire, safety & emergency –
Security and policing –
Buses –
Clinics –
Museums & Art Galleries –
Cemeteries –
Social rental housing –
Other – –
Heritage assets – – – – – – – –
Buildings –
Other – –
Investment properties – – – – – – – –
Housing development –
Other –
Other assets 8 859 8 615 8 615 727 3 056 3 450 394 11.4% 8 615
General vehicles –
Specialised vehicles –
Plant & equipment –
Computers - hardware/equipment –
Furniture and other office equipment –
Abattoirs –
Markets –
Civic Land and Buildings –
Other Buildings 8 859 8 615 8 615 727 3 056 3 450 394 11.4% 8 615
Other Land –
Surplus Assets - (Investment or Inventory) –
Other –
Agricultural assets – – – – – – – –
List sub-class –
–
Biological assets – – – – – – – –
List sub-class –
–
Intangibles – – – – – – – –
Computers - software & programming –
Other (list sub-class) –
Total Repairs and Maintenance Expenditure 8 859 8 615 8 615 727 3 056 3 450 394 11.4% 8 615
Specialised vehicles – – – – – – – – –
Refuse
Fire
Conservancy
Ambulances
Description
92
ANNEXURE 4
TOP 150 CAPITAL
PROJECTS
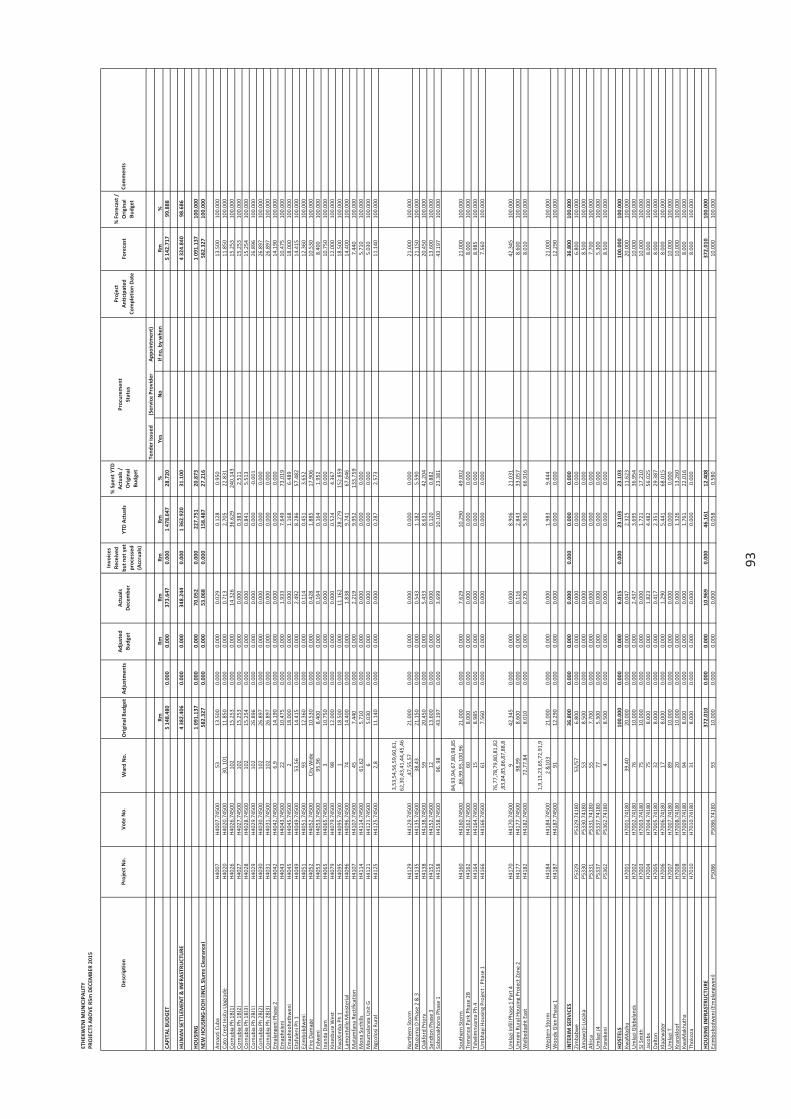
De
scri
pti
on
Pro
ject
No
.V
ote
No
.W
ard
No
.O
rig
ina
l B
ud
ge
tA
dju
stm
en
tsA
dju
ste
d
Bu
dg
et
Act
ua
ls
De
cem
be
r
Inv
oic
es
Re
ceiv
ed
bu
t n
ot
ye
t
pro
cess
ed
(Acc
rua
ls)
YT
D A
ctu
als
% S
pe
nt
YT
D
Act
ua
ls /
Ori
gin
al
Bu
dg
et
Pro
cure
me
nt
Sta
tus
Pro
ject
An
tici
pa
ted
Co
mp
leti
on
Da
te
Fo
reca
st
% F
ore
cast
/
Ori
gin
al
Bu
dg
et
Co
mm
en
ts
Te
nd
er
issu
ed
(Se
rvic
e P
rov
ide
r
Ap
po
intm
en
t)
Rm
Rm
Rm
Rm
Rm
%Y
es
No
If n
o,
by
wh
en
Rm
%
CA
PIT
AL
BU
DG
ET
5 1
48
.48
00
.00
00
.00
03
73
.64
70
.00
01
47
8.6
47
28
.72
05
14
2.7
17
99
.88
8
HU
MA
N S
ET
TLE
ME
NT
& I
NF
RA
ST
RU
CT
UR
E4
38
2.4
06
0.0
00
0.0
00
34
8.2
44
0.0
00
1 3
62
.92
03
1.1
00
4 3
24
.84
09
8.6
86
HO
US
ING
1
09
1.1
37
0.0
00
0.0
00
70
.05
20
.00
02
27
.75
12
0.8
73
1 0
91
.13
71
00
.00
0
NE
W H
OU
SIN
G-D
OH
(IN
CL
Slu
ms
Cle
ara
nce
)5
82
.32
70
.00
00
.00
05
3.0
68
0.0
00
15
8.4
87
27
.21
65
82
.32
71
00
.00
0
Am
ao
ti C
ub
aH
40
07
H4
00
7.7
45
00
53
13
.50
00
.00
00
.00
00
.02
90
.12
80
.95
01
3.5
00
10
0.0
00
Ca
to C
rest
In
situ
Up
gra
de
H4
02
0H
40
20
.74
50
03
0,
10
11
1.8
50
0.0
00
0.0
00
0.7
13
2.7
05
22
.83
11
1.8
50
10
0.0
00
Co
rnu
bia
Ph
1B
(1)
H4
02
6H
40
26
.74
50
01
02
15
.25
30
.00
00
.00
01
4.3
26
36
.62
92
40
.14
31
5.2
53
10
0.0
00
Co
rnu
bia
Ph
1B
(2)
H4
02
7H
40
27
.74
50
01
02
15
.25
30
.00
00
.00
00
.00
00
.38
32
.51
11
5.2
53
10
0.0
00
Co
rnu
bia
Ph
1B
(3)
H4
02
8H
40
28
.74
50
01
02
15
.25
40
.00
00
.00
00
.00
00
.84
15
.51
31
5.2
54
10
0.0
00
Co
rnu
bia
Ph
2B
(1)
H4
02
9H
40
29
.74
50
01
02
26
.89
60
.00
00
.00
00
.00
00
.00
0-0
.00
12
6.8
96
10
0.0
00
Co
rnu
bia
Ph
2B
(2)
H4
03
0H
40
30
.74
50
01
02
26
.89
70
.00
00
.00
00
.00
00
.00
00
.00
02
6.8
97
10
0.0
00
Co
rnu
bia
Ph
2B
(3)
H4
03
1H
40
31
.74
50
01
02
26
.89
70
.00
00
.00
00
.00
00
.00
00
.00
02
6.8
97
10
0.0
00
Em
ala
ng
en
i Ph
ase
2H
40
42
H4
04
2.7
45
00
6,9
14
.19
00
.00
00
.00
00
.00
00
.00
00
.00
01
4.1
90
10
0.0
00
Em
ap
he
len
iH
40
43
H4
04
3.7
45
00
22
10
.47
50
.00
00
.00
01
.93
37
.64
97
3.0
19
10
.47
51
00
.00
0
Em
ap
he
ph
eth
we
ni
H4
04
5H
40
45
.74
50
02
18
.00
00
.00
00
.00
00
.00
01
.16
86
.48
91
8.0
00
10
0.0
00
Eta
fule
ni P
h 1
H4
04
9H
40
49
.74
50
05
3,5
61
4.4
15
0.0
00
0.0
00
2.4
92
8.2
86
57
.48
21
4.4
15
10
0.0
00
Ezi
mb
ok
dw
en
iH
40
51
H4
05
1.7
45
00
93
12
.36
00
.00
00
.00
00
.11
40
.45
13
.65
21
2.3
60
10
0.0
00
Fir
e D
am
ag
eH
40
52
H4
05
2.7
45
00
Cit
y W
ide
10
.53
00
.00
00
.00
00
.42
81
.88
51
7.9
06
10
.53
01
00
.00
0
Fo
lwe
ni
H4
05
3H
40
53
.74
50
09
5,9
68
.40
00
.00
00
.00
00
.16
40
.16
41
.95
28
.40
01
00
.00
0
Ina
nd
a D
am
H4
06
5H
40
65
.74
50
03
10
.75
00
.00
00
.00
00
.00
00
.00
00
.00
01
0.7
50
10
0.0
00
Kin
gsb
urg
We
stH
40
79
H4
07
9.7
45
00
98
12
.00
00
.00
00
.00
00
.00
00
.52
44
.36
71
2.0
00
10
0.0
00
Kw
aX
imb
a P
h 1
H4
09
5H
40
95
.74
50
01
18
.50
00
.00
00
.00
01
1.1
62
28
.27
91
52
.85
91
8.5
00
10
0.0
00
Lam
on
tvill
e M
inis
teri
al
H4
09
6H
40
96
.74
50
07
41
4.4
00
0.0
00
0.0
00
1.8
38
9.7
41
67
.64
61
4.4
00
10
0.0
00
Ma
tam
fan
a R
ect
ific
ati
on
H4
10
7H
41
07
.74
50
04
57
.44
00
.00
00
.00
02
.21
99
.95
21
33
.75
97
.44
01
00
.00
0
Mo
na
Su
nh
ills
H4
11
4H
41
14
.74
50
06
1,6
25
.71
00
.00
00
.00
00
.00
00
.00
00
.00
05
.71
01
00
.00
0
Mp
um
ala
ng
a U
nit
GH
41
21
H4
12
1.7
45
00
65
.03
00
.00
00
.00
00
.00
00
.00
00
.00
05
.03
01
00
.00
0
Ng
colo
si R
ura
lH
41
25
H4
12
5.7
45
00
2,8
11
.14
00
.00
00
.00
00
.00
00
.28
72
.57
31
1.1
40
10
0.0
00
No
rth
ern
Sto
rmH
41
29
H4
12
9.7
45
00
3,5
3,5
4,5
6,5
9,6
0,6
1,
62
,30
,43
,41
,44
,45
,46
,47
,55
,57
21
.00
00
.00
00
.00
00
.00
00
.00
00
.00
02
1.0
00
10
0.0
00
Ntu
zum
a D
Ph
ase
2 &
3H
41
35
H4
13
5.7
45
00
38
,43
21
.15
00
.00
00
.00
00
.54
31
.18
25
.59
02
1.1
50
10
0.0
00
Oa
kfo
rd P
rio
ryH
41
38
H4
13
8.7
45
00
59
20
.45
00
.00
00
.00
05
.43
38
.63
14
2.2
04
20
.45
01
00
.00
0
Sa
nd
ton
Ph
ase
3H
41
52
H4
15
2.7
45
00
12
13
.60
00
.00
00
.00
00
.00
00
.12
00
.88
21
3.6
00
10
0.0
00
So
bo
na
kh
on
a P
ha
se 1
H4
15
8H
41
58
.74
50
09
6,
98
43
.19
70
.00
00
.00
03
.69
91
0.1
00
23
.38
14
3.1
97
10
0.0
00
So
uth
ern
Sto
rmH
41
60
H4
16
0.7
45
00
84
,93
,94
,67
,80
,98
,85
,86
,99
,95
,10
0,9
62
1.0
00
0.0
00
0.0
00
7.6
29
10
.29
04
9.0
02
21
.00
01
00
.00
0
Tre
na
nce
Pa
rk P
ha
se 2
BH
41
62
H4
16
2.7
45
00
60
8.0
00
0.0
00
0.0
00
0.0
00
0.0
00
0.0
00
8.0
00
10
0.0
00
Tsh
elim
ny
am
a P
h 4
H4
16
4H
41
64
.74
50
01
58
.98
50
.00
00
.00
00
.00
00
.00
00
.00
08
.98
51
00
.00
0
Um
bh
ay
i Ho
usi
ng
Pro
ject
: P
ha
se 1
H4
16
6H
41
66
.74
50
06
17
.56
00
.00
00
.00
00
.00
00
.00
00
.00
07
.56
01
00
.00
0
Um
lazi
In
fill
Ph
ase
1 P
art
4H
41
70
H4
17
0.7
45
00
76
,77
,78
,79
,80
,81
,82
,83
,84
,85
,86
,87
,88
,8
94
2.3
45
0.0
00
0.0
00
0.0
00
8.9
06
21
.03
14
2.3
45
10
0.0
00
Um
nin
i Ru
ral H
ou
sin
g P
roje
ct Z
on
e 2
H4
17
7H
41
77
.74
50
09
8,9
98
.60
00
.00
00
.00
00
.11
62
.84
33
3.0
57
8.6
00
10
0.0
00
We
lbe
da
gh
t E
ast
H
41
82
H4
18
2.7
45
00
72
,77
,84
8.0
10
0.0
00
0.0
00
0.2
30
5.3
60
66
.91
68
.01
01
00
.00
0
We
ste
rn S
torm
H
41
84
H4
18
4.7
45
00
1,9
,13
,23
,65
,72
,91
,9
2 &
10
32
1.0
00
0.0
00
0.0
00
0.0
00
1.9
83
9.4
44
21
.00
01
00
.00
0
Wo
od
y G
len
Ph
ase
1H
41
87
H4
18
7.7
45
00
91
12
.29
00
.00
00
.00
00
.00
00
.00
00
.00
01
2.2
90
10
0.0
00
INT
ER
IM S
ER
VIC
ES
36
.80
00
.00
00
.00
00
.00
00
.00
00
.00
00
.00
03
6.8
00
10
0.0
00
Zim
ba
bw
eP
53
29
P5
32
9.7
41
80
53
/57
6.8
00
0.0
00
0.0
00
0.0
00
0.0
00
0.0
00
6.8
00
10
0.0
00
Am
aw
oti
-Lu
sak
aP
53
30
P5
33
0.7
41
80
53
8.5
00
0.0
00
0.0
00
0.0
00
0.0
00
0.0
00
8.5
00
10
0.0
00
Afr
ica
P5
33
1P
53
31
.74
18
05
57
.70
00
.00
00
.00
00
.00
00
.00
00
.00
07
.70
01
00
.00
0
Um
lazi
J4
P5
33
7P
53
37
.74
18
07
75
.30
00
.00
00
.00
00
.00
00
.00
00
.00
05
.30
01
00
.00
0
Pa
ne
ke
ni
P5
36
2P
53
62
.74
18
04
8.5
00
0.0
00
0.0
00
0.0
00
0.0
00
0.0
00
8.5
00
10
0.0
00
HO
ST
ELS
10
0.0
00
0.0
00
0.0
00
6.0
15
0.0
00
23
.10
32
3.1
03
10
0.0
00
10
0.0
00
Kw
aM
ash
uH
70
01
H7
00
1.7
41
80
39
,40
20
.00
00
.00
00
.00
00
.04
72
.32
51
1.6
23
20
.00
01
00
.00
0
Um
lazi
Gle
be
lan
ds
H7
00
2H
70
02
.74
18
07
61
0.0
00
0.0
00
0.0
00
2.4
37
3.6
95
36
.95
41
0.0
00
10
0.0
00
SJ
Sm
ith
H7
00
3H
70
03
.74
18
07
51
0.0
00
0.0
00
0.0
00
0.0
00
1.7
21
17
.21
01
0.0
00
10
0.0
00
Jaco
bs
H7
00
4H
70
04
.74
18
07
58
.00
00
.00
00
.00
01
.82
34
.48
25
6.0
25
8.0
00
10
0.0
00
Da
lto
nH
70
05
H7
00
5.7
41
80
32
8.0
00
0.0
00
0.0
00
0.4
17
2.3
51
29
.38
78
.00
01
00
.00
0
Kla
arw
ate
rH
70
06
H7
00
6.7
41
80
17
8.0
00
0.0
00
0.0
00
1.2
90
5.4
41
68
.01
58
.00
01
00
.00
0
Um
lazi
TH
70
07
H7
00
7.7
41
80
89
10
.00
00
.00
00
.00
00
.00
00
.00
00
.00
01
0.0
00
10
0.0
00
Kra
nsk
loo
fH
70
08
H7
00
8.7
41
80
20
10
.00
00
.00
00
.00
00
.00
01
.32
61
3.2
60
10
.00
01
00
.00
0
Kw
aM
ak
hu
tha
H7
00
9H
70
09
.74
18
09
48
.00
00
.00
00
.00
00
.00
01
.76
12
2.0
16
8.0
00
10
0.0
00
Th
ok
oza
H7
01
0H
70
10
.74
18
03
18
.00
00
.00
00
.00
00
.00
00
.00
00
.00
08
.00
01
00
.00
0
HO
US
ING
IN
FR
AS
TR
UC
TU
RE
37
2.0
10
0.0
00
0.0
00
10
.96
90
.00
04
6.1
61
12
.40
83
72
.01
01
00
.00
0
Ezi
mb
ok
od
we
ni (
Em
pla
ng
we
ni)
P5
08
6P
50
86
.74
18
09
31
0.0
00
0.0
00
0.0
00
0.0
00
0.0
58
0.5
80
10
.00
01
00
.00
0
ET
HE
KW
EN
I M
UN
ICIP
ALI
TY
PR
OJE
CT
S A
BO
VE
R5
m D
EC
EM
BE
R 2
01
5
93
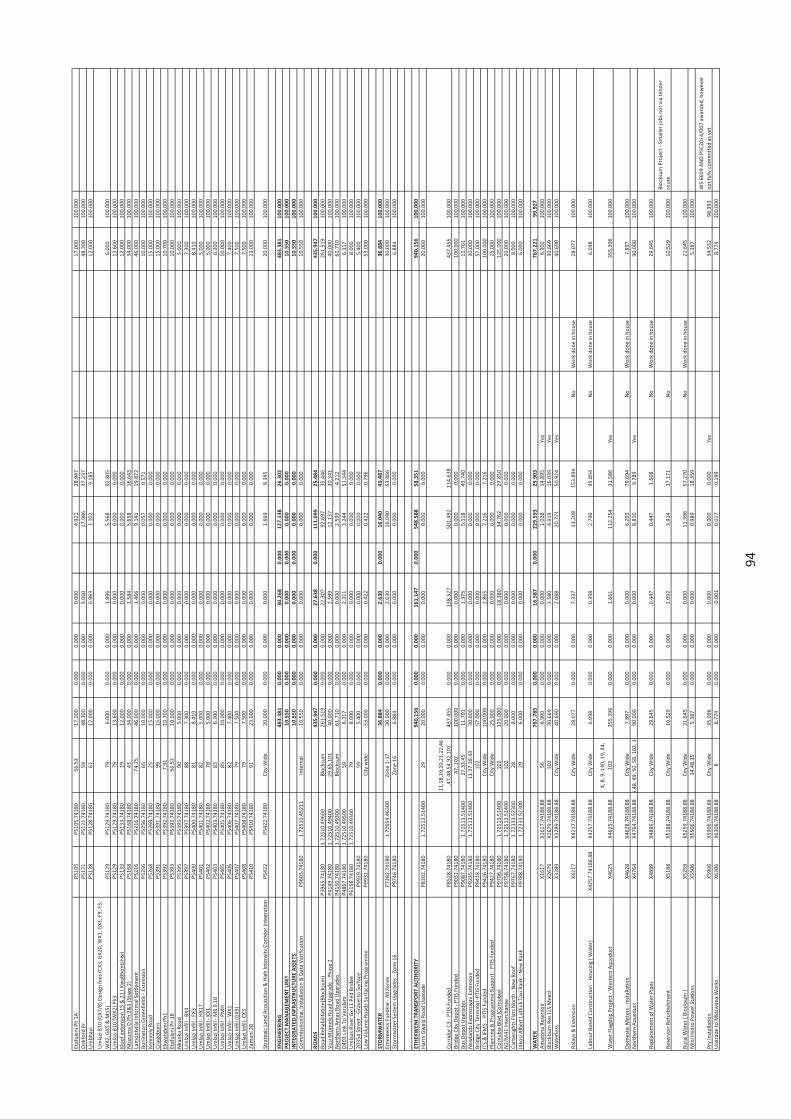
Eta
fule
ni P
h 1
AP
51
05
P5
10
5.7
41
80
56
,53
17
.00
00
.00
00
.00
00
.00
04
.92
12
8.9
47
17
.00
01
00
.00
0
Oa
kfo
rd P
r.P
51
21
P5
12
1.7
41
80
59
48
.30
00
.00
00
.00
05
.06
01
7.9
86
37
.23
74
8.3
00
10
0.0
00
Um
bh
ay
iP
51
28
P5
12
8.7
41
80
61
12
.00
00
.00
00
.00
00
.96
31
.10
29
.18
51
2.0
00
10
0.0
00
Um
lazi
B1
0 (
GX
7/8
) D
esi
gn
fe
es
(CX
3,
GX
20
, W
X1
, G
X1
, F
9,
F3
,
WX
2,
GX
5 &
M1
5)
P5
12
9P
51
29
.74
18
07
96
.00
00
.00
00
.00
01
.89
65
.56
89
2.8
05
6.0
00
10
0.0
00
Um
lazi
B1
0 (
WX
2)
Ph
3P
51
29
P5
12
9.7
41
80
79
13
.60
00
.00
00
.00
00
.00
00
.00
00
.00
01
3.6
00
10
0.0
00
Klo
of
ext
en
sio
n 1
5 &
21
( K
wa
Bh
on
tsh
isi)
P5
13
3P
51
33
.74
18
01
91
2.0
00
0.0
00
0.0
00
0.0
00
0.0
00
0.0
00
12
.00
01
00
.00
0
Ntu
zum
a D
Ph
2&
3 (
Sta
ge
2)
P5
16
8P
51
68
.74
18
04
33
4.0
00
0.0
00
0.0
00
1.5
84
5.6
58
16
.64
33
4.0
00
10
0.0
00
Lam
on
tvill
e I
nfo
rma
l Se
ttle
me
nt
P5
21
6P
52
16
.74
18
07
4,7
54
6.0
00
0.0
00
0.0
00
1.4
66
9.1
41
19
.87
24
6.0
00
10
0.0
00
Bu
rlin
gto
n G
ree
nfi
eld
s -
Ext
en
sio
nP
52
56
P5
25
6.7
41
80
65
10
.00
00
.00
00
.00
00
.00
00
.05
70
.57
11
0.0
00
10
0.0
00
Ke
nn
ed
y R
oa
dP
52
68
P5
26
8.7
41
80
25
15
.00
00
.00
00
.00
00
.00
00
.00
00
.00
01
5.0
00
10
0.0
00
Cra
ige
bu
rnP
53
91
P5
39
1.7
41
80
99
15
.00
00
.00
00
.00
00
.00
00
.00
00
.00
01
5.0
00
10
0.0
00
Ek
wa
nd
en
i Ph
1P
53
92
P5
39
2.7
41
80
7,9
11
0.7
00
0.0
00
0.0
00
0.0
00
0.0
00
0.0
00
10
.70
01
00
.00
0
Eta
fule
ni P
h 1
BP
53
93
P5
39
3.7
41
80
56
,53
10
.00
00
.00
00
.00
00
.00
00
.00
00
.00
01
0.0
00
10
0.0
00
Nk
an
ku
Ro
ad
P5
39
5P
53
95
.74
18
09
05
.00
00
.00
00
.00
00
.00
00
.00
00
.00
05
.00
01
00
.00
0
Um
lazi
In
fill
- B
X4
P5
39
7P
53
97
.74
18
08
87
.30
00
.00
00
.00
00
.00
00
.00
00
.00
07
.30
01
00
.00
0
Um
lazi
In
fill
- F
X3
P5
40
0P
54
00
.74
18
08
18
.41
00
.00
00
.00
00
.00
00
.00
00
.00
08
.41
01
00
.00
0
Um
lazi
In
fill
- H
X1
7P
54
01
P5
40
1.7
41
80
82
5.0
00
0.0
00
0.0
00
0.0
00
0.0
00
0.0
00
5.0
00
10
0.0
00
Um
lazi
In
fill
- K
X1
P5
40
2P
54
02
.74
18
07
85
.00
00
.00
00
.00
00
.00
00
.00
00
.00
05
.00
01
00
.00
0
Um
lazi
In
fill
- M
8,9
,10
P5
40
3P
54
03
.74
18
08
36
.30
00
.00
00
.00
00
.00
00
.00
00
.00
06
.30
01
00
.00
0
Um
lazi
In
fill
- P
MH
P5
40
5P
54
05
.74
18
08
51
0.0
00
0.0
00
0.0
00
0.0
00
0.0
00
0.0
00
10
.00
01
00
.00
0
Um
lazi
In
fill
- W
X1
P5
40
6P
54
06
.74
18
08
27
.40
00
.00
00
.00
00
.00
00
.00
00
.00
07
.40
01
00
.00
0
Um
lazi
In
fill
(GX
5)
P5
40
7P
54
07
.74
18
07
97
.50
00
.00
00
.00
00
.00
00
.00
00
.00
07
.50
01
00
.00
0
Um
lazi
In
fill-
CX
3P
54
08
P5
40
8.7
41
80
79
7.5
00
0.0
00
0.0
00
0.0
00
0.0
00
0.0
00
7.5
00
10
0.0
00
Za
ma
ni 2
BP
54
10
P5
41
0.7
41
80
91
23
.00
00
.00
00
.00
00
.00
00
.00
00
.00
02
3.0
00
10
0.0
00
Str
ate
gic
La
nd
Acq
uis
itio
n &
Hig
h I
nte
nsi
ty C
orr
ido
r In
teg
rati
on
P5
42
2P
54
22
.74
18
0C
ity
Wid
e2
0.0
00
0.0
00
0.0
00
0.0
00
1.6
69
8.3
45
20
.00
01
00
.00
0
EN
GIN
EE
RIN
G4
83
.38
10
.00
00
.00
03
0.2
68
0.0
00
12
7.1
38
26
.30
24
83
.38
11
00
.00
0
PR
OJE
CT
MA
NA
GE
ME
NT
UN
IT1
0.5
50
0.0
00
0.0
00
0.0
00
0.0
00
0.0
00
0.0
00
10
.55
01
00
.00
0
INT
EG
RA
TE
D I
NF
RA
ST
RU
CT
UR
E A
SS
ET
S1
0.5
50
0.0
00
0.0
00
0.0
00
0.0
00
0.0
00
0.0
00
10
.55
01
00
.00
0
Co
mm
issi
ion
ing
, In
sta
llati
on
& D
ata
Ve
rifi
cati
on
P9
60
3.7
41
80
1.7
25
10
.45
21
1In
tern
al
10
.55
00
.00
00
.00
00
.00
00
.00
00
.00
01
0.5
50
10
0.0
00
RO
AD
S4
35
.94
70
.00
00
.00
02
7.6
38
0.0
00
11
1.0
99
25
.48
44
35
.94
71
00
.00
0
Ro
ad
Re
ha
bili
tati
on
(Blo
cksu
m)
P3
96
5.7
41
80
1.7
25
10
.49
60
0B
lock
sum
26
1.5
19
0.0
00
0.0
00
22
.30
79
2.6
97
35
.44
62
61
.51
91
00
.00
0
Vu
si M
zim
ela
Ro
ad
Up
gra
de
- P
ha
se 2
P4
14
9.7
41
80
1.7
25
10
.49
40
02
9,6
5,1
01
40
.00
00
.00
00
.00
02
.59
91
2.1
37
30
.34
14
0.0
00
10
0.0
00
No
rth
ern
Are
as
Ro
ad
Up
gra
de
sP
41
50
.74
18
01
.72
51
0.4
93
00
Blo
cksu
m6
1.7
10
0.0
00
0.0
00
0.0
00
2.5
99
4.2
12
61
.71
01
00
.00
0
D4
03
Lin
k T
o V
eru
lam
P4
86
7.7
41
80
1.7
25
10
.49
50
05
96
.31
70
.00
00
.00
02
.31
13
.24
45
1.3
44
6.3
17
10
0.0
00
Um
laa
s R
ive
r G
x 1
1 P
ed
Bri
dg
eP
61
56
.74
18
01
.72
51
0.4
93
00
79
8.0
00
0.0
00
0.0
00
0.0
00
0.0
00
0.0
00
8.0
00
10
0.0
00
20
35
4 S
tre
et
- G
rav
el t
o S
urf
ace
P9
92
9.7
41
80
59
5.4
00
0.0
00
0.0
00
0.0
00
0.0
00
0.0
00
5.4
00
10
0.0
00
Low
Vo
lum
e R
oa
ds
Su
rfa
cin
g P
rog
ram
me
P9
93
1.7
41
80
Cit
y w
ide
53
.00
00
.00
00
.00
00
.42
20
.42
20
.79
65
3.0
00
10
0.0
00
ST
OR
MW
AT
ER
36
.88
40
.00
00
.00
02
.63
00
.00
01
6.0
40
43
.48
73
6.8
84
10
0.0
00
Em
erg
en
cy F
un
din
g -
All
Zo
ne
sP
73
82
.74
18
01
.72
65
4.4
63
00
Zo
ne
1-1
73
0.0
00
0.0
00
0.0
00
2.6
30
16
.04
05
3.4
66
30
.00
01
00
.00
0
Sto
rmw
ate
r S
yst
em
Up
gra
de
s -
Zo
ne
16
P9
74
6.7
41
80
Zo
ne
16
6.8
84
0.0
00
0.0
00
0.0
00
0.0
00
0.0
00
6.8
84
10
0.0
00
ET
HE
KW
EN
I T
RA
NS
PO
RT
AU
TH
OR
ITY
94
0.1
56
0.0
00
0.0
00
16
1.1
47
0.0
00
54
8.5
88
58
.35
19
40
.15
61
00
.00
0
Ha
rry
Gw
ala
Ro
ad
Up
gra
de
P8
30
2.7
41
80
1.7
25
13
.51
40
02
92
0.0
00
0.0
00
0.0
00
0.0
00
0.0
00
0.0
00
20
.00
01
00
.00
0
Co
rrid
or
C3
- P
TIS
Fu
nd
ed
P
85
28
.74
18
0
11
,18
,19
,20
,21
,22
,46
,47
,48
,54
,92
,10
24
37
.45
50
.00
00
.00
01
38
.52
75
01
.49
21
14
.63
84
37
.45
51
00
.00
0
Bri
dg
e C
ity
De
po
t -
PT
IS F
un
de
dP
90
31
.74
18
04
7,
10
21
00
.00
00
.00
00
.00
00
.00
00
.00
00
.00
01
00
.00
01
00
.00
0
Bu
s D
ep
ot
Up
gra
de
sP
90
87
.74
18
01
.72
51
3.5
14
00
27
,33
,45
11
.70
10
.00
00
.00
01
.37
55
.11
84
3.7
40
11
.70
11
00
.00
0
Ne
wla
nd
s E
xpre
ssw
ay
Ext
en
sio
nP
92
35
.74
18
01
.72
51
3.5
14
00
11
,37
,38
,43
30
.00
00
.00
00
.00
00
.00
00
.00
00
.00
03
0.0
00
10
0.0
00
Bri
dg
e C
ity
Te
rmin
al -
PT
IS F
un
de
d
P9
41
8.7
41
80
10
25
7.0
00
0.0
00
0.0
00
0.0
00
0.0
00
0.0
00
57
.00
01
00
.00
0
ITS
& I
FM
S -
PT
IS F
un
de
dP
94
26
.74
18
0C
ity
Wid
e1
00
.00
00
.00
00
.00
02
.86
57
.21
67
.21
61
00
.00
01
00
.00
0
Pla
nn
ing
& P
rog
ram
me
Su
pp
ort
- P
TIS
Fu
nd
ed
P9
42
7.7
41
80
Cit
y W
ide
25
.00
00
.00
00
.00
00
.00
00
.00
00
.00
02
5.0
00
10
0.0
00
Co
rnu
bia
Blv
d (
Co
rnu
bia
)P
97
06
.74
18
01
.72
51
3.5
14
00
10
21
25
.00
00
.00
00
.00
01
8.3
80
34
.76
22
7.8
10
12
5.0
00
10
0.0
00
N2
/M4
1 I
nte
rch
an
ge
P9
75
8.7
41
80
1.7
25
13
.51
40
01
02
20
.00
00
.00
00
.00
00
.00
00
.00
00
.00
02
0.0
00
10
0.0
00
Ca
rtw
rig
hts
Fla
ts N
ort
h -
Ne
w R
oo
fP
97
67
.74
18
01
.72
33
3.5
23
00
28
8.0
00
0.0
00
0.0
00
0.0
00
0.0
00
0.0
00
8.0
00
10
0.0
00
Ink
osi
Alb
ert
Lu
thu
li T
axi
Ra
nk
- N
ew
Ra
nk
P9
78
8.7
41
80
1.7
23
33
.52
30
02
96
.00
00
.00
00
.00
00
.00
00
.00
00
.00
06
.00
01
00
.00
0
WA
TE
R7
67
.78
50
.00
00
.00
01
6.5
87
0.0
00
22
9.5
93
29
.90
37
67
.22
19
9.9
27
Am
ato
na
Re
serv
oir
X1
61
7X
16
17
.74
18
8.8
85
66
.90
00
.00
00
.00
00
.00
01
.02
81
4.8
95
Ye
s6
.90
01
00
.00
0
Bla
ckb
urn
Re
s (1
5 M
eg
s)X
26
79
X2
67
9.7
41
88
.88
10
23
0.6
69
0.0
00
0.0
00
1.5
80
4.9
19
16
.03
9Y
es
30
.66
91
00
.00
0
Wa
terl
oss
X3
28
9X
32
89
.74
18
8.8
8C
ity
Wid
e4
0.6
90
0.0
00
0.0
00
2.0
88
20
.72
15
0.9
24
Ye
s4
0.6
90
10
0.0
00
Re
lay
s &
Ext
en
sio
nX
42
17
X4
21
7.7
41
88
.88
Cit
y W
ide
28
.07
70
.00
00
.00
07
.33
74
3.2
08
15
3.8
94
No
Wo
rk d
on
e in
ho
use
28
.07
71
00
.00
0
Lab
ou
r B
ase
d C
on
stru
ctio
n -
Ho
usi
ng
( W
ate
r)X
42
57
.74
18
8.8
8X
42
57
.74
18
8.8
8C
ity
Wid
e6
.09
80
.00
00
.00
00
.39
82
.79
64
5.8
54
No
Wo
rk d
on
e in
ho
use
6.0
98
10
0.0
00
Wa
ter
Fla
gsh
ip P
roje
ct -
We
ste
rn A
qu
ed
uct
X4
62
5X
46
25
.74
18
8.8
8
4,
8,
9,
14
0,
19
, 4
4,
10
33
55
.39
60
.00
00
.00
01
.66
11
12
.25
43
1.5
86
Ye
s3
55
.39
61
00
.00
0
Do
me
stic
Me
ters
- I
nst
alla
tio
nX
46
28
X4
62
8.7
41
88
.88
Cit
y W
ide
7.8
97
0.0
00
0.0
00
0.0
00
6.2
93
79
.69
4N
oW
ork
do
ne
in h
ou
se7
.89
71
00
.00
0
No
rth
ern
Aq
ue
du
ctX
47
64
X4
76
4.7
41
88
.88
35
,48
, 4
9,
50
, 5
8,
10
2,
10
39
0.0
00
0.0
00
0.0
00
0.0
00
8.8
10
9.7
89
Ye
s9
0.0
00
10
0.0
00
Re
pla
cem
en
t o
f W
ate
r P
ipe
sX
48
89
X4
88
9.7
41
88
.88
Cit
y W
ide
29
.64
50
.00
00
.00
00
.44
70
.44
71
.50
8N
oW
ork
do
ne
in h
ou
se2
9.6
45
10
0.0
00
Re
serv
oir
Re
furb
ish
me
nt
X5
18
8X
51
88
.74
18
8.8
8C
ity
Wid
e1
0.5
29
0.0
00
0.0
00
2.0
92
3.9
14
37
.17
1N
o1
0.5
29
10
0.0
00
Blo
cksu
m P
roje
ct -
Sm
alle
r jo
bs
no
t v
ia t
en
de
r
rou
te
Ru
ral W
ate
r (
Blo
cksu
m )
X5
25
9X
52
59
.74
18
8.8
8C
ity
Wid
e2
1.6
45
0.0
00
0.0
00
0.0
00
12
.39
65
7.2
70
No
Wo
rk d
on
e in
ho
use
21
.64
51
00
.00
0
Min
i Hy
dro
Po
we
r S
tati
on
sX
55
06
X5
50
6.7
41
88
.88
34
,48
,35
5.3
87
0.0
00
0.0
00
0.0
00
0.9
89
18
.35
95
.38
71
00
.00
0
Prv
In
sta
llati
on
X5
90
6X
59
06
.74
18
8.8
8C
ity
Wid
e3
5.0
96
0.0
00
0.0
00
0.0
00
0.0
00
0.0
00
Ye
s3
4.5
32
98
.39
3
WS
66
09
AN
D P
SC
20
14
/00
7 a
wa
rde
d,
ho
we
ve
r
no
t fu
lly c
om
mit
ted
as
ye
t
Up
gra
de
to
Mk
izw
an
a W
ork
sX
63
06
X6
30
6.7
41
88
.88
88
.77
40
.00
00
.00
0-0
.00
10
.01
70
.19
98
.77
41
00
.00
0
94
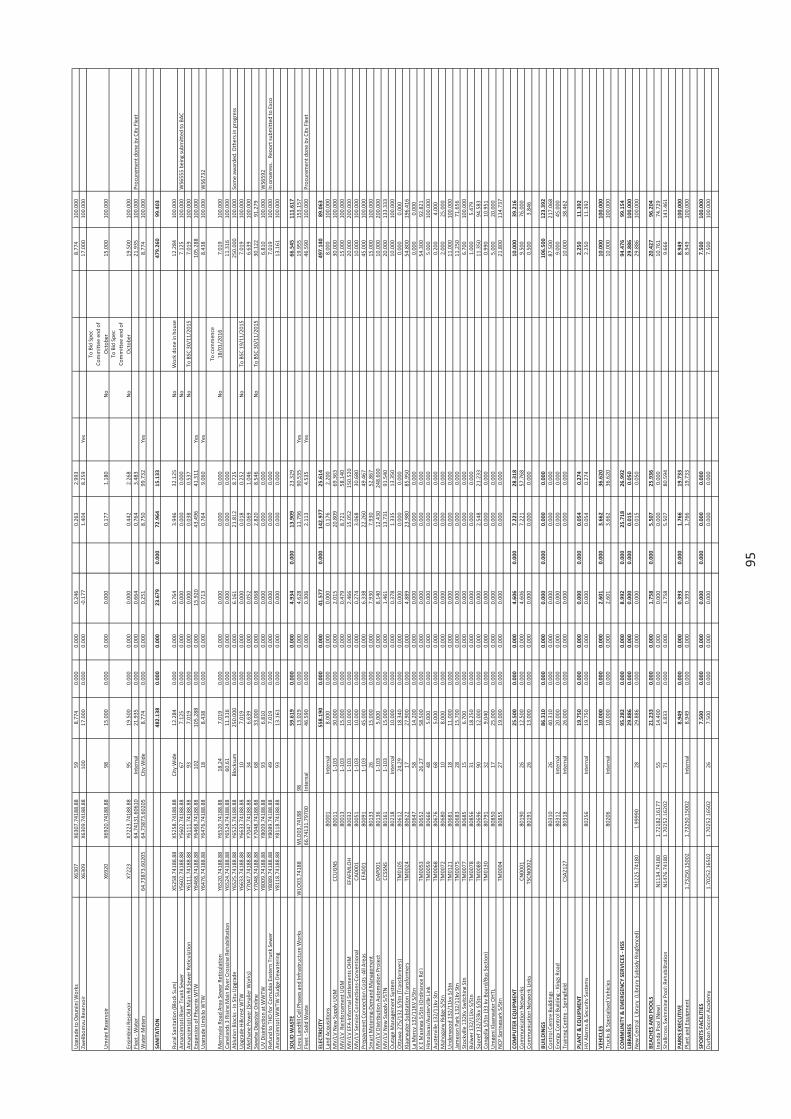
Up
gra
de
to
Og
un
jin
i Wo
rks
X6
30
7X
63
07
.74
18
8.8
85
98
.77
40
.00
00
.00
00
.24
60
.26
32
.99
38
.77
41
00
.00
0
Zw
elib
om
vu
Re
serv
oir
X6
30
9X
63
09
.74
18
8.8
81
00
17
.00
00
.00
00
.00
0-0
.17
71
.40
48
.25
9Y
es
17
.00
01
00
.00
0
Um
nin
i Re
serv
oir
X6
92
0X
69
20
.74
18
8.8
89
81
5.0
00
0.0
00
0.0
00
0.0
00
0.1
77
1.1
80
No
To
Bid
Sp
ec
Co
mm
itte
e e
nd
of
Oct
ob
er
15
.00
01
00
.00
0
En
sim
bin
i Re
serv
oir
X7
22
3X
72
23
.74
18
8.8
89
51
9.5
00
0.0
00
0.0
00
0.0
00
0.4
42
2.2
68
No
To
Bid
Sp
ec
Co
mm
itte
e e
nd
of
Oct
ob
er
19
.50
01
00
.00
0
Fle
et
- W
ate
r6
4.7
41
31
.60
61
0In
tern
al
21
.93
50
.00
00
.00
00
.66
40
.76
43
.48
32
1.9
35
10
0.0
00
Pro
cure
me
nt
do
ne
by
Cit
y F
lee
t
Wa
ter
Me
ters
64
.73
87
3.6
02
05
64
.73
87
3.6
02
05
Cit
y W
ide
8.7
74
0.0
00
0.0
00
0.2
51
8.7
50
99
.73
2Y
es
8.7
74
10
0.0
00
SA
NIT
AT
ION
48
2.1
38
0.0
00
0.0
00
23
.67
90
.00
07
2.9
64
15
.13
34
79
.26
09
9.4
03
Ru
ral S
an
ita
tio
n (
Blo
ck S
um
)X
52
58
.74
18
8.8
8X
52
58
.74
18
8.8
8C
ity
Wid
e1
2.2
84
0.0
00
0.0
00
0.7
64
3.9
46
32
.12
5N
oW
ork
do
ne
in h
ou
se1
2.2
84
10
0.0
00
Am
an
zim
toti
Riv
er
Tru
nk
Se
we
rY
56
02
.74
18
8.8
8Y
56
02
.74
18
8.8
86
77
.12
50
.00
00
.00
00
.00
00
.00
00
.00
0N
o7
.12
51
00
.00
0W
S6
55
5 b
ein
g s
ub
mit
ted
to
BA
C
Am
an
zim
toti
Old
Ma
in R
d S
ew
er
Re
ticu
lati
on
Y6
11
1.7
41
88
.88
Y6
11
1.7
41
88
.88
93
7.0
19
0.0
00
0.0
00
0.0
00
0.0
38
0.5
37
No
To
BS
C 3
0/1
1/2
01
57
.01
91
00
.00
0
Exp
an
sio
n o
f P
ho
en
ix W
TW
Y6
46
8.7
41
88
.88
Y6
46
8.7
41
88
.88
10
21
05
.28
80
.00
00
.00
01
5.9
20
43
.49
64
1.3
11
Ye
s1
05
.28
81
00
.00
0
Up
gra
de
Um
bilo
WT
WY
64
76
.74
18
8.8
8Y
64
76
.74
18
8.8
81
88
.43
80
.00
00
.00
00
.71
30
.76
49
.06
0Y
es
8.4
38
10
0.0
00
WS
67
32
Me
rriv
ale
Ro
ad
Are
a S
ew
er
Re
ticu
lati
on
Y6
52
0.7
41
88
.88
Y6
52
0.7
41
88
.88
18
,24
7.0
19
0.0
00
0.0
00
0.0
00
0.0
00
0.0
00
No
To
co
mm
en
ce
18
/01
/20
16
7.0
19
10
0.0
00
Ca
ne
lan
ds
3 R
isin
g M
ain
Riv
er
Cro
ssin
g R
eh
ab
ilita
tio
nY
65
24
.74
18
8.8
8Y
65
24
.74
18
8.8
86
0,6
11
1.3
16
0.0
00
0.0
00
0.0
00
0.0
00
0.0
00
11
.31
61
00
.00
0
Ab
luti
on
Blo
cks
- In
Sit
u U
pg
rad
eY
65
25
.74
18
8.8
8Y
65
25
.74
18
8.8
8B
lock
sum
25
0.0
00
0.0
00
0.0
00
6.1
61
21
.81
28
.72
52
50
.00
01
00
.00
0S
om
e a
wa
rde
d.
Oth
ers
in p
rog
ress
Up
gra
de
Hill
cre
st W
TW
Y6
63
3.7
41
88
.88
Y6
63
3.7
41
88
.88
10
7.0
19
0.0
00
0.0
00
0.0
00
0.0
18
0.2
52
No
To
BS
C 1
9/1
1/2
01
57
.01
91
00
.00
0
Me
tha
ne
Po
we
r (S
ma
ller
Wo
rks)
Y
70
47
.74
18
8.8
8Y
70
47
.74
18
8.8
83
46
.63
90
.00
00
.00
00
.05
20
.06
91
.04
66
.63
91
00
.00
0
Sw
wtw
Dig
est
er
On
line
Y7
04
8.7
41
88
.88
Y7
04
8.7
41
88
.88
68
33
.00
00
.00
00
.00
00
.06
82
.82
08
.54
6N
oT
o B
SC
30
/11
/20
15
30
.12
29
1.2
79
UV
Dis
infe
ctio
n a
t W
WT
WY
80
09
.74
18
8.8
8Y
80
09
.74
18
8.8
89
36
.81
00
.00
00
.00
00
.00
00
.00
00
.00
06
.81
01
00
.00
0W
S6
59
2
Re
fun
d t
o T
HD
fo
r C
orn
ub
ia E
ast
ern
Tru
nk
Se
we
rY
80
89
.74
18
8.8
8Y
80
89
.74
18
8.8
84
97
.01
90
.00
00
.00
00
.00
00
.00
00
.00
07
.01
91
00
.00
0In
pro
gre
ss.
Re
po
rt s
ub
mit
ted
to
Exc
o
Am
an
zim
toti
WW
TW
Slu
dg
e D
ew
ate
rin
g
Y8
11
8.7
41
88
.88
Y8
11
8.7
41
88
.88
93
13
.16
10
.00
00
.00
00
.00
00
.00
00
.00
01
3.1
61
10
0.0
00
SO
LID
WA
ST
E5
9.6
19
0.0
00
0.0
00
4.9
34
0.0
00
13
.90
92
3.3
29
66
.54
51
11
.61
7
Lov
u L
an
dfi
ll C
ell
Ph
ase
s a
nd
In
fra
stru
ctu
re W
ork
sW
LO0
3.7
41
88
WLO
03
.74
18
89
81
3.0
29
0.0
00
0.0
00
4.6
28
11
.79
69
0.5
35
Ye
s1
9.9
55
15
3.1
57
Fle
et
- S
olid
Wa
ste
66
.74
13
1.7
97
00
Inte
rna
l4
6.5
90
0.0
00
0.0
00
0.3
06
2.1
13
4.5
35
Ye
s4
6.5
90
10
0.0
00
Pro
cure
me
nt
do
ne
by
Cit
y F
lee
t
ELE
CT
RIC
ITY
55
8.1
90
0.0
00
0.0
00
41
.57
70
.00
01
42
.97
72
5.6
14
49
7.1
40
89
.06
3
Lan
d A
cqu
isit
ion
s8
00
01
Inte
rna
l8
.00
00
.00
00
.00
00
.00
00
.17
62
.20
08
.00
01
00
.00
0
MV
/LV
Ne
w S
up
ply
UG
MC
CU
GN
S8
00
11
1-1
03
30
.00
00
.00
00
.00
02
.01
52
0.8
09
69
.36
33
0.0
00
10
0.0
00
MV
/LV
Re
info
rce
me
nt
UG
M8
00
13
1-1
03
15
.00
00
.00
00
.00
00
.47
98
.72
15
8.1
40
15
.00
01
00
.00
0
MV
/LV
EF
A-I
nfo
rma
l Se
ttle
me
nts
OH
ME
FA
FM
LOH
80
03
21
-10
31
0.0
00
0.0
00
0.0
00
2.4
66
15
.05
21
50
.52
02
0.0
00
20
0.0
00
MV
/LV
Se
rvic
e C
on
ne
ctio
ns-
Co
nv
en
tio
na
lC
A0
00
18
00
51
1-1
03
10
.00
00
.00
00
.00
00
.27
43
.06
83
0.6
80
10
.00
01
00
.00
0
Pre
pa
ym
en
t C
on
ne
ctio
n C
ost
s -A
ll A
rea
sE
FA
00
18
00
91
1-1
03
45
.00
00
.00
00
.00
06
.33
82
2.2
60
49
.46
74
5.0
00
10
0.0
00
Sm
art
Me
teri
ng
-De
ma
nd
Ma
na
ge
me
nt
80
13
32
61
5.0
00
0.0
00
0.0
00
7.9
30
7.9
30
52
.86
71
5.0
00
10
0.0
00
MV
/LV
Dis
trib
uti
on
Au
tom
ati
on
Pro
ject
DA
P0
01
80
13
61
-10
35
.00
00
.00
00
.00
08
.14
01
2.4
30
24
8.6
00
10
.00
02
00
.00
0
MV
/LV
Ne
w S
up
ply
S/S
TN
CC
SS
NS
80
16
11
-10
31
5.0
00
0.0
00
0.0
00
1.4
61
13
.73
19
1.5
40
20
.00
01
33
.33
3
Ou
tag
e M
an
ag
em
en
t S
yst
em
80
21
8In
tern
al
10
.00
00
.00
00
.00
00
.37
81
.33
51
3.3
50
10
.00
01
00
.00
0
Ott
aw
a 2
75
/13
2 S
/Stn
(T
ran
sfo
rme
rs)
TM
01
05
80
61
22
4,2
91
8.3
40
0.0
00
0.0
00
0.0
00
0.0
00
0.0
00
0.0
00
0.0
00
Kla
arw
ate
r-S
ub
sta
tio
n T
ran
sfo
rme
rsT
M0
02
48
06
22
17
27
.90
00
.00
00
.00
04
.88
92
3.9
80
85
.95
05
4.8
00
19
6.4
16
La M
erc
y 1
32
/11
KV
S/S
tn8
06
47
58
14
.20
00
.00
00
.00
00
.00
00
.00
00
.00
00
.00
00
.00
0
K E
Ma
sin
ga
S/S
tn (
Ord
ina
nce
Rd
)T
M0
05
38
06
52
26
,27
58
.50
00
.00
00
.00
00
.00
00
.00
00
.00
05
4.3
00
92
.82
1
Him
ala
ya
s/A
ust
erv
ille
Lin
kT
M0
05
98
06
66
48
5.0
00
0.0
00
0.0
00
0.0
00
0.0
00
0.0
00
5.0
00
10
0.0
00
Au
ste
rvill
e 1
32
/11
kv
Stn
TM
00
68
80
67
66
85
.00
00
.00
00
.00
00
.00
00
.00
00
.00
00
.20
04
.00
0
Ma
ho
ga
ny
Rid
ge
S/S
tnT
M0
07
28
06
80
10
8.0
00
0.0
00
0.0
00
0.0
00
0.0
00
0.0
00
2.0
00
25
.00
0
Un
de
rwo
od
13
2/1
1k
v S
/Stn
TM
01
21
80
68
11
81
1.0
00
0.0
00
0.0
00
0.0
00
0.0
00
0.0
00
11
.00
01
00
.00
0
Jam
eso
n P
ark
13
2/1
1k
v S
tnT
M0
07
58
06
83
28
15
.70
00
.00
00
.00
00
.00
00
.00
00
.00
01
1.2
50
71
.65
6
Sto
ckv
ille
13
2K
v S
wit
chin
g S
tnT
M0
07
78
06
85
15
6.7
00
0.0
00
0.0
00
0.0
00
0.0
00
0.0
00
6.7
00
10
0.0
00
Bu
lwe
r 1
32
/11
kv
S/S
tnT
M0
07
88
08
56
31
18
.25
00
.00
00
.00
00
.00
00
.00
00
.00
01
.00
05
.47
9
Sa
pre
f 1
32
/33
kv
S/S
tnT
M0
08
98
06
96
90
12
.00
00
.00
00
.00
00
.00
02
.54
82
1.2
33
11
.35
09
4.5
83
Co
ng
ella
S/S
tn (
33
kv
Bo
ard
/Bu
s S
ect
ion
)T
M0
13
08
07
91
32
9.0
40
0.0
00
0.0
00
0.0
00
0.0
00
0.0
00
0.9
90
10
.95
1
Um
ge
ni K
laa
rwa
ter
OH
TL
80
85
01
72
5.0
00
0.0
00
0.0
00
0.0
00
0.0
00
0.0
00
5.0
00
20
.00
0
NC
P S
pri
ng
pa
rk S
/Stn
TM
00
94
80
85
52
71
9.0
00
0.0
00
0.0
00
0.0
00
0.0
00
0.0
00
21
.80
01
14
.73
7
CO
MP
UT
ER
EQ
UIP
ME
NT
25
.50
00
.00
00
.00
04
.60
60
.00
07
.22
12
8.3
18
10
.00
03
9.2
16
Co
mm
un
ica
tio
n N
etw
ork
sC
N0
00
18
01
90
26
12
.50
00
.00
00
.00
04
.60
67
.22
15
7.7
68
9.5
00
76
.00
0
Co
mm
un
ica
tio
n N
etw
ork
Lin
ks
TS
CN
00
02
.8
01
91
26
13
.00
00
.00
00
.00
00
.00
00
.00
00
.00
00
.50
03
.84
6
BU
ILD
ING
S8
6.3
10
0.0
00
0.0
00
0.0
00
0.0
00
0.0
00
0.0
00
10
6.5
00
12
3.3
92
Co
ntr
ol C
en
tre
Bu
ildin
gs
80
31
02
64
0.3
10
0.0
00
0.0
00
0.0
00
0.0
00
0.0
00
87
.50
02
17
.06
8
En
erg
y C
on
tro
l Bu
ildin
g -
Kin
gs
Ro
ad
80
31
2In
tern
al
20
.00
00
.00
00
.00
00
.00
00
.00
00
.00
09
.00
04
5.0
00
Tra
inin
g C
en
tre
- S
pri
ng
fie
ldC
SA
21
27
80
31
8In
tern
al
26
.00
00
.00
00
.00
00
.00
00
.00
00
.00
01
0.0
00
38
.46
2
PLA
NT
& E
QU
IPM
EN
T1
9.7
50
0.0
00
0.0
00
0.0
00
0.0
00
0.0
54
0.2
74
2.2
50
11
.39
2
HV
Ala
rms
& S
ecu
rity
Sy
ste
ms
80
25
6In
tern
al
19
.75
00
.00
00
.00
00
.00
00
.05
40
.27
42
.25
01
1.3
92
VE
HIC
LES
10
.00
00
.00
00
.00
02
.60
10
.00
03
.66
23
6.6
20
10
.00
01
00
.00
0
Tru
cks
& S
pe
cia
lise
d V
eh
icle
s8
02
06
Inte
rna
l1
0.0
00
0.0
00
0.0
00
2.6
01
3.6
62
36
.62
01
0.0
00
10
0.0
00
CO
MM
UN
ITY
& E
ME
RG
EN
CY
SE
RV
ICE
S -
HS
S9
5.2
82
0.0
00
0.0
00
8.9
92
0.0
00
25
.71
82
6.9
92
94
.47
69
9.1
54
LIB
RA
RIE
S2
9.8
86
0.0
00
0.0
00
0.0
00
0.0
00
0.0
15
0.0
50
29
.88
61
00
.00
0
Ne
w C
en
tra
l Li
bra
ry (
Lib
rary
Su
bsi
dy
Rin
gfe
nce
d)
N1
22
5.7
41
80
1.9
99
90
28
29
.88
60
.00
00
.00
00
.00
00
.01
50
.05
02
9.8
86
10
0.0
00
BE
AC
HE
S A
ND
PO
OLS
21
.23
30
.00
00
.00
01
.75
80
.00
05
.50
72
5.9
36
20
.42
79
6.2
04
Ina
nd
a P
oo
l (N
ew
)N
11
34
.74
18
01
.72
18
2.1
61
77
55
14
.40
00
.00
00
.00
00
.00
00
.00
00
.00
01
0.7
61
74
.72
9
Sh
allc
ross
Sw
imm
ing
Po
ol:
Re
ha
bili
tati
on
N1
47
6.7
41
80
1.7
02
52
.16
20
27
16
.83
30
.00
00
.00
01
.75
85
.50
78
0.5
94
9.6
66
14
1.4
61
PA
RK
S E
XE
CU
TIV
E8
.94
90
.00
00
.00
00
.39
30
.00
01
.76
61
9.7
33
8.9
49
10
0.0
00
Pla
nt
an
d E
qu
ipm
en
t1
.73
25
0.1
50
02
1.7
32
50
.15
00
2In
tern
al
8.9
49
0.0
00
0.0
00
0.3
93
1.7
66
19
.73
38
.94
91
00
.00
0
SP
OR
TS
FA
CIL
ITIE
S7
.50
00
.00
00
.00
00
.00
00
.00
00
.00
00
.00
07
.50
01
00
.00
0
Du
rba
n S
occ
er
Aca
de
my
1.7
02
52
.16
50
21
.70
25
2.1
65
02
26
7.5
00
0.0
00
0.0
00
0.0
00
0.0
00
0.0
00
7.5
00
10
0.0
00
95
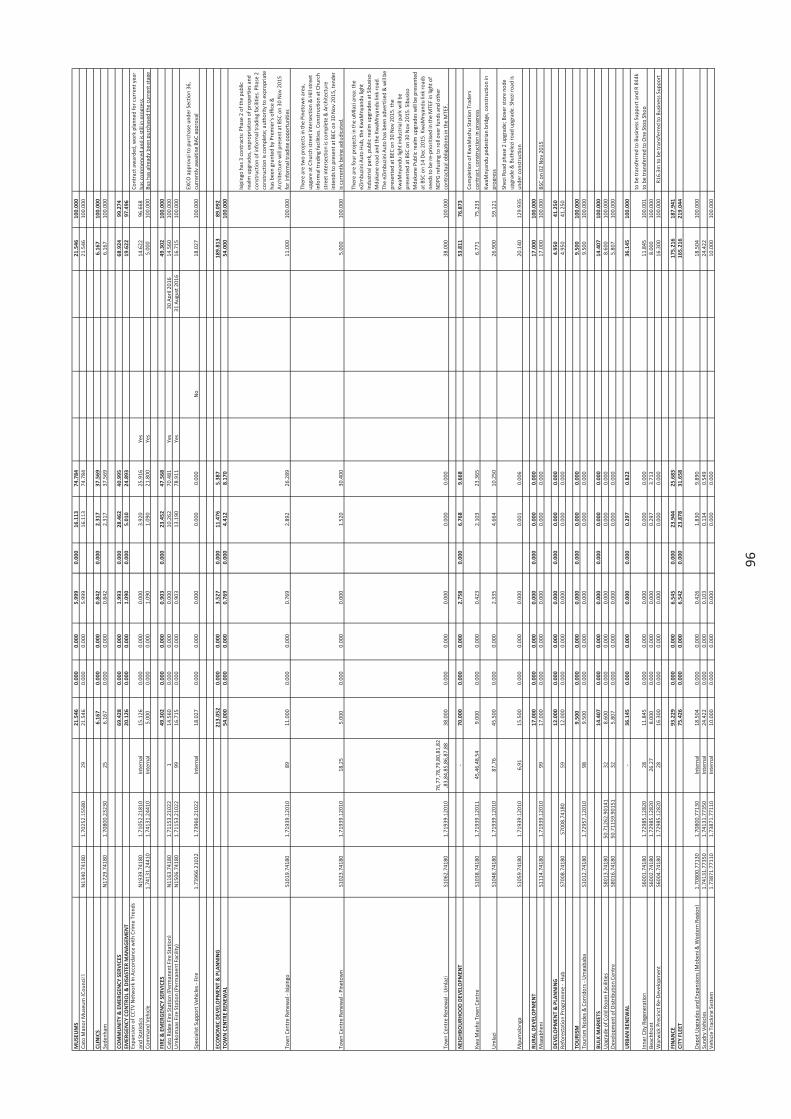
MU
SE
UM
S2
1.5
46
0.0
00
0.0
00
5.9
99
0.0
00
16
.11
37
4.7
84
21
.54
61
00
.00
0
Ca
to M
an
or
Mu
seu
m (
Co
un
cil )
N1
34
0.7
41
80
1.7
02
52
.15
58
02
92
1.5
46
0.0
00
0.0
00
5.9
99
16
.11
37
4.7
84
21
.54
61
00
.00
0
CLI
NIC
S6
.16
70
.00
00
.00
00
.84
20
.00
02
.31
73
7.5
69
6.1
67
10
0.0
00
Sy
de
nh
am
N1
72
9.7
41
80
1.7
08
00
.23
23
02
56
.16
70
.00
00
.00
00
.84
22
.31
73
7.5
69
6.1
67
10
0.0
00
CO
MM
UN
ITY
& E
ME
RG
EN
CY
SE
RV
ICE
S6
9.4
28
0.0
00
0.0
00
1.9
93
0.0
00
28
.46
24
0.9
95
68
.92
49
9.2
74
EM
ER
GE
NC
Y C
ON
TR
OL
& D
ISA
ST
ER
MA
NA
GE
ME
NT
20
.12
60
.00
00
.00
01
.09
00
.00
05
.01
02
4.8
93
19
.62
29
7.4
96
Exp
an
sio
n o
f C
CT
V N
etw
ork
In
Acc
ord
an
ce w
ith
Cri
me
Tre
nd
s
an
d S
tati
stic
sN
19
39
.74
18
01
.71
05
2.2
18
10
Inte
rna
l1
5.1
26
0.0
00
0.0
00
0.0
00
3.9
20
25
.91
6Y
es
14
.62
29
6.6
68
Co
ntr
act
aw
ard
ed
, w
ork
pla
nn
ed
fo
r cu
rre
nt
ye
ar
ha
s co
mm
en
ced
an
d is
sti
ll in
pro
gre
ss.
Co
mm
an
d V
eh
icle
1.7
41
31
.24
41
01
.74
13
1.2
44
10
Inte
rna
l5
.00
00
.00
00
.00
01
.09
01
.09
02
1.8
00
Ye
s5
.00
01
00
.00
0B
us
ha
s a
lre
ad
y b
ee
n p
urc
ha
sed
th
e c
urr
en
t st
ag
e
FIR
E &
EM
ER
GE
NC
Y S
ER
VIC
ES
49
.30
20
.00
00
.00
00
.90
30
.00
02
3.4
52
47
.56
84
9.3
02
10
0.0
00
Ca
to R
idg
e F
ire
Sta
tio
n (
Pe
rma
ne
nt
Fir
e S
tati
on
)N
11
63
.74
18
01
.71
15
3.2
10
22
11
4.5
60
0.0
00
0.0
00
0.0
00
10
.26
27
0.4
81
Ye
s3
0 A
pri
l 20
16
14
.56
01
00
.00
0
Um
ko
ma
as
Fir
e S
tati
on
(P
erm
an
en
t F
aci
lity
)N
15
06
.74
18
01
.71
15
3.2
10
22
99
16
.71
50
.00
00
.00
00
.90
31
3.1
90
78
.91
1Y
es
31
Au
gu
st 2
01
61
6.7
15
10
0.0
00
Sp
eci
alis
t S
up
po
rt V
eh
icle
s -
Fir
e1
.73
96
6.2
10
22
1.7
39
66
.21
02
2In
tern
al
18
.02
70
.00
00
.00
00
.00
00
.00
00
.00
0N
o1
8.0
27
10
0.0
00
EX
CO
ap
pro
va
l to
pu
rch
ase
un
de
r S
ect
ion
36
,
curr
en
tly
aw
ait
ing
BA
C a
pp
rov
al
EC
ON
OM
IC D
EV
ELO
PM
EN
T &
PLA
NN
ING
21
3.0
52
0.0
00
0.0
00
3.5
27
0.0
00
11
.47
65
.38
71
89
.81
38
9.0
92
TO
WN
CE
NT
RE
RE
NE
WA
L5
4.0
00
0.0
00
0.0
00
0.7
69
0.0
00
4.4
12
8.1
70
54
.00
01
00
.00
0
To
wn
Ce
ntr
e R
en
ew
al -
Isi
pin
go
S1
01
9.7
41
80
1.7
19
39
.12
01
08
91
1.0
00
0.0
00
0.0
00
0.7
69
2.8
92
26
.28
91
1.0
00
10
0.0
00
Isip
ing
o h
as
3 c
on
tra
cts:
Ph
ase
2 o
f th
e p
ub
lic
rea
lm u
pg
rad
es,
exp
rop
ria
tio
n o
f p
rop
ert
ies
an
d
con
stru
ctio
n o
f in
form
al t
rad
ing
fa
cilit
ies.
Ph
ase
2
con
stru
ctio
n is
co
mp
lete
; a
uth
ori
ty t
o e
xpro
pri
ate
ha
s b
ee
n g
ran
ted
by
Pre
mie
r's
off
ice
&
Arc
hit
ect
ure
will
pre
sen
t a
t B
SC
on
30
No
v 2
01
5
for
Info
rma
l tra
din
g o
pp
ort
un
itie
s
To
wn
Ce
ntr
e R
en
ew
al -
Pin
eto
wn
S1
02
3.7
41
80
1.7
19
39
.12
01
01
8,2
55
.00
00
.00
00
.00
00
.00
01
.52
03
0.4
00
5.0
00
10
0.0
00
Th
ere
are
tw
o p
roje
cts
in t
he
Pin
eto
wn
are
a,
up
ga
re a
t C
hu
rch
str
ee
t in
ters
ect
ion
& H
ill s
tre
et
info
rma
l tra
din
g f
aci
litie
s. C
on
stru
ctio
n a
t C
hu
rch
stre
et
inte
rse
ctio
n is
co
mp
lete
& A
rch
ite
ctu
re
inte
nd
s to
pre
sen
t a
t B
EC
on
30
No
v 2
01
5,
ten
de
r
is c
urr
en
tly
be
ing
ad
jud
ica
ted
.
To
wn
Ce
ntr
e R
en
ew
al -
Um
lazi
S1
06
2.7
41
80
1.7
19
39
.12
01
0
76
,77
,78
,79
,80
,81
,82
,83
,84
,85
,86
,87
,88
38
.00
00
.00
00
.00
00
.00
00
.00
00
.00
03
8.0
00
10
0.0
00
Th
ere
are
fo
ur
pro
ject
s in
th
e u
Mla
zi a
rea
: th
e
eZ
imb
uzi
ni A
uto
Hu
b,
the
Kw
aM
ny
an
du
lig
ht
ind
ust
ria
l pa
rk,
pu
blic
re
alm
up
gra
de
s a
t S
ibu
siso
Md
ak
an
e r
oa
d a
nd
th
e K
wa
Mn
ya
nd
u li
nk
ro
ad
.
Th
e e
Zim
bu
zin
i Au
to h
as
be
en
ad
ve
rtis
ed
& w
ill b
e
pre
sen
ted
at
BE
C o
n 3
0 N
ov
20
15
. th
e
Kw
aM
ny
an
du
lig
ht
ind
ust
ria
l pa
rk w
ill b
e
pre
sen
ted
at
BS
C o
n 3
0 N
ov
20
15
. S
ibu
siso
Md
ak
an
e P
ub
lic r
ea
lm u
pg
rad
es
will
be
pre
sen
ted
at
BS
C o
n 1
4 D
ec
20
15
. K
wa
Mn
ya
nd
u li
nk
ro
ad
s
ne
ed
s to
be
re
-pri
ori
tise
d in
th
e M
TE
F in
lig
ht
of
ND
PG
re
fusi
ng
to
ro
ll o
ve
r fu
nd
s a
nd
oth
er
con
tra
ctu
al o
blig
ati
on
s in
th
e M
TE
F.
NE
IGH
BO
UR
HO
OD
DE
VE
LOP
ME
NT
-7
0.0
00
0.0
00
0.0
00
2.7
58
0.0
00
6.7
68
9.6
68
53
.81
17
6.8
73
Kw
a M
ash
u T
ow
n C
en
tre
S1
03
8.7
41
80
1.7
19
39
.12
01
14
5,4
6,4
8,5
49
.00
00
.00
00
.00
00
.42
32
.10
32
3.3
65
6.7
71
75
.23
3
Co
mp
leti
on
of
Kw
aM
ash
u S
tati
on
Tra
de
rs
con
tra
ct,
con
stru
ctio
n in
pro
gre
ss
Um
lazi
S1
04
8.7
41
80
1.7
19
39
.12
01
08
7,7
64
5.5
00
0.0
00
0.0
00
2.3
35
4.6
64
10
.25
02
6.9
00
59
.12
1
Kw
aM
ny
an
du
pe
de
stri
an
bri
dg
e,
con
stru
ctio
n in
pro
gre
ss
Mp
um
ala
ng
aS
10
59
.74
18
01
.71
93
9.1
20
10
6,9
11
5.5
00
0.0
00
0.0
00
0.0
00
0.0
01
0.0
06
20
.14
01
29
.93
5
Sh
ezi
Ro
ad
ph
ase
2 u
pg
rad
e;
Bo
xer
sto
re n
od
e
up
gra
de
& B
uth
ele
zi r
oa
d u
pg
rad
e.
Sh
ezi
ro
ad
is
un
de
r co
nst
ruct
ion
RU
RA
L D
EV
ELO
PM
EN
T1
7.0
00
0.0
00
0.0
00
0.0
00
0.0
00
0.0
00
0.0
00
17
.00
01
00
.00
0
Ma
ga
bh
en
iS
11
14
.74
18
01
.71
93
9.1
20
10
99
17
.00
00
.00
00
.00
00
.00
00
.00
00
.00
01
7.0
00
10
0.0
00
BS
C o
n 0
2 N
ov
20
15
DE
VE
LOP
ME
NT
& P
LAN
NIN
G1
2.0
00
0.0
00
0.0
00
0.0
00
0.0
00
0.0
00
0.0
00
4.9
50
41
.25
0
Re
fore
sta
tio
n P
rog
ram
me
- H
ub
S7
00
8.7
41
80
S7
00
8.7
41
80
59
12
.00
00
.00
00
.00
00
.00
00
.00
00
.00
04
.95
04
1.2
50
TO
UR
ISM
9.5
00
0.0
00
0.0
00
0.0
00
0.0
00
0.0
00
0.0
00
9.5
00
10
0.0
00
To
uri
sm N
od
es
& C
orr
ido
rs -
Um
ga
ba
ba
S1
01
2.7
41
80
1.7
29
57
.12
01
09
89
.50
00
.00
00
.00
00
.00
00
.00
00
.00
09
.50
01
00
.00
0
BU
LK M
AR
KE
TS
14
.40
70
.00
00
.00
00
.00
00
.00
00
.00
00
.00
01
4.4
07
10
0.0
00
Up
gra
de
of
Co
ld R
oo
m F
aci
litie
sS
80
13
.74
18
05
0.7
12
62
.90
14
13
28
.60
00
.00
00
.00
00
.00
00
.00
00
.00
08
.60
01
00
.00
0
De
ve
lop
me
nt
of
Dis
trib
uti
on
Ce
ntr
eS
80
16
.74
18
05
0.7
11
59
.90
15
13
25
.80
70
.00
00
.00
00
.00
00
.00
00
.00
05
.80
71
00
.00
0
UR
BA
N R
EN
EW
AL
-3
6.1
45
0.0
00
0.0
00
0.0
00
0.0
00
0.2
97
0.8
22
36
.14
51
00
.00
0
Inn
er
Cit
y R
eg
en
era
tio
nS
60
01
.74
18
01
.72
98
5.1
28
20
28
11
.84
50
.00
00
.00
00
.00
00
.00
00
.00
01
1.8
45
10
0.0
01
R2
.8m
to
be
tra
nsf
err
ed
to
Arc
hit
ect
ure
& R
8.5
m
to b
e t
ran
sfe
rre
d t
o B
usi
ne
ss S
up
po
rt a
nd
R 8
44
k
to b
e t
ran
sfe
rre
d t
o O
ne
Sto
p S
ho
p
Be
ach
fro
nt
S6
00
2.7
41
80
1.7
29
85
.12
82
02
6,2
78
.00
00
.00
00
.00
00
.00
00
.29
73
.71
38
.00
01
00
.00
0
Wa
rwic
k P
reci
nct
Re
-De
ve
lop
me
nt
S6
00
4.7
41
80
1.7
29
85
.12
82
02
81
6.3
00
0.0
00
0.0
00
0.0
00
0.0
00
0.0
00
16
.30
01
00
.00
0R
16
.3m
to
be
tra
nsf
err
ed
to
Bu
sin
ess
Su
pp
ort
FIN
AN
CE
93
.22
90
.00
00
.00
06
.54
50
.00
02
3.9
44
25
.68
31
75
.21
61
87
.94
1
CIT
Y F
LEE
T7
5.4
26
0.0
00
0.0
00
6.5
42
0.0
00
23
.87
83
1.6
58
16
5.2
16
21
9.0
44
De
po
t U
pg
rad
es
an
d E
xpa
nsi
on
s (M
ob
en
i & W
est
ern
Re
gio
n)
1.7
08
00
.77
13
01
.70
80
0.7
71
30
Inte
rna
l1
8.5
04
0.0
00
0.0
00
0.4
26
1.8
30
9.8
90
18
.50
41
00
.00
0
Su
nd
ry V
eh
icle
s1
.74
13
1.7
73
50
1.7
41
31
.77
35
0In
tern
al
24
.42
20
.00
00
.00
00
.10
30
.13
40
.54
92
4.4
22
Ve
hic
le T
rack
ing
Sy
ste
m1
.73
87
1.7
71
10
1.7
38
71
.77
11
0In
tern
al
10
.00
00
.00
00
.00
00
.00
00
.00
00
.00
01
0.0
00
10
0.0
00
96
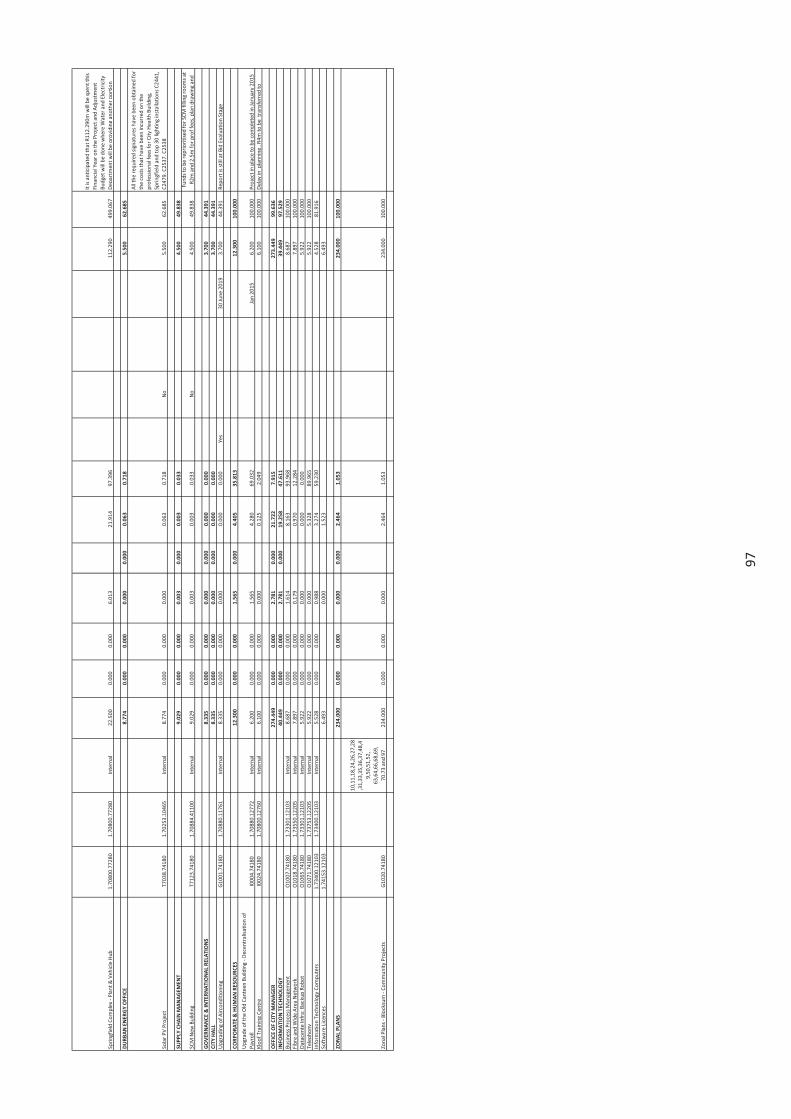
Sp
rin
gfi
eld
Co
mp
lex
- P
lan
t &
Ve
hic
le H
ub
1.7
08
00
.77
28
01
.70
80
0.7
72
80
Inte
rna
l2
2.5
00
0.0
00
0.0
00
6.0
13
21
.91
49
7.3
96
11
2.2
90
49
9.0
67
It is
an
tici
pa
ted
th
at
R1
12
.29
0m
will
be
sp
en
t th
is
Fin
an
cia
l Ye
ar
on
th
e P
roje
ct a
nd
Ad
just
me
nt
Bu
dg
et
will
be
do
ne
wh
ere
Wa
ter
an
d E
lect
rici
ty
De
pa
rtm
en
t w
ill b
e p
rov
idin
g a
no
the
r p
ort
ion
DU
RB
AN
EN
ER
GY
OF
FIC
E8
.77
40
.00
00
.00
00
.00
00
.00
00
.06
30
.71
85
.50
06
2.6
85
So
lar
PV
Pro
ject
T7
03
8.7
41
80
1.7
02
53
.10
46
5In
tern
al
8.7
74
0.0
00
0.0
00
0.0
00
0.0
63
0.7
18
No
5.5
00
62
.68
5
All
the
re
qu
ire
d s
ign
atu
res
ha
ve
be
en
ob
tain
ed
fo
r
the
co
sts
tha
t h
av
e b
ee
n in
curr
ed
on
th
e
pro
fess
ion
al f
ee
s fo
r C
ity
He
alt
h B
uild
ing
,
Sp
rin
gfi
eld
an
d t
op
30
lig
hti
ng
inst
alla
tio
ns
C2
44
1,
C2
47
9,
C2
53
7,
C2
53
8
SU
PP
LY C
HA
IN M
AN
AG
EM
EN
T9
.02
90
.00
00
.00
00
.00
30
.00
00
.00
30
.03
34
.50
04
9.8
38
SC
M N
ew
Bu
ildin
gT
71
23
.74
18
01
.70
88
4.4
11
00
Inte
rna
l9
.02
90
.00
00
.00
00
.00
30
.00
30
.03
3N
o4
.50
04
9.8
38
Fu
nd
s to
be
re
pri
ori
tise
d f
or
SC
M f
illin
g r
oo
ms
at
R2
m a
nd
2.5
m f
or
pro
f fe
es,
pla
n d
raw
ing
an
d
GO
VE
RN
AN
CE
& I
NT
ER
NA
TIO
NA
L R
ELA
TIO
NS
8.3
35
0.0
00
0.0
00
0.0
00
0.0
00
0.0
00
0.0
00
3.7
00
44
.39
1
CIT
Y H
ALL
8.3
35
0.0
00
0.0
00
0.0
00
0.0
00
0.0
00
0.0
00
3.7
00
44
.39
1
Up
gra
din
g o
f A
irco
nd
itio
nin
gG
10
01
.74
18
01
.70
88
0.1
17
61
Inte
rna
l8
.33
50
.00
00
.00
00
.00
00
.00
00
.00
0Y
es
30
Ju
ne
20
19
3.7
00
44
.39
1R
ep
ort
is s
till
at
Bid
Ev
alu
ati
on
Sta
ge
CO
RP
OR
AT
E &
HU
MA
N R
ES
OU
RC
ES
12
.30
00
.00
00
.00
01
.56
50
.00
04
.40
53
5.8
13
12
.30
01
00
.00
0
Up
gra
de
of
the
Old
Ca
nte
en
Bu
ildin
g -
De
cen
tra
lisa
tio
n o
f
Pa
yro
ll I0
00
4.7
41
80
1.7
08
80
.12
77
2In
tern
al
6.2
00
0.0
00
0.0
00
1.5
65
4.2
80
69
.03
2Ja
n 2
01
56
.20
01
00
.00
0P
roje
ct in
pla
ce t
o b
e c
om
ple
ted
in J
an
ua
ry 2
01
5
Klo
of
Tra
inin
g C
en
tre
I00
24
.74
18
01
.70
80
0.1
27
60
Inte
rna
l6
.10
00
.00
00
.00
00
.00
00
.12
52
.04
96
.10
01
00
.00
0D
ela
y in
pla
nn
ing
, R
4m
to
be
tra
nsf
err
ed
to
OF
FIC
E O
F C
ITY
MA
NA
GE
R2
74
.44
90
.00
00
.00
02
.78
10
.00
02
1.7
22
7.9
15
27
3.4
49
99
.63
6
INF
OR
MA
TIO
N T
EC
HN
OLO
GY
40
.44
90
.00
00
.00
02
.78
10
.00
01
9.2
58
47
.61
13
9.4
49
97
.52
9
Bu
sin
ess
Pro
cess
Ma
na
ge
me
nt
O1
00
7.7
41
80
1.7
33
01
.12
10
3In
tern
al
8.6
87
0.0
00
0.0
00
1.6
14
8.1
63
93
.96
88
.68
71
00
.00
0
Fib
re a
nd
Wid
e A
rea
Ne
two
rkO
10
18
.74
18
01
.73
55
0.1
22
05
Inte
rna
l7
.89
70
.00
00
.00
00
.17
90
.97
01
2.2
84
7.8
97
10
0.0
00
Da
tace
nte
In
fra
: B
ack
up
Ro
bo
tO
10
65
.74
18
01
.73
30
1.1
21
03
Inte
rna
l5
.92
20
.00
00
.00
00
.00
00
.00
00
.00
05
.92
21
00
.00
0
Te
lep
ho
ny
O1
07
1.7
41
80
1.7
37
53
.12
20
5In
tern
al
5.9
22
0.0
00
0.0
00
0.0
00
5.3
28
89
.96
55
.92
21
00
.00
0
Info
rma
tio
n T
ech
no
log
y C
om
pu
ters
1.7
34
00
.12
10
31
.73
40
0.1
21
03
Inte
rna
l5
.52
80
.00
00
.00
00
.98
83
.27
45
9.2
30
4.5
28
81
.91
6
So
ftw
are
Lic
en
ces
1.7
41
53
.12
10
36
.49
30
.00
01
.52
36
.49
3
ZO
NA
L P
LAN
S2
34
.00
00
.00
00
.00
00
.00
00
.00
02
.46
41
.05
32
34
.00
01
00
.00
0
Zo
na
l Pla
ns
- B
lock
sum
- C
om
mu
nit
y P
roje
cts
G1
02
0.7
41
80
10
,11
,18
,24
,26
,27
,28
,31
,33
,35
,36
,37
,48
,4
9,5
0,5
1,5
2,
63
,64
,66
,68
,69
,
70
,73
an
d 9
72
34
.00
00
.00
00
.00
00
.00
02
.46
41
.05
32
34
.00
01
00
.00
0
97
MUNICIPAL MANAGER’S
QUALITY
CERTIFICATION