Embed Size (px)
Citation preview

1
Agricultural Productivity, Climate Change and Water availability in Sub-Saharan Africa
Author
Aziza Kibonge
Email: [email protected]
Selected Paper prepared for presentation at the Agricultural & Applied Economics Association’s 2011
AAEA & NAREA Joint Annual Meeting, Pittsburgh, Pennsylvania, July 24-26, 2011
Copyright 2011 by Aziza. All rights reserved. Readers may make verbatim copies of this document for
non-commercial purposes by any means, provided that this copyright notice appears on all such copies.

2
Introduction
There is a growing concern about the effects of climate change on agriculture. A report by the
Intergovernmental Panel on Climate Change (IPCC) stated that countries in Sub-Saharan Africa
(SAA) are likely to be severely affected by climate change and climate variability (IPCC 2007).
Evidence is emerging that climate change is increasing rainfall variability and the frequency of
extreme events such as drought, floods, and hurricanes (IPCC 2001). Early empirical studies
using crop simulation models suggested that agriculture in developing countries was highly
vulnerable to global warming (Rosenzweig and Parry 1994; Reilly et al. 1996). Subsequent
economic research using Ricardian models (Mendelsohn et al. 1994) also suggests that, in
developing countries, crops are vulnerable (Kurukulasuriya et al. 2006; Seo and Mendelsohn
2008).
The livelihood of the population in SAA is highly dependent on agriculture which also serves as
the main base for food security and economic growth. Despite its economic importance, the
agricultural sector in SAA has performed poorly relative to that of other developing countries.
Additional constraints on agriculture due to climate change could be devastating and need to be
examined carefully as the livelihood of the poor majority is highly dependent on the agriculture
sector.
Another issue of importance not explicitly included in previous studies was whether a measure of
water scarcity was properly taken into account. Rainfed agriculture generates a large part of the
food in the world and also plays a key role in poverty eradication. In SAA, more than 95percent
of the agricultural area is rainfed (FAOSTAT 2005). However, the temporal and spatial
variability of climate, especially rainfall is a major constraint to yield improvements of rainfed
crops and the high risk for water-related yield loss makes farmers risk averse and influence their
investment decisions, including their climate adaptation strategies. It has been observed by some
that water productivity in rainfed agriculture is low. This is not a problem when water is not a
limiting factor. As precipitation and soil moisture decrease, water becomes scarce, its marginal
product positive, providing incentives for producing more food with less water. Therefore, it
would be important to formally incorporate the effect of water availability in productivity
measurement. The objectives of this study are: 1) to update measures of agricultural productivity

3
in SAA; 2) to explore the potential role of climate change through precipitation and temperature
in explaining differences in countries performances; and 3) to explicitly incorporate the concept
of water availability in productivity measurement and performance using the standard
precipitation index (SPI). The study uses a panel data set of 41 countries in SSA from 1961 to
2001.
Section 1. Literature review
There have been a several studies looking at the effect of climate change on agriculture over the
last decades. Using the Ricardian approach, Mendelsohn et al. (1994) studied the effect of
climate, soil and other variables on U.S. farmland prices and net revenues. They constructed
countrywide climatic variables from weather station data and found that climate terms were
significant. Sanghi et al. (1998) studied the case of Brazil and found that the impact of climate
change on agricultural productivity is negative, with the most noticeable impacts being felt in the
central and western regions. Maddison (2000) analyzed the case of England and Wales. The
study used actual sale price at the individual farm‟s level to determine the value of climate. His
results pointed out the importance to agriculture of frost days in winter.
Although there are well-established concerns about climate change effects in African agriculture,
there is little quantitative information regarding the extent of the effects. Some studies provide
quantitative estimates of climate impacts and provide evidence that SSA will be particularly hard
hit by global warming as it is already experiencing high temperature and low precipitation
(Pearce and others, 1996; McCarthy and others 2001; Tol 2002; Mendelsohn and Williams,
2004). A number of agronomic studies (Rosenweig and Parry 1994) have also found that
warming would have substantial effects on selected crops.
The availability of water supplies also appears to be a critical determinant in agricultural
performance. Besides, water availability in SSA differs widely given the large diversity of
geographic conditions across the continent. Mendelsohn and Dinar (2003) indicate that
precipitation and temperature alone do not necessarily provide a good indication of water
availability for agricultural use. Using the Ricardian model, they consider the impact of water
availability on agricultural outcomes across the U.S. and adding variables which capture the
availability of ground water and surface water to the Ricardian model does change the sensitivity

4
of agriculture to climate. As a result, the ability to irrigate land can provide a valuable barrier
against adverse climatic conditions. Mendelsohn et al (2004b) examined the role of climate
averages and climate variances in determining farm values. They found that when used together,
climatic averages explain the variation in agricultural performance, while variance improves the
explanatory power of the regressions only slightly.
Irrigation - The share of irrigated cropland in Africa is the lowest of developing world and
International Food Policy Research Institute reports that irrigation water supply reliability1 is
expected to worsen in SSA due to climate change.
Drought - Drought is one of the most important climate-related disasters in Africa. The United
Nations Convention to Combat Desertification (UNCCD) indicates that drought and
desertification in SAA are serious challenges on threats facing sustainable development in
Africa. UNCCD reports that under a range of climate scenarios, it is projected that there will be
an increase of 5-8% of arid and semi-arid lands in Africa. Current climate scenarios predict that
the driest regions of the world will become even drier signaling a risk of persistence of drought
in many parts of Africa in arid, semi-arid and dry sub humid areas (UNESCO, 2006). Drought is
also considered by many to be the most complex but least understood of all natural hazards
(Hagman, 1984). However, Wiljite and Glantz (1985) have categorized drought into
meteorological (lack of precipitation); hydrological (drying of surface water storage);
agricultural (lack of root zone moisture) and socio-economic (lack of water supply for socio-
economic purpose).
Drought indices, in general, enable their severity to be measured, thereby allowing an
examination of the spatial and temporal characteristics of drought. The majority of drought
indices have a fixed time-scale. However, the Standard Precipitation Index (SPI) allows
detecting drought over different periods at multiple scales. The index is calculated by fitting a
gamma distribution to observed values of precipitation totals at different time steps (e.g. 1, 3, 6,
9 and 12 months), and then transforming back to the normal distribution with mean zero and a
variance of one. The SPI is equal to the Z-score applied to normally distributed precipitation
totals at different time scales. Durations of weeks or months can be used to apply this index to
1 The ratio of water consumption to requirements

5
agricultural interests and this justifies our choice of a 1 month-SPI, while longer durations of
years can be used to apply this index to water supply. In this paper, SPI values are computed for
time-scale period of 1 month and for all the countries over the period 1961 to 2001.
Precipitation and Temperature - The potential effect of climatic change on the performance of
SSA agriculture has been addressed in a number of studies such as Collier and Gunning (1999),
O‟Connell and Ndulu (2000), and Bloom and Sachs (1998). However, little consideration has
been given to SAA as a whole.
The structure of the paper is as follows. Section 2 describes the methodology employed to construct
estimates of agricultural TFP. In Section 3, a description of the data used in the analysis and an
exposition of the underlying conceptual framework is presented. Section 4 presents the empirical results
and highlights the characteristic features of productivity performance in SAA. This section also identifies
water scarcity factors that can potentially explain inter-country differences in agricultural productivity
levels and growth performance. Section 6 provides the concluding comments.
Section 2. Methodology
In this paper we adopt the production function approach pioneered by Solow and Griliches in the
multi-country context. Aigner, Lovell and Schmidt (1977) and Meeusen and van den Broeck
(1977) modified the production function to allow for the presence of technical efficiencies
captured by a one-sided error term. The original specification involved a production function for
cross-sectional data with an error term with two components: (i) a component that accounts for
random effects and (ii) a component to account for technical inefficiency. Following Battese and
Coelli (1995), the stochastic production frontier is written as:
TtIiuvtxfY itititit ,....,1,...,1);,(ln
where is output of the i-th country in time period t, is an Nx1 vector of the logarithm of
inputs for the i-th country in time period t, is a vector of unknown parameters, and are
random variables which are assumed to be iid , and independent of , and is a non-
negative random variable distributed iid , associated with technical inefficiency across
production units. The last error term controls for heterogeneity across countries.
itY itx
itv
ituitu),0( 2
vN
),0( 2
uN

6
The parameterization of Battese and Corra (1977) consists of replacing 2
V and 2
U with
222
UV and )/( 222
UVU . The production frontier is used to obtain the growth rate
of aggregate output into contribution from the growth of inputs versus productivity change:
TFPxY itm
n
itm
where TFP is the total factor productivity, and itm is the production elasticity of input n, for
country i, and year t calculated as:
n
nx
txf
),,(
TFP = Technical Change (TC) + EC (Efficiency Change)
where t
txfTC
);,( is described as a shift of the production frontier representing technical
change. EC is the rate at which a country moves toward or away from the production frontier.
Technical inefficiency (TE) is captured in equation:
when the frontier approach is used. TE is captured by the non-negative random variable u and
allows for inclusion of potential determinants of country heterogeneity referred as “efficiency
changing variables”. It indicates discrepancies in the productivity performance across countries.
The change in TE between two periods is EC.
Section 3. Data and Estimation
Data
Data from 41 countries in Sub-Saharan Africa during the period spanning 1961 to 2001 is used.
Traditional inputs are from the FAOSTAT website and Fuglies. Efficiency changing variables
are: years of independence, colonial heritage, war, armed conflicts, irrigation, precipitation, and
drought. Output is measured as Agricultural Gross Production (constant 1999-2001, US$1000).
The vector of inputs includes Fertilizers, Land, Labor, Livestock and Farm Machinery. Fertilizer
is defined as the quantity of fertilizer plant nutrient consumed (tones of N P205 plus K20).
)exp(
);(expit
it
it uvxf
YTE

7
Agricultural land is measured as the sum of pasture land and permanent crops in thousand
hectares. Agricultural labor is measured as the number of persons (male and female)
economically active expressed in thousands. The livestock variable is the number of Cattle
Equivalent- Aggregate using Hayami-Ruttan weights calculated by Fuglies. The farm machinery
is the number of agricultural tractors in use in agricultural sector (1000).
Efficiency changing variables capture differences in the institutional and political environment
across countries. They also capture differences in water scarcity across countries.
“Independence” denotes the number of years that the specific country has been independent and
is obtained from the Central Intelligence Agency World Factbook. Colonial heritage is
represented by four dummy variables for countries that are former colonies of Great Britain,
France, Portugal, and Belgium. War is a dummy and describes the intensity of a conflict, coded
in two categories: minor (between 25 and 999 battle-related deaths in a given year), and war (at
least 1,000 battle-related deaths in a given year). Armed Conflict is another dummy variable and
describes the type of conflict. There are four categories of armed conflicts: Extra systemic armed
conflict that occurs between a state and a non-state group outside its own territory; Interstate
armed conflict that occurs between two or more states; Internal armed conflict that occurs
between the government of a state and one or more internal opposition group without
intervention from other states; and Internationalized internal armed conflict that occurs between
the government of a state and one or more internal opposition group with intervention from other
states on one or both sides. War and armed conflict variables are obtained from Gleditsch et al.
Irrigation ratio is calculated as the area equipped for irrigation divided by the total agricultural
area from the World Bank database. Data on precipitation are from the Africa Rainfall and
Temperature Evaluation System (ARTES) of the World Bank. This dataset, created by the
National Oceanic and Atmospheric Association‟s Climate Prediction Center is based on ground
station measurements of precipitation. Drought is a dummy variable and is a count of all the dry
months (standard precipitation index lower than -2) in a year.

8
Table 1. Summary Statistics
Variable Unit Mean Min Max Std dev
Output and conventional inputs
- Output Constant 1999-2001 US$1000 1230536 4760 24609802 2255978
- Fertilizer Metric tons 33468 1 1235000 112586
- Livestock Number of cattle equivalent 89 16 218 28
- Machinery Number of tractors 5396 1 175557 20167
- Labor 1,000 persons 92 18 343 33
- Land 1,000 hectares 19760 3 130494 25344
Land quality Rain fed cropland equivalent (1000 ha) 3134 3 46117 5204
Institutional Factors
- Independence Years after independence 28 0 100 24
- Conflicts Dummy 0 0 2 1
- War Dummy 1 0 4 1
- Former UK colony Dummy 0 0 1 0
- Former French colony Dummy 0 0 1 0
- Former Belgium colony Dummy 0 0 1 0
- Former Portuguese colony Dummy 0 0 1 0
Precipitation Millimeters
Irrigation
Count variable Number of months with SPI < -2
Standard Precipitation Index
McKee, Doesken, and Kleist proposed the SPI in 1993 for the purpose of defining and
monitoring drought. They develop a method to quantify the precipitation deficit for multiple time
scales, which represent the effect of drought on the availability of the different water resources
(groundwater, reservoir storage, soil moisture, snowpack, and streamflow). The SPI calculation
for any location is based on the long-term precipitation record for a given period. The long-term
record is fitted to a gamma distribution as it has been found to fit the precipitation distribution
well. The gamma distribution parameters are estimated using the maximum likelihood. This

9
allow to determine the probability of the rainfall being less or equal to a certain amount. The
gamma cumulative probability gamma function is then transformed into a standard normal
random variable Z with mean of zero and standard deviation of 1. Positives SPI values indicate
greater than median precipitation and negative values indicate less than median precipitation.
The SPI values are given in the table below.
Table 2. Standard Precipitation values
McKee et al. (1993) defined drought intensities resulting from SPI values; a drought event
occurs any time the SPI is continuously negative and reached an intensity of -1.0 or less.
In this paper, 1-month SPI values were computed for SSA countries from 1961 to 2001. Then a
new variable was created for each country indicating the count of months with extreme dry
events, reflected by SPI values of -2 and less.
Estimation
Empirical analyses in agriculture have focused on global, regional, and country level
performance (Coelli, 1998) and (Fulginiti et al., 2004). Several studies have investigated cross-
country differences in agricultural productivity levels and growth rates (Coelli and Rao, 2003).
Fulginiti et al. explore agricultural productivity performance across 41 countries in SAA and the
role of institutions as an influence on differential productivity growth. Despite evidence of
improved performance in the last decades, only a few studies have attempted to analyze the
determinants of SSA‟s agricultural productivity. Block (1995) found negative growth rates
during the 1970s and positive ones during the 1980s. He finds that almost two-thirds of TFP
growth can be explained by macroeconomic policy changes. Luisigi and Thirtle (1997) found

10
similar result for 47 African countries. Again, there was no sign of sustained growth in
productivity during the 1960s and 1970s even though productivity improved in 1984. Fulginiti et
al. (2004) reports total gains of 0.83 percent for 41 SSA countries between 1960 and 1999, even
though productivity rose between 1985 and 1999 by 1.9%. Fulginiti et al. find that institutional
factors such as colony history and the presence of democracy also contribute to productivity
growth. However, a study by Trueblood and Coggins (2003) show that even tough countries
showed signs of recovery in the late 1980s, the regional aggregate productivity has declined by
an average of 0.9 percent in countries in SSA. Coelli and Prasado Rao (2005) estimate TFP for
93 countries, including 18 countries in SSA. Their results indicate that six African countries with
TFP growth above 2 percent during the 1980-2000 period. Evenson and Dias Avila (2007)
estimate the productivity growth of 37 African countries for two periods: 1961-1980 and 1981-
2001.
Agricultural productivity changes are estimated in 41 countries in Sub-Saharan Africa. The
production function below is estimated using the stochastic production function approach.
Maximum likelihood procedures are used to estimate the parameters. The stochastic frontier
method permits the simultaneous investigation of technical change and technical efficiency
change over time.
when a ML frontier function is estimated, technical inefficiency term is specified as
ititit hu
Technical change is calculated as:
txbtbbTC ijt
j
jtttt
5
1
it
j
ijtjtttt
j jk
iktijtjk
j
jjjj
j
ijtjoit txbtbtbxxcxcxbaY
5
1
25
1
55
1
25
1 2
1
2
1ln
ititit vu

11
Ten inefficiency variables were used to attempt to explain the differential country performance,
including weather variables: Years after independence, war, armed conflicts, former colonial
heritage (British, French, Belgian, and Portuguese). The average annual growth rates of technical
change for each country obtained from the stochastic frontier estimation are presented in
appendix showing marked increases over the time period for all countries.
Section 4. Empirical Results
Figure 1 shows the TFP obtained from the Frontier Stochastic Production function. The average
TFP for SAA over the period 1961-2001 is 0.11%. TFP growth rates have been negative in the
1960s, slightly recovered in 1970s and increased in the 1980s and 1990s with averages of 0.39
and 0.51% respectively, as shown in table 3. Readily evident causes for the failure during 1970‟s
could not be identified. Drought was not particularly prevalent during that decade as 1983 and
1990 are the years with the most frequent extreme drought (see figure in appendix).
The recovery is probably the consequence of improved efficiency in production resulting from
changes in the output structure and an adjustment in the use of inputs. Policy changes conducted
in African countries between the mid-1980s and the second half of the 1990s coupled with
technological innovations at that time seem to have played an important role in improving
agriculture‟s performance.
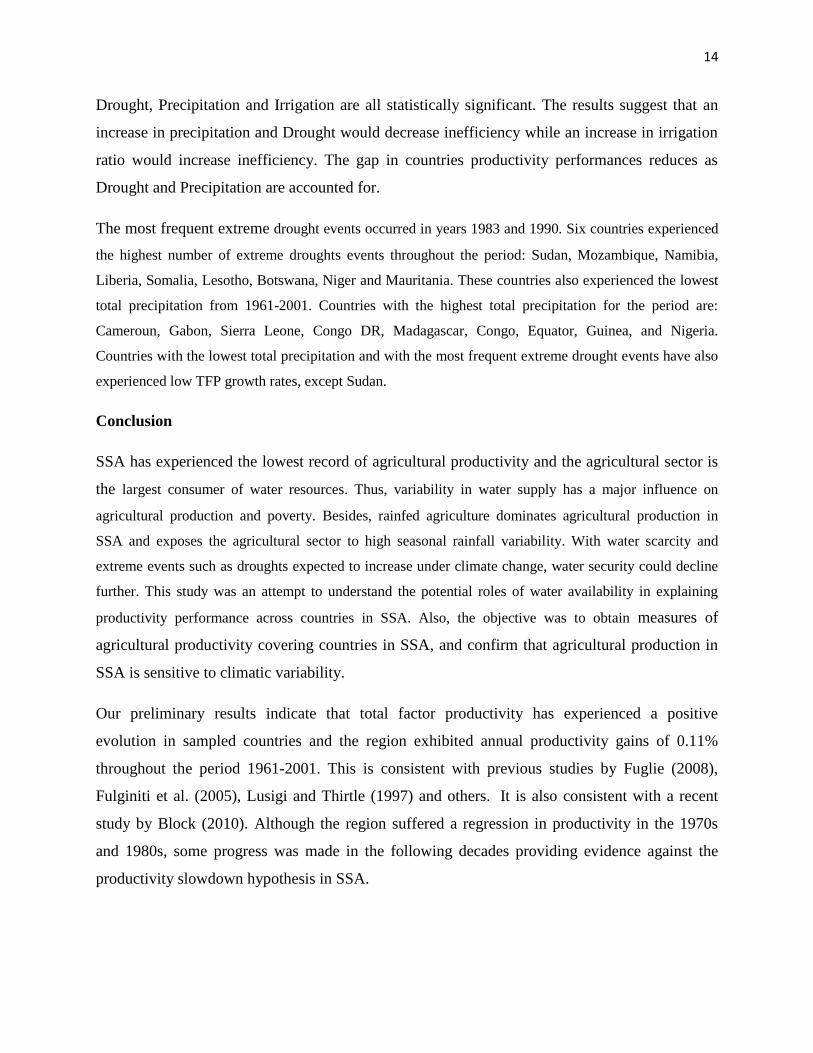
Overall, SAA has experienced higher TFP growth rates in the 1980s and 1990s and lower ones
from 1961 to 1980. This indicates an improvement due to an increasing technical change over
time (see figure in appendix 1.e) and also the growth of output that shows a faster increase from
the mid-1980s to the late 1990s (see figure in appendix 1.d). This is consistent with estimates
obtained of Fulginiti et al. of 0.83% per year.
The coefficients associated with years of independence and armed conflicts were statistically
significant and indicate that the more the years after independence, the more efficient is the
country‟s agriculture. The less armed conflicts, the more efficient the county‟s agriculture. The
coefficient on former colonial heritage‟s variable is also statistically significant. Thus,
accounting for colonial history, armed conflicts and the number of years after independence
seems to be important in explaining discrepancies across countries performance.

12
The coefficients for traditional inputs are statistically significant with the exception of fertilizers.
The output elasticities are presented in Figure 2 and are all positive, with agricultural output
being more responsive to a change in labor and livestock.
Table 3. SAA Average TFP Growth Rates
Years TFP (%)
1960s -0.52 1970s 0.01 1980s 0.39 1990s 0.51 1961-2001 0.11
Table 4. SAA Output Elasticities (1961-2001)
Fertilizers Livestock Machinery Labor Land
0.07 0.18 0.06 0.58 0.02
-0.60
-0.40
-0.20
0.00
0.20
0.40
0.60
1960s 1970s 1980s 1990s
Figure 1. Average SAA TFP Growth Rates (%)
Years
13
0.9
0.92
0.94
0.96
0.98
1
1.02
1.04
1.06
19
61
19
63
19
65
19
67
19
69
19
71
19
73
19
75
19
77
19
79
19
81
19
83
19
85
19
87
19
89
19
91
19
93
19
95
19
97
19
99
20
01
Figure 2. SSA TFP Index
-0.4-0.3-0.2-0.1
00.10.20.30.40.50.6
Figure 3. Average TFP Growth Rates (1961-2001) %
-1
-0.8
-0.6
-0.4
-0.2
0
0.2
0.4
0.6
19
61
19
63
19
65
19
67
19
69
19
71
19
73
19
75
19
77
19
79
19
81
19
83
19
85
19
87
19
89
19
91
19
93
19
95
19
97
19
99
20
01
Figure 4. SSA Average Technical Change (1961-2001) %
14
Drought, Precipitation and Irrigation are all statistically significant. The results suggest that an
increase in precipitation and Drought would decrease inefficiency while an increase in irrigation
ratio would increase inefficiency. The gap in countries productivity performances reduces as
Drought and Precipitation are accounted for.
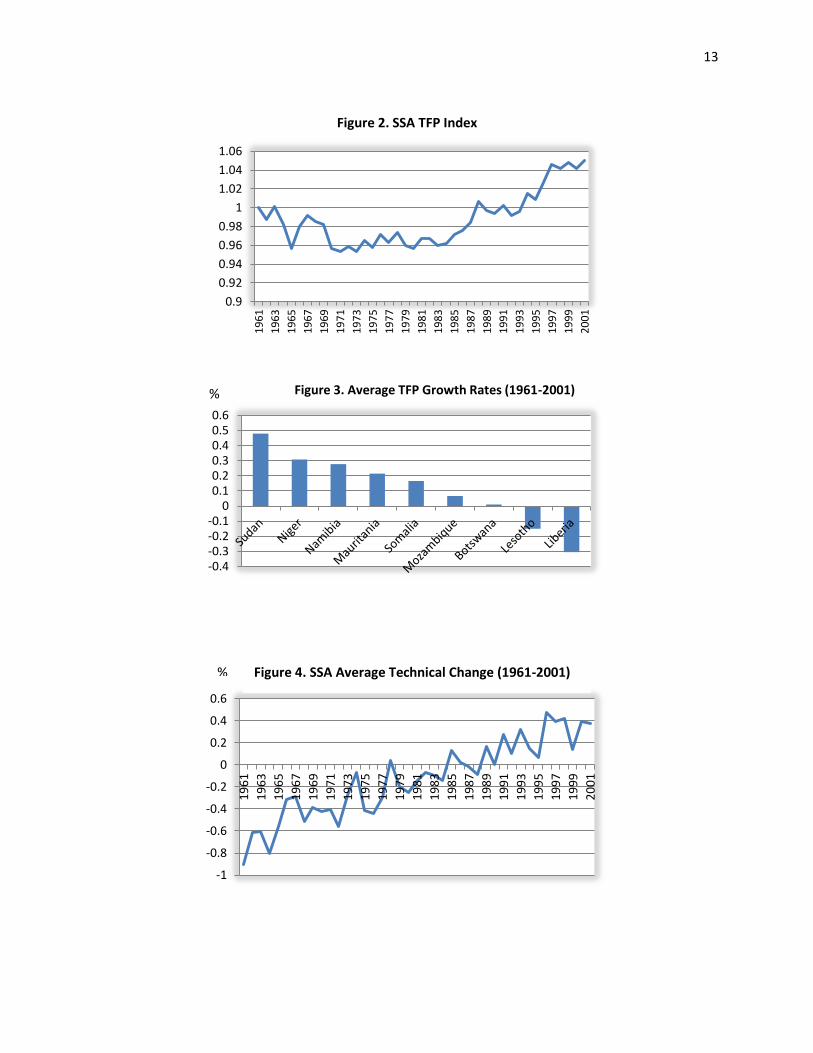
The most frequent extreme drought events occurred in years 1983 and 1990. Six countries experienced
the highest number of extreme droughts events throughout the period: Sudan, Mozambique, Namibia,
Liberia, Somalia, Lesotho, Botswana, Niger and Mauritania. These countries also experienced the lowest
total precipitation from 1961-2001. Countries with the highest total precipitation for the period are:
Cameroun, Gabon, Sierra Leone, Congo DR, Madagascar, Congo, Equator, Guinea, and Nigeria.
Countries with the lowest total precipitation and with the most frequent extreme drought events have also
experienced low TFP growth rates, except Sudan.
Conclusion
SSA has experienced the lowest record of agricultural productivity and the agricultural sector is
the largest consumer of water resources. Thus, variability in water supply has a major influence on
agricultural production and poverty. Besides, rainfed agriculture dominates agricultural production in
SSA and exposes the agricultural sector to high seasonal rainfall variability. With water scarcity and
extreme events such as droughts expected to increase under climate change, water security could decline
further. This study was an attempt to understand the potential roles of water availability in explaining
productivity performance across countries in SSA. Also, the objective was to obtain measures of
agricultural productivity covering countries in SSA, and confirm that agricultural production in
SSA is sensitive to climatic variability.
Our preliminary results indicate that total factor productivity has experienced a positive
evolution in sampled countries and the region exhibited annual productivity gains of 0.11%
throughout the period 1961-2001. This is consistent with previous studies by Fuglie (2008),
Fulginiti et al. (2005), Lusigi and Thirtle (1997) and others. It is also consistent with a recent
study by Block (2010). Although the region suffered a regression in productivity in the 1970s
and 1980s, some progress was made in the following decades providing evidence against the
productivity slowdown hypothesis in SSA.

15
The results also indicate that agricultural productivity in SSA is sensitive to climate variability
through precipitation and drought. Once drought and Precipitation are accounted for, the
performance discrepancy across countries decreases, while accounting for irrigation increases the
performance discrepancy between countries. Water availability is thus an important factor for
agricultural productivity. Indeed, water is used for agriculture and given the high dependency of
African population to agriculture, it is crucial to determine how water availability affect the
productivity performance of African countries. Once Precipitation and extreme drought are accounted
for, the performance discrepancy across countries decreases, while accounting for Irrigation increases the
performance discrepancy across countries. The results of this study are important as they will
provide political leaders with crucial input for policy on adaptation potential of the agriculture of
this vast region to climate change.

16
REFERENCES
Aigner, D. J., C. A. K. Lovell and P. Schimdt. “Formulation and Estimation of Stochastic
frontier Production Function Models.” J. Econometrics 6 (1977): 21-37.
Battese, G. E. and T. J. Coelli. “A Model for Technical Inefficiency effects in a Stochastic
Frontier Production Function for Panel Data.” Empirical Economics 20 (1995): 325-32.
Battese, G.E. and G.S. Corra. "Estimation of a Production Frontier Model: With Application to
the Pastoral Zone of Eastern Australia", Australian Journal of Agricultural Economics, 21 (3),
(1977), 169-179.
Block, J. R. “A New View of Agricultural Productivity in sub-Saharan Africa.” Amer. J. Agr.
Econ. 76 (November 1994): 619-24.
Block, S. “The Decline and Rise of Agricultural Productivity in Sub-Saharan Africa since
1961,” NBER Working Paper No. 16481, October 2010.
Edwards, D.C.; and T. B. McKee. Characteristics of 20th century drought in the United States at
multiple time scales. Climatology Report Number 97–2, Colorado State University, Fort Collins,
Colorado, 1997.
Fulginiti, L., and R. Perrin. “Agricultural Productivity in Developing Countries.” Agricultural
Economics 19(1998): 45-51.
Fuglie, K. 2008. "Is a Slowdown in Agricultural Productivity Growth Contributing to the Rise in
Commodity Prices?" Agricultural Economics, 39 supplement: 431-441.
Fulginiti, L., R. Perrin, and B. Yu, “Institutions and Agricultural Productivity in Sub-Saharan
Africa,” Agricultural Economics, vol. 31 (2-3), pages 169-180, December 2004.
Kibonge, A. “Is SSA agricultural productivity slowing down?” Poster presented at the Water for
Food Conference, UNL, Lincoln, NE, May 1-2, 2010a.
Kibonge, A. “Institutions and Agricultural Productivity in SSA Revisited,” poster presented at
the AAEA meetings, Denver, CO, July 2010b.
Kurukulasuriya and Rosenthal. Will African Agriculture Survive Climate Change? World Bank
Economic Review. Volume20, Issue3. p. 367-388, 2006.
Lusigi, A., and C. Thirtle. “Total Factor Productivity and the Effects of R&D in African
Agriculture”, J. Intl. Development 9 (1997): 529-38.

17
McCarthy, J., O. Canziani, N. Leary, D. Dokken, and K. White, eds. Climate Change 2001:
Impacts, Adaptation, and Vulnerability. Cambridge: Cambridge University Press, 2001.
Maddison D. A hedonic analysis of agricultural land prices in England and Wales. European
Review of Agricultural Economics 27: 519–532, 2000.
Meeusen, W. and J. van den Broeck. “Efficiency Estimation from Cobb-Douglas Production
Functions with Composed Error.” Intl. Econ. Rev. 18 (1977): 435-444.
Mendelsohn R, Basist A, Dinar A, Williams C & Kurukulasuriya P. What explains agricultural
performance: Climate normals or climate variance? In Mendelsohn R et al. (eds), Cross-
Sectional Analyses of Climate Change Impacts, World Bank Policy Research Working Paper No.
3350, World Bank, Washington DC, 2004.
Mendelsohn R & Dinar A. Climate, water, and agriculture. Land Economics 79(3): 328–341,
2003.
Mendelsohn, R., and L. Williams. „„Comparing Forecasts of the Global Impacts of Climate
Change.‟‟ Mitigation and Adaptation Strategies for Global Change 9(4): 315–33, 2004.
Mendelsohn, Robert & Nordhaus, William D & Shaw, Daigee. "The Impact of Global Warming
on Agriculture: A Ricardian Analysis," American Economic Review, vol. 84(4), pages 753-71,
1994.
Pearce, D., W. R. Cline, A. N. Achanta, S. Fankhauser, R. K. Pachauri, R. S. J. Tol, and P.
Vellinga. „„The Social Costs of Climate Change: Greenhouse Damage and Benefits of Control.‟‟
In J. Bruce, H. Lee, and E. Haites, eds., Climate Change 1995: Economic and Social Dimensions
of Climate Change. Cambridge: Cambridge University Press, 1996.
Rao, D. S. P. and T. J. Coelli. “Catch-up and Convergence in Global Agricultural Productivity
1980-1995.” working paper, Center for Efficiency and Productivity Analysis (CEPA),
Department of Econometrics, University of New England, Armidale, Australia, No. /98,
1998.
T.B. McKee, N.J. Doesken, and J. Kleist, Colorado State University. McKee, T.B.; N.J.
Doesken; and J. Kleist. 1993. The relationship of drought frequency and duration to time scales.
Preprints, 8th Conference on Applied Climatology, pp. 179–184. January 17–22, Anaheim,
California, 1993.
Rosenzweig, C., and M. L. Parry. "Potential impact of climate change on world food supply,"
Nature, Vol. 367, pp. 133- 138, 1994
Seo, S. Niggol & Mendelsohn, Robert. "A structural ricardian analysis of climate change impacts
and adaptations in African agriculture," Policy Research Working Paper Series 4603, The World
Bank, 2008.

18
Sanghi A, Mendelsohn R & Dinar A. The climate sensitivity of Indian agriculture. In Dinar A et
al. (eds). Measuring the impact of climate change on Indian agriculture. World Bank Technical
Paper 402. World Bank, Washington, DC, 1998.
Tol, R. „„Estimates of the Damage Costs of Climate Change. Part 1: Benchmark Estimates.‟‟
Environmental and Resource Economics 21: 47–73, 2002.
Others
Intergovernmental Panel on Climate Change, (2007) Climate change 2001” impacts, adaptation
and vulnerability” contribution of working group II to the third assessment report of IPCC.
International Food Policy Research Institute, Climate Change: Impact on Agriculture and Costs
of Adaptation, 2009.
IPCC Third Assessment Report - Climate Change 2001. http://www.ipcc.ch/
Gleditsch, N. P., P. Wallensteen, M. Eriksson, M. Stollenberg, and H. Strand. “Armed Conflict
1946-2001: A New Dataset.” Journal of Peace Research 39(2002): 615-637. Available at
www.prio.no/cwp/ArmedConflict/
CIA World Factbook. http://www.cia.gov/cia/publications/factbook/ibndex.html
Food and Agricultural Organization of the United Nations. FAOSTAT,
http://apps.fao.org/page/collections?subset=agriculture.
National Drought Mitigation Center http://www.drought.unl.edu/
Dan Edward‟s masters‟ thesis, available at ftp://ccc.atmos.colostate.edu/pub/spi.pdf

19
APPENDIX
0
500
1000
1500
2000
25001
96
0
19
62
19
64
19
66
19
68
19
70
19
72
19
74
19
76
19
78
19
80
19
82
19
84
19
86
19
88
19
90
19
92
19
94
19
96
19
98
20
00
Somalia Sudan MauritaniaNiger Botswana LesothoMozambique Namibia Liberia
Appendix 1a. Total Precipitation (in mm)
0
1000
2000
3000
4000
5000
6000
7000
8000
9000
10000
19
60
19
62
19
64
19
66
19
68
19
70
19
72
19
74
19
76
19
78
19
80
19
82
19
84
19
86
19
88
19
90
19
92
19
94
19
96
19
98
20
00
Cameroon Congo, DR EquatorGabon Madagascar GuineaSierra Leone Congo Nigeria
Appendix 1b. Total Precipitation (in mm)

20
-4
-3
-2
-1
0
1
2
3
4
1 2 3 4 5 6 7 8 9 10 11 12
Sudan Liberia Botswana
Mozambique Somalia Niger
Namibia Lesotho Mauritania
Appendix 1c. 1-month SPI in 1983
-4
-3
-2
-1
0
1
2
3
1 2 3 4 5 6 7 8 9 10 11 12
Sudan Liberia Botswana
Mozambique Somalia Niger
Namibia Lesotho Mauritania
Appendix 1d. 1-month SPI in 1990

21
-1
-0.8
-0.6
-0.4
-0.2
0
0.2
0.4
0.6
19
61
19
63
19
65
19
67
19
69
19
71
19
73
19
75
19
77
19
79
19
81
19
83
19
85
19
87
19
89
19
91
19
93
19
95
19
97
19
99
20
01
Appendix 1e. Average SAA Technical Change (%) from 1961-2001
0
1
2
3
4
5
6
7
19
61
19
63
19
65
19
67
19
69
19
71
19
73
19
75
19
77
19
79
19
81
19
83
19
85
19
87
19
89
19
91
19
93
19
95
19
97
19
99
20
01
20
03
20
05
Appendix 1f. Growth of Inputs and Output
Output Fertilizers Livestock Machinery Labor land
-0.4
-0.2
0
0.2
0.4
0.6
Appendix 2a. Average TFP Growth Rates (1961-2001) %

22
This paper is an attempt to understand the roles of water availability in explaining countries
productivity performances through precipitation, irrigation and drought. A variable that captures
drought in SAA has been developed using the standard precipitation index values.
0
0.1
0.2
0.3
0.4
0.5
0.6
Appendix 2b. Average TFP Growth Rates (%): 0.2% - 0.50%
0
0.05
0.1
0.15
0.2
0.25
Zambia Malawi Somalia Tanzania Côte d'Ivoire Togo
Appendix 2c. Average TFP Growth Rates (%): 0.10% - 0.19%
0
0.01
0.02
0.03
0.04
0.05
0.06
0.07
0.08
Uganda Kenya Mozambique Botswana Central AfricanRepublic
Appendix 2d. Average TFP Growth Rates (%): 0.07 % - 0.19%
23
-1.6
-1.4
-1.2
-1
-0.8
-0.6
-0.4
-0.2
0
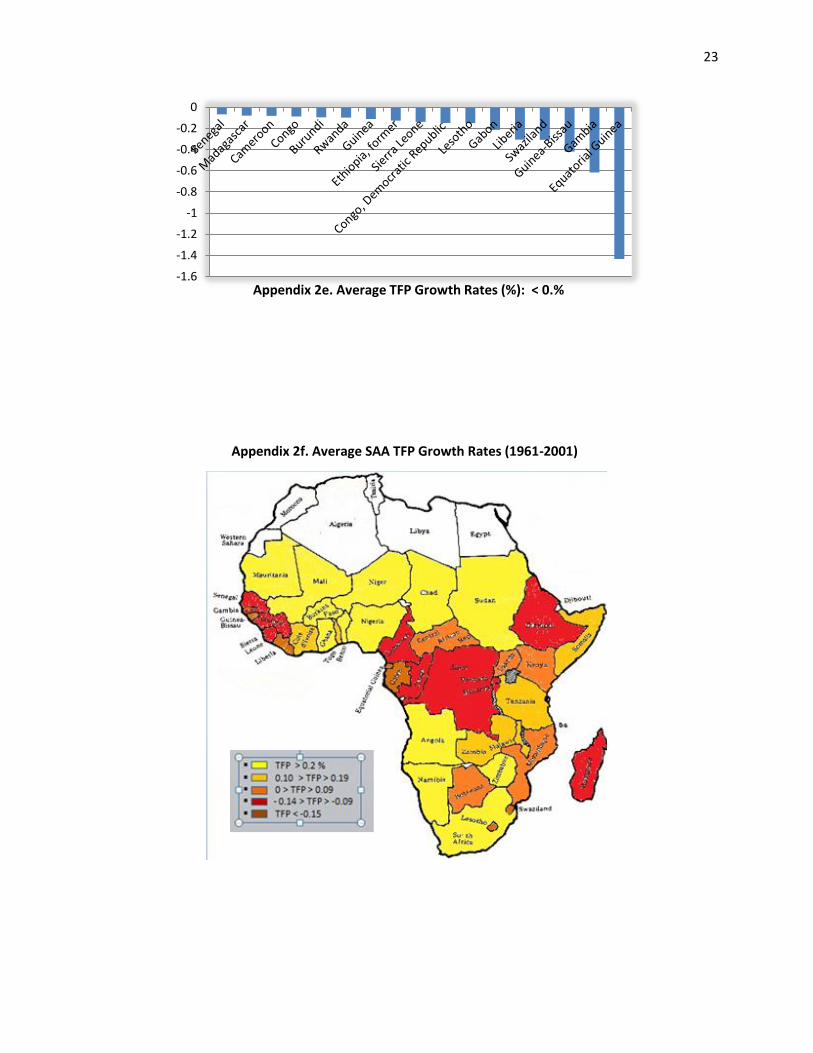
Appendix 2e. Average TFP Growth Rates (%): < 0.%
Appendix 2f. Average SAA TFP Growth Rates (1961-2001)