Embed Size (px)
Citation preview
Agricultural
Productivity
Valuation
January 1
2017 Covers the process for calculating agricultural productivity values.
Discusses the share lease, cash lease and owner operator arrangement
and also provides an explanation on how to value Bee Keeping
operations. Provides a listing of the agricultural classes, minimum
requirement and degree of intensity standards
Example &
Process

Page | 1
2017 Productivity Valuation Example & Process
Introduction
Agricultural appraisal of open-space land is based on the income approach to value. This
approach considers the income derived and expenses incurred for a given agricultural endeavor
based on the typical arrangement for a particular agricultural endeavor. The result of the
calculations is the “Net-to-Land” which means “…the average annual net income derived from the
use of open-space land that would have been earned from the land during the five-year period…by
an owner using ordinary prudence…” (Sec. 23.51, Property Tax Code.)
The first step is to determine what the typical arrangement is for each classification of
agricultural land. The typical arrangements are share lease, cash lease and owner operator. Each
arrangement considers the income, variable and fixed expenses to determine the net-to-land for the
agricultural endeavor. The difference between the arrangements is explained in the following
examples.
Example of Income for Share Lease Arrangement
Under the share lease arrangement, the income and variable expense components are split
by a factor of 1/3 or .33. The landowner (usually) pays a share of the production expenses and
receives a prearranged share of the gross receipts rather than a fixed dollar amount. The crops
under the classification of dry crop are wheat, sorghum, soybeans, oats, cotton and corn. Within
this classification 25% is owner farmed, 25% is cash leased and 50% is share leased. The law
requires the appraisal district to value the typical arrangement. The Share lease, as reported by
United States Department of Agriculture (USDA), Farm Service Agency (FSA) is the typical
arrangement for dry crop production. Irrigated crops and Orchards are typically owner farmed;
therefore, we would look at the income and expenses as belonging to the owner. Pasture land,
improved or native is typically operated on a cash lease basis. Under a cash lease, the owner
receives a fixed lease payment for the use of the land. The owner bears no risk to the farming or
ranching operation and does not share in any capital expense or profit. Cash lease and Owner
Operator is discussed in greater detail later.
Next step is to determine what the prevailing crop is. There was a total of 76,116 acres
planted in the dry crop category. Corn made up 9.6%, wheat made up 75.4%, soybeans made up
8.8%, sorghum made up 1.9%, cotton made up 1.2% and oats made up 3.1%. Since wheat makes
the percentile majority of the dry crop production (75.4%), wheat is initially used to determine the
productivity value for dry crop.
The key components for evaluating crop production are: Acres planted, acres harvested,
yield, government payments, secondary income (hunting, post-harvest grazing lease etc.). Variable
expenses (necessary expenses such as seed, fertilizer, insecticide, herbicide, application, harvest
haul and crop insurance. Fixed expenses include management and taxes. Fannin Central Appraisal
District uses the share lease (typical arrangement) and wheat production (prevailing crop) to
determine values for the dry crop category.
Yield / Planted Ratio
The yield / planted ratio is a calculation which compares the acres planted of a crop to the acres
harvested. The result of the calculation is applied to the yield. The formula is H/P x Y where H is
acres harvested, P is acres planted and Y is the yield per acre. Example, 20,000 acres was planted
in crop X. The yield for the crop was 50 bushels per acre. 18,000 were actually harvested.
Page | 2
The yield / planted ratio for this crop is 45.
Harvested 18,000 Yield per Acre Adjusted Yield
Planted 20,000 X 50 = 45
The result expresses the adjusted yield due to waste or loss of production. In this example, there
was 10% loss from acres planted to acres harvested and that loss is accounted for by adjusting the
yield. Let’s apply this to actual production numbers for the 2015 wheat crop for Fannin County.
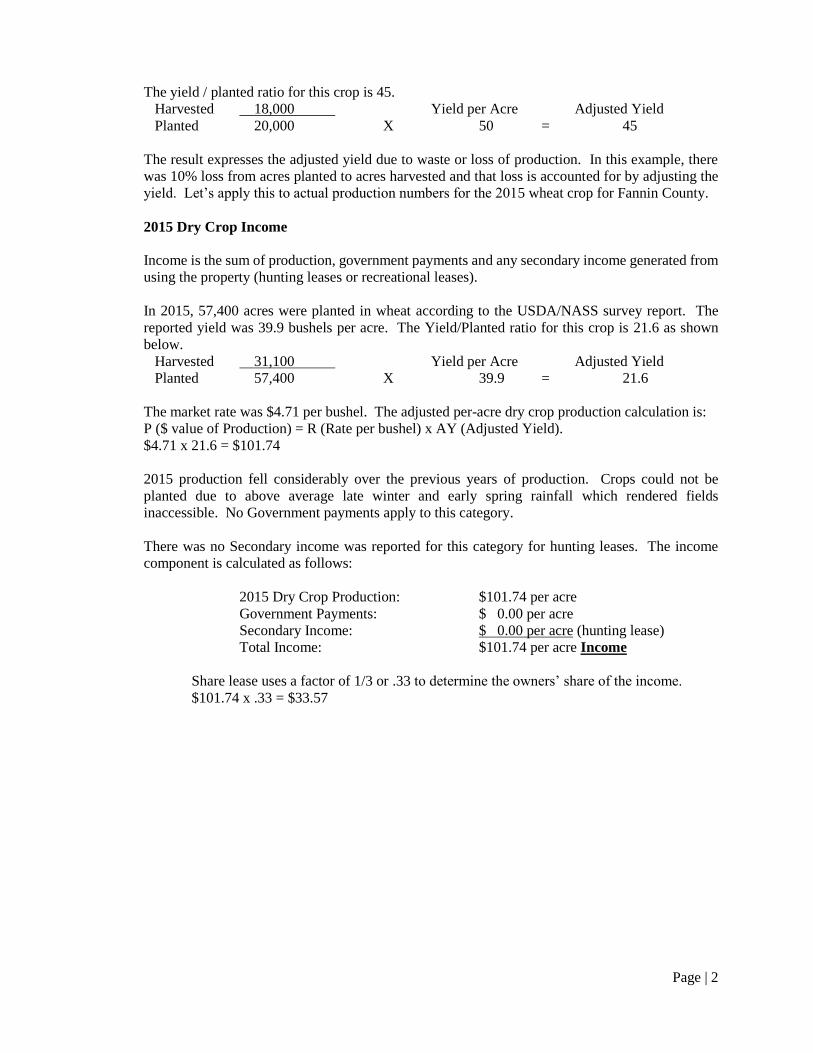
2015 Dry Crop Income
Income is the sum of production, government payments and any secondary income generated from
using the property (hunting leases or recreational leases).
In 2015, 57,400 acres were planted in wheat according to the USDA/NASS survey report. The
reported yield was 39.9 bushels per acre. The Yield/Planted ratio for this crop is 21.6 as shown
below.
Harvested 31,100 Yield per Acre Adjusted Yield
Planted 57,400 X 39.9 = 21.6
The market rate was $4.71 per bushel. The adjusted per-acre dry crop production calculation is:
P ($ value of Production) = R (Rate per bushel) x AY (Adjusted Yield).
$4.71 x 21.6 = $101.74
2015 production fell considerably over the previous years of production. Crops could not be
planted due to above average late winter and early spring rainfall which rendered fields
inaccessible. No Government payments apply to this category.
There was no Secondary income was reported for this category for hunting leases. The income
component is calculated as follows:
2015 Dry Crop Production: $101.74 per acre
Government Payments: $ 0.00 per acre
Secondary Income: $ 0.00 per acre (hunting lease)
Total Income: $101.74 per acre Income
Share lease uses a factor of 1/3 or .33 to determine the owners’ share of the income.
$101.74 x .33 = $33.57
Page | 3
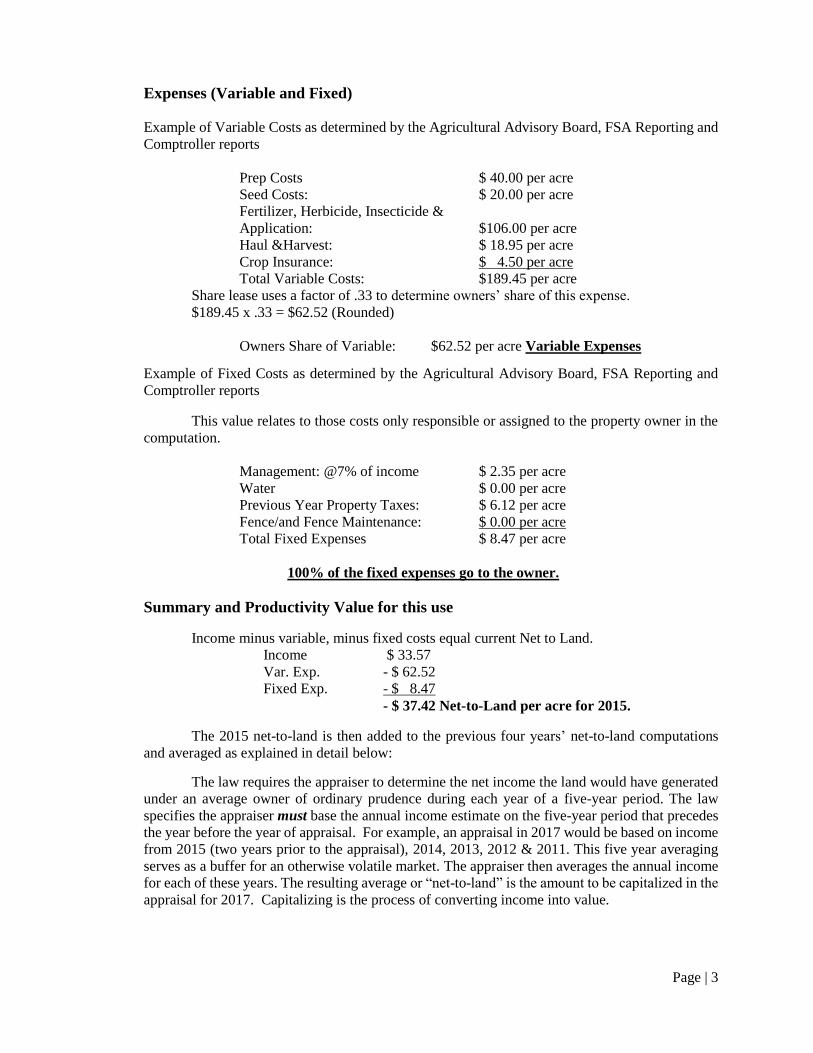
Expenses (Variable and Fixed)
Example of Variable Costs as determined by the Agricultural Advisory Board, FSA Reporting and
Comptroller reports
Prep Costs $ 40.00 per acre
Seed Costs: $ 20.00 per acre
Fertilizer, Herbicide, Insecticide &
Application: $106.00 per acre
Haul &Harvest: $ 18.95 per acre
Crop Insurance: $ 4.50 per acre
Total Variable Costs: $189.45 per acre
Share lease uses a factor of .33 to determine owners’ share of this expense.
$189.45 x .33 = $62.52 (Rounded)
Owners Share of Variable: $62.52 per acre Variable Expenses
Example of Fixed Costs as determined by the Agricultural Advisory Board, FSA Reporting and
Comptroller reports
This value relates to those costs only responsible or assigned to the property owner in the
computation.
Management: @7% of income $ 2.35 per acre
Water $ 0.00 per acre
Previous Year Property Taxes: $ 6.12 per acre
Fence/and Fence Maintenance: $ 0.00 per acre
Total Fixed Expenses $ 8.47 per acre
100% of the fixed expenses go to the owner.
Summary and Productivity Value for this use
Income minus variable, minus fixed costs equal current Net to Land.
Income $ 33.57
Var. Exp. - $ 62.52
Fixed Exp. - $ 8.47
- $ 37.42 Net-to-Land per acre for 2015.
The 2015 net-to-land is then added to the previous four years’ net-to-land computations
and averaged as explained in detail below:
The law requires the appraiser to determine the net income the land would have generated
under an average owner of ordinary prudence during each year of a five-year period. The law
specifies the appraiser must base the annual income estimate on the five-year period that precedes
the year before the year of appraisal. For example, an appraisal in 2017 would be based on income
from 2015 (two years prior to the appraisal), 2014, 2013, 2012 & 2011. This five year averaging
serves as a buffer for an otherwise volatile market. The appraiser then averages the annual income
for each of these years. The resulting average or “net-to-land” is the amount to be capitalized in the
appraisal for 2017. Capitalizing is the process of converting income into value.
Page | 4
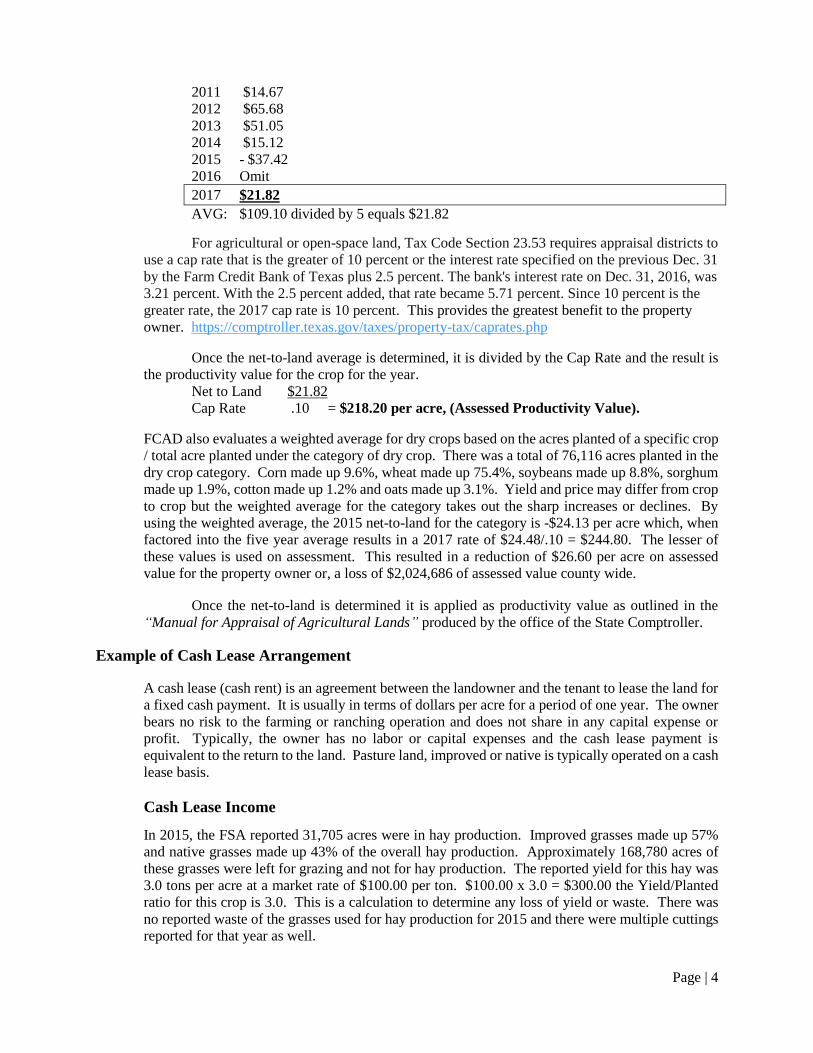
2011 $14.67
2012 $65.68
2013 $51.05
2014 $15.12
2015 - $37.42
2016 Omit
2017 $21.82
AVG: $109.10 divided by 5 equals $21.82
For agricultural or open-space land, Tax Code Section 23.53 requires appraisal districts to
use a cap rate that is the greater of 10 percent or the interest rate specified on the previous Dec. 31
by the Farm Credit Bank of Texas plus 2.5 percent. The bank's interest rate on Dec. 31, 2016, was
3.21 percent. With the 2.5 percent added, that rate became 5.71 percent. Since 10 percent is the
greater rate, the 2017 cap rate is 10 percent. This provides the greatest benefit to the property
owner. https://comptroller.texas.gov/taxes/property-tax/caprates.php
Once the net-to-land average is determined, it is divided by the Cap Rate and the result is
the productivity value for the crop for the year.
Net to Land $21.82
Cap Rate .10 = $218.20 per acre, (Assessed Productivity Value).
FCAD also evaluates a weighted average for dry crops based on the acres planted of a specific crop
/ total acre planted under the category of dry crop. There was a total of 76,116 acres planted in the
dry crop category. Corn made up 9.6%, wheat made up 75.4%, soybeans made up 8.8%, sorghum
made up 1.9%, cotton made up 1.2% and oats made up 3.1%. Yield and price may differ from crop
to crop but the weighted average for the category takes out the sharp increases or declines. By
using the weighted average, the 2015 net-to-land for the category is -$24.13 per acre which, when
factored into the five year average results in a 2017 rate of $24.48/.10 = $244.80. The lesser of
these values is used on assessment. This resulted in a reduction of $26.60 per acre on assessed
value for the property owner or, a loss of $2,024,686 of assessed value county wide.
Once the net-to-land is determined it is applied as productivity value as outlined in the
“Manual for Appraisal of Agricultural Lands” produced by the office of the State Comptroller.
Example of Cash Lease Arrangement
A cash lease (cash rent) is an agreement between the landowner and the tenant to lease the land for
a fixed cash payment. It is usually in terms of dollars per acre for a period of one year. The owner
bears no risk to the farming or ranching operation and does not share in any capital expense or
profit. Typically, the owner has no labor or capital expenses and the cash lease payment is
equivalent to the return to the land. Pasture land, improved or native is typically operated on a cash
lease basis.
Cash Lease Income
In 2015, the FSA reported 31,705 acres were in hay production. Improved grasses made up 57%
and native grasses made up 43% of the overall hay production. Approximately 168,780 acres of
these grasses were left for grazing and not for hay production. The reported yield for this hay was
3.0 tons per acre at a market rate of $100.00 per ton. $100.00 x 3.0 = $300.00 the Yield/Planted
ratio for this crop is 3.0. This is a calculation to determine any loss of yield or waste. There was
no reported waste of the grasses used for hay production for 2015 and there were multiple cuttings
reported for that year as well.
Page | 5
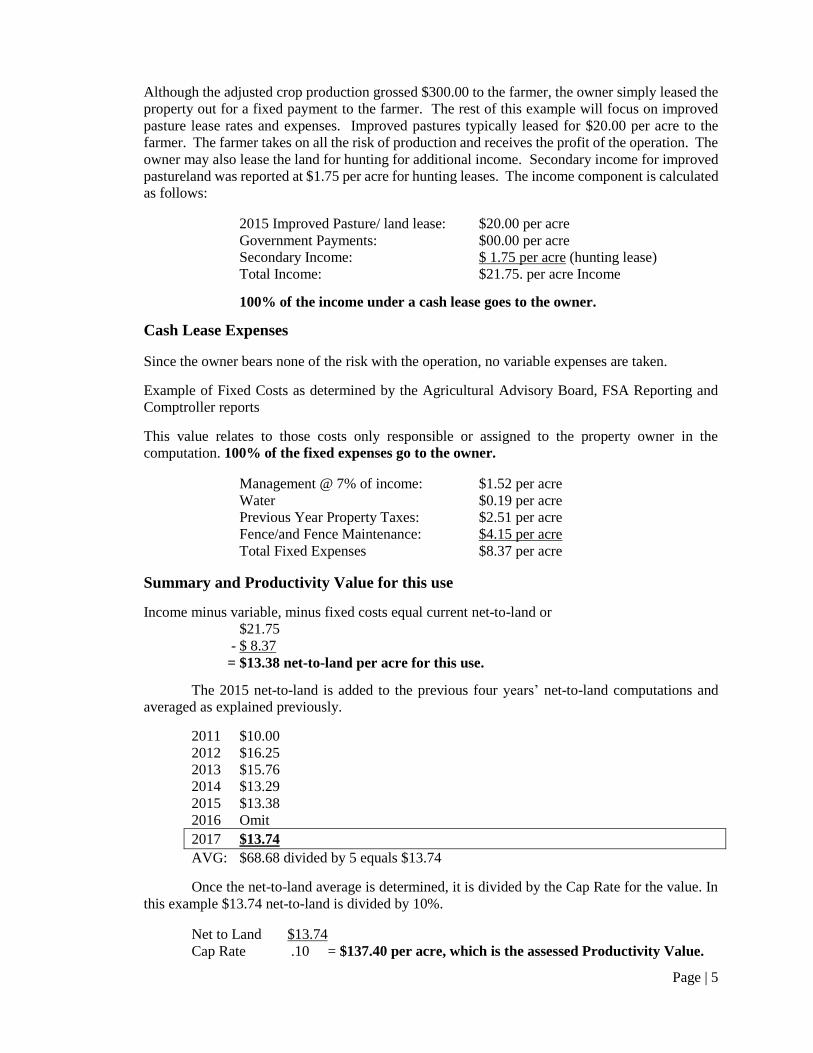
Although the adjusted crop production grossed $300.00 to the farmer, the owner simply leased the
property out for a fixed payment to the farmer. The rest of this example will focus on improved
pasture lease rates and expenses. Improved pastures typically leased for $20.00 per acre to the
farmer. The farmer takes on all the risk of production and receives the profit of the operation. The
owner may also lease the land for hunting for additional income. Secondary income for improved
pastureland was reported at $1.75 per acre for hunting leases. The income component is calculated
as follows:
2015 Improved Pasture/ land lease: $20.00 per acre
Government Payments: $00.00 per acre
Secondary Income: $ 1.75 per acre (hunting lease)
Total Income: $21.75. per acre Income
100% of the income under a cash lease goes to the owner.
Cash Lease Expenses
Since the owner bears none of the risk with the operation, no variable expenses are taken.
Example of Fixed Costs as determined by the Agricultural Advisory Board, FSA Reporting and
Comptroller reports
This value relates to those costs only responsible or assigned to the property owner in the
computation. 100% of the fixed expenses go to the owner.
Management @ 7% of income: $1.52 per acre
Water $0.19 per acre
Previous Year Property Taxes: $2.51 per acre
Fence/and Fence Maintenance: $4.15 per acre
Total Fixed Expenses $8.37 per acre
Summary and Productivity Value for this use
Income minus variable, minus fixed costs equal current net-to-land or
$21.75
- $ 8.37
= $13.38 net-to-land per acre for this use.
The 2015 net-to-land is added to the previous four years’ net-to-land computations and
averaged as explained previously.
2011 $10.00
2012 $16.25
2013 $15.76
2014 $13.29
2015 $13.38
2016 Omit
2017 $13.74
AVG: $68.68 divided by 5 equals $13.74
Once the net-to-land average is determined, it is divided by the Cap Rate for the value. In
this example $13.74 net-to-land is divided by 10%.
Net to Land $13.74
Cap Rate .10 = $137.40 per acre, which is the assessed Productivity Value.
Page | 6
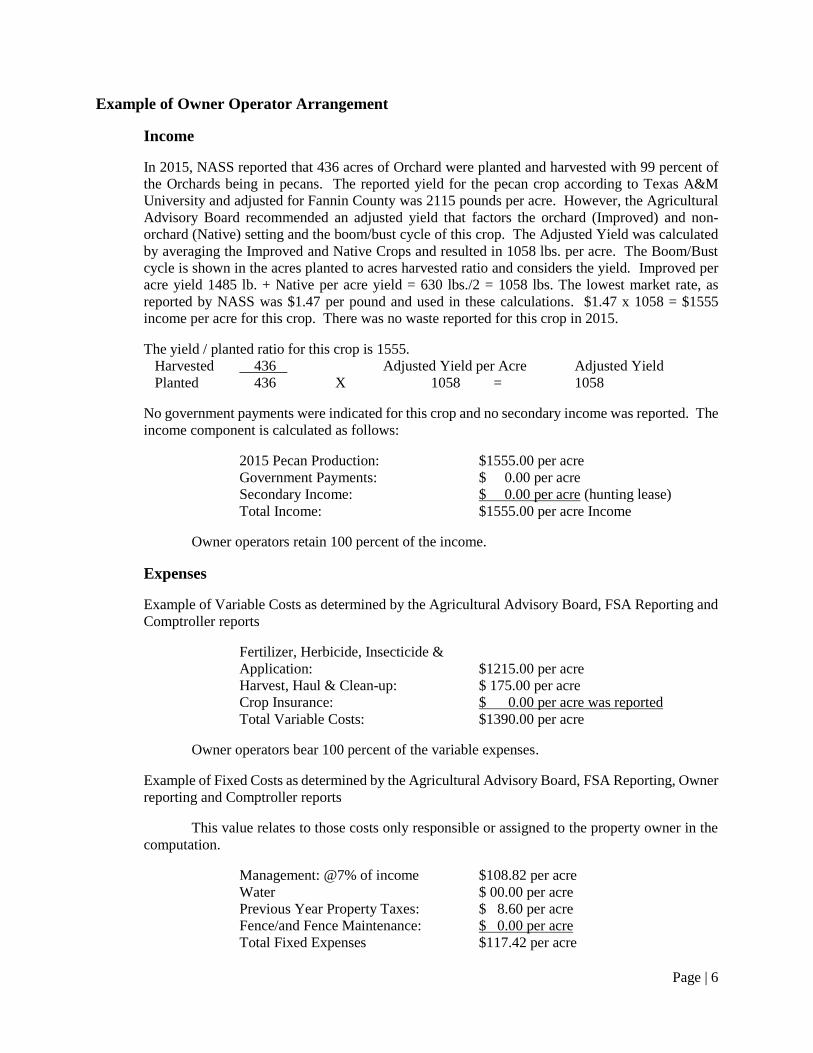
Example of Owner Operator Arrangement
Income
In 2015, NASS reported that 436 acres of Orchard were planted and harvested with 99 percent of
the Orchards being in pecans. The reported yield for the pecan crop according to Texas A&M
University and adjusted for Fannin County was 2115 pounds per acre. However, the Agricultural
Advisory Board recommended an adjusted yield that factors the orchard (Improved) and non-
orchard (Native) setting and the boom/bust cycle of this crop. The Adjusted Yield was calculated
by averaging the Improved and Native Crops and resulted in 1058 lbs. per acre. The Boom/Bust
cycle is shown in the acres planted to acres harvested ratio and considers the yield. Improved per
acre yield 1485 lb. + Native per acre yield = 630 lbs./2 = 1058 lbs. The lowest market rate, as
reported by NASS was $1.47 per pound and used in these calculations. $1.47 x 1058 = $1555
income per acre for this crop. There was no waste reported for this crop in 2015.
The yield / planted ratio for this crop is 1555.
Harvested 436 Adjusted Yield per Acre Adjusted Yield
Planted 436 X 1058 = 1058
No government payments were indicated for this crop and no secondary income was reported. The
income component is calculated as follows:
2015 Pecan Production: $1555.00 per acre
Government Payments: $ 0.00 per acre
Secondary Income: $ 0.00 per acre (hunting lease)
Total Income: $1555.00 per acre Income
Owner operators retain 100 percent of the income.
Expenses
Example of Variable Costs as determined by the Agricultural Advisory Board, FSA Reporting and
Comptroller reports
Fertilizer, Herbicide, Insecticide &
Application: $1215.00 per acre
Harvest, Haul & Clean-up: $ 175.00 per acre
Crop Insurance: $ 0.00 per acre was reported
Total Variable Costs: $1390.00 per acre
Owner operators bear 100 percent of the variable expenses.
Example of Fixed Costs as determined by the Agricultural Advisory Board, FSA Reporting, Owner
reporting and Comptroller reports
This value relates to those costs only responsible or assigned to the property owner in the
computation.
Management: @7% of income $108.82 per acre
Water $ 00.00 per acre
Previous Year Property Taxes: $ 8.60 per acre
Fence/and Fence Maintenance: $ 0.00 per acre
Total Fixed Expenses $117.42 per acre
Page | 7
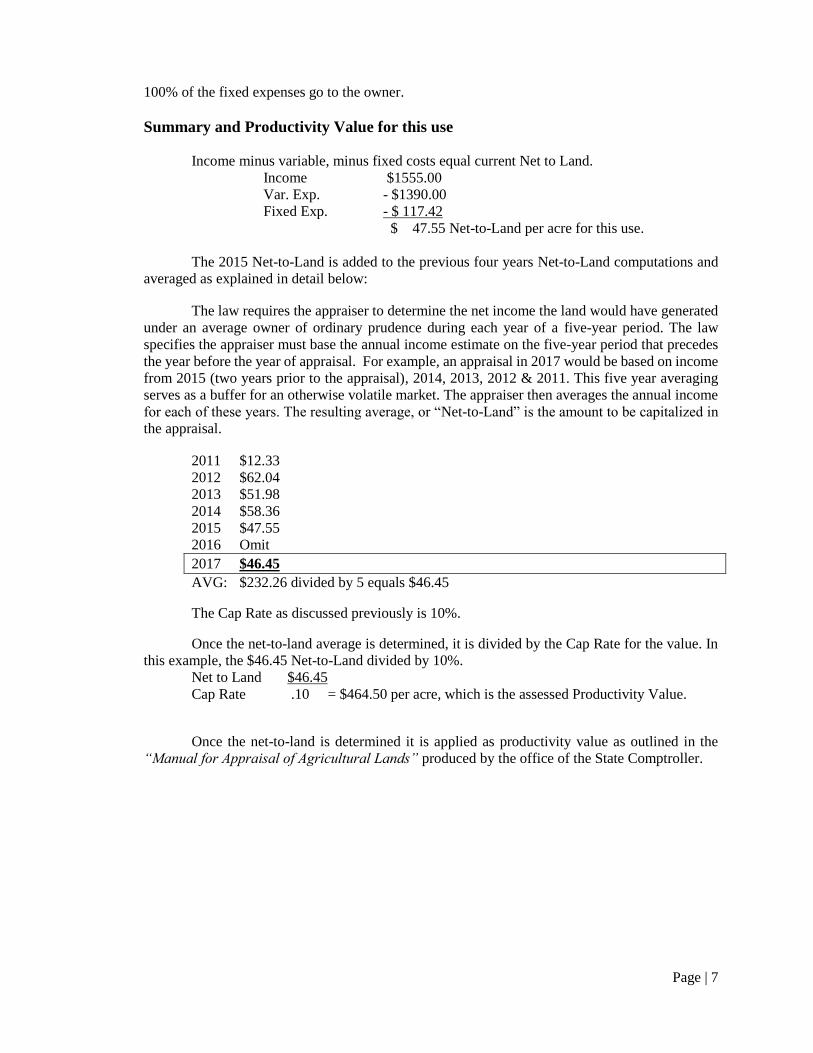
100% of the fixed expenses go to the owner.
Summary and Productivity Value for this use
Income minus variable, minus fixed costs equal current Net to Land.
Income $1555.00
Var. Exp. - $1390.00
Fixed Exp. - $ 117.42
$ 47.55 Net-to-Land per acre for this use.
The 2015 Net-to-Land is added to the previous four years Net-to-Land computations and
averaged as explained in detail below:
The law requires the appraiser to determine the net income the land would have generated
under an average owner of ordinary prudence during each year of a five-year period. The law
specifies the appraiser must base the annual income estimate on the five-year period that precedes
the year before the year of appraisal. For example, an appraisal in 2017 would be based on income
from 2015 (two years prior to the appraisal), 2014, 2013, 2012 & 2011. This five year averaging
serves as a buffer for an otherwise volatile market. The appraiser then averages the annual income
for each of these years. The resulting average, or “Net-to-Land” is the amount to be capitalized in
the appraisal.
2011 $12.33
2012 $62.04
2013 $51.98
2014 $58.36
2015 $47.55
2016 Omit
2017 $46.45
AVG: $232.26 divided by 5 equals $46.45
The Cap Rate as discussed previously is 10%.
Once the net-to-land average is determined, it is divided by the Cap Rate for the value. In
this example, the $46.45 Net-to-Land divided by 10%.
Net to Land $46.45
Cap Rate .10 = $464.50 per acre, which is the assessed Productivity Value.
Once the net-to-land is determined it is applied as productivity value as outlined in the
“Manual for Appraisal of Agricultural Lands” produced by the office of the State Comptroller.
Page | 8
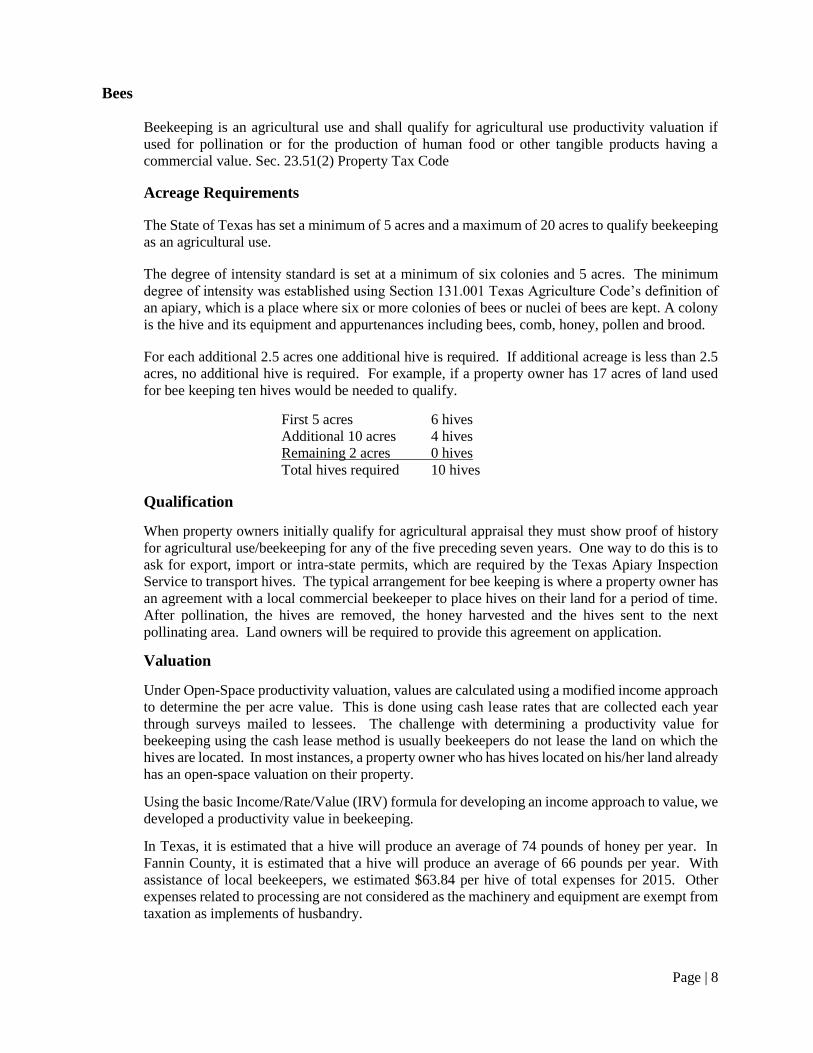
Bees
Beekeeping is an agricultural use and shall qualify for agricultural use productivity valuation if
used for pollination or for the production of human food or other tangible products having a
commercial value. Sec. 23.51(2) Property Tax Code
Acreage Requirements
The State of Texas has set a minimum of 5 acres and a maximum of 20 acres to qualify beekeeping
as an agricultural use.
The degree of intensity standard is set at a minimum of six colonies and 5 acres. The minimum
degree of intensity was established using Section 131.001 Texas Agriculture Code’s definition of
an apiary, which is a place where six or more colonies of bees or nuclei of bees are kept. A colony
is the hive and its equipment and appurtenances including bees, comb, honey, pollen and brood.
For each additional 2.5 acres one additional hive is required. If additional acreage is less than 2.5
acres, no additional hive is required. For example, if a property owner has 17 acres of land used
for bee keeping ten hives would be needed to qualify.
First 5 acres 6 hives
Additional 10 acres 4 hives
Remaining 2 acres 0 hives
Total hives required 10 hives
Qualification
When property owners initially qualify for agricultural appraisal they must show proof of history
for agricultural use/beekeeping for any of the five preceding seven years. One way to do this is to
ask for export, import or intra-state permits, which are required by the Texas Apiary Inspection
Service to transport hives. The typical arrangement for bee keeping is where a property owner has
an agreement with a local commercial beekeeper to place hives on their land for a period of time.
After pollination, the hives are removed, the honey harvested and the hives sent to the next
pollinating area. Land owners will be required to provide this agreement on application.
Valuation
Under Open-Space productivity valuation, values are calculated using a modified income approach
to determine the per acre value. This is done using cash lease rates that are collected each year
through surveys mailed to lessees. The challenge with determining a productivity value for
beekeeping using the cash lease method is usually beekeepers do not lease the land on which the
hives are located. In most instances, a property owner who has hives located on his/her land already
has an open-space valuation on their property.
Using the basic Income/Rate/Value (IRV) formula for developing an income approach to value, we
developed a productivity value in beekeeping.
In Texas, it is estimated that a hive will produce an average of 74 pounds of honey per year. In
Fannin County, it is estimated that a hive will produce an average of 66 pounds per year. With
assistance of local beekeepers, we estimated $63.84 per hive of total expenses for 2015. Other
expenses related to processing are not considered as the machinery and equipment are exempt from
taxation as implements of husbandry.
Page | 9
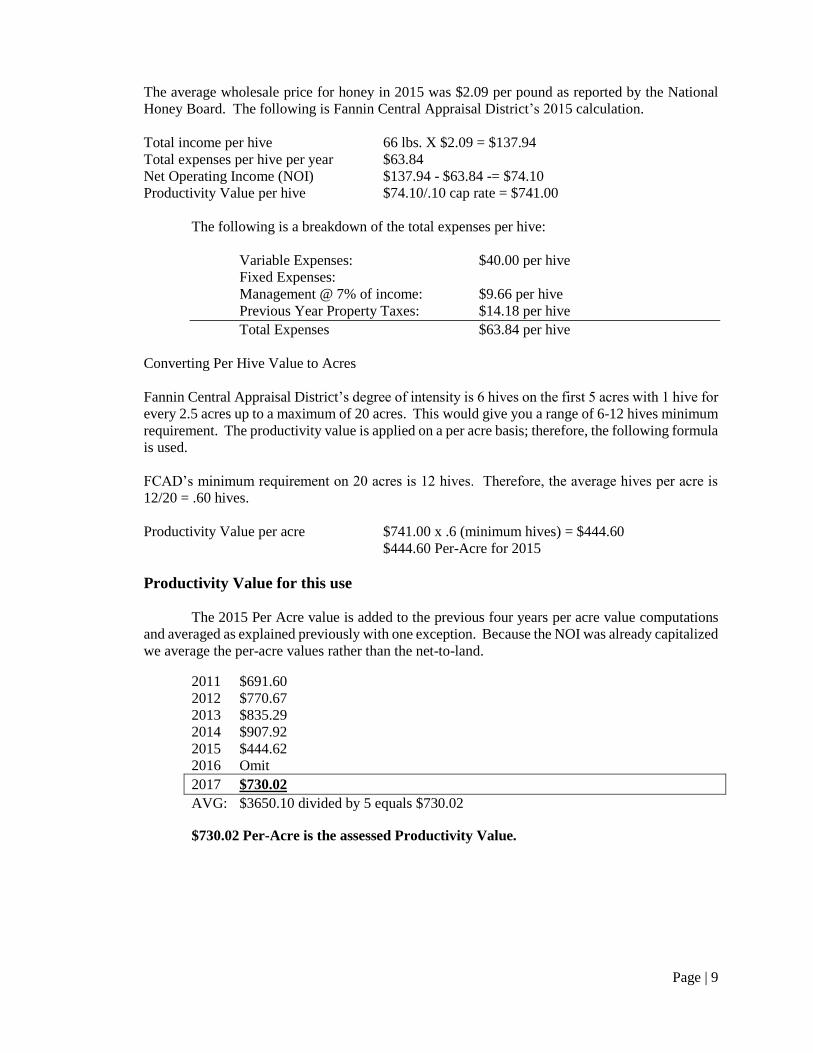
The average wholesale price for honey in 2015 was $2.09 per pound as reported by the National
Honey Board. The following is Fannin Central Appraisal District’s 2015 calculation.
Total income per hive 66 lbs. X $2.09 = $137.94
Total expenses per hive per year $63.84
Net Operating Income (NOI) $137.94 - $63.84 -= $74.10
Productivity Value per hive $74.10/.10 cap rate = $741.00
The following is a breakdown of the total expenses per hive:
Variable Expenses: $40.00 per hive
Fixed Expenses:
Management @ 7% of income: $9.66 per hive
Previous Year Property Taxes: $14.18 per hive
Total Expenses $63.84 per hive
Converting Per Hive Value to Acres
Fannin Central Appraisal District’s degree of intensity is 6 hives on the first 5 acres with 1 hive for
every 2.5 acres up to a maximum of 20 acres. This would give you a range of 6-12 hives minimum
requirement. The productivity value is applied on a per acre basis; therefore, the following formula
is used.
FCAD’s minimum requirement on 20 acres is 12 hives. Therefore, the average hives per acre is
12/20 = .60 hives.
Productivity Value per acre $741.00 x .6 (minimum hives) = $444.60
$444.60 Per-Acre for 2015
Productivity Value for this use
The 2015 Per Acre value is added to the previous four years per acre value computations
and averaged as explained previously with one exception. Because the NOI was already capitalized
we average the per-acre values rather than the net-to-land.
2011 $691.60
2012 $770.67
2013 $835.29
2014 $907.92
2015 $444.62
2016 Omit
2017 $730.02
AVG: $3650.10 divided by 5 equals $730.02
$730.02 Per-Acre is the assessed Productivity Value.
Page | 10
Bee Keeping References:
Mr. Paul Jackson
Chief Apiary Inspector
State of Texas
979-845-9714
Mr. Todd Youngblood
Youngblood Apiaries
830-334-7631
Mr. Clint Walker
Walker Honey Farm
254-721-0096
Mr. Ryan Thomas
Thomas & Langdon Honey Farms
936-334-7823
Mr. Kenny Reed
Reed Honey Company
281-620-5626
Mr. Chad Holbrook
USDA, FSA, Local Beekeeper
903-583-2168
Page | 11
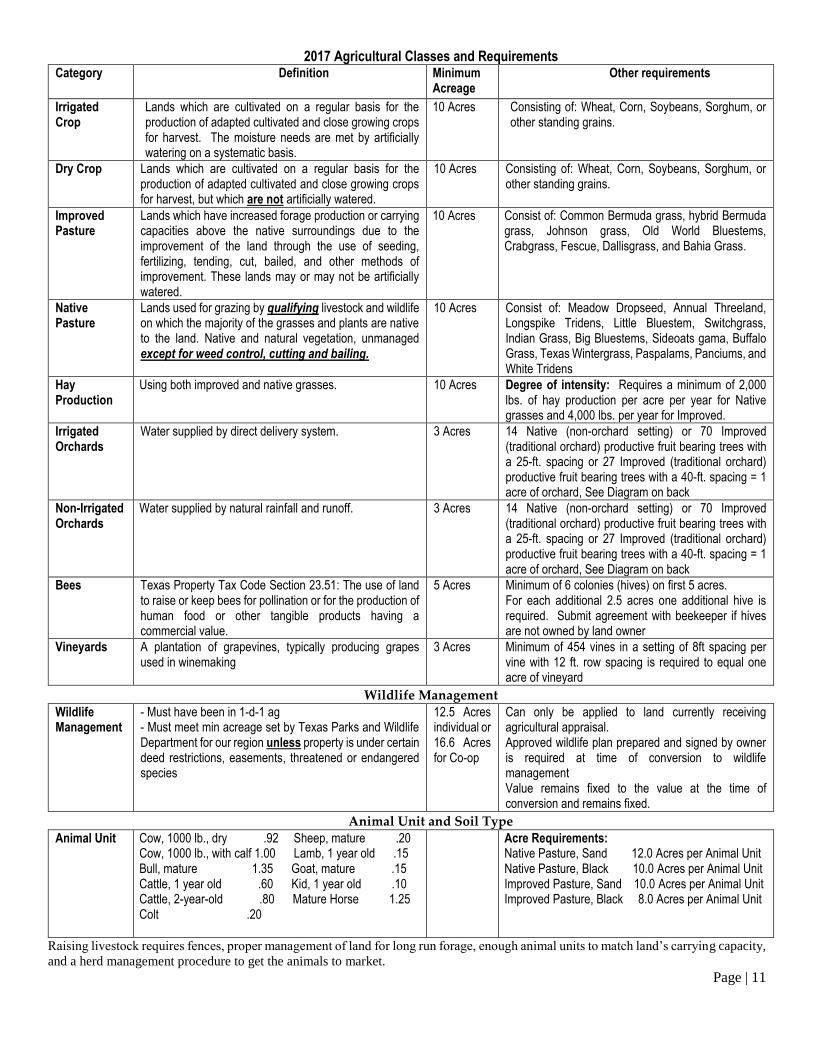
2017 Agricultural Classes and Requirements Category Definition Minimum
Acreage Other requirements
Irrigated Crop
Lands which are cultivated on a regular basis for the production of adapted cultivated and close growing crops for harvest. The moisture needs are met by artificially watering on a systematic basis.
10 Acres Consisting of: Wheat, Corn, Soybeans, Sorghum, or other standing grains.
Dry Crop
Lands which are cultivated on a regular basis for the production of adapted cultivated and close growing crops for harvest, but which are not artificially watered.
10 Acres Consisting of: Wheat, Corn, Soybeans, Sorghum, or other standing grains.
Improved Pasture
Lands which have increased forage production or carrying capacities above the native surroundings due to the improvement of the land through the use of seeding, fertilizing, tending, cut, bailed, and other methods of improvement. These lands may or may not be artificially watered.
10 Acres Consist of: Common Bermuda grass, hybrid Bermuda grass, Johnson grass, Old World Bluestems, Crabgrass, Fescue, Dallisgrass, and Bahia Grass.
Native Pasture
Lands used for grazing by qualifying livestock and wildlife on which the majority of the grasses and plants are native to the land. Native and natural vegetation, unmanaged except for weed control, cutting and bailing.
10 Acres Consist of: Meadow Dropseed, Annual Threeland, Longspike Tridens, Little Bluestem, Switchgrass, Indian Grass, Big Bluestems, Sideoats gama, Buffalo Grass, Texas Wintergrass, Paspalams, Panciums, and White Tridens
Hay Production
Using both improved and native grasses. 10 Acres Degree of intensity: Requires a minimum of 2,000 lbs. of hay production per acre per year for Native grasses and 4,000 lbs. per year for Improved.
Irrigated Orchards
Water supplied by direct delivery system. 3 Acres 14 Native (non-orchard setting) or 70 Improved (traditional orchard) productive fruit bearing trees with a 25-ft. spacing or 27 Improved (traditional orchard) productive fruit bearing trees with a 40-ft. spacing = 1 acre of orchard, See Diagram on back
Non-Irrigated Orchards
Water supplied by natural rainfall and runoff. 3 Acres 14 Native (non-orchard setting) or 70 Improved (traditional orchard) productive fruit bearing trees with a 25-ft. spacing or 27 Improved (traditional orchard) productive fruit bearing trees with a 40-ft. spacing = 1 acre of orchard, See Diagram on back
Bees Texas Property Tax Code Section 23.51: The use of land to raise or keep bees for pollination or for the production of human food or other tangible products having a commercial value.
5 Acres Minimum of 6 colonies (hives) on first 5 acres. For each additional 2.5 acres one additional hive is required. Submit agreement with beekeeper if hives are not owned by land owner
Vineyards A plantation of grapevines, typically producing grapes used in winemaking
3 Acres Minimum of 454 vines in a setting of 8ft spacing per vine with 12 ft. row spacing is required to equal one acre of vineyard
Wildlife Management
Wildlife Management
- Must have been in 1-d-1 ag - Must meet min acreage set by Texas Parks and Wildlife Department for our region unless property is under certain deed restrictions, easements, threatened or endangered species
12.5 Acres individual or 16.6 Acres for Co-op
Can only be applied to land currently receiving agricultural appraisal. Approved wildlife plan prepared and signed by owner is required at time of conversion to wildlife management Value remains fixed to the value at the time of conversion and remains fixed.
Animal Unit and Soil Type
Animal Unit Cow, 1000 lb., dry .92 Sheep, mature .20 Cow, 1000 lb., with calf 1.00 Lamb, 1 year old .15 Bull, mature 1.35 Goat, mature .15 Cattle, 1 year old .60 Kid, 1 year old .10 Cattle, 2-year-old .80 Mature Horse 1.25 Colt .20
Acre Requirements: Native Pasture, Sand 12.0 Acres per Animal Unit Native Pasture, Black 10.0 Acres per Animal Unit Improved Pasture, Sand 10.0 Acres per Animal Unit Improved Pasture, Black 8.0 Acres per Animal Unit
Raising livestock requires fences, proper management of land for long run forage, enough animal units to match land’s carrying capacity,
and a herd management procedure to get the animals to market.
Page | 12
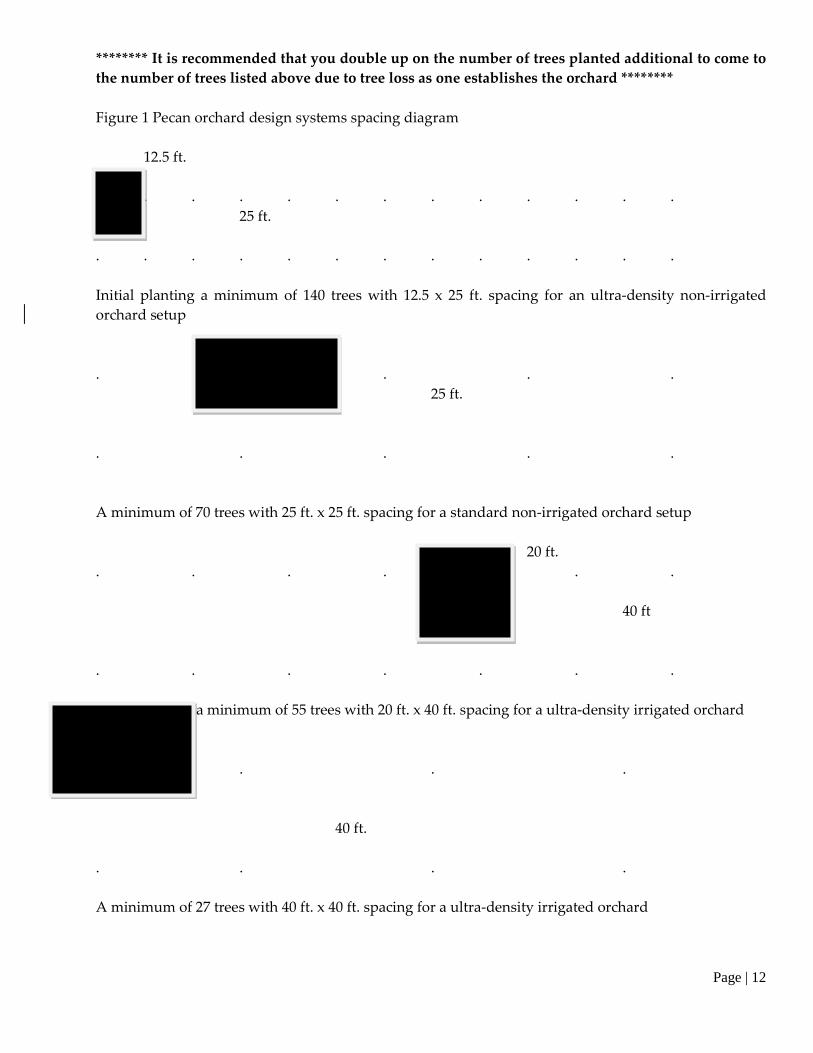
******** It is recommended that you double up on the number of trees planted additional to come to
the number of trees listed above due to tree loss as one establishes the orchard ********
Figure 1 Pecan orchard design systems spacing diagram
12.5 ft.
. . . . . . . . . . . . .
25 ft.
. . . . . . . . . . . . .
Initial planting a minimum of 140 trees with 12.5 x 25 ft. spacing for an ultra-density non-irrigated
orchard setup
25 ft
. . . . .
25 ft.
. . . . .
A minimum of 70 trees with 25 ft. x 25 ft. spacing for a standard non-irrigated orchard setup
20 ft.
. . . . . . .
40 ft
. . . . . . .
Initial planting a minimum of 55 trees with 20 ft. x 40 ft. spacing for a ultra-density irrigated orchard
40 ft
. . . .
40 ft.
. . . .
A minimum of 27 trees with 40 ft. x 40 ft. spacing for a ultra-density irrigated orchard