Embed Size (px)
Citation preview
The Agricultural Productivity Gap
Douglas Gollin David Lagakos Michael E. Waugh
Oxford UCSD NYU
November 11, 2013
0 / 37
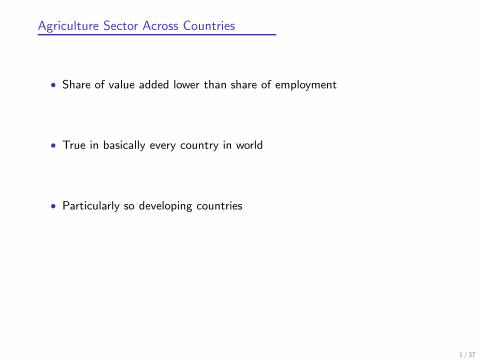
Agriculture Sector Across Countries
• Share of value added lower than share of employment
• True in basically every country in world
• Particularly so developing countries
1 / 37
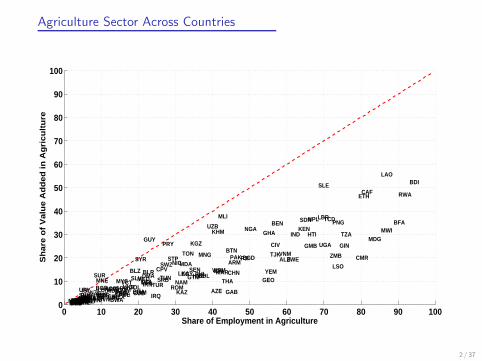
Agriculture Sector Across Countries
0 10 20 30 40 50 60 70 80 90 1000
10
20
30
40
50
60
70
80
90
100
ALB
DZA
ATG
ARG
ARM
AUSAUT
AZEBHS
BGD
BRB
BLR
BEL
BLZ
BEN
BMU
BTN
BOL
BWABRA
BRN
BGR
BFA
BDI
KHM
CMR
CAN
CPV
CAF
TCD
CHL
CHN
COLCRI
CIV
HRV CUBCYPCZEDNK
DMA
DOM
EGYSLV
EST
ETH
FJI
FINFRAGAB
GMB
GEO
GER
GHA
GRC
GRD
GTM
GINGUY
HTI
HND
HUNISL
IND
IDN
IRN
IRQIRLISRITA
JAM
JPNJOR
KAZ
KEN
KOR
KGZ
LAO
LVALBN
LSO
LBR
LTU
MKD
MDGMWI
MYS
MDV
MLI
MLT
MHL
MUS MEX
MDA
MNG
MNEMAR
NAM
NPL
NLDNZL
NIC
NGA
NOR OMN
PAK
PAN
PNG
PRY
PHL
POLPRT
ROMRUS
RWA
LCA
WSM
STP
SAU
SEN
SRB
SLE
SVKSVNZAFESP
LKA
VCT
SDN
SUR
SWZ
SWECHE
SYRTJK
TZA
THA
TON
TUNTUR
UGA
UKR
GBRUSA
URY
UZB
VEN
VNM
YEM
ZMBZWE
Share of Employment in Agriculture
Sh
are
of V
alu
e A
dd
ed
in A
gricu
lture
2 / 37
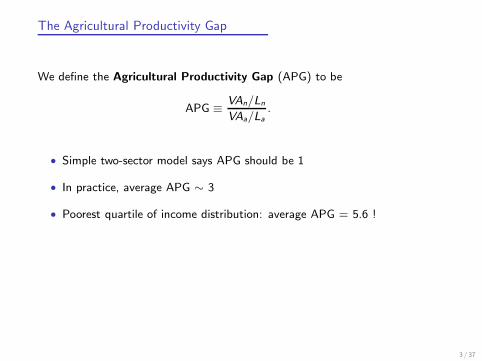
The Agricultural Productivity Gap
We define the Agricultural Productivity Gap (APG) to be
APG ≡VAn/Ln
VAa/La
.
• Simple two-sector model says APG should be 1
• In practice, average APG ∼ 3
• Poorest quartile of income distribution: average APG = 5.6 !
3 / 37
The Agricultural Productivity Gap
• Taken at face value, gaps suggest misallocation
• Policy debate: encourage movement out of agriculture?
• This paper: step back and address measurement issues
4 / 37

What Do Agricultural Productivity Gaps Reflect?
• Sector differences in hours worked per worker?
Construct measures of hours worked by sector for 76 countries
• Sector differences in human capital per worker?
Construct measures of human capital by sector for 124 countries
• Measurement error in national accounts data?
Construct our own estimates using household survey data in 10 countries
5 / 37
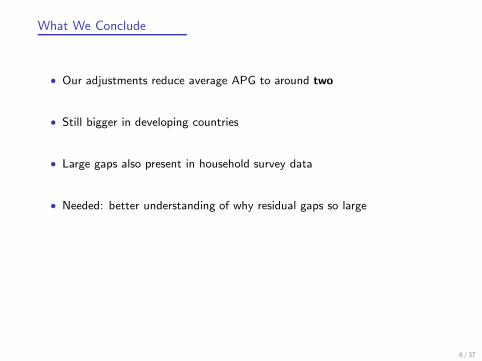
What We Conclude
• Our adjustments reduce average APG to around two
• Still bigger in developing countries
• Large gaps also present in household survey data
• Needed: better understanding of why residual gaps so large
6 / 37
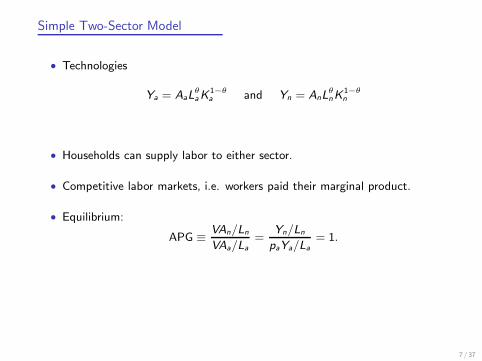
Simple Two-Sector Model
• Technologies
Ya = AaLθaK
1−θa and Yn = AnL
θnK
1−θn
• Households can supply labor to either sector.
• Competitive labor markets, i.e. workers paid their marginal product.
• Equilibrium:
APG ≡VAn/Ln
VAa/La
=Yn/Ln
paYa/La
= 1.
7 / 37
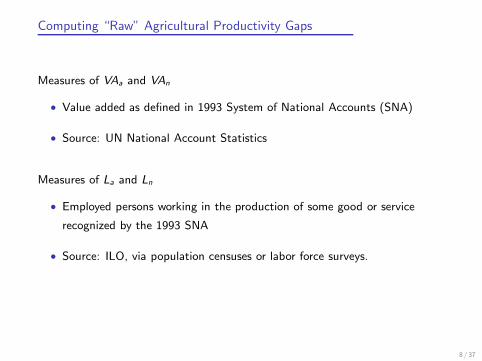
Computing “Raw” Agricultural Productivity Gaps
Measures of VAa and VAn
• Value added as defined in 1993 System of National Accounts (SNA)
• Source: UN National Account Statistics
Measures of La and Ln
• Employed persons working in the production of some good or service
recognized by the 1993 SNA
• Source: ILO, via population censuses or labor force surveys.
8 / 37
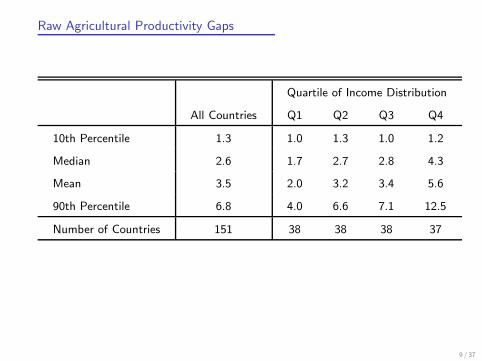
Raw Agricultural Productivity Gaps
Quartile of Income Distribution
All Countries Q1 Q2 Q3 Q4
10th Percentile 1.3 1.0 1.3 1.0 1.2
Median 2.6 1.7 2.7 2.8 4.3
Mean 3.5 2.0 3.2 3.4 5.6
90th Percentile 6.8 4.0 6.6 7.1 12.5
Number of Countries 151 38 38 38 37
9 / 37
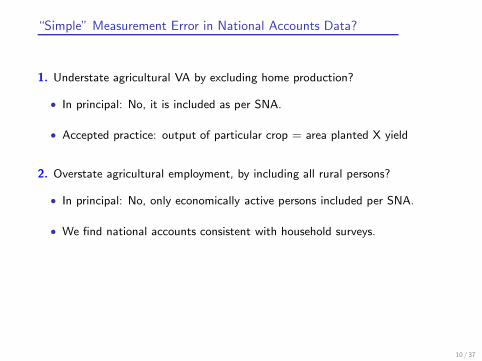
“Simple” Measurement Error in National Accounts Data?
1. Understate agricultural VA by excluding home production?
• In principal: No, it is included as per SNA.
• Accepted practice: output of particular crop = area planted X yield
2. Overstate agricultural employment, by including all rural persons?
• In principal: No, only economically active persons included per SNA.
• We find national accounts consistent with household surveys.
10 / 37
Our Adjustments
1. Improved measures of labor input by sector
• Sector differences in hours worked per worker.
• Sector differences in human capital per worker.
2. Alternative measures of value added by sector
• Reconstruct national accounts data from household survey data.
11 / 37
Our Adjustments
1. Improved measures of labor input by sector
• Sector differences in hours worked per worker.
• Sector differences in human capital per worker.
2. Alternative measures of value added by sector
• Reconstruct national accounts data from household survey data.
11 / 37
Improved Measures of Labor Input by Sector
12 / 37
Sector Differences in Hours Worked
Average hours worked per worker might differ across sectors
We construct average hours worked per worker by sector for 76 countries
• Population census micro data or labor force surveys
• All employed persons 15+ years old
• Industry of primary employment
• Hours worked in reference period (usually one week)
13 / 37
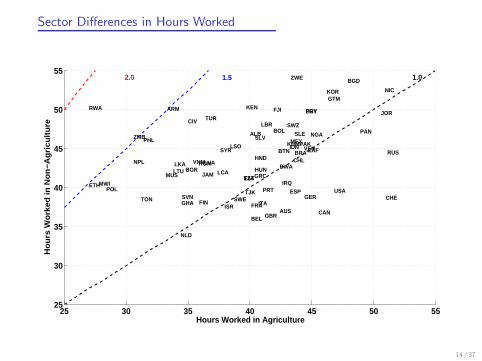
Sector Differences in Hours Worked
25 30 35 40 45 50 5525
30
35
40
45
50
55
ALB
ARM
AUS
BGD
BEL
BTN
BOL
BWA
BRA
BGR
KHM
CAN
CHL
CIV
EGY
SLV
ESTETH
FJI
FIN FRAGER
GHA
GRC
GTM
HND
HUN
IDN
IRQ
ISR ITA
JAM
JORKEN
KOR
LVA
LSO
LBR
LTU
MWIMUS
MEX
NPL
NLD
NIC
NGA
PAK
PAN
PRY
PHL
POL PRT
ROM
RUS
RWA
LCA
SLE
SVN
ZAF
ESP
LKA
SWZ
SWE CHE
SYR
TJK
TZA
TON
TUR
GBR
USA
VEN
VNM
ZMB
ZWE
Hours Worked in Agriculture
Hou
rs W
orke
d in
Non
−A
gric
ultu
re
2.0 1.5 1.0
14 / 37
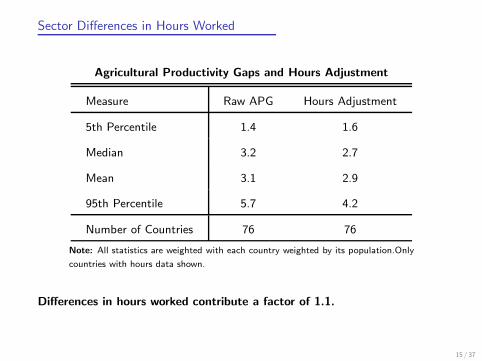
Sector Differences in Hours Worked
Agricultural Productivity Gaps and Hours Adjustment
Measure Raw APG Hours Adjustment
5th Percentile 1.4 1.6
Median 3.2 2.7
Mean 3.1 2.9
95th Percentile 5.7 4.2
Number of Countries 76 76
Note: All statistics are weighted with each country weighted by its population.Only
countries with hours data shown.
Differences in hours worked contribute a factor of 1.1.
15 / 37
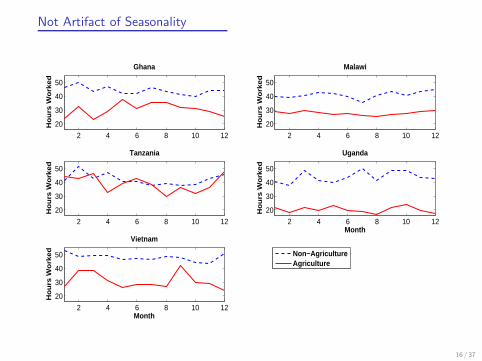
Not Artifact of Seasonality
2 4 6 8 10 12
20
30
40
50
Ghana
Ho
urs
Wo
rke
d
2 4 6 8 10 12
20
30
40
50
Malawi
Ho
urs
Wo
rke
d
2 4 6 8 10 12
20
30
40
50
Tanzania
Ho
urs
Wo
rke
d
2 4 6 8 10 12
20
30
40
50
Uganda
Month
Ho
urs
Wo
rke
d
2 4 6 8 10 12
20
30
40
50
Vietnam
Month
Ho
urs
Wo
rke
d
Non−Agriculture Agriculture
16 / 37
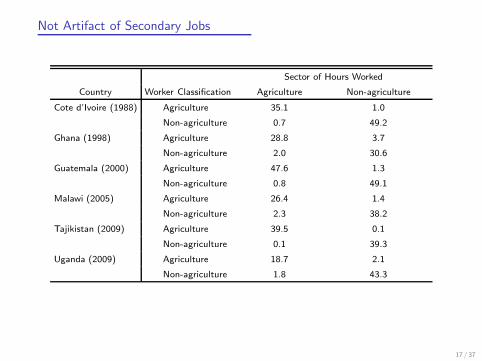
Not Artifact of Secondary Jobs
Sector of Hours Worked
Country Worker Classification Agriculture Non-agriculture
Cote d’Ivoire (1988) Agriculture 35.1 1.0
Non-agriculture 0.7 49.2
Ghana (1998) Agriculture 28.8 3.7
Non-agriculture 2.0 30.6
Guatemala (2000) Agriculture 47.6 1.3
Non-agriculture 0.8 49.1
Malawi (2005) Agriculture 26.4 1.4
Non-agriculture 2.3 38.2
Tajikistan (2009) Agriculture 39.5 0.1
Non-agriculture 0.1 39.3
Uganda (2009) Agriculture 18.7 2.1
Non-agriculture 1.8 43.3
17 / 37
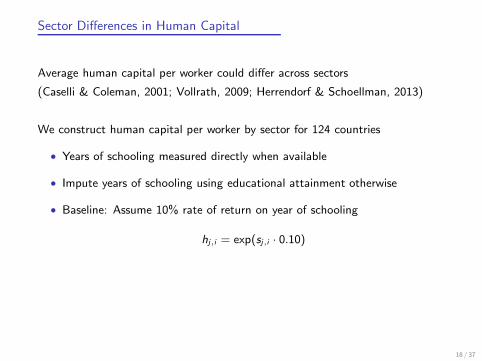
Sector Differences in Human Capital
Average human capital per worker could differ across sectors
(Caselli & Coleman, 2001; Vollrath, 2009; Herrendorf & Schoellman, 2013)
We construct human capital per worker by sector for 124 countries
• Years of schooling measured directly when available
• Impute years of schooling using educational attainment otherwise
• Baseline: Assume 10% rate of return on year of schooling
hj,i = exp(sj,i · 0.10)
18 / 37
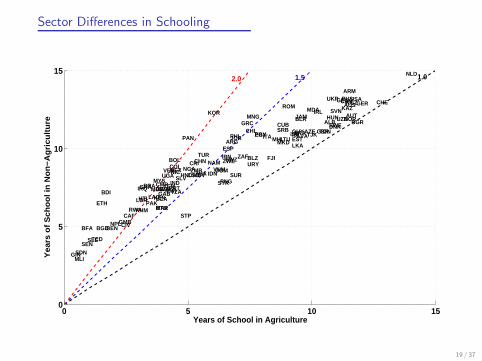
Sector Differences in Schooling
0 5 10 150
5
10
15
ALB
ARG
ARM
AUS
AUT
AZE
BGD
BLR
BLZ
BEN
BTN
BOL
BWABRA
BGR
BFA
BDI
KHM
CMR
CAN
CAF
TCD
CHL
CHNCOL CRI
CIV
CUB DNK
DOM
EGY
SLV
EST
ETH
FJI
FRA
GAB
GMB
GEO GER
GHA
GRC
GTM
GIN
GUY
HTI
HND
HUN
ISL
IND
IDN
IRN
IRQ
IRL
ISRITA
JAM
JOR
KAZ
KEN
KOR
KGZ
LAO
LVA
LSO
LBR
LTUMKD
MDG MWI
MYSMDV
MLI
MHL
MEX
MDAMNG
MAR
NAM
NPL
NLD
NIC NGA
NOR
PAK
PAN
PNG
PRYPHL
PRT
ROMRUS
RWA
LCA
STP
SEN
SRB
SLE
SVN
ZAFESP LKA
SDN
SUR
SWZ
SWE
CHE
SYR
TJK
TZA
THA
TON
TUR
UGA
UKR
GBR
USA
URY
UZB
VEN VNM
YEM
ZMB
ZWE
Years of School in Agriculture
Yea
rs o
f Sch
ool i
n N
on−
Agr
icul
ture
2.0 1.5 1.0
19 / 37
Sector Differences in Human Capital
1 1.5 2 2.5 3 3.5 4 4.51
1.5
2
2.5
3
3.5
4
4.5
ALB
ARG
ARM
AUS
AUT
AZE
BGD
BLR
BLZ
BEN
BTN
BOL
BWABRA
BGR
BFA
BDI
KHM
CMR
CAN
CAF
TCD
CHL
CHNCOL
CRI
CIV
CUB DNK
DOM
EGY
SLV
EST
ETH
FJI
FRA
GAB
GMB
GEOGER
GHA
GRC
GTM
GIN
GUY
HTI
HND
HUN
ISL
IND
IDN
IRN
IRQ
IRL
ISRITA
JAM
JOR
KAZ
KEN
KOR
KGZ
LAO
LVA
LSO
LBR
LTUMKD
MDGMWI
MYSMDV
MLI
MHL
MEX
MDA
MNG
MAR
NAM
NPL
NLD
NICNGA
NOR
PAK
PAN
PNG
PRYPHL
PRT
ROM
RUS
RWA
LCA
STP
SEN
SRB
SLE
SVN
ZAF
ESPLKA
SDN
SUR
SWZ
SWE
CHE
SYR
TJK
TZA
THA
TON
TUR
UGA
UKR
GBR
USA
URY
UZB
VEN VNM
YEM
ZMB
ZWE
Human Capital in Agriculture
Hum
an C
apita
l in
Non
−A
gric
ultu
re
2.0 1.5 1.0
20 / 37
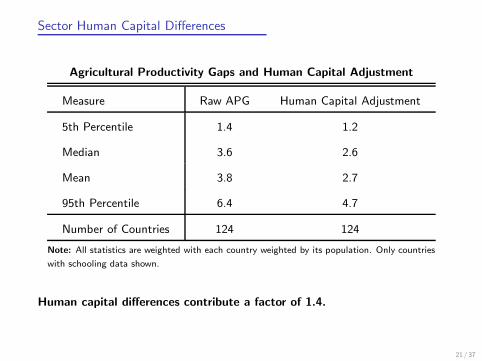
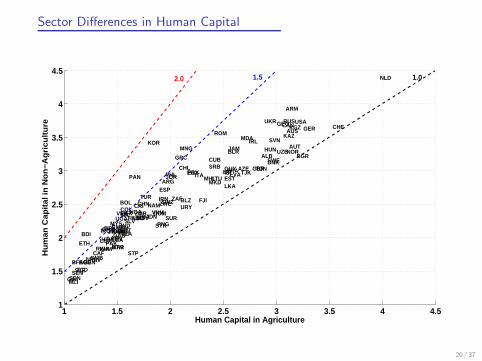
Sector Human Capital Differences
Agricultural Productivity Gaps and Human Capital Adjustment
Measure Raw APG Human Capital Adjustment
5th Percentile 1.4 1.2
Median 3.6 2.6
Mean 3.8 2.7
95th Percentile 6.4 4.7
Number of Countries 124 124
Note: All statistics are weighted with each country weighted by its population. Only countries
with schooling data shown.
Human capital differences contribute a factor of 1.4.
21 / 37
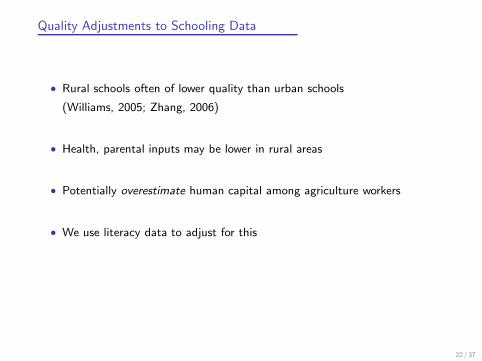
Quality Adjustments to Schooling Data
• Rural schools often of lower quality than urban schools
(Williams, 2005; Zhang, 2006)
• Health, parental inputs may be lower in rural areas
• Potentially overestimate human capital among agriculture workers
• We use literacy data to adjust for this
22 / 37
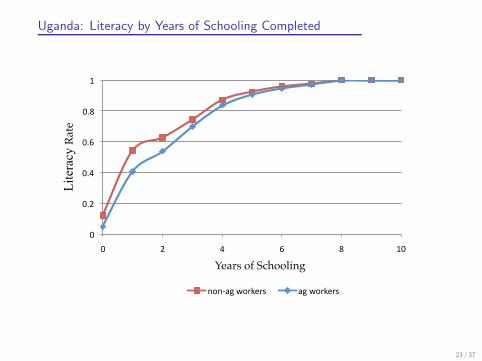
Uganda: Literacy by Years of Schooling Completed
!"
!#$"
!#%"
!#&"
!#'"
("
!" $" %" &" '" (!"
Lit
erac
y R
ate
Years of Schooling
)*)+,-".*/01/2" ,-".*/01/2"
23 / 37
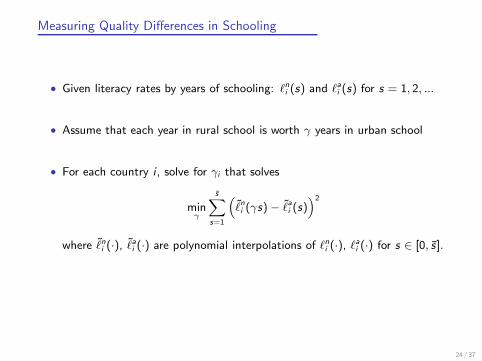
Measuring Quality Differences in Schooling
• Given literacy rates by years of schooling: ℓni (s) and ℓai (s) for s = 1, 2, ...
• Assume that each year in rural school is worth γ years in urban school
• For each country i , solve for γi that solves
minγ
s̄∑
s=1
(
ℓ̃ni (γs)− ℓ̃ai (s))2
where ℓ̃ni (·), ℓ̃ai (·) are polynomial interpolations of ℓni (·), ℓ
ai (·) for s ∈ [0, s̄].
24 / 37
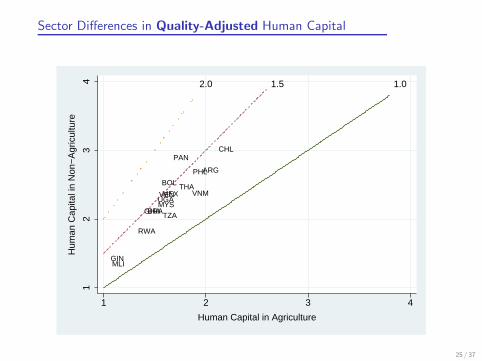
Sector Differences in Quality-Adjusted Human Capital
ARG
BOL
BRA
CHL
GHA
GIN
MYS
MLI
MEX
PAN
PHL
RWA
TZA
THA
UGAVEN VNM
1.01.52.01
23
4
Hum
an C
apita
l in
Non
−A
gric
ultu
re
1 2 3 4
Human Capital in Agriculture
25 / 37
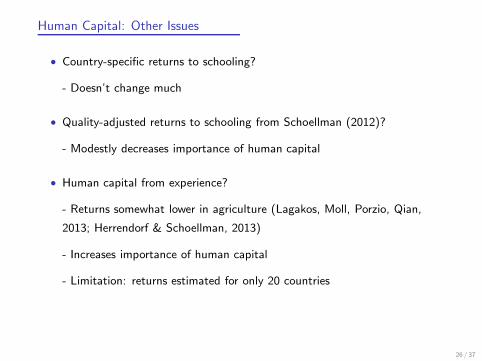
Human Capital: Other Issues
• Country-specific returns to schooling?
- Doesn’t change much
• Quality-adjusted returns to schooling from Schoellman (2012)?
- Modestly decreases importance of human capital
• Human capital from experience?
- Returns somewhat lower in agriculture (Lagakos, Moll, Porzio, Qian,
2013; Herrendorf & Schoellman, 2013)
- Increases importance of human capital
- Limitation: returns estimated for only 20 countries
26 / 37
Adjusting the Raw APG numbers
Recap:
• Differences in hours worked contribute a factor of 1.1.
• Differences in human capital contribute a factor of 1.4.
Now, put them all together and construct “adjusted” APGs.
27 / 37
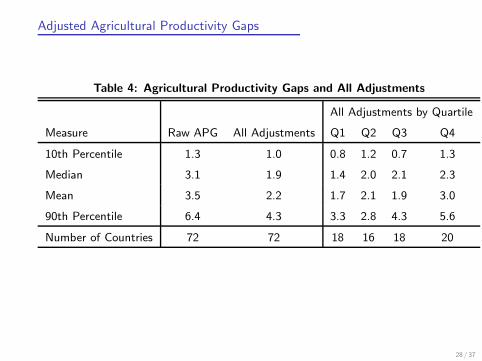
Adjusted Agricultural Productivity Gaps
Table 4: Agricultural Productivity Gaps and All Adjustments
All Adjustments by Quartile
Measure Raw APG All Adjustments Q1 Q2 Q3 Q4
10th Percentile 1.3 1.0 0.8 1.2 0.7 1.3
Median 3.1 1.9 1.4 2.0 2.1 2.3
Mean 3.5 2.2 1.7 2.1 1.9 3.0
90th Percentile 6.4 4.3 3.3 2.8 4.3 5.6
Number of Countries 72 72 18 16 18 20
28 / 37
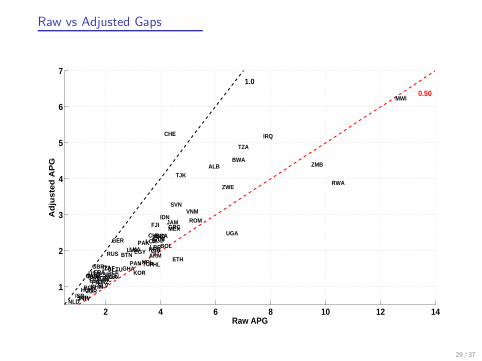
Raw vs Adjusted Gaps
2 4 6 8 10 12 14
1
2
3
4
5
6
7
ALB
ARM
AUS
BGD
BTNBOL
BWA
BRA
BGRKHM
CAN
CHL
CIVEGY
SLVEST
ETH
FJI
FRA
GER
GHA
GRC
GTMHND
HUN
IDN
IRQ
ISR
ITA
JAM
JOR
KEN
KOR
LVA LBR
LTU
MWI
MEX
NPL
NLD
NICNGA
PAK
PAN
PRY
PHL
PRT
ROM
RUS
RWA
LCA
SLE
SVN
ZAFESP
LKA
SWZSWE
CHE
SYR
TJK
TZA
TON
TUR
UGA
GBRUSA VEN
VNM
ZMB
ZWE
Raw APG
Ad
just
ed
AP
G
1.0
0.50
29 / 37

Alternative Measures of Value Added by Sector
30 / 37
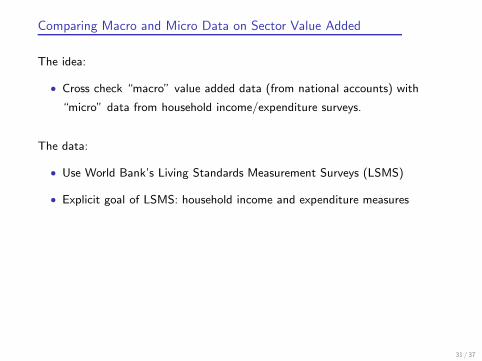
Comparing Macro and Micro Data on Sector Value Added
The idea:
• Cross check “macro” value added data (from national accounts) with
“micro” data from household income/expenditure surveys.
The data:
• Use World Bank’s Living Standards Measurement Surveys (LSMS)
• Explicit goal of LSMS: household income and expenditure measures
31 / 37
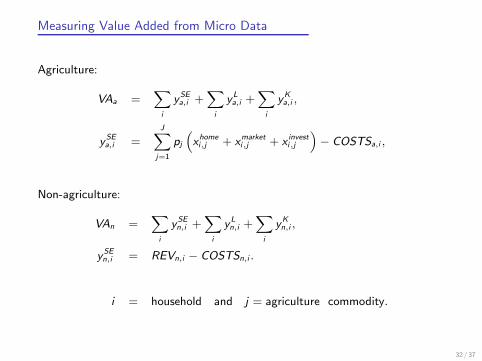
Measuring Value Added from Micro Data
Agriculture:
VAa =∑
i
ySEa,i +
∑
i
yLa,i +
∑
i
yKa,i ,
ySEa,i =
J∑
j=1
pj
(
xhomei,j + x
marketi,j + x
investi,j
)
− COSTSa,i ,
Non-agriculture:
VAn =∑
i
ySEn,i +
∑
i
yLn,i +
∑
i
yKn,i ,
ySEn,i = REVn,i − COSTSn,i .
i = household and j = agriculture commodity.
32 / 37
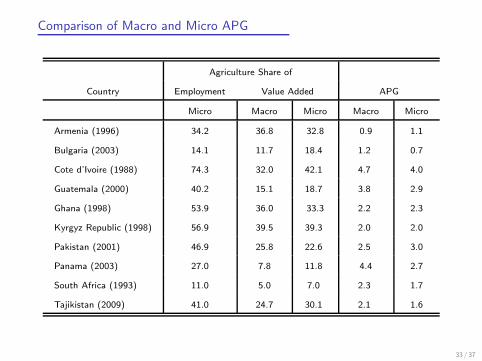
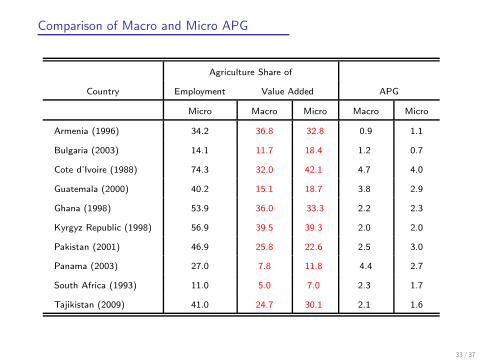
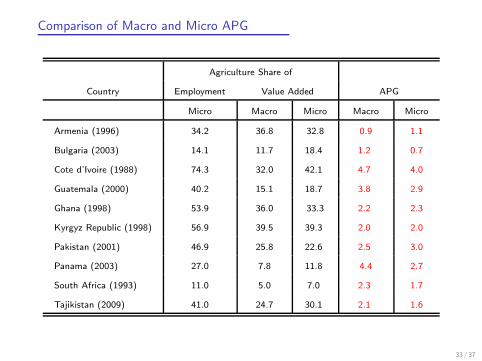
Comparison of Macro and Micro APG
Agriculture Share of
Country Employment Value Added APG
Micro Macro Micro Macro Micro
Armenia (1996) 34.2 36.8 32.8 0.9 1.1
Bulgaria (2003) 14.1 11.7 18.4 1.2 0.7
Cote d’Ivoire (1988) 74.3 32.0 42.1 4.7 4.0
Guatemala (2000) 40.2 15.1 18.7 3.8 2.9
Ghana (1998) 53.9 36.0 33.3 2.2 2.3
Kyrgyz Republic (1998) 56.9 39.5 39.3 2.0 2.0
Pakistan (2001) 46.9 25.8 22.6 2.5 3.0
Panama (2003) 27.0 7.8 11.8 4.4 2.7
South Africa (1993) 11.0 5.0 7.0 2.3 1.7
Tajikistan (2009) 41.0 24.7 30.1 2.1 1.6
33 / 37
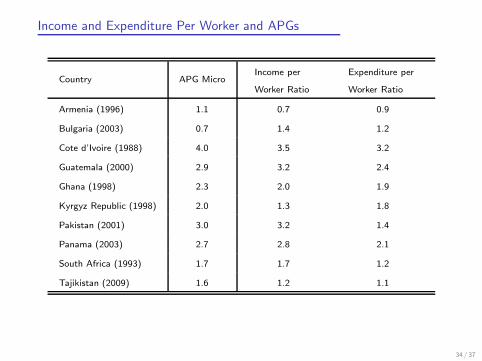
Income and Expenditure Per Worker and APGs
Country APG MicroIncome per
Worker Ratio
Expenditure per
Worker Ratio
Armenia (1996) 1.1 0.7 0.9
Bulgaria (2003) 0.7 1.4 1.2
Cote d’Ivoire (1988) 4.0 3.5 3.2
Guatemala (2000) 2.9 3.2 2.4
Ghana (1998) 2.3 2.0 1.9
Kyrgyz Republic (1998) 2.0 1.3 1.8
Pakistan (2001) 3.0 3.2 1.4
Panama (2003) 2.7 2.8 2.1
South Africa (1993) 1.7 1.7 1.2
Tajikistan (2009) 1.6 1.2 1.1
34 / 37
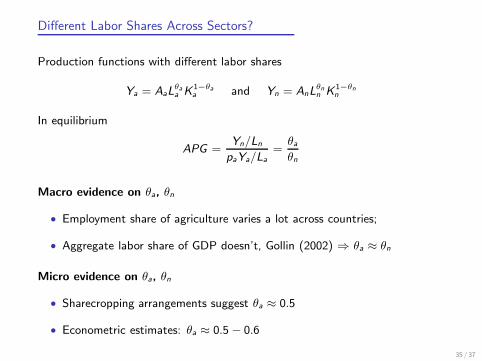
Different Labor Shares Across Sectors?
Production functions with different labor shares
Ya = AaLθaa K
1−θaa and Yn = AnL
θnn K
1−θnn
In equilibrium
APG =Yn/Ln
paYa/La
=θaθn
Macro evidence on θa, θn
• Employment share of agriculture varies a lot across countries;
• Aggregate labor share of GDP doesn’t, Gollin (2002) ⇒ θa ≈ θn
Micro evidence on θa, θn
• Sharecropping arrangements suggest θa ≈ 0.5
• Econometric estimates: θa ≈ 0.5 − 0.6
35 / 37
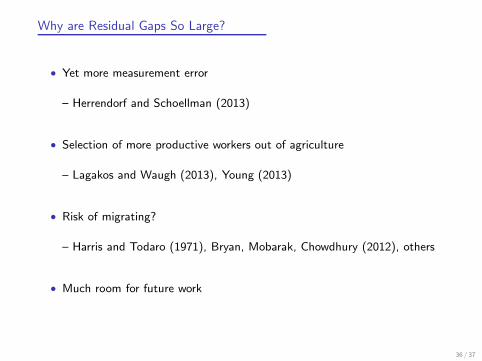
Why are Residual Gaps So Large?
• Yet more measurement error
– Herrendorf and Schoellman (2013)
• Selection of more productive workers out of agriculture
– Lagakos and Waugh (2013), Young (2013)
• Risk of migrating?
– Harris and Todaro (1971), Bryan, Mobarak, Chowdhury (2012), others
• Much room for future work
36 / 37
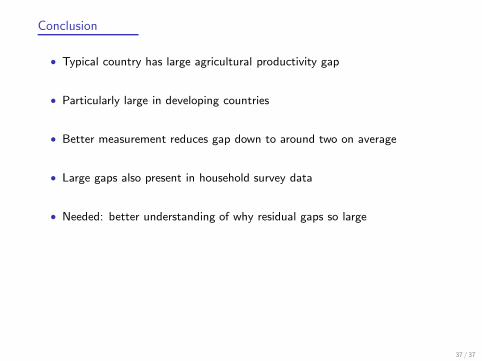
Conclusion
• Typical country has large agricultural productivity gap
• Particularly large in developing countries
• Better measurement reduces gap down to around two on average
• Large gaps also present in household survey data
• Needed: better understanding of why residual gaps so large
37 / 37


![Agricultural Productivity, Comparative Advantage, and ...lib.cufe.edu.cn/upload_files/other/4_20140530024310_[59]matsuyama... · Agricultural Productivity, Comparative Advantage,](https://img.dokumen.tips/doc/110x75/5b1eab367f8b9a22028bd7eb/agricultural-productivity-comparative-advantage-and-libcufeeducnuploadfilesother42014053002431059matsuyama.jpg)