Embed Size (px)
Citation preview
Stabilitas Energy, Inc. | |
Petroleum Highlights: Crude oil and the refined fuel products all closed down today due to a bearish World Bank economic report, a rising U.S. dollar index, and some profit taking due to the 5% gain the past
two days.
Early this morning, news was reported that the World Bank cut its global growth forecast to 2.8% from 3.0% that was estimated in January. The bank forecasts every 6 months the world economic growth.
The euro fell and the U.S. dollar rose today, after the IMF said there still remain major differences with Greece over an agreement to save the country from bankruptcy.
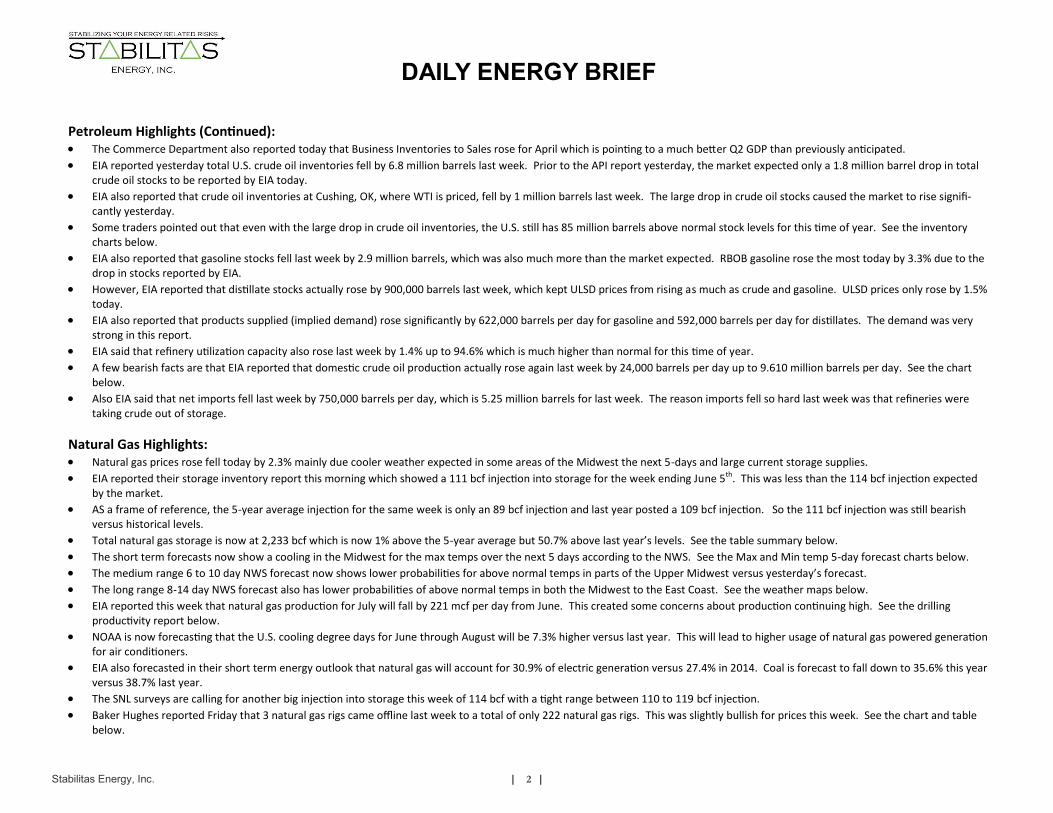
There were also many positive U.S. economic reports published today that helped boost the U.S. dollar index up. The U.S. dollar index rose much higher earlier in the morning but still closed up 0.4% today. See the chart below.
There were also many traders taking profits today after a 5% rise in crude oil over the past 2 days. Some traders focused back on the large over-supply situation of crude oil currently.
The International Energy Agency (IEA) raised its projected global growth for crude oil in 2015 by 280,000 barrels per day to 1.4 million barrels per day. This was bullish for prices and kept the market from falling further today.
Also paring early losses in crude oil prices, the market focused back on the large drop in U.S. crude oil stocks reported by EIA yesterday.
Genscape, a private vendor, reported today that crude oil stocks at Cushing, OK, where WTI is priced fell in the past 4 days by a total of 52,000 barrels.
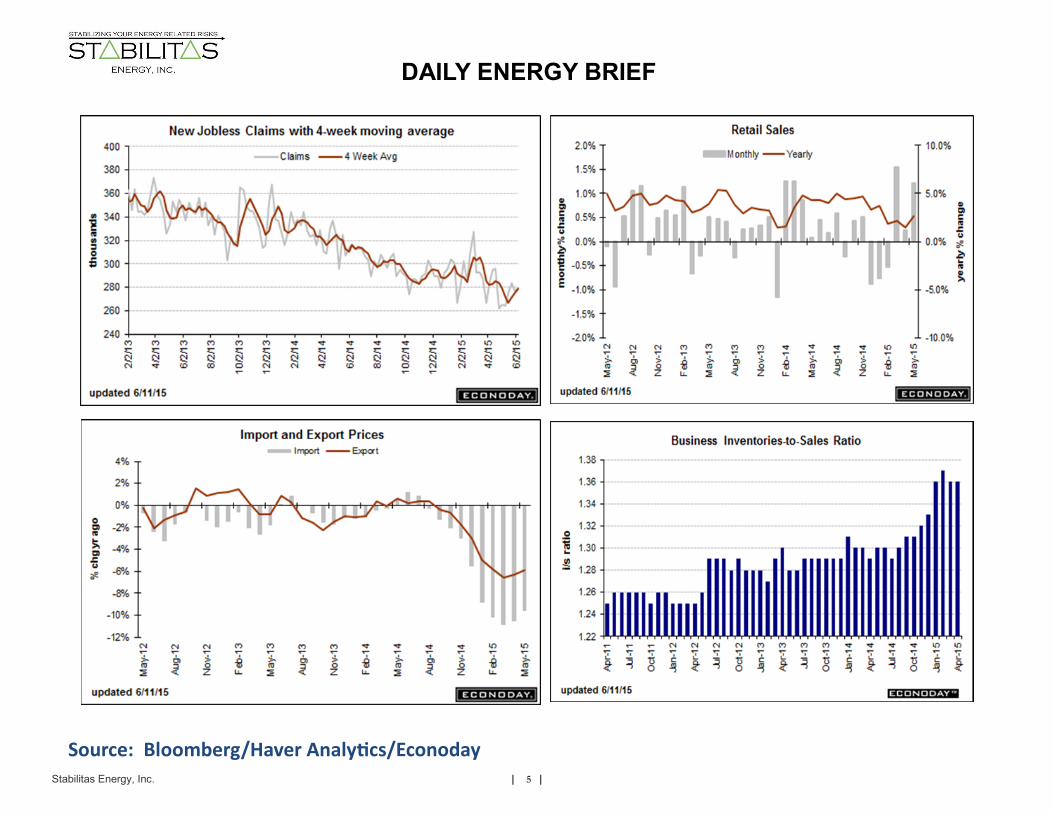
Early this morning, the U.S. Labor Department reported that initial jobless claims rose slightly last week by 3,000 up to 279,000 total claims. However, this is still an extremely low level of claims. See the chart below.
The Department of Labor also reported that Import and Export prices did rise in May which was a positive sign. However, year over year they are still down significantly. See the chart below.
The U.S. Commerce Department reported this morning that retail sales came in better than expected for May. Retail sales rose by 1.2% for May which was much better than 0.2% last month.
DAILY ENERGY BRIEF
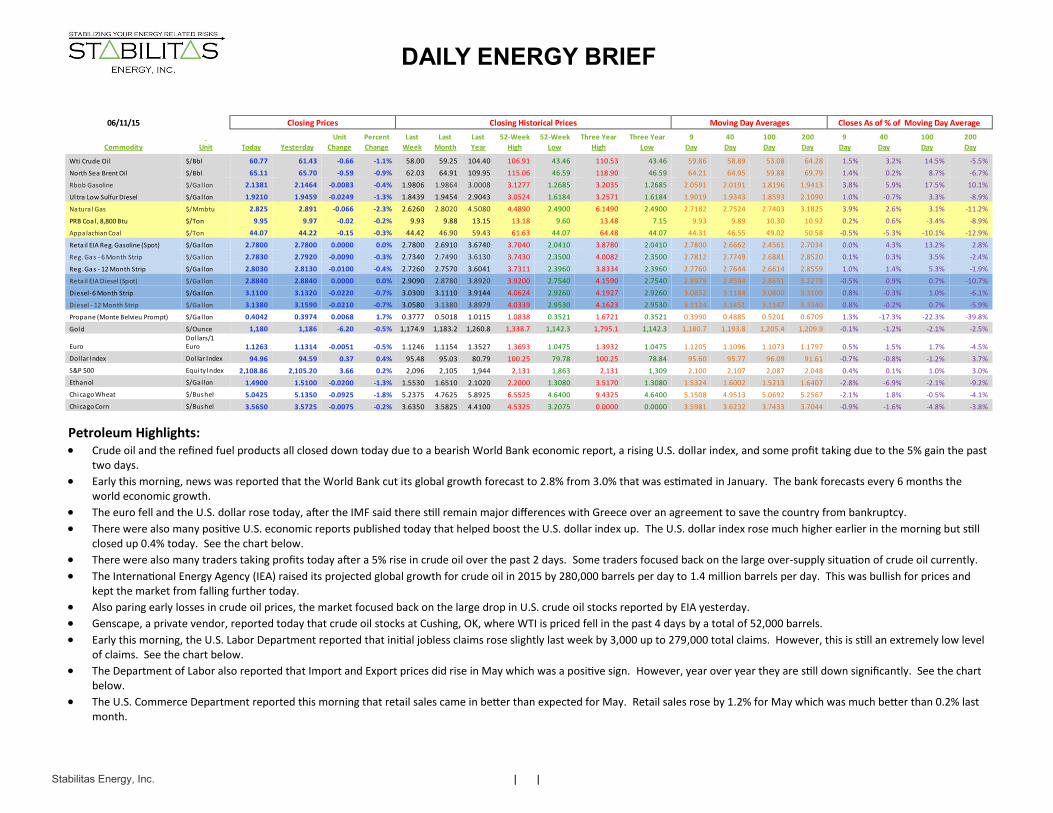
06/11/15 Closing Prices Closing Historical Prices Moving Day Averages Closes As of % of Moving Day Average
Unit Percent Last Last Last 52-Week 52-Week Three Year Three Year 9 40 100 200 9 40 100 200
Commodity Unit Today Yesterday Change Change Week Month Year High Low High Low Day Day Day Day Day Day Day Day
Wti Crude Oi l $/Bbl 60.77 61.43 -0.66 -1.1% 58.00 59.25 104.40 106.91 43.46 110.53 43.46 59.86 58.89 53.08 64.28 1.5% 3.2% 14.5% -5.5%
North Sea Brent Oil $/Bbl 65.11 65.70 -0.59 -0.9% 62.03 64.91 109.95 115.06 46.59 118.90 46.59 64.21 64.95 59.88 69.79 1.4% 0.2% 8.7% -6.7%
Rbob Gasoline $/Gal lon 2.1381 2.1464 -0.0083 -0.4% 1.9806 1.9864 3.0008 3.1277 1.2685 3.2035 1.2685 2.0591 2.0191 1.8196 1.9413 3.8% 5.9% 17.5% 10.1%
Ultra Low Sulfur Diesel $/Gal lon 1.9210 1.9459 -0.0249 -1.3% 1.8439 1.9454 2.9043 3.0524 1.6184 3.2571 1.6184 1.9019 1.9343 1.8593 2.1090 1.0% -0.7% 3.3% -8.9%
Natura l Gas $/Mmbtu 2.825 2.891 -0.066 -2.3% 2.6260 2.8020 4.5080 4.4890 2.4900 6.1490 2.4900 2.7182 2.7524 2.7403 3.1825 3.9% 2.6% 3.1% -11.2%
PRB Coal , 8,800 Btu $/Ton 9.95 9.97 -0.02 -0.2% 9.93 9.88 13.15 13.18 9.60 13.48 7.15 9.93 9.89 10.30 10.92 0.2% 0.6% -3.4% -8.9%
Appalachian Coal $/Ton 44.07 44.22 -0.15 -0.3% 44.42 46.90 59.43 61.63 44.07 64.48 44.07 44.31 46.55 49.02 50.58 -0.5% -5.3% -10.1% -12.9%
Retail EIA Reg. Gasoline (Spot) $/Gal lon 2.7800 2.7800 0.0000 0.0% 2.7800 2.6910 3.6740 3.7040 2.0410 3.8780 2.0410 2.7800 2.6662 2.4561 2.7034 0.0% 4.3% 13.2% 2.8%
Reg. Gas - 6 Month Strip $/Gal lon 2.7830 2.7920 -0.0090 -0.3% 2.7340 2.7490 3.6130 3.7430 2.3500 4.0082 2.3500 2.7812 2.7749 2.6881 2.8520 0.1% 0.3% 3.5% -2.4%
Reg. Gas - 12 Month Strip $/Gal lon 2.8030 2.8130 -0.0100 -0.4% 2.7260 2.7570 3.6041 3.7311 2.3960 3.8334 2.3960 2.7760 2.7644 2.6614 2.8559 1.0% 1.4% 5.3% -1.9%
Retail EIA Diesel (Spot) $/Gal lon 2.8840 2.8840 0.0000 0.0% 2.9090 2.8780 3.8920 3.9200 2.7540 4.1590 2.7540 2.8979 2.8594 2.8651 3.2279 -0.5% 0.9% 0.7% -10.7%
Diesel- 6 Month Strip $/Gal lon 3.1100 3.1320 -0.0220 -0.7% 3.0300 3.1110 3.9144 4.0624 2.9260 4.1927 2.9260 3.0852 3.1184 3.0800 3.3109 0.8% -0.3% 1.0% -6.1%
Diesel - 12 Month Strip $/Gal lon 3.1380 3.1590 -0.0210 -0.7% 3.0580 3.1380 3.8979 4.0339 2.9530 4.1623 2.9530 3.1124 3.1451 3.1147 3.3340 0.8% -0.2% 0.7% -5.9%
Propane (Monte Belvieu Prompt) $/Gal lon 0.4042 0.3974 0.0068 1.7% 0.3777 0.5018 1.0115 1.0838 0.3521 1.6721 0.3521 0.3990 0.4885 0.5201 0.6709 1.3% -17.3% -22.3% -39.8%
Gold $/Ounce 1,180 1,186 -6.20 -0.5% 1,174.9 1,183.2 1,260.8 1,338.7 1,142.3 1,795.1 1,142.3 1,180.7 1,193.8 1,205.4 1,209.9 -0.1% -1.2% -2.1% -2.5%
Euro Dol lars/1 Euro 1.1263 1.1314 -0.0051 -0.5% 1.1246 1.1154 1.3527 1.3693 1.0475 1.3932 1.0475 1.1205 1.1096 1.1073 1.1797 0.5% 1.5% 1.7% -4.5%
Dol lar Index Dol lar Index 94.96 94.59 0.37 0.4% 95.48 95.03 80.79 100.25 79.78 100.25 78.84 95.60 95.77 96.09 91.61 -0.7% -0.8% -1.2% 3.7%
S&P 500 Equity Index 2,108.86 2,105.20 3.66 0.2% 2,096 2,105 1,944 2,131 1,863 2,131 1,309 2,100 2,107 2,087 2,048 0.4% 0.1% 1.0% 3.0%
Ethanol $/Gal lon 1.4900 1.5100 -0.0200 -1.3% 1.5530 1.6510 2.1020 2.2000 1.3080 3.5170 1.3080 1.5324 1.6002 1.5213 1.6407 -2.8% -6.9% -2.1% -9.2%
Chicago Wheat $/Bushel 5.0425 5.1350 -0.0925 -1.8% 5.2375 4.7625 5.8925 6.5525 4.6400 9.4325 4.6400 5.1508 4.9513 5.0692 5.2567 -2.1% 1.8% -0.5% -4.1%
Chicago Corn $/Bushel 3.5650 3.5725 -0.0075 -0.2% 3.6350 3.5825 4.4100 4.5325 3.2075 0.0000 0.0000 3.5981 3.6232 3.7433 3.7044 -0.9% -1.6% -4.8% -3.8%
Stabilitas Energy, Inc. | 2 |
DAILY ENERGY BRIEF Petroleum Highlights (Continued): The Commerce Department also reported today that Business Inventories to Sales rose for April which is pointing to a much better Q2 GDP than previously anticipated.
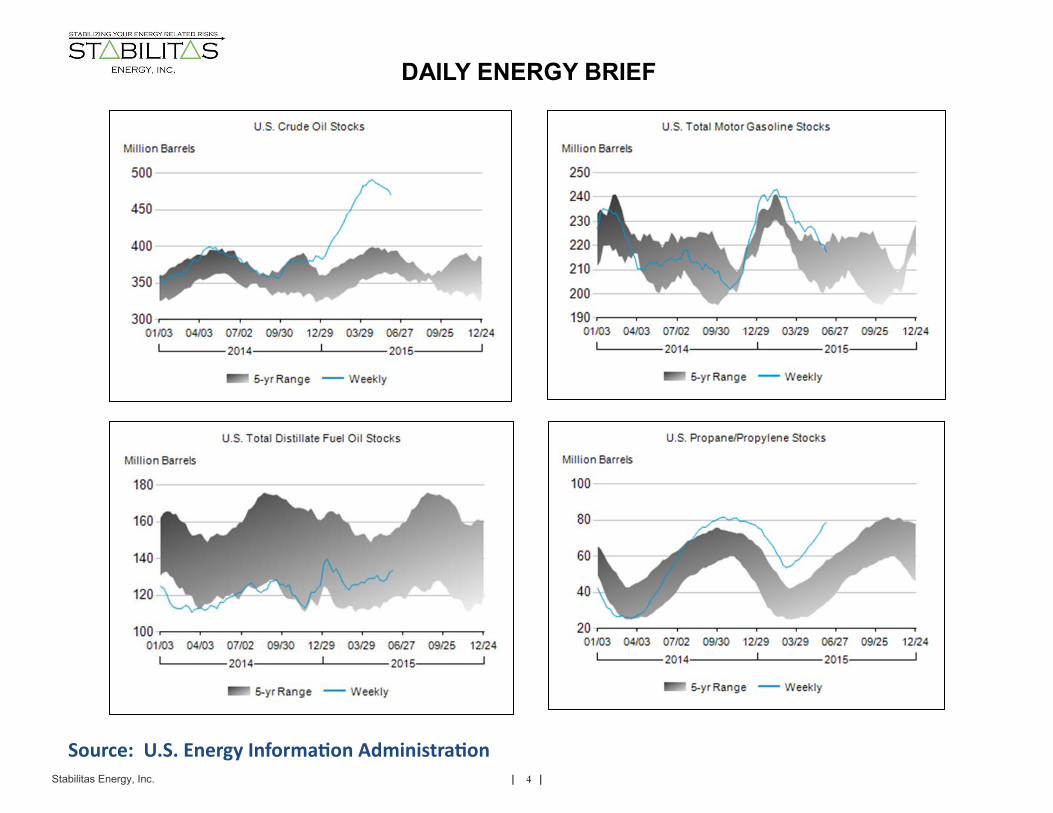
EIA reported yesterday total U.S. crude oil inventories fell by 6.8 million barrels last week. Prior to the API report yesterday, the market expected only a 1.8 million barrel drop in total crude oil stocks to be reported by EIA today.
EIA also reported that crude oil inventories at Cushing, OK, where WTI is priced, fell by 1 million barrels last week. The large drop in crude oil stocks caused the market to rise signifi-cantly yesterday.
Some traders pointed out that even with the large drop in crude oil inventories, the U.S. still has 85 million barrels above normal stock levels for this time of year. See the inventory charts below.
EIA also reported that gasoline stocks fell last week by 2.9 million barrels, which was also much more than the market expected. RBOB gasoline rose the most today by 3.3% due to the drop in stocks reported by EIA.
However, EIA reported that distillate stocks actually rose by 900,000 barrels last week, which kept ULSD prices from rising as much as crude and gasoline. ULSD prices only rose by 1.5% today.
EIA also reported that products supplied (implied demand) rose significantly by 622,000 barrels per day for gasoline and 592,000 barrels per day for distillates. The demand was very strong in this report.
EIA said that refinery utilization capacity also rose last week by 1.4% up to 94.6% which is much higher than normal for this time of year.
A few bearish facts are that EIA reported that domestic crude oil production actually rose again last week by 24,000 barrels per day up to 9.610 million barrels per day. See the chart below.
Also EIA said that net imports fell last week by 750,000 barrels per day, which is 5.25 million barrels for last week. The reason imports fell so hard last week was that refineries were taking crude out of storage.
Natural Gas Highlights: Natural gas prices rose fell today by 2.3% mainly due cooler weather expected in some areas of the Midwest the next 5-days and large current storage supplies.
EIA reported their storage inventory report this morning which showed a 111 bcf injection into storage for the week ending June 5th. This was less than the 114 bcf injection expected by the market.
AS a frame of reference, the 5-year average injection for the same week is only an 89 bcf injection and last year posted a 109 bcf injection. So the 111 bcf injection was still bearish versus historical levels.
Total natural gas storage is now at 2,233 bcf which is now 1% above the 5-year average but 50.7% above last year’s levels. See the table summary below.
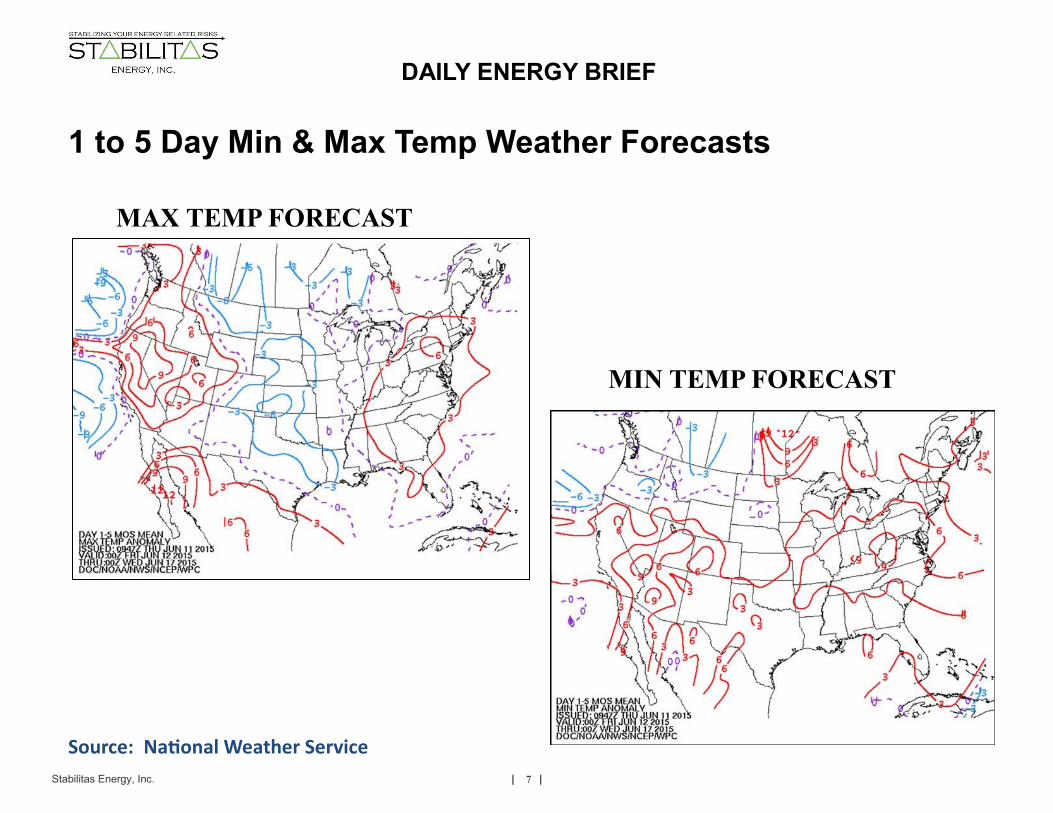
The short term forecasts now show a cooling in the Midwest for the max temps over the next 5 days according to the NWS. See the Max and Min temp 5-day forecast charts below.
The medium range 6 to 10 day NWS forecast now shows lower probabilities for above normal temps in parts of the Upper Midwest versus yesterday’s forecast.
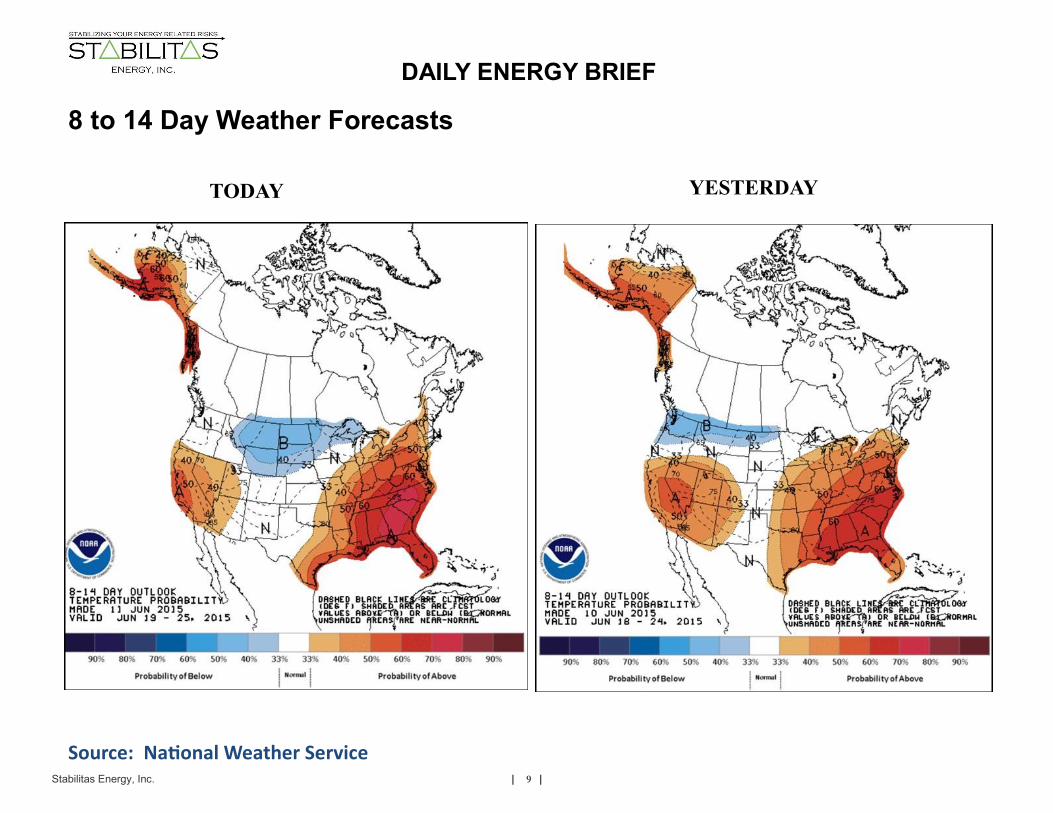
The long range 8-14 day NWS forecast also has lower probabilities of above normal temps in both the Midwest to the East Coast. See the weather maps below.
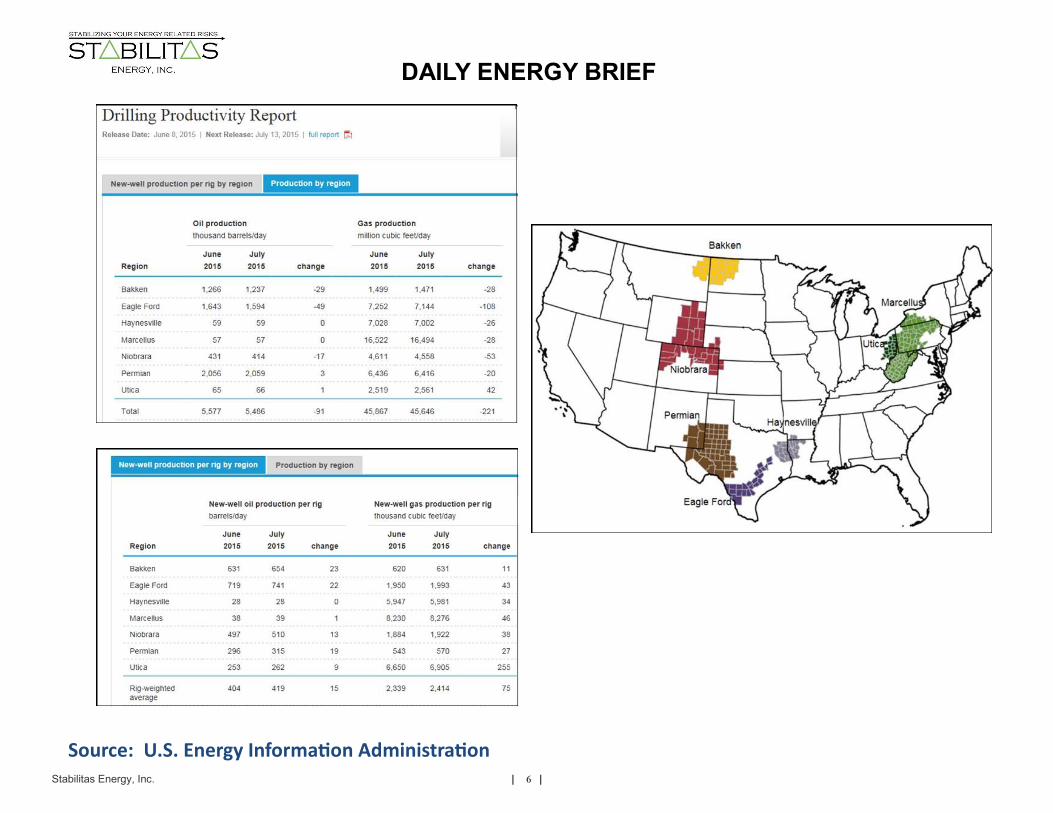
EIA reported this week that natural gas production for July will fall by 221 mcf per day from June. This created some concerns about production continuing high. See the drilling productivity report below.
NOAA is now forecasting that the U.S. cooling degree days for June through August will be 7.3% higher versus last year. This will lead to higher usage of natural gas powered generation for air conditioners.
EIA also forecasted in their short term energy outlook that natural gas will account for 30.9% of electric generation versus 27.4% in 2014. Coal is forecast to fall down to 35.6% this year versus 38.7% last year.
The SNL surveys are calling for another big injection into storage this week of 114 bcf with a tight range between 110 to 119 bcf injection.
Baker Hughes reported Friday that 3 natural gas rigs came offline last week to a total of only 222 natural gas rigs. This was slightly bullish for prices this week. See the chart and table below.
Stabilitas Energy, Inc. | 3 |
DAILY ENERGY BRIEF
Source: U.S. Energy Information Administration
Stabilitas Energy, Inc. | 4 |
DAILY ENERGY BRIEF
Source: U.S. Energy Information Administration
Stabilitas Energy, Inc. | 5 |
DAILY ENERGY BRIEF
Source: Bloomberg/Haver Analytics/Econoday
Stabilitas Energy, Inc. | 6 |
DAILY ENERGY BRIEF
Source: U.S. Energy Information Administration
Stabilitas Energy, Inc. | 7 |
DAILY ENERGY BRIEF
1 to 5 Day Min & Max Temp Weather Forecasts
MAX TEMP FORECAST
Source: National Weather Service
MIN TEMP FORECAST

Stabilitas Energy, Inc. | 8 |
DAILY ENERGY BRIEF
6 to 10 Day Weather Forecasts
Source: National Weather Service
YESTERDAY TODAY
Stabilitas Energy, Inc. | 9 |
DAILY ENERGY BRIEF
8 to 14 Day Weather Forecasts
Source: National Weather Service
YESTERDAY TODAY