Embed Size (px)
Citation preview
Welcome to AP Biology
Course Description This course is designed to offer students a solid foundation in introductory college-level
biology. The process of inquiry in science and developing critical thinking skills is the most important part of this laboratory intensive course. Throughout the year students will develop an appreciation for the study of life and understand the unifying principles within a diversified biological world which includes the following:
1. The process of evolution drives the diversity and unity of life. 2. Biological systems utilize free energy and molecular building block to grow, to
reproduce and to maintain dynamic homeostasis. 3. Living systems store, retrieve, transmit and respond to information essential to
life processes. 4. Biological systems interact, and these systems and their interactions possess
complex properties. Why are you taking AP Biology? Student’s reasons for enrolling in AP Biology vary. It is important that each student realizes why he or she is in the course and what they hope to gain from it. My role as your instructor is to help each of you reach your goal, but most importantly, my goal is to prepare you for the AP Exam. Below are some reasons why students take this course.
• Deepen content knowledge and skills • Prepare for the rigors of college courses • Whet your appetite to majors in biological sciences • Build confidence in college potential • Help reduce the cost of college through earned credits
Summer Assignment
I’ve prepared a summer assignment to give you a quick review of some basic scientific skills. AP coursework is rigorous and requires will require to go above and beyond the expectations of regular or honors science classroom. This summer work will help to provide you with the skills needed to be successful in the first weeks of class. This assignment is due by the first day of class, you may email it to me or turn in a hard copy. Suggested summer reading – this is not part of the summer assignment, but I highly encourage you to pick one and enjoy. “Your Inner Fish” by Neil Shubin
“Serengeti Rules: The Quest to Discover How Life Works and Why It Matters” by Sean B. Carroll
“I Contain Multitudes: The Microbes Within Us and a Grander View of Life” by Ed Yong “The Double Helix: A Personal Account of the Discovery of the Structure of DNA”
By James Watson “Lab Girl” by Hope Jahren

“The Immortal Life of Henrietta Lacks” by Rebecca Skloot Contact Information
If you have any questions please feel free to contact me. I am available during the
summer if students need assistance. Please email me at [email protected]
I look forward to a fun and educational year. Darren Meyers Joliet Central High School AP Biology & Chemistry Instructor Room 387
AP BIOLOGY SUMMER ASSIGNMENT 2018
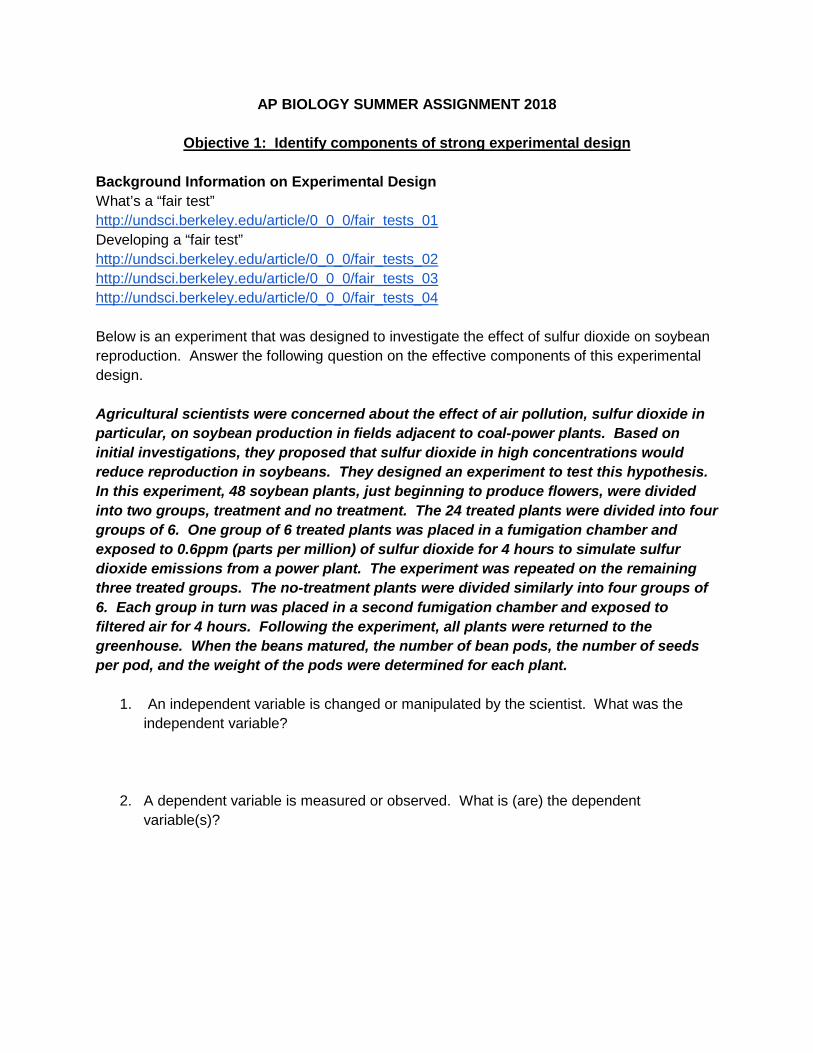
Objective 1: Identify components of strong experimental design Background Information on Experimental Design What’s a “fair test” http://undsci.berkeley.edu/article/0_0_0/fair_tests_01 Developing a “fair test” http://undsci.berkeley.edu/article/0_0_0/fair_tests_02 http://undsci.berkeley.edu/article/0_0_0/fair_tests_03 http://undsci.berkeley.edu/article/0_0_0/fair_tests_04 Below is an experiment that was designed to investigate the effect of sulfur dioxide on soybean reproduction. Answer the following question on the effective components of this experimental design. Agricultural scientists were concerned about the effect of air pollution, sulfur dioxide in particular, on soybean production in fields adjacent to coal-power plants. Based on initial investigations, they proposed that sulfur dioxide in high concentrations would reduce reproduction in soybeans. They designed an experiment to test this hypothesis. In this experiment, 48 soybean plants, just beginning to produce flowers, were divided into two groups, treatment and no treatment. The 24 treated plants were divided into four groups of 6. One group of 6 treated plants was placed in a fumigation chamber and exposed to 0.6ppm (parts per million) of sulfur dioxide for 4 hours to simulate sulfur dioxide emissions from a power plant. The experiment was repeated on the remaining three treated groups. The no-treatment plants were divided similarly into four groups of 6. Each group in turn was placed in a second fumigation chamber and exposed to filtered air for 4 hours. Following the experiment, all plants were returned to the greenhouse. When the beans matured, the number of bean pods, the number of seeds per pod, and the weight of the pods were determined for each plant.
1. An independent variable is changed or manipulated by the scientist. What was the independent variable?
2. A dependent variable is measured or observed. What is (are) the dependent variable(s)?
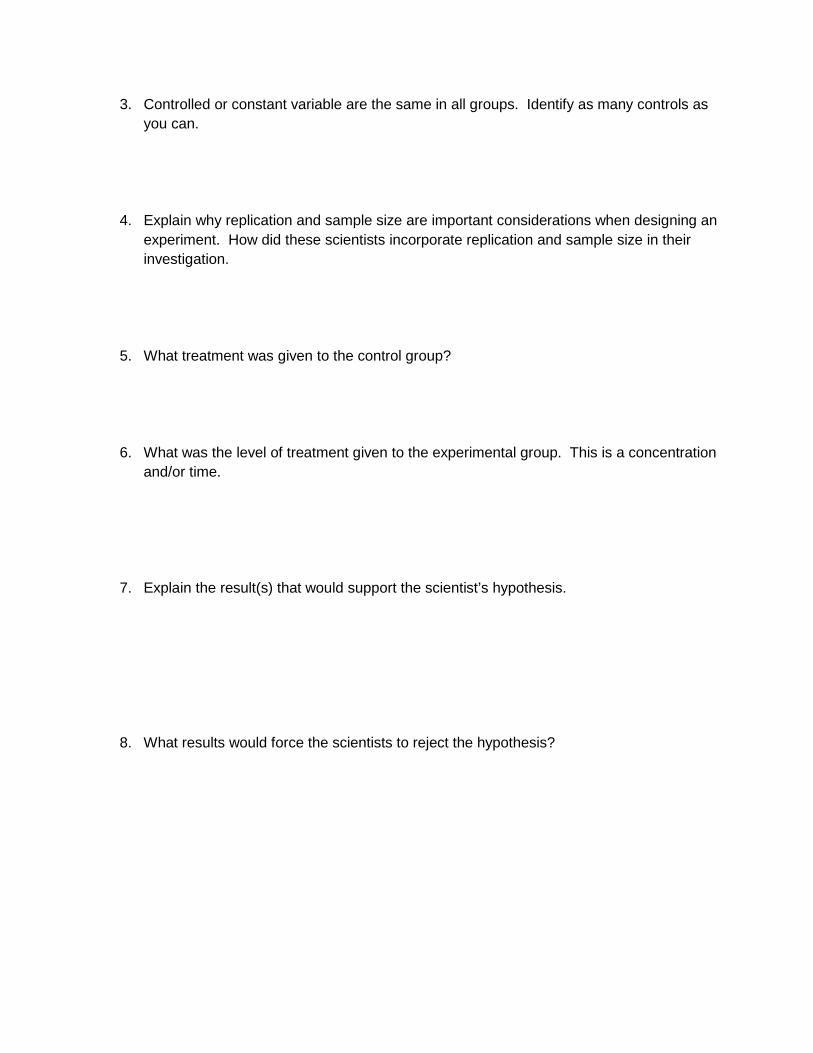
3. Controlled or constant variable are the same in all groups. Identify as many controls as you can.
4. Explain why replication and sample size are important considerations when designing an experiment. How did these scientists incorporate replication and sample size in their investigation.
5. What treatment was given to the control group?
6. What was the level of treatment given to the experimental group. This is a concentration and/or time.
7. Explain the result(s) that would support the scientist’s hypothesis.
8. What results would force the scientists to reject the hypothesis?

Objective 2: Create an experiment to investigate a scientific question The active ingredients in many pesticides are chemical compounds that kills organisms such as insects, molds, and weeds. Opponents of pesticides use claim that pesticides degrade water and soil quality. Design a laboratory experiment to determine whether or not a new pesticide (product X) is toxic to minnows, a type of small fish. 9. State the hypothesis. 10. Describe the method you would use to test your hypothesis. 11. Identify the control. 12. Identify the dependent variable(s). 13. Describe experimental results that would lead you to reject your hypothesis. (Be specific)

Objective 3a: Create Effective Visuals; Choosing an appropriate graph There are several types of graphs that scientists often use to display data. They include:
Pie Graphs Bar Graphs Histograms Line Graphs Scatter Plots
- Dependent variable is NOT continuous. -Usually presents data as a “part of a whole” or as percentages.
-Dependent variable is NOT continuous. -There is no order to the categories on the X-axis. -Bars typically don’t touch. -Y-axis is usually a percentage or frequency (count)
-A specific type of bar graph. -Dependent variable must have a natural order that can be grouped into defined “chunks”.
-Dependent variable IS continuous. -Points are plotted using x and y components. -The points are connected because the observations are NOT independent.
-Dependent variable IS continuous. -Points are plotted using x and y components. -The points are NOT connected because the observations are independent. -Uses a best-fit line or curve to show relationship.
Identify the best type of graph to represent each type of data set.
# Description Pie Bar Histo Line Scatter
Ex A graph showing the number of 5th graders who prefer Coke or Pepsi
X
14 a newborn baby’s weight changes over time
15 percentage of the class earning As, Bs, and Cs.
16 distribution of trees of different size groups (e.g. 0-10 cm, 10-20 cm, etc…) in a forest
17 relationship between height and arm length in a group
18 percentage of an allowance spent on different categories (e.g. food, movies, etc)
19 amount of rainfall, by month over a 12 month period
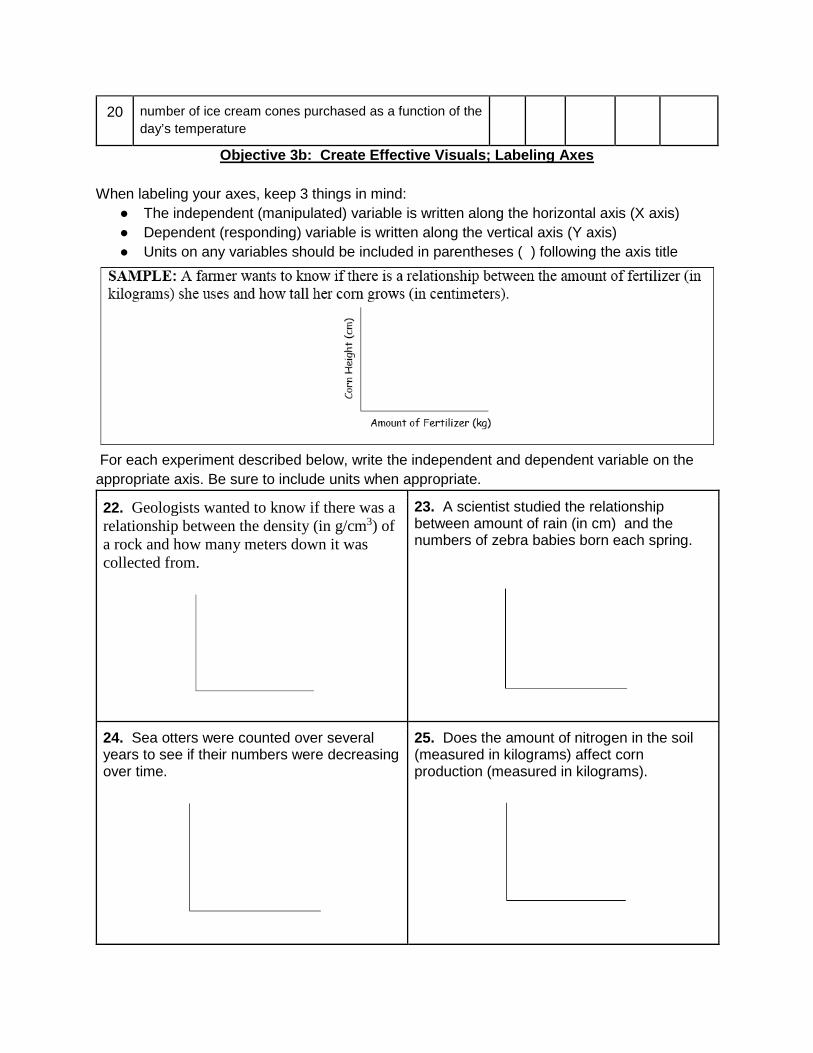
20 number of ice cream cones purchased as a function of the day’s temperature
Objective 3b: Create Effective Visuals; Labeling Axes
When labeling your axes, keep 3 things in mind: ● The independent (manipulated) variable is written along the horizontal axis (X axis) ● Dependent (responding) variable is written along the vertical axis (Y axis) ● Units on any variables should be included in parentheses ( ) following the axis title
For each experiment described below, write the independent and dependent variable on the appropriate axis. Be sure to include units when appropriate.
22. Geologists wanted to know if there was a relationship between the density (in g/cm3) of a rock and how many meters down it was collected from.
23. A scientist studied the relationship between amount of rain (in cm) and the numbers of zebra babies born each spring.
24. Sea otters were counted over several years to see if their numbers were decreasing over time.
25. Does the amount of nitrogen in the soil (measured in kilograms) affect corn production (measured in kilograms).
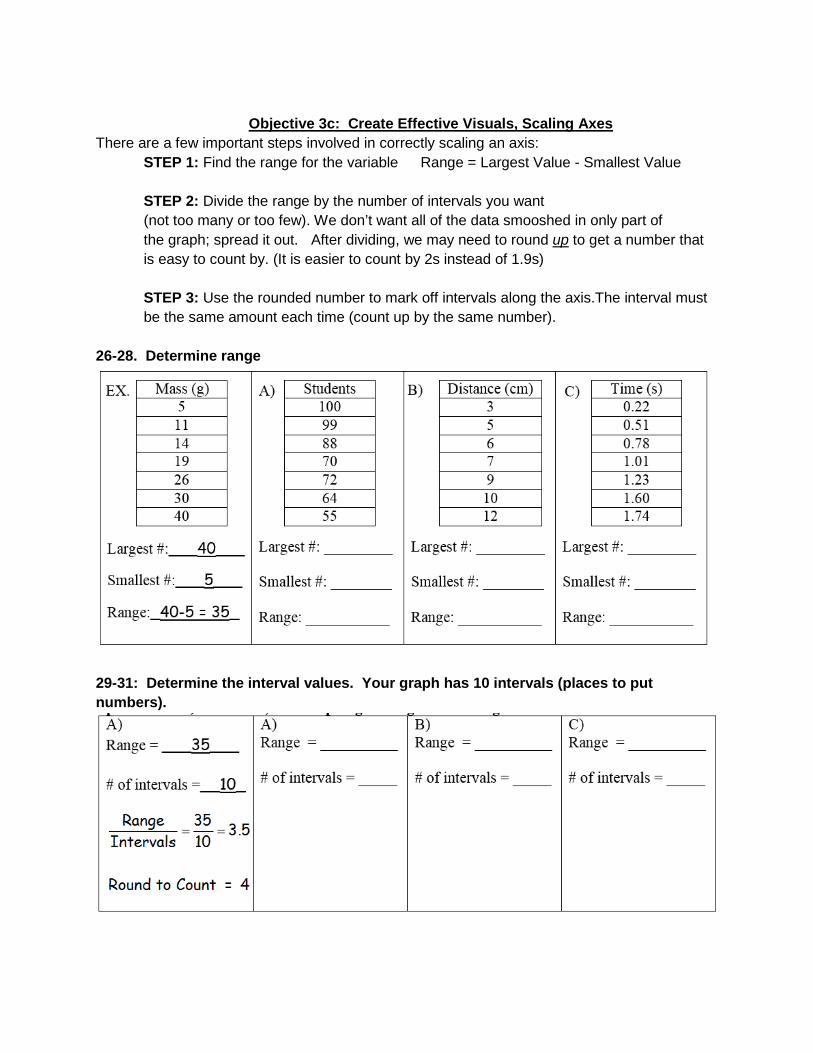
Objective 3c: Create Effective Visuals, Scaling Axes
There are a few important steps involved in correctly scaling an axis: STEP 1: Find the range for the variable Range = Largest Value - Smallest Value STEP 2: Divide the range by the number of intervals you want (not too many or too few). We don’t want all of the data smooshed in only part of the graph; spread it out. After dividing, we may need to round up to get a number that is easy to count by. (It is easier to count by 2s instead of 1.9s) STEP 3: Use the rounded number to mark off intervals along the axis.The interval must be the same amount each time (count up by the same number).
26-28. Determine range
29-31: Determine the interval values. Your graph has 10 intervals (places to put numbers).
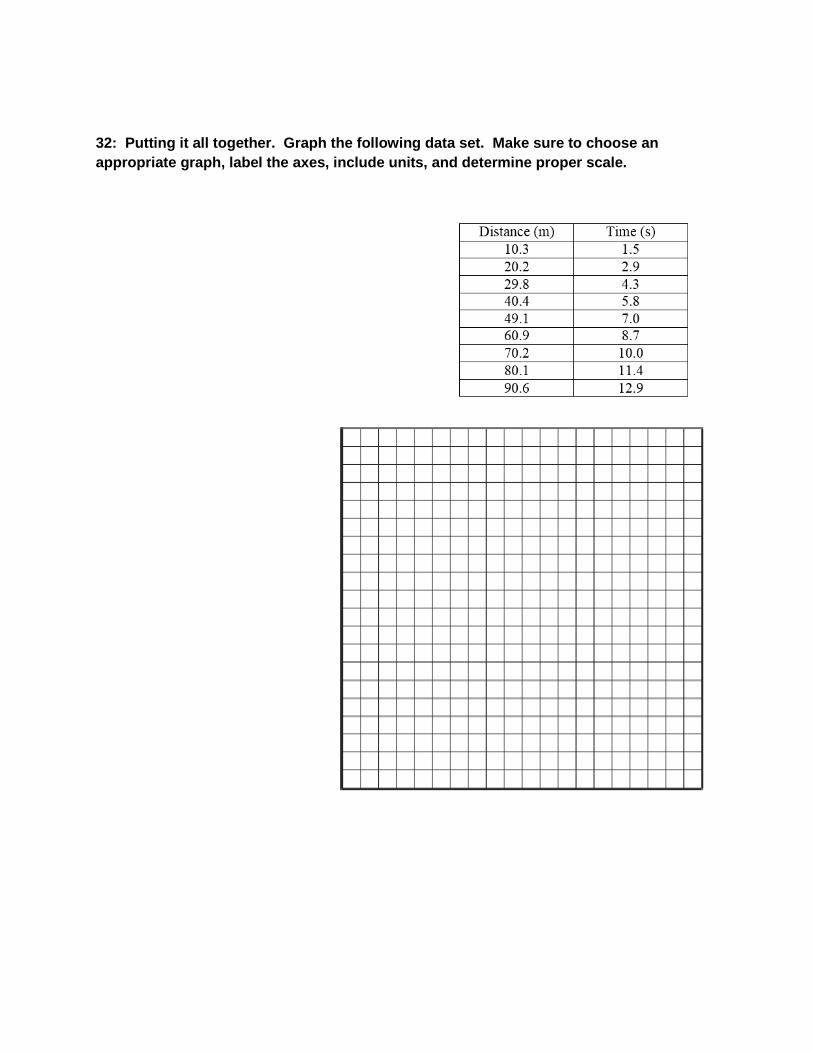
32: Putting it all together. Graph the following data set. Make sure to choose an appropriate graph, label the axes, include units, and determine proper scale.
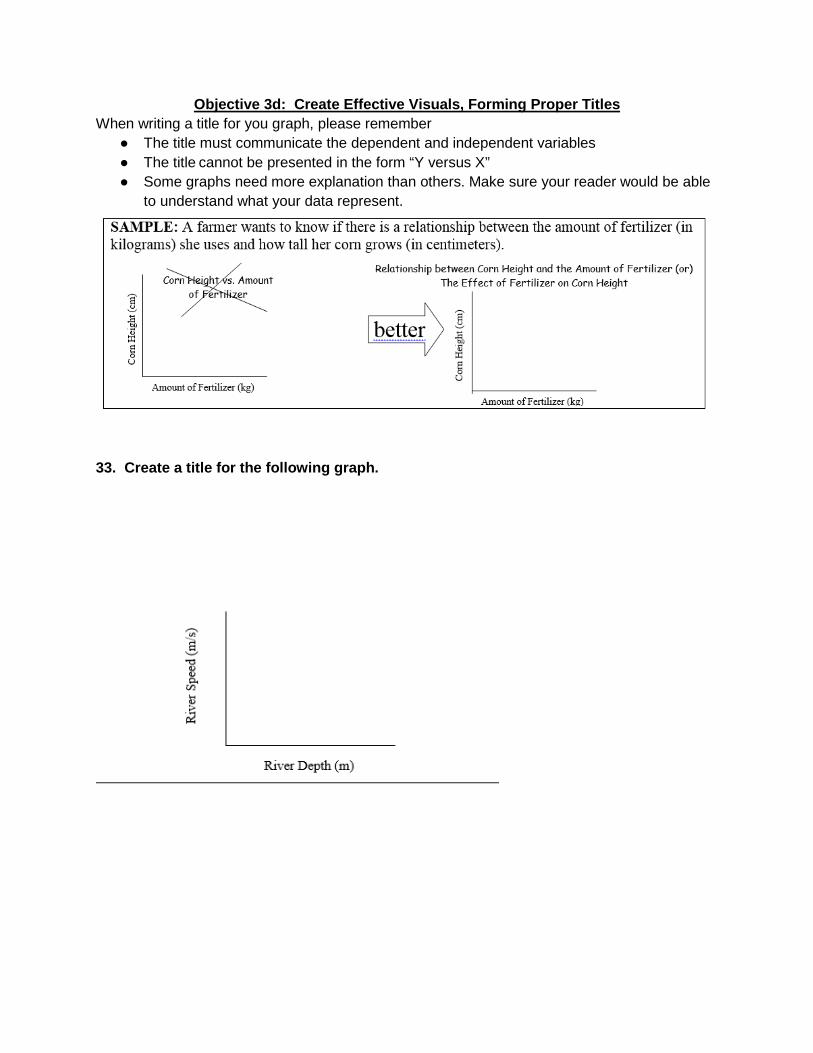
Objective 3d: Create Effective Visuals, Forming Proper Titles When writing a title for you graph, please remember
● The title must communicate the dependent and independent variables ● The title cannot be presented in the form “Y versus X” ● Some graphs need more explanation than others. Make sure your reader would be able
to understand what your data represent.
33. Create a title for the following graph.
Objective 4a: Understand the Mechanism of Natural Selection, Dispelling Misconceptions
Click through the Recipe for Evoluton: http://learn.genetics.utah.edu/content/selection/recipe/ Click through Things You May Not Know About Evolution http://learn.genetics.utah.edu/content/selection/misconceptions/ All of the following statements are FALSE. Explain why. 34. Evolution is a theory about the origin of life. 35. Evolution is like a climb up a ladder of progress; organisms are always getting better. 36. Natural selection happens randomly or “by chance”. 37. Natural selection involves individual organisms trying to adapt to a changing environment. 38. Natural selection creates perfect organisms. 39. Evolution is “just” a theory. If enough evidence is gathered it could become a law.
Objective 4b: Understand the Mechanism of Natural Selection, Evidence of Evolution Instructions:
1. Watch this short 10 minute video from the Howard Hughes Medical Institute, The Making of Fittest, Natural Selection, and Adaptation http://www.hhmi.org/biointeractive/making-fittest-natural-selection-and-adaptation
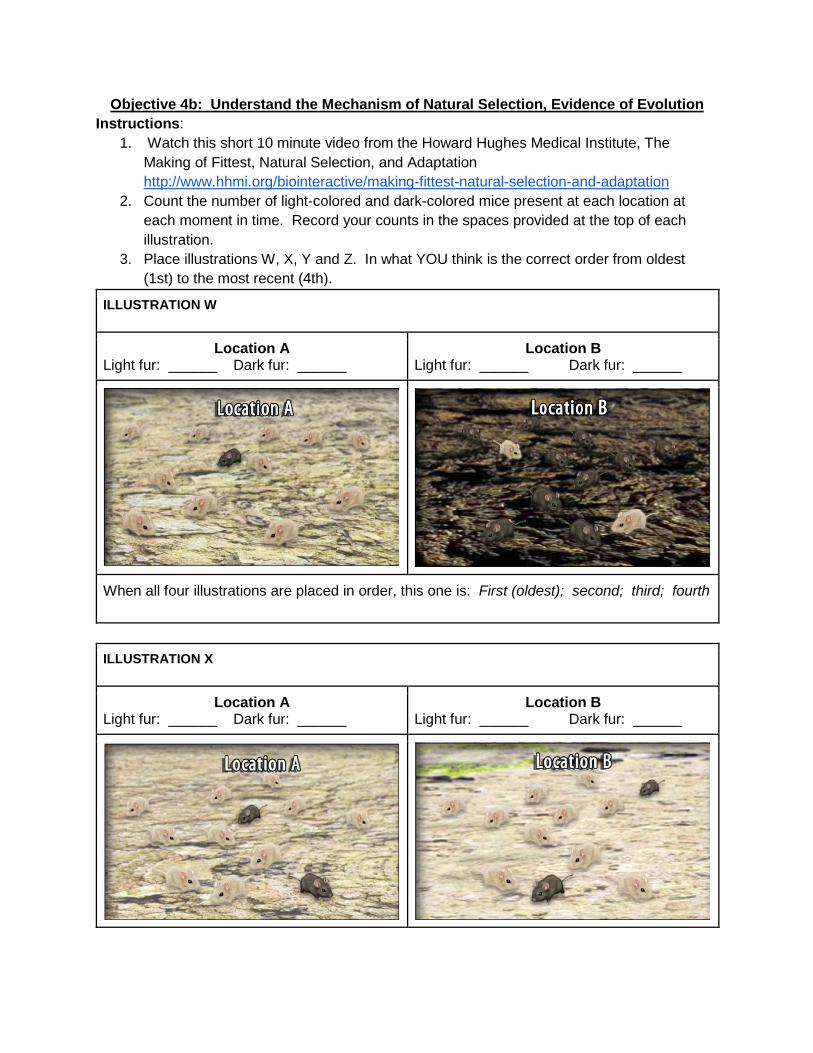
2. Count the number of light-colored and dark-colored mice present at each location at each moment in time. Record your counts in the spaces provided at the top of each illustration.
3. Place illustrations W, X, Y and Z. In what YOU think is the correct order from oldest (1st) to the most recent (4th).
ILLUSTRATION W
Location A Light fur: ______ Dark fur: ______
Location B Light fur: ______ Dark fur: ______
When all four illustrations are placed in order, this one is: First (oldest); second; third; fourth
ILLUSTRATION X
Location A Light fur: ______ Dark fur: ______
Location B Light fur: ______ Dark fur: ______
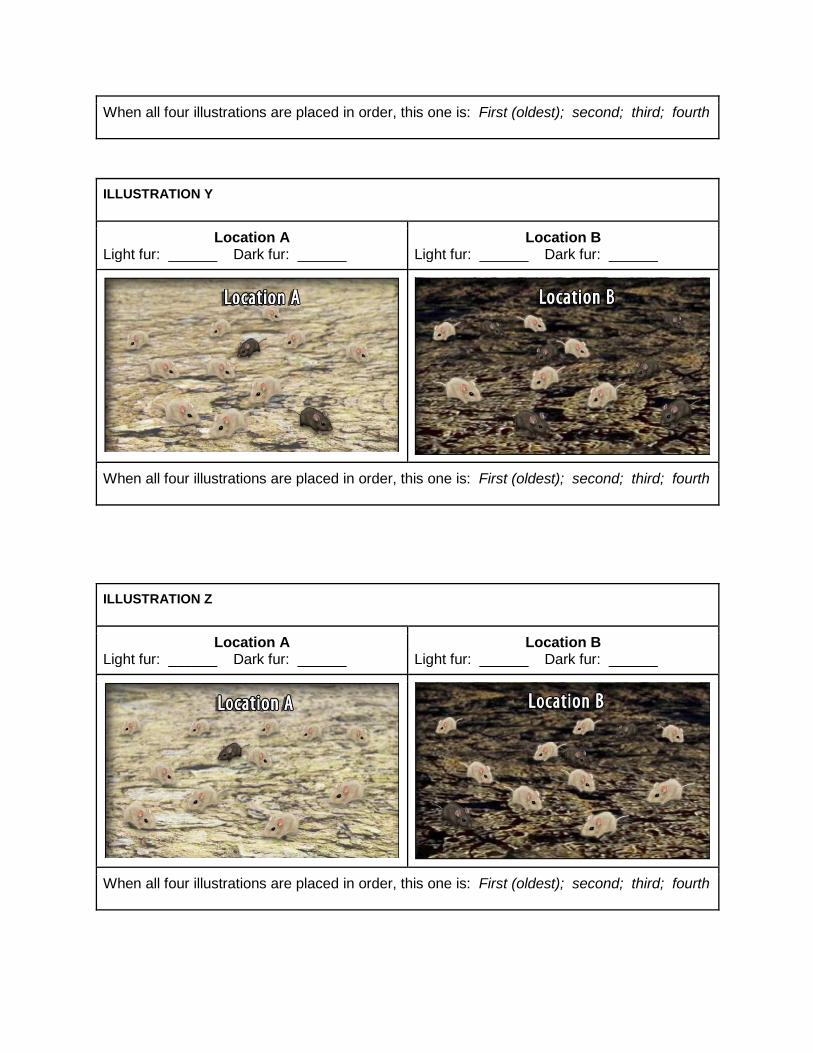
When all four illustrations are placed in order, this one is: First (oldest); second; third; fourth
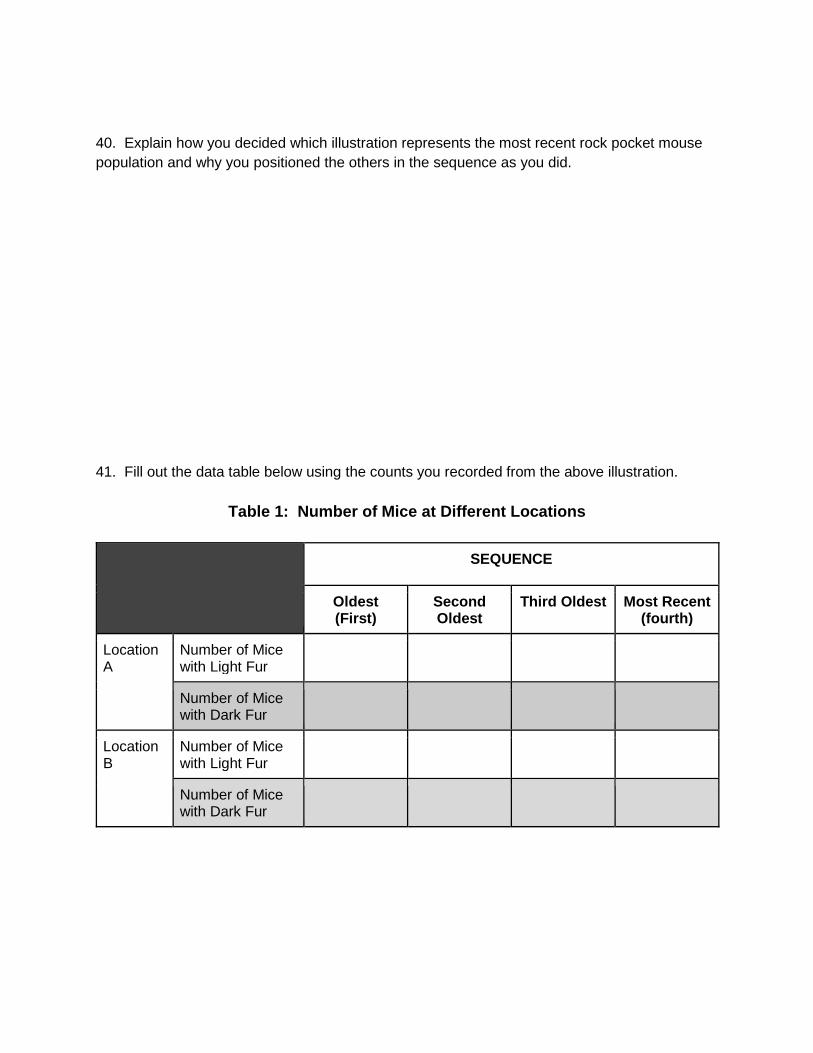
ILLUSTRATION Y
Location A Light fur: ______ Dark fur: ______
Location B Light fur: ______ Dark fur: ______
When all four illustrations are placed in order, this one is: First (oldest); second; third; fourth
ILLUSTRATION Z
Location A Light fur: ______ Dark fur: ______
Location B Light fur: ______ Dark fur: ______
When all four illustrations are placed in order, this one is: First (oldest); second; third; fourth
40. Explain how you decided which illustration represents the most recent rock pocket mouse population and why you positioned the others in the sequence as you did. 41. Fill out the data table below using the counts you recorded from the above illustration.
Table 1: Number of Mice at Different Locations
SEQUENCE
Oldest (First)
Second Oldest
Third Oldest Most Recent (fourth)
Location A
Number of Mice with Light Fur
Number of Mice with Dark Fur
Location B
Number of Mice with Light Fur
Number of Mice with Dark Fur

42. Create two graphs based on the data that shows the distribution of mice at locations A and B through time. Include the results for location A on the first graph. The second graph should include the data from location B.
Objective 5: Use Statistics to Analyze Data Sets Bozeman Video Standard Deviation https://youtu.be/09kiX3p5Vek Bozeman Video Standard Error https://youtu.be/BwYj69LAQOI Seeds of many weed species germinate best in recently disturbed soil that lacks a light-blocking canopy of vegetation. Students in a biology class hypothesized that weed seeds germinate best when exposed to light. To test this hypothesis, the students placed a seed from crofton weed , Ageratina adenophora, in each of 20 petri dishes and covered the seeds with distilled water. They placed half the petri dishes in light and half in the dark. After one week, the students measured the lengths of the crofton weed seedlings in each dish. The table below shows their data.
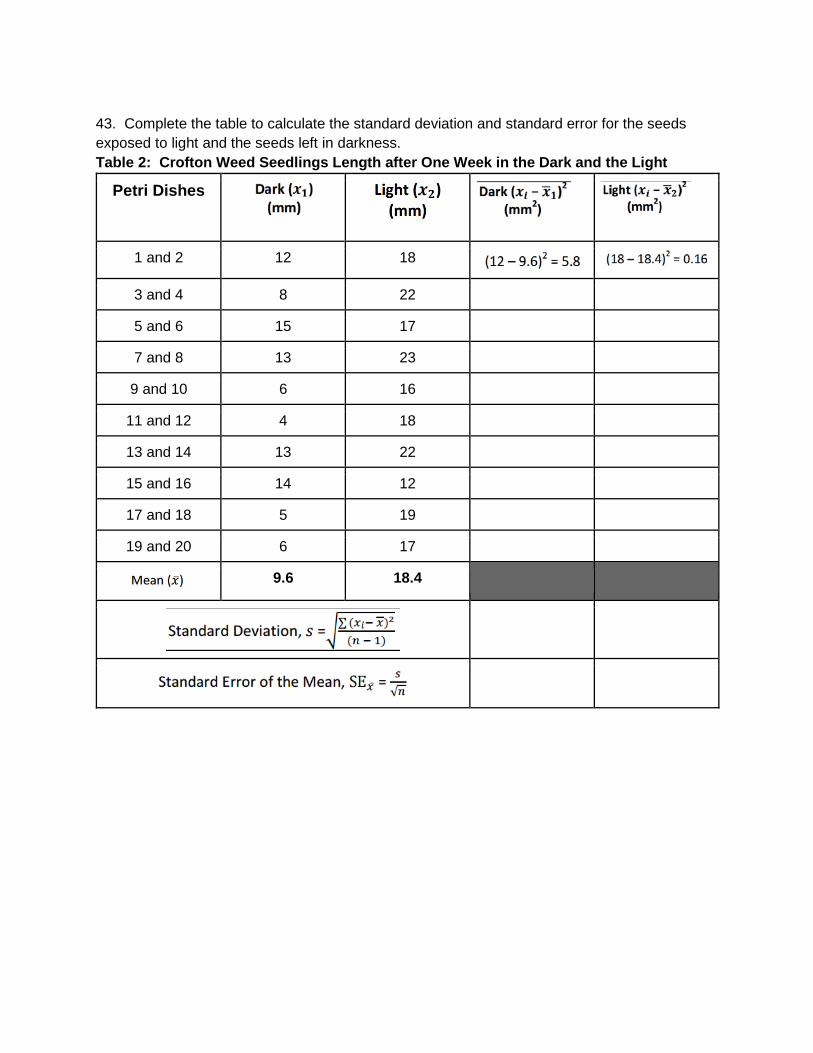
43. Complete the table to calculate the standard deviation and standard error for the seeds exposed to light and the seeds left in darkness. Table 2: Crofton Weed Seedlings Length after One Week in the Dark and the Light
Petri Dishes
1 and 2 12 18
3 and 4 8 22
5 and 6 15 17
7 and 8 13 23
9 and 10 6 16
11 and 12 4 18
13 and 14 13 22
15 and 16 14 12
17 and 18 5 19
19 and 20 6 17
9.6 18.4
44. Create a bar graph of the mean length of crofton seedlings exposed to dark and light. Show the standard error of the mean using error bars.


