Embed Size (px)
Citation preview
NAME
DATE
©2011 Carolina Biological Supply Company/Printed in USA. S-1
Population Genetics and Evolution Kit for AP Biology
Student Guide
Africa’s Lake Victoria formed around 100,000 years ago, and since that time as many as 400 species of aparticular group of fish called cichlids have evolved there from one or a very few ancestral species. Someresearchers suggest that the majority of them evolved even more recently because the lake was muchreduced or possibly even dry during a period of glaciation that ended around 15,000 years ago. Thecichlid populations are still evolving, responding to changes in the environment. Once speciation hasalready occurred, it is usually easy to recognize the separate species, but how do scientists recognizewhether a population is evolving?
Background
Hardy-Weinberg Equilibrium
In the early 1900s, many biologists attempted to explain evolution in terms of the emerging science ofgenetics. In Mendelian genetics, because the F2 generation of a monohybrid cross shows a 3:1 ratio ofdominant to recessive phenotypes, many assumed that populations would evolve toward similar ratiosof phenotypes. Two mathematicians, Godfrey Hardy and Wilhelm Weinberg, realized that the frequencyof alleles in a population was independent of the alleles’ inheritance pattern from individual parents tooffspring. They postulated an ideal breeding population with the following properties:
1. The population size is infinite, or very large.
2. Mating within the population is random. This means that there is no mating preference for any specificphenotype over another.
3. There is no mutation occurring in the population.
4. There is no exchange of genetic information with other populations—no immigration or emigration ofindividuals.
5. There is no selection for one phenotype over another. All phenotypes have an equal chance of survivaland of having their genes passed on to future generations.
If these conditions are met, the population’s allele and genotype frequencies will remain statisticallyconstant over time, a condition referred to as Hardy-Weinberg equilibrium. If we determine the frequencyof a pair of alleles in a population, we can sample that population over several generations to determineif the frequency changes. If it does, we know that the population is evolving with respect to that pair ofalleles. Several mechanisms are known to disrupt the Hardy-Weinberg equilibrium in a population:
Genetic Drift
Genetic drift occurs when the allele frequencies in a population change between generations due to apopulation’s finite size. For example, a bottleneck effect results when an environmental change greatlyreduces the size of a population. Another type of genetic drift, the founder effect, occurs when a smallportion of a population becomes isolated. In these cases the allele frequencies in the smaller populationmay be quite different from those across the original, large population.
©2011 Carolina Biological Supply Company/Printed in USA. S-2
Gene Flow
Allele frequencies change when genes move into a population through immigration of individuals or outof it, by emigration.
Mutation
Mutation is a change in DNA, which alters alleles directly. Varieties of mutation include point mutations, inwhich one nucleotide base pair changes, deletion mutations, in which base pairs are lost, insertion mutationsin which base pairs are added, and frameshift mutations, in which a number of nucleotides inserted ordeleted is not a multiple of three (throwing off the translation of the rest of the gene into a protein).
Mating Selection
If mating is not random, some allele combinations may produce individuals who are preferred as mates.These individuals tend to breed more and thus produce more offspring, increasing the frequency of thosealleles in the population.
Natural Selection
Certain alleles code for traits that are more favorable for long-term survival, or, at least for greaterreproductive success. Others code for traits that are less favorable. Natural selection increases thefrequency of the beneficial alleles and decreases the frequency of the detrimental ones bydisproportionately removing maladapted phenotypes from the population.
Wisconsin Fast Plants
In Wisconsin Fast Plants, there are two possible stem colors, purple and non-purple (green). The purple color isdue to the pigment anthocyanin. In these plants, the gene coding for anthocyanin is dominant (ANL). Thus,both homozygous genotypes (ANL/ANL) and heterozygous genotypes (ANL/anl) express the purple stemphenotype, though the amount of anthocyanin may vary. Plants that show a green stem phenotype arehomozygous for the recessive form of the anthocyanin gene (anl) and do not produce the pigment.
Two variations in leaf color are also observed in Fast Plants, yellow-green and green. In these plants, the genecoding for the yellow-green color is recessive (ygr). Only those plants that are homozygous for this trait (ygr/ygr)show the yellow-green leaf phenotype. These plants show less chlorophyll production and slower development.Plants that are heterozygous (YGR/ygr) or homozygous dominant (YGR/YGR) express a green leaf phenotype.
Pre-laboratory Questions
1. In a mythical species of dragons, a blue skin color (B) is dominant to a yellow skin color (b). If twoheterozygous blue dragons were bred together and produced 160 offspring, how many offspring wouldyou expect of each color? How many of each genotype?
2. If the dragons’ babies were examined by a population ecologist, would there be any way for the ecologistto tell the difference between the heterozygous blue babies and the homozygous blue babies withoutmating them? Explain.
3. Why might it be important to know allele frequencies in a population?
Population Genetics and Evolution Kit for AP Biology Student Guide
©2011 Carolina Biological Supply Company/Printed in USA. S-3
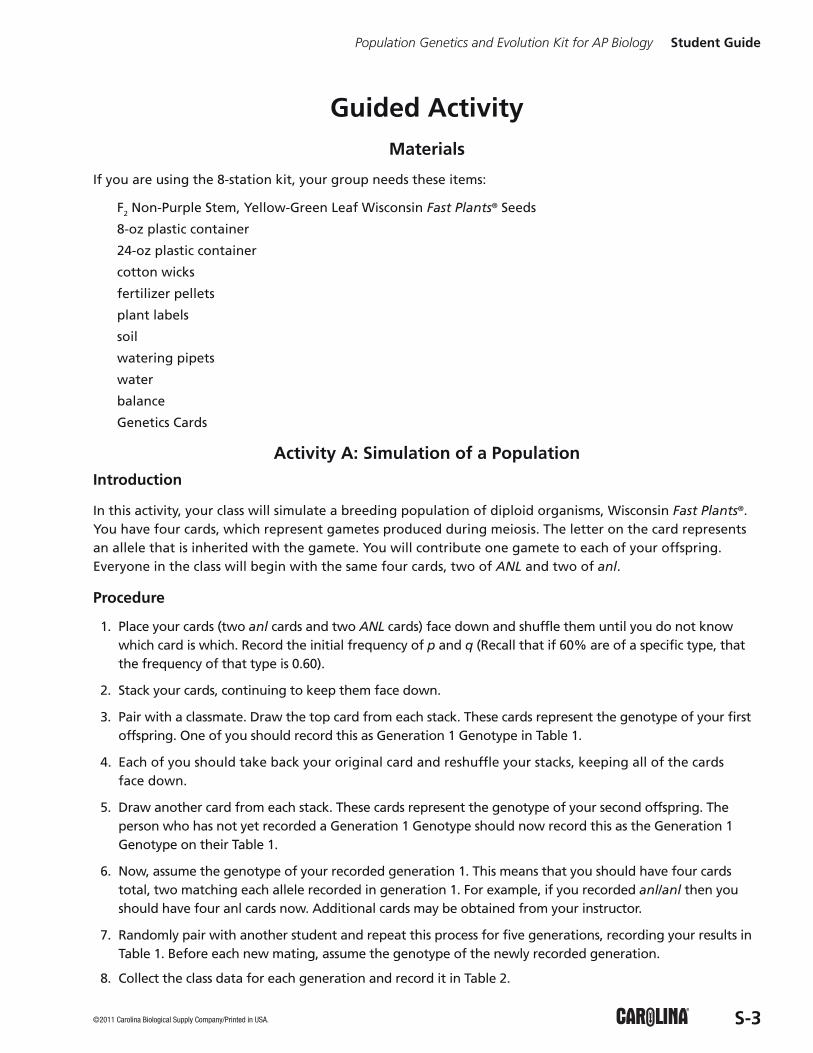
Guided ActivityMaterials
If you are using the 8-station kit, your group needs these items:
F2 Non-Purple Stem, Yellow-Green Leaf Wisconsin Fast Plants® Seeds
8-oz plastic container
24-oz plastic container
cotton wicks
fertilizer pellets
plant labels
soil
watering pipets
water
balance
Genetics Cards
Activity A: Simulation of a Population
Introduction
In this activity, your class will simulate a breeding population of diploid organisms, Wisconsin Fast Plants®.You have four cards, which represent gametes produced during meiosis. The letter on the card representsan allele that is inherited with the gamete. You will contribute one gamete to each of your offspring.Everyone in the class will begin with the same four cards, two of ANL and two of anl.
Procedure
1. Place your cards (two anl cards and two ANL cards) face down and shuffle them until you do not knowwhich card is which. Record the initial frequency of p and q (Recall that if 60% are of a specific type, thatthe frequency of that type is 0.60).
2. Stack your cards, continuing to keep them face down.
3. Pair with a classmate. Draw the top card from each stack. These cards represent the genotype of your firstoffspring. One of you should record this as Generation 1 Genotype in Table 1.
4. Each of you should take back your original card and reshuffle your stacks, keeping all of the cards face down.
5. Draw another card from each stack. These cards represent the genotype of your second offspring. Theperson who has not yet recorded a Generation 1 Genotype should now record this as the Generation 1Genotype on their Table 1.
6. Now, assume the genotype of your recorded generation 1. This means that you should have four cardstotal, two matching each allele recorded in generation 1. For example, if you recorded anl/anl then youshould have four anl cards now. Additional cards may be obtained from your instructor.
7. Randomly pair with another student and repeat this process for five generations, recording your results inTable 1. Before each new mating, assume the genotype of the newly recorded generation.
8. Collect the class data for each generation and record it in Table 2.
Population Genetics and Evolution Kit for AP Biology Student Guide
©2011 Carolina Biological Supply Company/Printed in USA. S-4
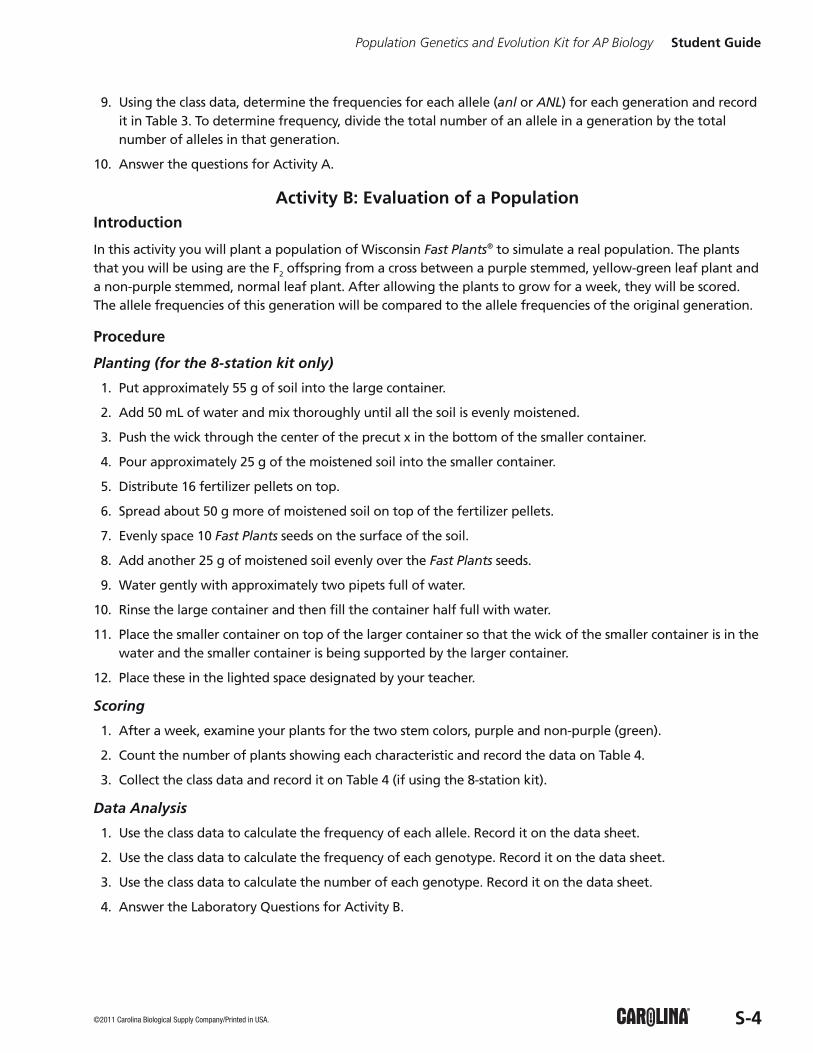
9. Using the class data, determine the frequencies for each allele (anl or ANL) for each generation and recordit in Table 3. To determine frequency, divide the total number of an allele in a generation by the totalnumber of alleles in that generation.
10. Answer the questions for Activity A.
Activity B: Evaluation of a PopulationIntroduction
In this activity you will plant a population of Wisconsin Fast Plants® to simulate a real population. The plantsthat you will be using are the F2 offspring from a cross between a purple stemmed, yellow-green leaf plant anda non-purple stemmed, normal leaf plant. After allowing the plants to grow for a week, they will be scored.The allele frequencies of this generation will be compared to the allele frequencies of the original generation.
Procedure
Planting (for the 8-station kit only)
1. Put approximately 55 g of soil into the large container.
2. Add 50 mL of water and mix thoroughly until all the soil is evenly moistened.
3. Push the wick through the center of the precut x in the bottom of the smaller container.
4. Pour approximately 25 g of the moistened soil into the smaller container.
5. Distribute 16 fertilizer pellets on top.
6. Spread about 50 g more of moistened soil on top of the fertilizer pellets.
7. Evenly space 10 Fast Plants seeds on the surface of the soil.
8. Add another 25 g of moistened soil evenly over the Fast Plants seeds.
9. Water gently with approximately two pipets full of water.
10. Rinse the large container and then fill the container half full with water.
11. Place the smaller container on top of the larger container so that the wick of the smaller container is in thewater and the smaller container is being supported by the larger container.
12. Place these in the lighted space designated by your teacher.
Scoring
1. After a week, examine your plants for the two stem colors, purple and non-purple (green).
2. Count the number of plants showing each characteristic and record the data on Table 4.
3. Collect the class data and record it on Table 4 (if using the 8-station kit).
Data Analysis
1. Use the class data to calculate the frequency of each allele. Record it on the data sheet.
2. Use the class data to calculate the frequency of each genotype. Record it on the data sheet.
3. Use the class data to calculate the number of each genotype. Record it on the data sheet.
4. Answer the Laboratory Questions for Activity B.
Population Genetics and Evolution Kit for AP Biology Student Guide
©2011 Carolina Biological Supply Company/Printed in USA. S-5
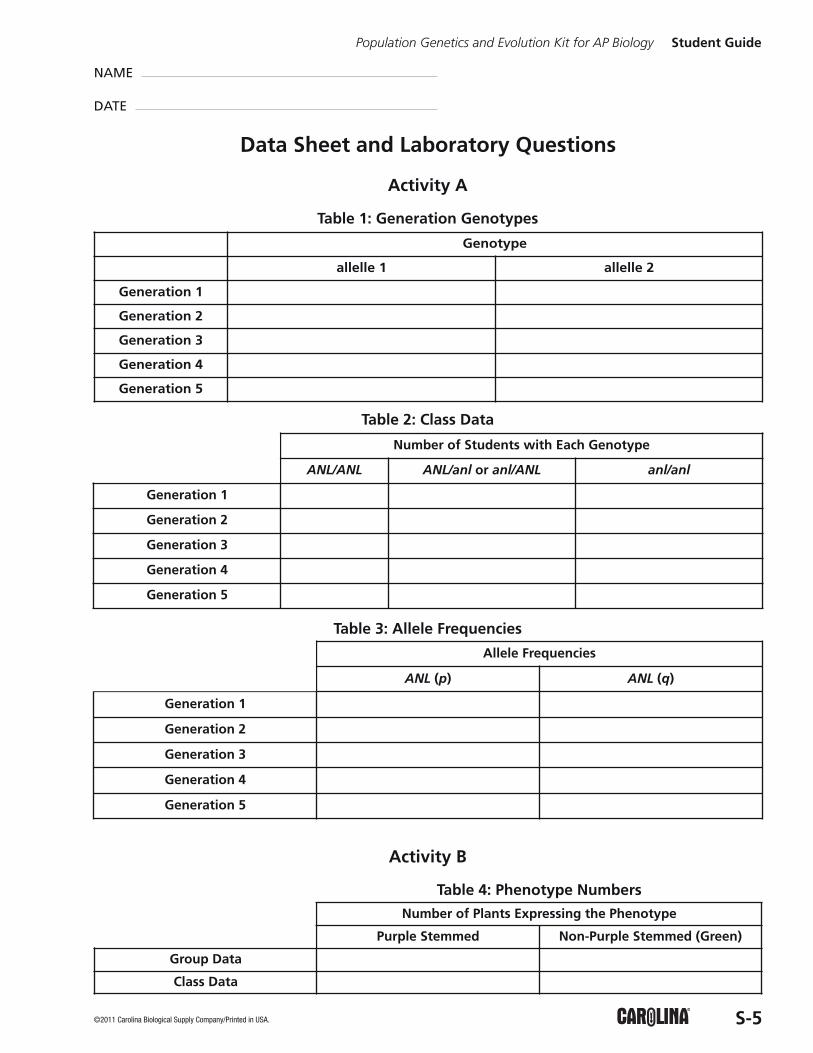
Activity A
Table 1: Generation Genotypes
Table 2: Class Data
Table 3: Allele Frequencies
Activity B
Table 4: Phenotype Numbers
Population Genetics and Evolution Kit for AP Biology Student Guide
NAME
DATE
Data Sheet and Laboratory Questions
Genotype
allelle 1 allelle 2
Generation 1
Generation 2
Generation 3
Generation 4
Generation 5
Number of Students with Each Genotype
ANL/ANL ANL/anl or anl/ANL anl/anl
Generation 1
Generation 2
Generation 3
Generation 4
Generation 5
Allele Frequencies
ANL (p) ANL (q)
Generation 1
Generation 2
Generation 3
Generation 4
Generation 5
Number of Plants Expressing the Phenotype
Purple Stemmed Non-Purple Stemmed (Green)
Group Data
Class Data
©2011 Carolina Biological Supply Company/Printed in USA. S-6
Population Genetics and Evolution Kit for AP Biology Student Guide
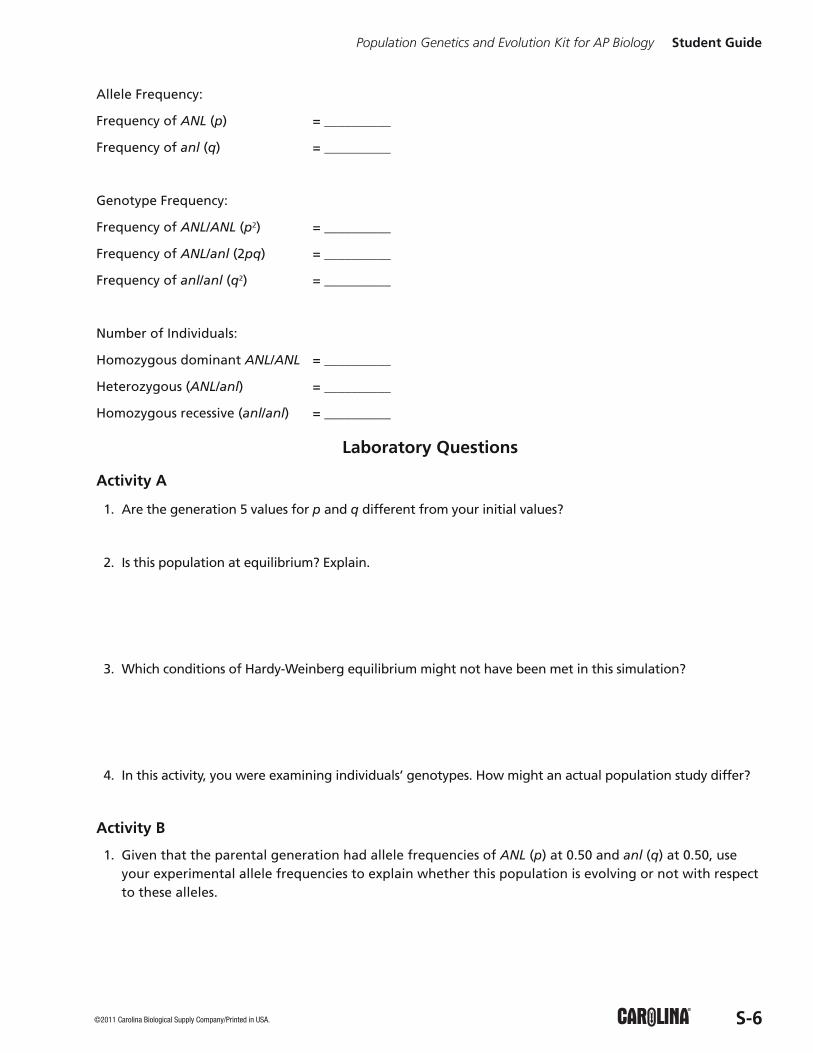
Allele Frequency:
Frequency of ANL (p) = __________
Frequency of anl (q) = __________
Genotype Frequency:
Frequency of ANL/ANL (p2) = __________
Frequency of ANL/anl (2pq) = __________
Frequency of anl/anl (q2) = __________
Number of Individuals:
Homozygous dominant ANL/ANL = __________
Heterozygous (ANL/anl) = __________
Homozygous recessive (anl/anl) = __________
Laboratory Questions
Activity A
1. Are the generation 5 values for p and q different from your initial values?
2. Is this population at equilibrium? Explain.
3. Which conditions of Hardy-Weinberg equilibrium might not have been met in this simulation?
4. In this activity, you were examining individuals’ genotypes. How might an actual population study differ?
Activity B
1. Given that the parental generation had allele frequencies of ANL (p) at 0.50 and anl (q) at 0.50, useyour experimental allele frequencies to explain whether this population is evolving or not with respectto these alleles.
©2011 Carolina Biological Supply Company/Printed in USA. S-7
2. Imagine that a population of herbivorous animals who dislike the taste of anthocyanin is introduced intothe environment of the Fast Plants. How would this affect the allele frequencies in the Fast Plantspopulation? Over time, what do you think would happen?
3. Explain what you would expect to see in allele frequencies if a population were evolving.
4. Consider your activity with Fast Plants. Explain why natural selection acts on phenotypes rather thanon genotypes?
5. Imagine that you are a member of a committee assigned to evaluate a report of neurofibromatosis, adisorder inherited through a dominant allele. Neurofibromatosis is a condition in which noncanceroustumors grow along nerves. The report concludes that because three-quarters of the offspring of parentswho are heterozygous for neurofibromatosis will have the disorder, eventually, 75% of the population willhave neurofibromatosis. Do you agree or disagree with the report’s conclusion? Explain your reasoning.
Population Genetics and Evolution Kit for AP Biology Student Guide
©2011 Carolina Biological Supply Company/Printed in USA. S-8
Inquiry ActivityIn the previous activities you examined a simulated population as well as an actual population of WisconsinFast Plants®. Based on the activities that you just completed, develop a question that tests the conditions ofHardy-Weinberg equilibrium or an evolutionary process. When developing an experimental question,consider the materials and equipment available to you. Consult your instructor for the availability ofadditional supplies.
Materials
F2 Non-Purple Stem, Yellow-Green Leaf Wisconsin Fast Plants® plant stakes
Purple Stem, Hairy Wisconsin Fast Plants® dried bees
Non-Purple Stem, Yellow-Green Leaf Wisconsin Fast Plants® plant labels
8-oz plastic container soil
24-oz plastic container watering pipets
cotton wicks Genetics Cards
fertilizer pellets
Other materials may be available. Consult your teacher.
Procedure
1. As a group, collaborate to come up with a question about the conditions of Hardy-Weinberg equilibriumor any evolutionary process that may be tested. If you have trouble, ask your teacher for guidance.
2. Design an experiment to test your question. Consider the following as you frame your experiment:
• Question - What are you testing in your experiment? What are you trying to find out?
• Hypothesis - What do you think will happen? Why do you think so? What do you already know thathelps support your hypothesis?
• Materials - What materials, tools, or instruments are you going to use to find the answer to the question?
• Procedure - What are you going to do? How are you going to do it? What are you measuring? How canyou make sure the data you collect are accurate? What are the independent and dependent variables inthis experiment? What is/are your control(s)? What safety practices do you need to use?
• Data Collection - What data will you record, and how will you collect and present it? Show and explainany data tables and graphs that you plan to use.
3. Have your teacher approve the experimental procedure before you begin the exercise.
4. After you perform the experiment, analyze your data:
• Data Analysis - What happened? Did you observe anything that surprised you? Show and explain anytables and graphs that support your data.
• Conclusion - What conclusions can you draw from the results of your experiment? How does thiscompare with your initial hypothesis? Identify some possible sources of error in your experiment. Ifgiven the opportunity, how might you conduct the experiment differently?
5. Be prepared to present the findings of your experiment to the class according to your instructor’sspecification.
Population Genetics and Evolution Kit for AP Biology Student Guide
©2011 Carolina Biological Supply Company/Printed in USA. S-9
Population Genetics and Evolution Kit for AP Biology Student Guide
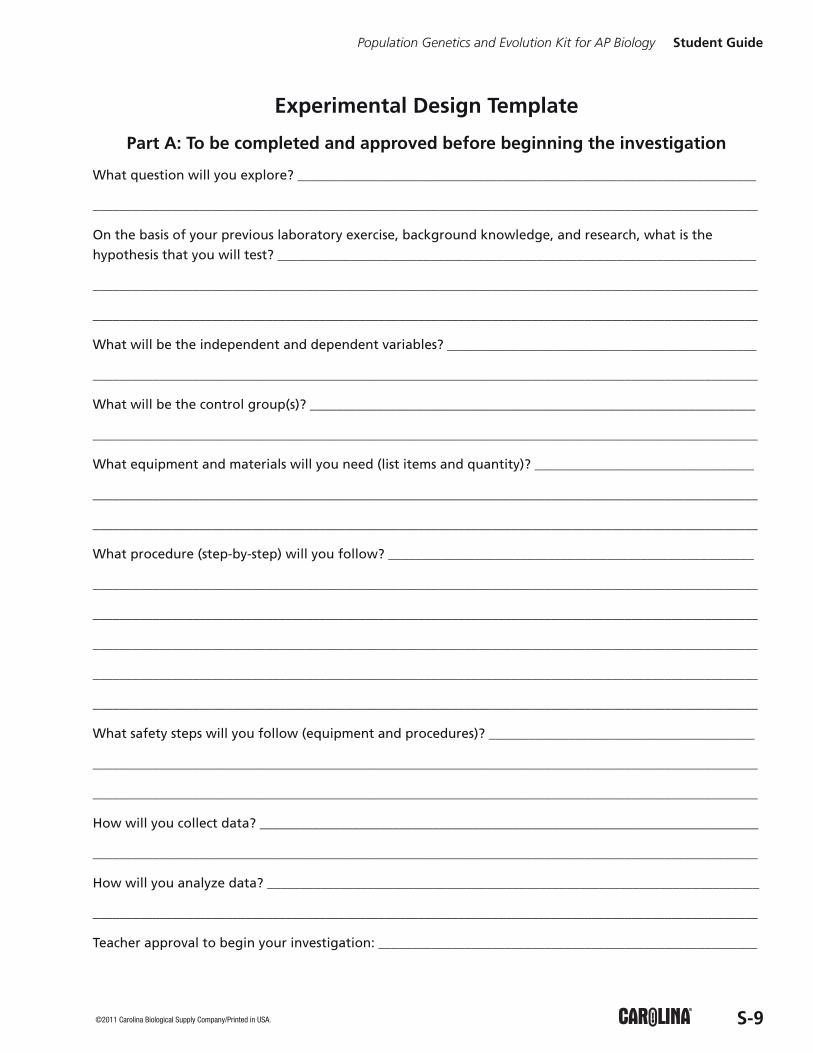
Experimental Design Template
Part A: To be completed and approved before beginning the investigation
What question will you explore? _____________________________________________________________________
____________________________________________________________________________________________________
On the basis of your previous laboratory exercise, background knowledge, and research, what is the
hypothesis that you will test? ________________________________________________________________________
____________________________________________________________________________________________________
____________________________________________________________________________________________________
What will be the independent and dependent variables? _______________________________________________
____________________________________________________________________________________________________
What will be the control group(s)? ___________________________________________________________________
____________________________________________________________________________________________________
What equipment and materials will you need (list items and quantity)? _________________________________
____________________________________________________________________________________________________
____________________________________________________________________________________________________
What procedure (step-by-step) will you follow? _______________________________________________________
____________________________________________________________________________________________________
____________________________________________________________________________________________________
____________________________________________________________________________________________________
____________________________________________________________________________________________________
____________________________________________________________________________________________________
What safety steps will you follow (equipment and procedures)? ________________________________________
____________________________________________________________________________________________________
____________________________________________________________________________________________________
How will you collect data? ___________________________________________________________________________
____________________________________________________________________________________________________
How will you analyze data? __________________________________________________________________________
____________________________________________________________________________________________________
Teacher approval to begin your investigation: _________________________________________________________
©2011 Carolina Biological Supply Company/Printed in USA. S-10
Population Genetics and Evolution Kit for AP Biology Student Guide
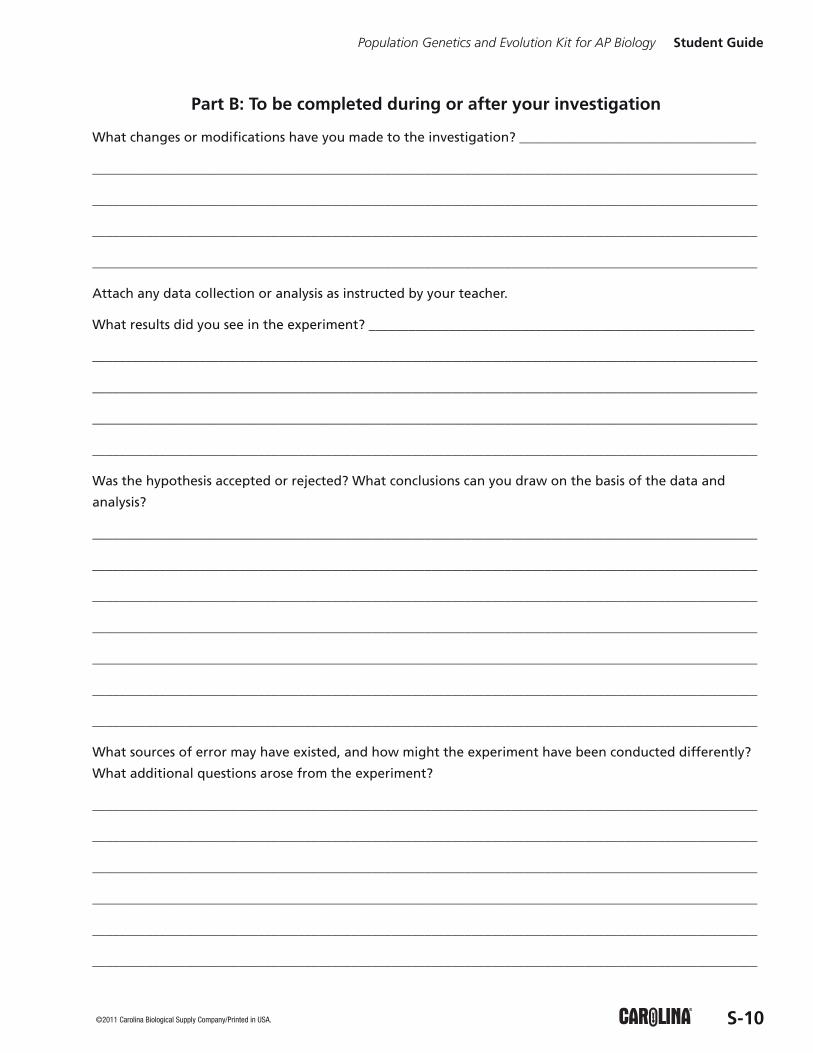
Part B: To be completed during or after your investigation
What changes or modifications have you made to the investigation? ____________________________________
____________________________________________________________________________________________________
____________________________________________________________________________________________________
____________________________________________________________________________________________________
____________________________________________________________________________________________________
Attach any data collection or analysis as instructed by your teacher.
What results did you see in the experiment? __________________________________________________________
____________________________________________________________________________________________________
____________________________________________________________________________________________________
____________________________________________________________________________________________________
____________________________________________________________________________________________________
Was the hypothesis accepted or rejected? What conclusions can you draw on the basis of the data and
analysis?
____________________________________________________________________________________________________
____________________________________________________________________________________________________
____________________________________________________________________________________________________
____________________________________________________________________________________________________
____________________________________________________________________________________________________
____________________________________________________________________________________________________
____________________________________________________________________________________________________
What sources of error may have existed, and how might the experiment have been conducted differently?
What additional questions arose from the experiment?
____________________________________________________________________________________________________
____________________________________________________________________________________________________
____________________________________________________________________________________________________
____________________________________________________________________________________________________
____________________________________________________________________________________________________
____________________________________________________________________________________________________
©2011 Carolina Biological Supply Company/Printed in USA. S-11
Population Genetics and Evolution Kit for AP Biology Student Guide
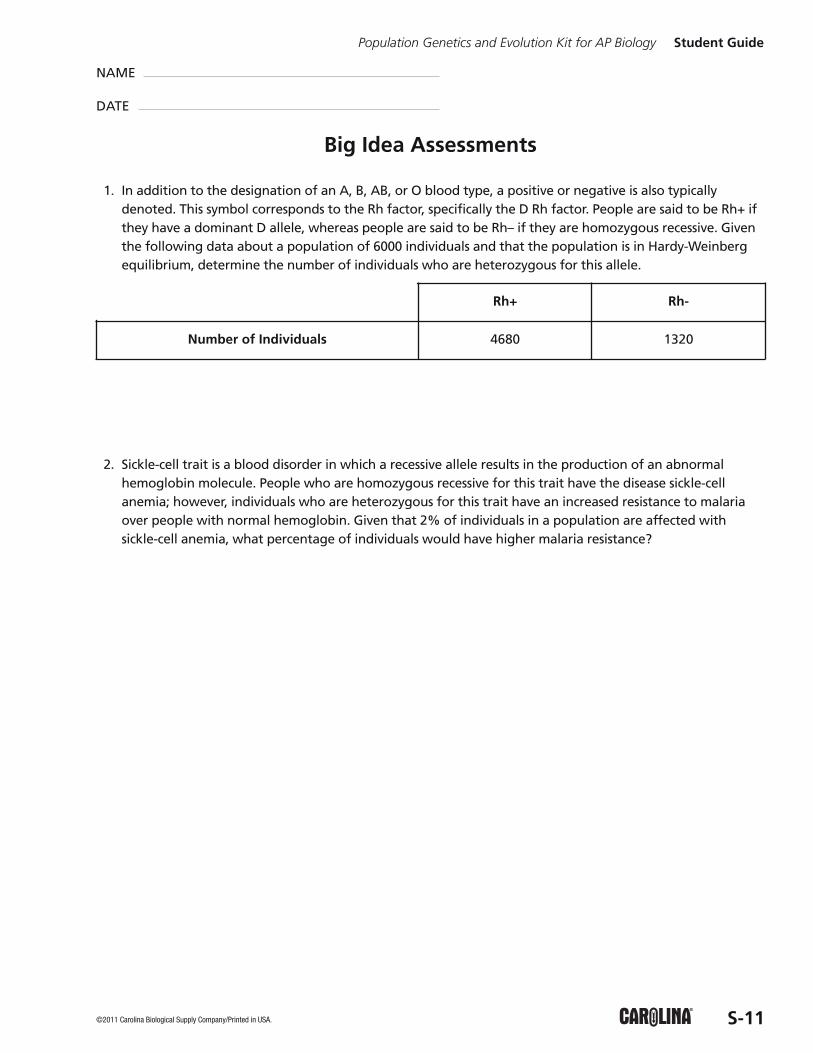
1. In addition to the designation of an A, B, AB, or O blood type, a positive or negative is also typicallydenoted. This symbol corresponds to the Rh factor, specifically the D Rh factor. People are said to be Rh+ ifthey have a dominant D allele, whereas people are said to be Rh– if they are homozygous recessive. Giventhe following data about a population of 6000 individuals and that the population is in Hardy-Weinbergequilibrium, determine the number of individuals who are heterozygous for this allele.
2. Sickle-cell trait is a blood disorder in which a recessive allele results in the production of an abnormalhemoglobin molecule. People who are homozygous recessive for this trait have the disease sickle-cellanemia; however, individuals who are heterozygous for this trait have an increased resistance to malariaover people with normal hemoglobin. Given that 2% of individuals in a population are affected withsickle-cell anemia, what percentage of individuals would have higher malaria resistance?
NAME
DATE
Big Idea Assessments
Rh+ Rh-
Number of Individuals 4680 1320
©2011 Carolina Biological Supply Company/Printed in USA. S-12
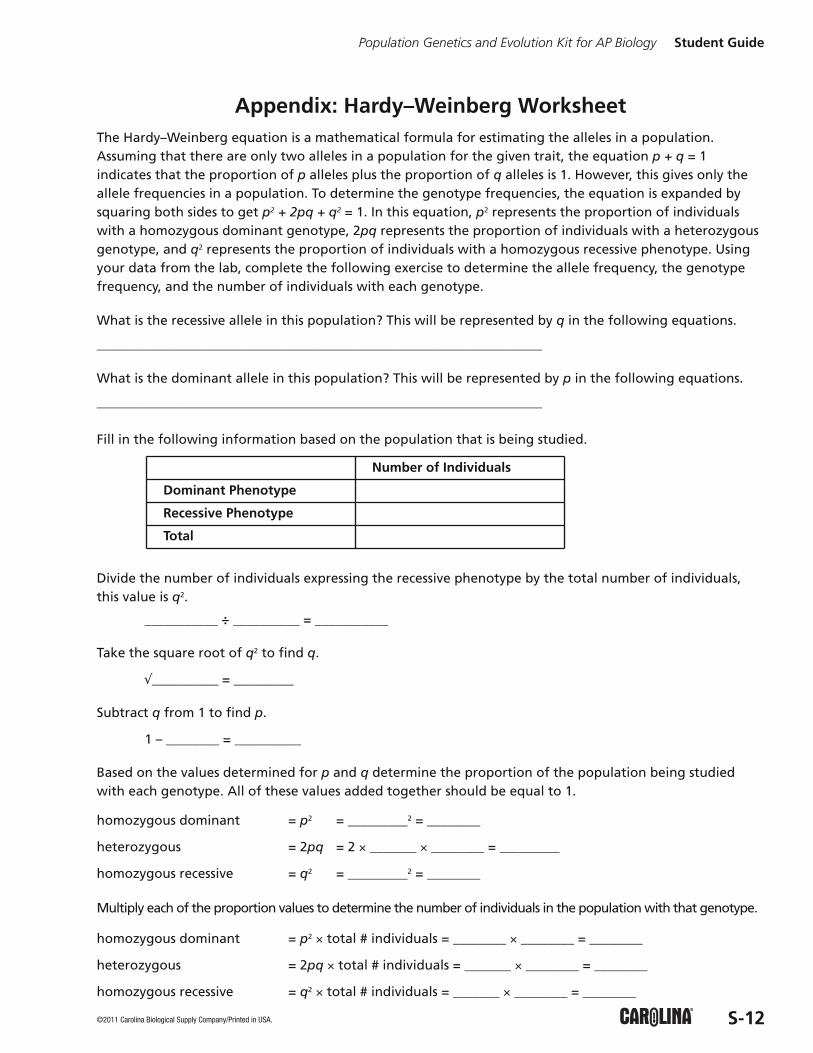
Appendix: Hardy–Weinberg WorksheetThe Hardy–Weinberg equation is a mathematical formula for estimating the alleles in a population.Assuming that there are only two alleles in a population for the given trait, the equation p + q = 1indicates that the proportion of p alleles plus the proportion of q alleles is 1. However, this gives only theallele frequencies in a population. To determine the genotype frequencies, the equation is expanded bysquaring both sides to get p2 + 2pq + q2 = 1. In this equation, p2 represents the proportion of individualswith a homozygous dominant genotype, 2pq represents the proportion of individuals with a heterozygousgenotype, and q2 represents the proportion of individuals with a homozygous recessive phenotype. Usingyour data from the lab, complete the following exercise to determine the allele frequency, the genotypefrequency, and the number of individuals with each genotype.
What is the recessive allele in this population? This will be represented by q in the following equations.
___________________________________________________________________
What is the dominant allele in this population? This will be represented by p in the following equations.
___________________________________________________________________
Fill in the following information based on the population that is being studied.
Divide the number of individuals expressing the recessive phenotype by the total number of individuals,this value is q2.
___________ ÷ __________ = ___________
Take the square root of q2 to find q.
√__________ = _________
Subtract q from 1 to find p.
1 – ________ = __________
Based on the values determined for p and q determine the proportion of the population being studiedwith each genotype. All of these values added together should be equal to 1.
homozygous dominant = p2 = _________2 = ________
heterozygous = 2pq = 2 × _______ × ________ = _________
homozygous recessive = q2 = _________2 = ________
Multiply each of the proportion values to determine the number of individuals in the population with that genotype.
homozygous dominant = p2 × total # individuals = ________ × ________ = ________
heterozygous = 2pq × total # individuals = _______ × ________ = ________
homozygous recessive = q2 × total # individuals = _______ × ________ = ________
Population Genetics and Evolution Kit for AP Biology Student Guide
Number of Individuals
Dominant Phenotype
Recessive Phenotype
Total